1. Introduction
Cosmic rays (CRs) are a powerful tool for the investigation of exotic physics/astrophysics: The compositions of high-energy CRs provide information on the mysterious galactic PeVatrons and the small anti-matter components in CRs could identify the annihilation of dark matter in our galaxy.
In addition, the structure of the magnetic fields in the galactic halo and the properties of the Inter-Stellar Medium can also be probed with detailed CR flux measurements. In particular, the ratio of secondary CRs (such as Li, Be, or B) with respect to the primary CRs (such as He, C, and O) is able to provide the “grammage”, that is, the amount of material crossed by CRs in their journey through the galaxy.
There are two parameters of CR propagation models: The galactic halo (half-) thickness,
H, and the diffusion coefficient,
D, are loosely constrained by such a grammage measurement; in particular, a large degeneracy exists, as only
is well measured [
1].
The uncertainties of the
D and
H parameters (the latter is known to be in the range of 3–8 kpc) also reflects on the accuracy of the determination of secondary anti-proton and positron fluxes, which are the background for the searches for dark matter or exotic (astro-)physics [
2,
3,
4,
5].
The abundances of long-living unstable isotopes in CRs can be used as radioactive clocks that provide measurements of the residence time of CRs in the galaxy. This time information is complementary to the crossed grammage; thus, the abundance of radioactive isotopes in CRs is an important tool for solving the existing degeneracy in CR propagation models.
Beryllium Isotopic Measurements in Cosmic Rays
Only few elements in cosmic rays (Be, Al, Cl, Mg, and Fe) contain long-living radioactive isotopes; among them, beryllium is the lightest, i.e., the most promising for the measurement of isotopic composition in the relativistic kinetic energy range. Three beryllium isotopes are found in cosmic rays:
Be: Stable as a bare nucleus in CRs. On Earth, it decays through electron capture (T = 53 days).
Be: Stable.
Be -radioactive nucleus (T = 1.39 years).
The missing Be has a central role in the stellar and Big-Bang nucleosynthesis; its extremely short half-life (8.19 × 10 s) represents a bottleneck for an efficient synthesis of heavier nuclei in the universe. From the point of view of measurement, this “isotopic hole” in the mass spectrum of beryllium is very useful in determining large amounts of Be and in reducing the contamination in the identification of Be and Be.
The identification of beryllium isotopes in magnetic spectrometers requires the simultaneous measurement of particle rigidity, , and velocity, . This allows the reconstruction of the particle mass, .
The typical mass resolution of magnetic spectrometers onboard past or current CR experiments ( amu) does not allow for the event-by-event identification of isotopes; therefore, the “traditional” approach to the measurement of the isotopic abundances of beryllium relies on the comparison of the experimental mass distribution with a Monte Carlo simulation.
This approach requires a very-well-tuned Monte Carlo simulation of the experiment, and the possible small residual discrepancies with the real detector’s response could prevent the measurement of the (interesting) small amounts of Be.
This issue is well described in [
6], where the ”Monte-Carlo-based” analysis of beryllium events collected by the PAMELA experiment allowed only the measurement of
Be/(
Be+
Be).
In the following, a data-driven approach to the measurement of the isotopic abundances of beryllium with magnetic spectrometers is described; this can allow one to avoid the issues related to Monte Carlo simulations. In particular, as an example, the application of this new approach to the beryllium event counts from PAMELA (gathered from Figures 3 and 4 of [
6]) is shown, and a preliminary measurement of
Be/
Be in the 0.2–0.85 GeV/n range is provided.
2. Data-Driven Analysis
With knowledge of the true values of beryllium isotopes’ masses and a physically motivated scaling of the mass resolution for the three beryllium isotopes, the shapes of the isotope mass distributions can be self-consistently retrieved solely from the measured data.
In particular, the expected mass resolution for a magnetic spectrometer is:
Typically, the isotopic measurement is pursued in kinetic energy/nucleon bins (i.e., in bins); therefore, the contribution of the velocity to the mass resolution is constant for the different isotopes.
Moreover, in the (low) kinetic energy range that accessible with current isotopic measurements, the rigidity resolution is dominated by multiple Coulomb scattering, i.e., is practically constant for the different isotopes.
Finally, the masses of the three Be isotopes are within 30%; therefore, for a fixed value, the rigidity values for different Be isotopes are within 30%; for this reason, with a very good approximation, is constant, and we can assume that RMS(M)/<M> is the same for the three unknown mass distributions (hereafter also called templates).
2.1. Template Transformations
We can define , , and as the unknown normalized templates for Be, Be, and Be, respectively, and Be/Be as their unknown isotope abundance fractions.
A template
can transform into the template
by applying the operator
, and we can assume that
just transforms the coordinates
; therefore, to ensure template normalization:
In principle, an infinite set of functions are able to perform a transformation among two specific templates; however, we are typically interested in monotonic functions that quantiles by avoiding template folding. A very simple set of transformations are the linear ones defined by translation and scale transformations: .
transforms a normal distribution into a normal distribution.
Defining as the RMS of template and as the median of template , the linear transformation is the function .
The same transformation applied to a different template provides: and .
The linear transformation that satisfies the assumption ( constant) is simply , that is, a pure scaling depending only on known beryllium isotope mass ratios and not on the unknown mass resolution or template shapes.
2.2. Data-Driven Template Evaluation and Fit
Defining the known (measured) data distribution
and assuming the three
as fixed, the following system can be considered:
Therefore, the
Be template can be written as:
where the last four terms—ghost—templates, are defined by:
Under the linear approximation, the median of ghost templates can be evaluated:
Profiting from the fact that the ghost templates are placed beyond
and that we know that
, the contribution of ghost templates in Equation (
4) is small, and
can be iteratively evaluated with the measured data by using Equation (
5) and the linear approximation.
Once is obtained, the other templates are also straightforwardly obtained by using and , and a value for the fixed , , and configuration is obtained through a comparison with . The best-fit value of , , and is obtained by minimizing the on the allowed configuration space ().
This data-driven approach was tested on Monte-Carlo-simulated events, and it is able to correctly retrieve the injected isotopic ratios within statistical fluctuations. In the following, the example of the application to the beryllium events published by the PAMELA experiment [
6] is shown.
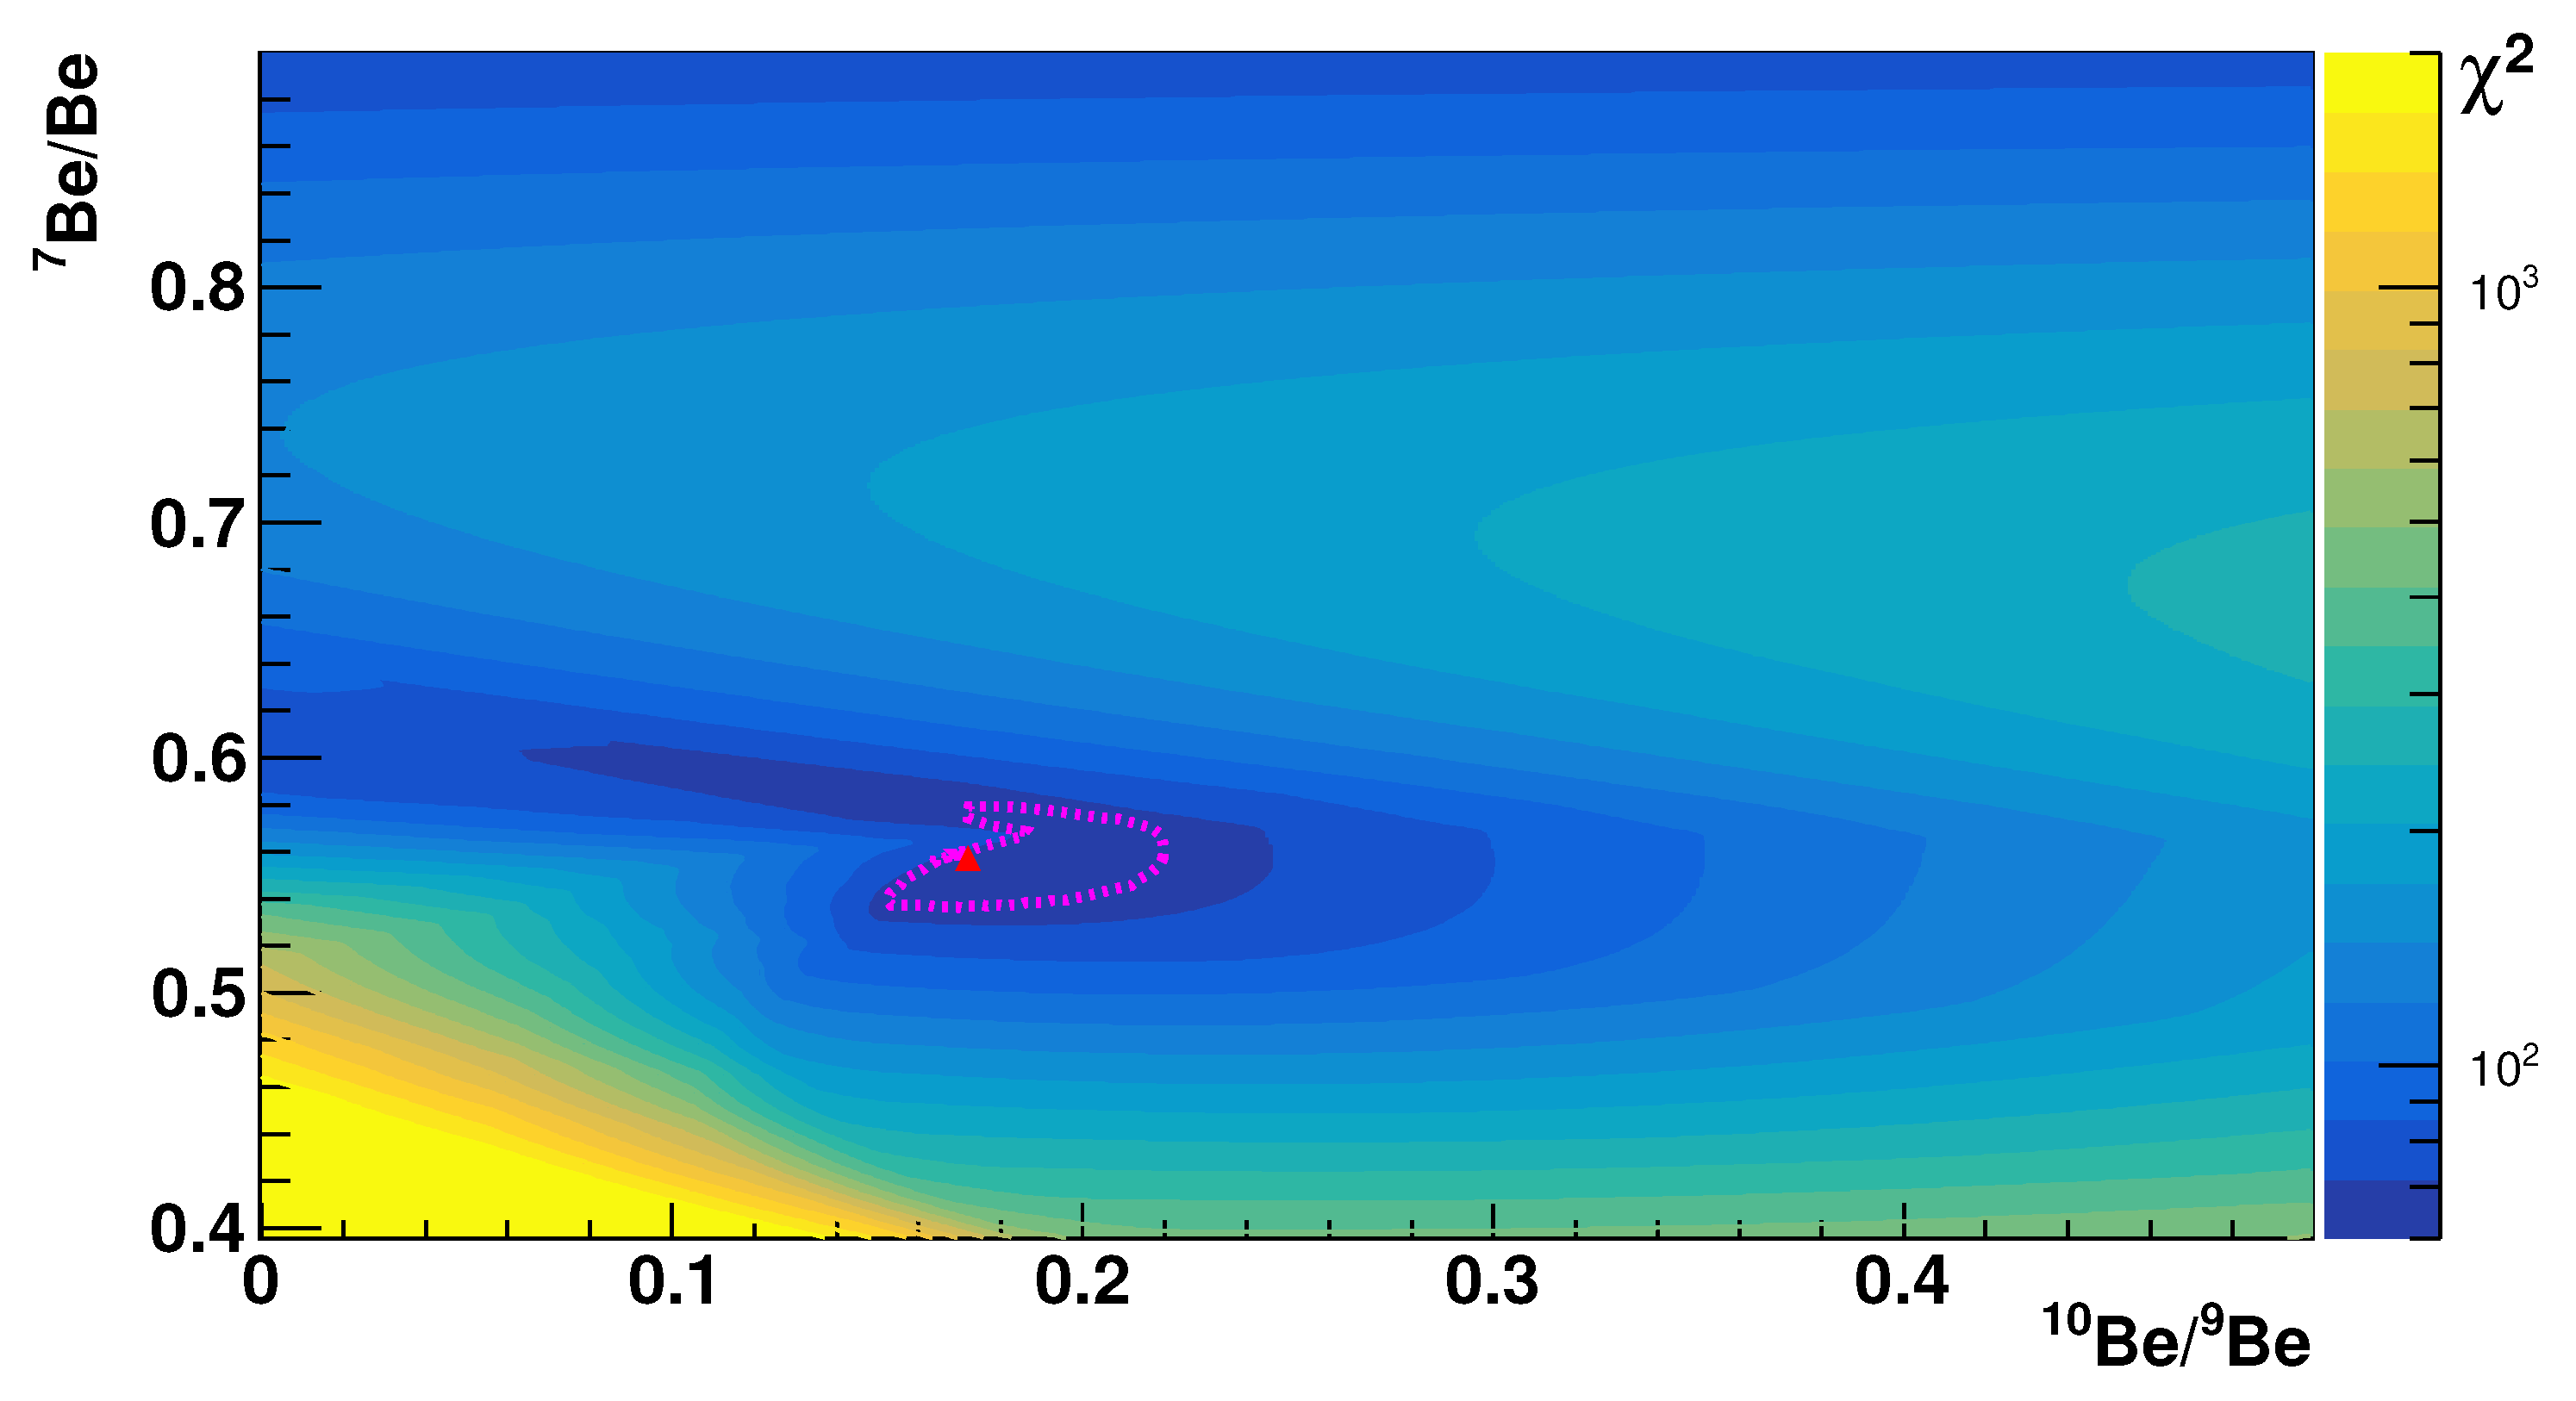
In
Figure 1, a
map for the
vs.
parameter space is shown for the example of the PAMELA–ToF events in the 0.65–0.85 GeV/n range (the last bin of our analysis). The best fit is marked by a red triangle, and the 68% confidence interval is surrounded by a red contour.
It is important to note that the three naive solutions of the data-driven analysis are obviously
,
, and
, and these obvious solutions are characterized by
. When statistics are scarce, the bias induced by these naive solutions has a non-negligible impact on the physical best-fit position and on the evaluation of the correct confidence interval. To remove this bias, a bootstrap method was used, i.e., we simulated 100 pseudo-experiments in which we randomly extracted the data distribution
from the measured value according to the known Poisson statistics. Therefore, the templates coming from the data-driven analysis were used to extract the
map from each pseudo-experiment, and
Figure 1 shows the unbiased
map obtained with the average of the
maps of the 100 pseudo-experiments. In this way, the unbiased
obtained with the three naive solutions is non-zero and is similar to the one obtained with the unbiased physical solution.
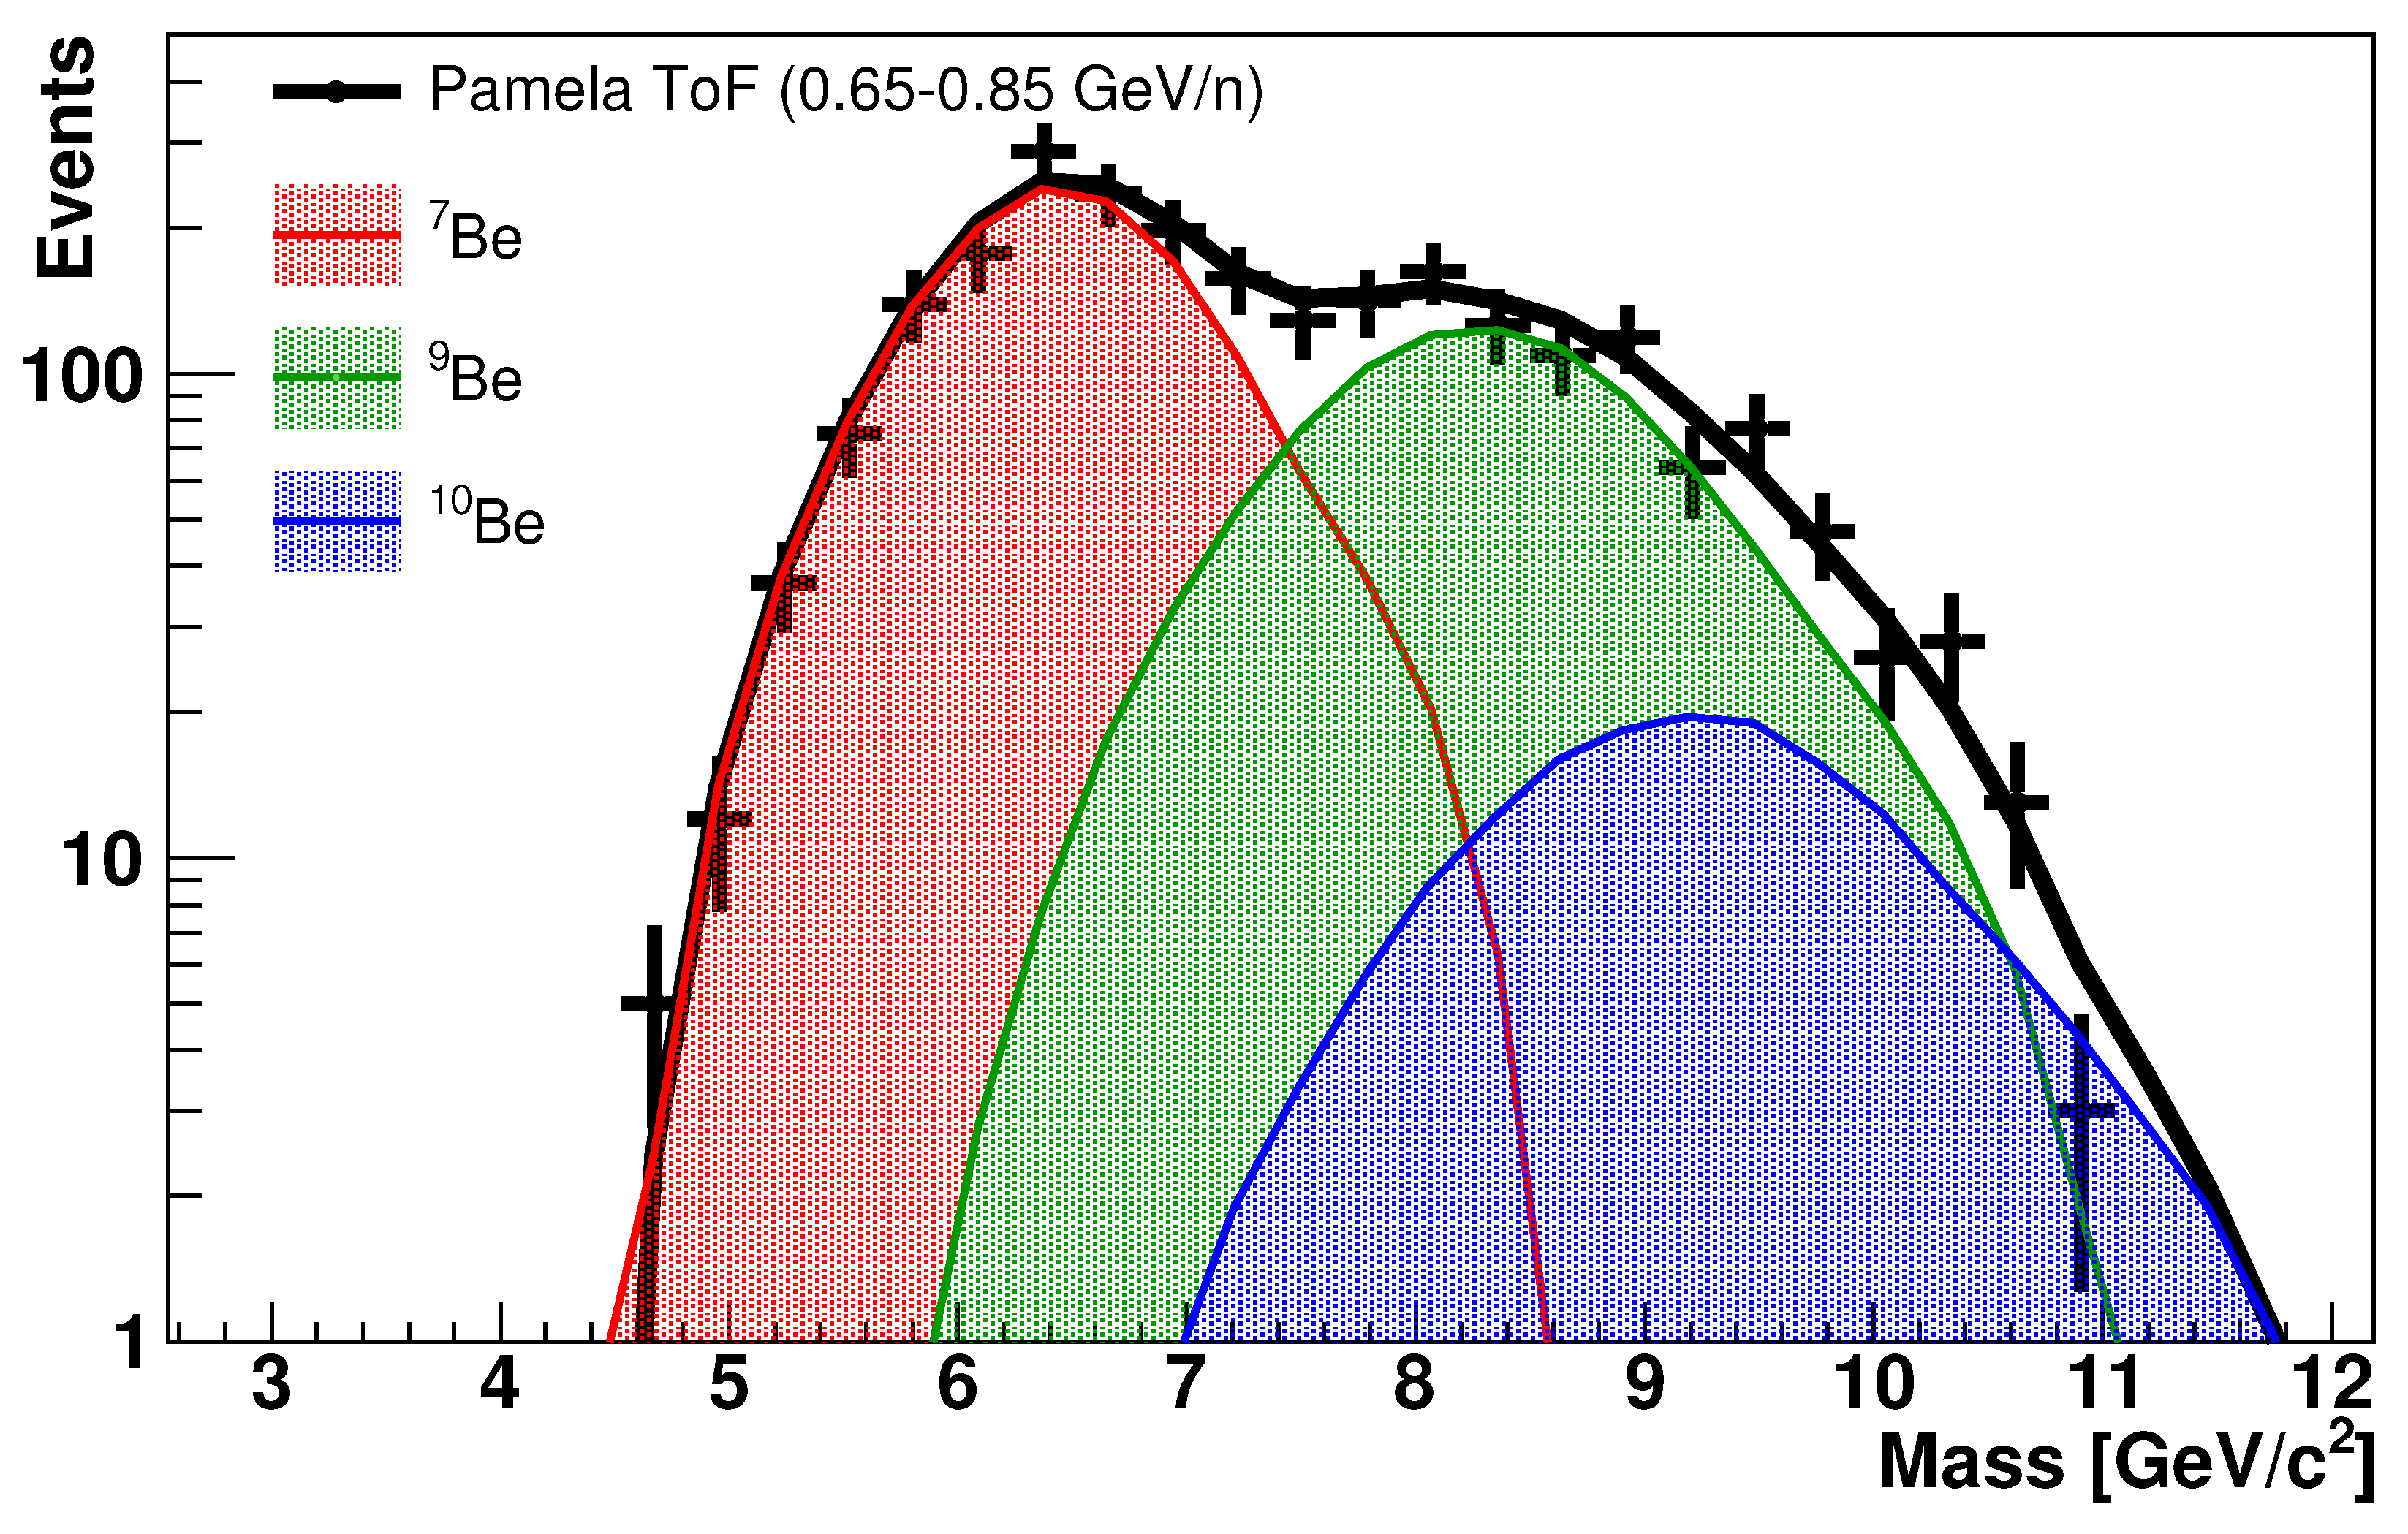
In
Figure 2, the best fit for the example of PAMELA–ToF in the 0.65–0.85 GeV/n region is shown. The templates were obtained with this data-driven approach.
Finally, it is important to note that the results of this data-driven approach are identical by construction, even when applying an arbitrary/overall scaling of the reconstructed mass value. For this reason, the results obtained through the data-driven analysis are quite solid in terms of the possible mis-calibrations of the rigidity/velocity scale, which could prevent the traditional MC-based analysis, as shown in [
6]. As a practical example, we can also apply the data-driven analysis to events measured by the PAMELA calorimeter (Figure 4 of Reference [
6]), even without a tuned Monte Carlo model/calibration for the
measurement.
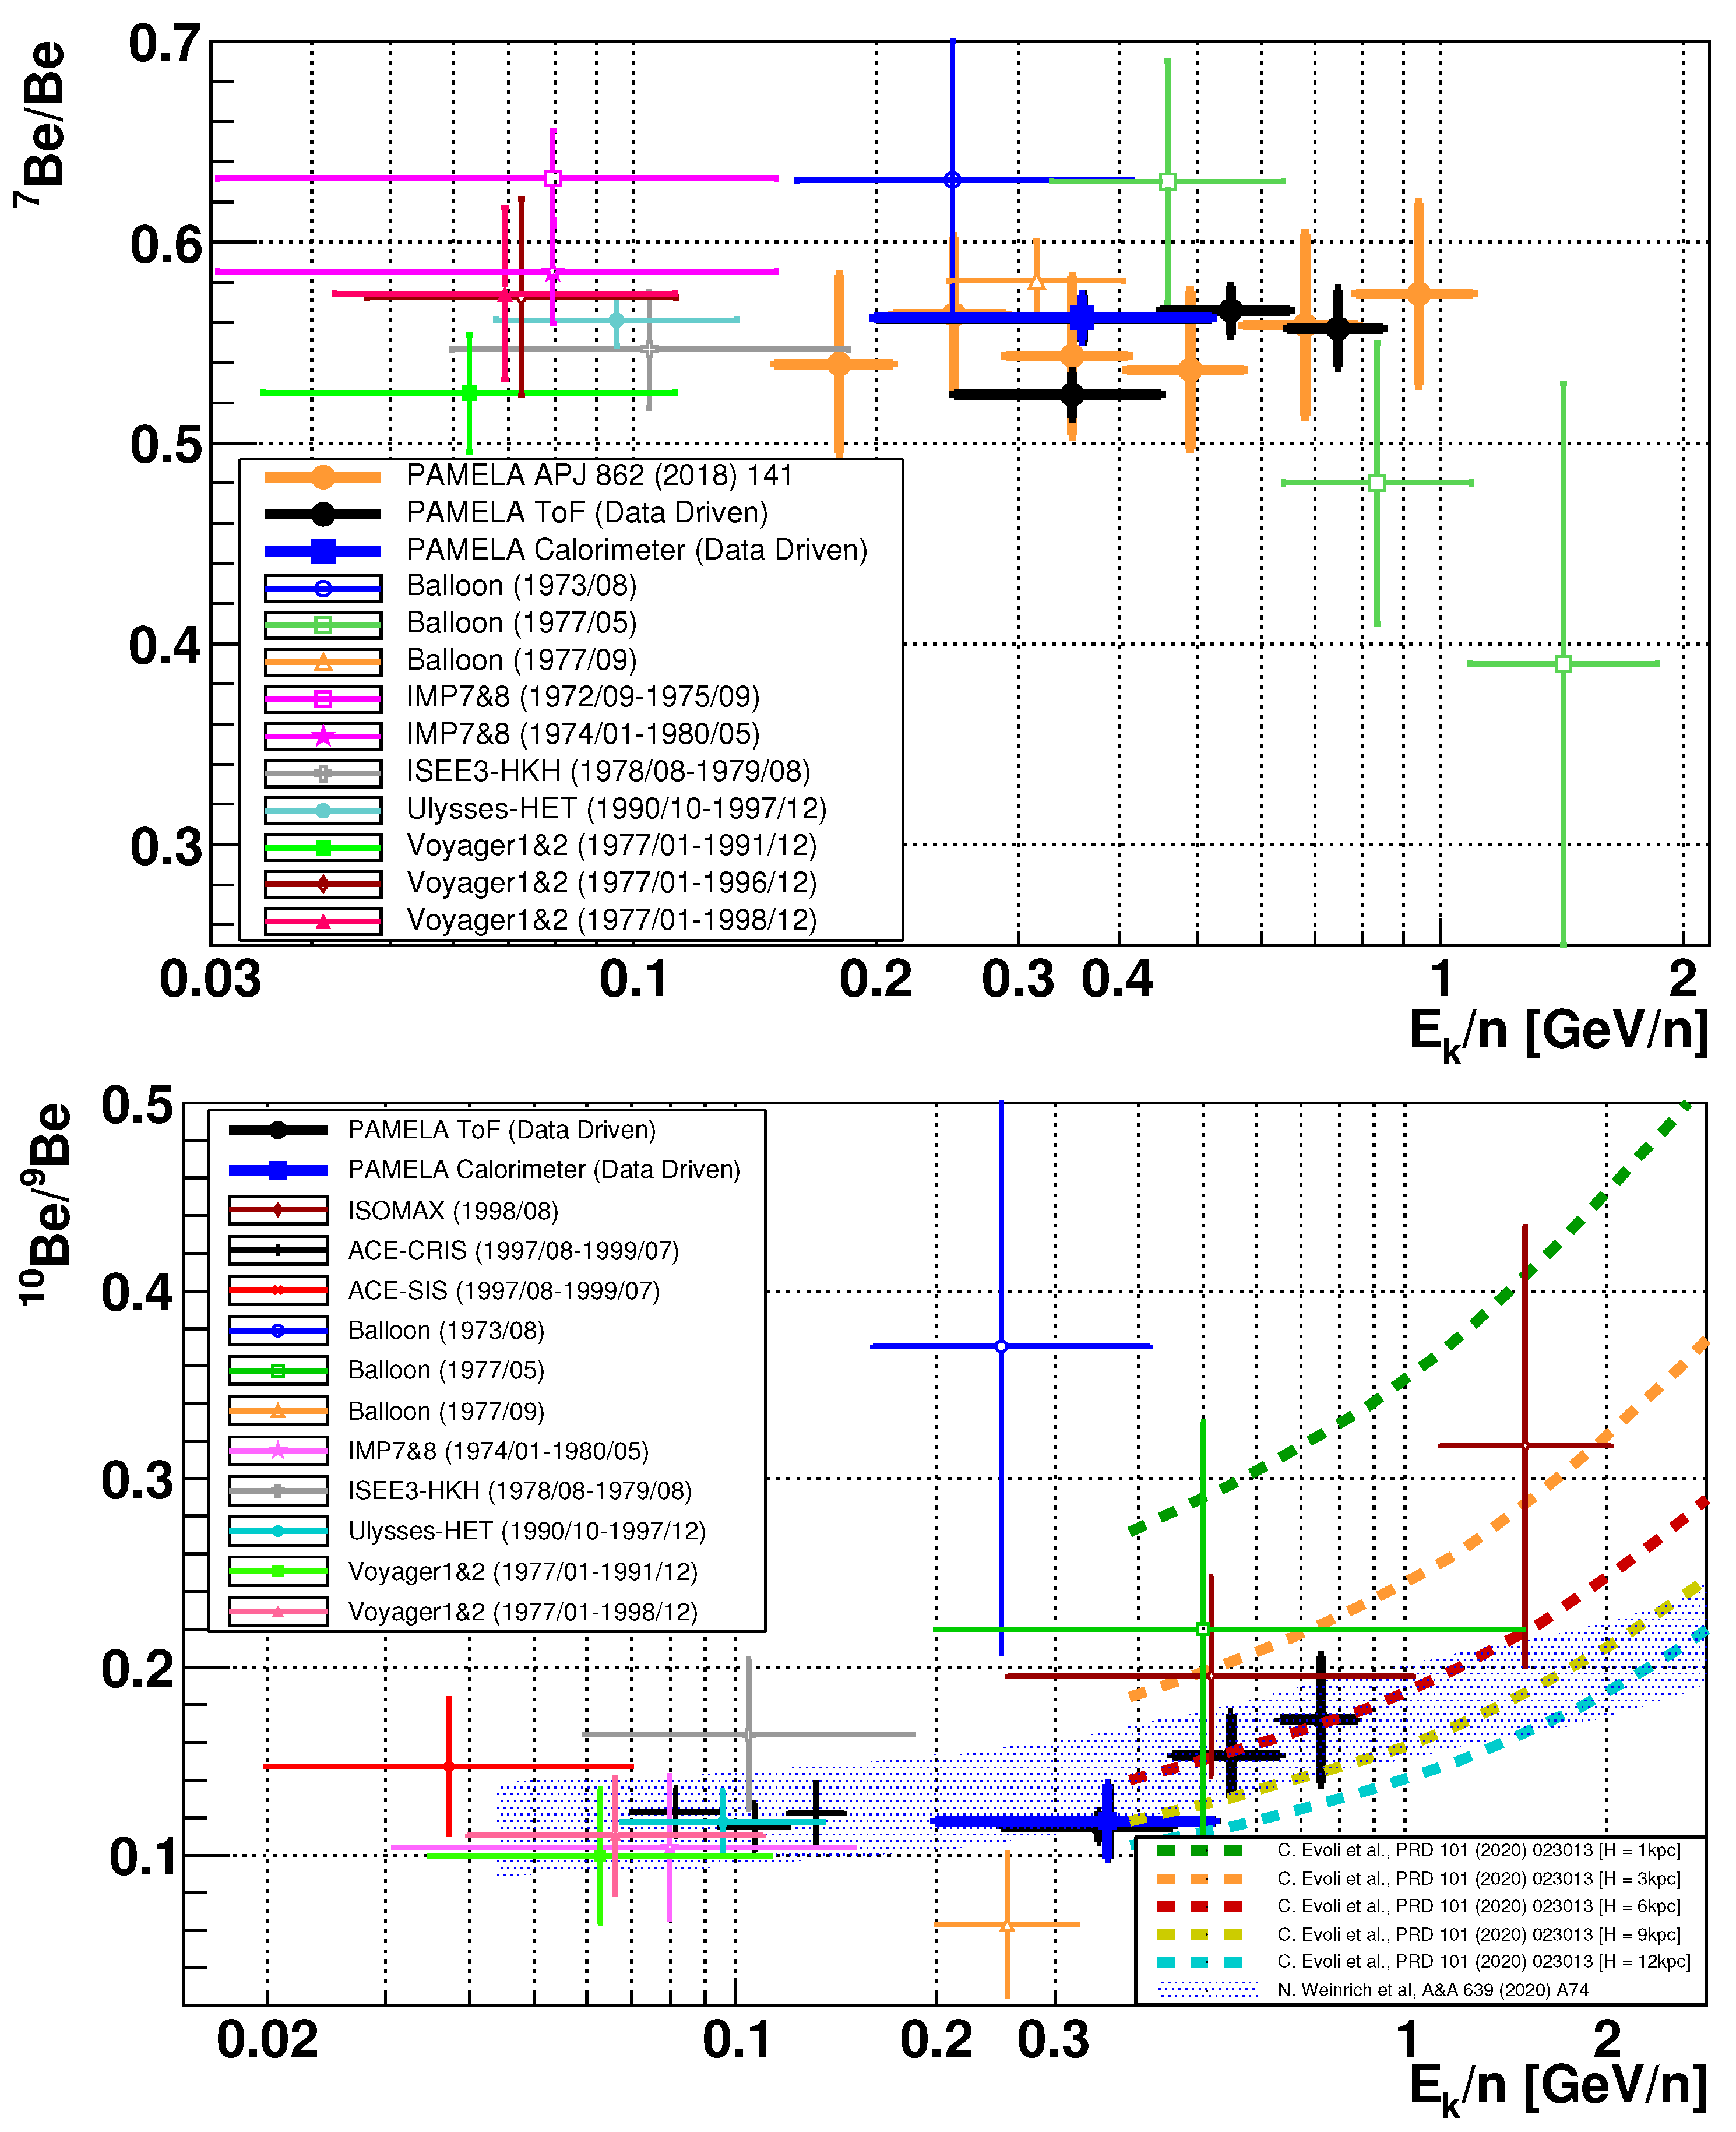
3. Results and Discussion
The results of the data-driven analysis of the
Be/Be and
Be/
Be fractions using the PAMELA data [
6] are shown in
Figure 3 and are compared with previous measurements [
7,
8,
9,
10,
11,
12,
13,
14,
15,
16,
17,
18].
The measurements obtained by PAMELA–ToF (black dots) are in reasonable agreement with the those obtained with the PAMELA calorimeter (blue square); for both results, only the statistic error bars are shown. The complete evaluation of the systematic uncertainties for these results is dominated by the possible differences in the selection acceptance for
Be,
Be, and
Be. These cannot be estimated without a Monte Carlo simulation of the detector; however, the contribution is expected to be small (few %) in comparison with the wide statistical error bars. In particular, regarding
Be/Be, the results of the data-driven analysis are in agreement with the ones published in [
6] based on the fit of the Monte Carlo template of the PAMELA data (orange dots), suggesting non-dominant systematics.
The new information provided by this data-driven analysis when applied to PAMELA data is a relatively precise estimation of the
Be/
Be ratio in the range of 0.2–0.85 GeV/n, where existing measurements are scarce and affected by large uncertainty. In particular, it is interesting to note that this measurement is in good agreement with that of the model of [
1,
2,
4,
5], which provided recent predictions of
Be/
Be tuned with the up-to-date AMS-02 fluxes (and previous low-energy
Be/
Be measurements).
The precision of the PAMELA data improves the knowledge of
Be/
Be with “large” energy, with a sizable impact on the measurement of the galactic halo (half-) thickness parameter, which is currently known to be in a wide range (
kpc) [
4].
To quantify the sensitivity of the PAMELA measurements to the halo thickness parameter, the model of [
1] is plotted in
Figure 3 for different values of
H in the range of 1–12 kpc. A simple
fit for the model [
1] in the sub-range of 0.45–0.85 GeV/n provides
kpc.
In conclusion, the data-driven analysis of of the measurement of beryllium isotopes with magnetic spectrometers is useful for reducing the systematics related to Monte-Carlo-based analyses. A determination of the halo thickness parameter with an error of the order of can be achieved, entering into the era of precise measurements expected by the forthcoming AMS-02 and HELIX results.


