Proceeding Paper

Superconducting Quantum Sensors for Fundamental Physics Searches †

by
Gulden Othman
1,2,*,
Robert H. Hadfield
3,
Katharina-Sophie Isleif
2,
Friederike Januschek
4,
Axel Lindner
4,
Manuel Meyer
5,
Dmitry Morozov
3,
Devendra Kumar Namburi
3,
Elmeri Rivasto
5,
José Alejandro Rubiera Gimeno
2 and
Christina Schwemmbauer
4
1
Institüt für Experimentalphysik, Universität Hamburg, Luruper Chaussee 149, 22761 Hamburg, Germany
2
Fakultät für Maschinenbau und Bauingenieurwesen, Helmut-Schmidt Universität (HSU), Holstenhofweg 85, 22043 Hamburg, Germany
3
James Watt School of Engineering, University of Glasgow, Glasgow G12 8QQ, UK
4
Deutsches Elektronen-Synchrotron (DESY), Notkestr. 85, 22607 Hamburg, Germany
5
CP3-Origins, University of Southern Denmark (SDU), Campusvej 55, 5230 Odense, Denmark
*
Author to whom correspondence should be addressed.
Presented at 19th Patras workshop on axions, WMPs and WISPs, with the occasion of the 80th birthday of Professor Konstantin Zioutas, Patras, Greece, 15-20 September 2024.
Phys. Sci. Forum 2025, 11(1), 2; https://doi.org/10.3390/psf2025011002
Published: 20 October 2025
(This article belongs to the Proceedings of The 19th Patras Workshop on Axions, WIMPs and WISPs)

Abstract

Superconducting Transition Edge Sensors (TESs) are a promising technology for fundamental physics applications due to their low dark count rates, excellent energy resolution, and high detection efficiency. On the DESY campus, we have been developing a program to characterize cryogenic quantum sensors for fundamental physics applications, particularly focused on TESs. We currently have two fully equipped dilution refrigerators that enable simultaneous TES characterization and fundamental physics searches. In this paper, we summarize the current status of our TES characterization, including recent calibration efforts and efficiency measurements, as well as simulations to better understand TES behavior and its backgrounds. Additionally, we summarize some physics applications that we are already exploring or planning to explore. We will give preliminary projections on a direct dark matter search with our TES, where exploiting low-threshold electron scattering in superconducting materials allows us to search for sub-MeV-scale dark matter. We are also working toward performing a measurement of the even-number photon distribution (beyond one pair) of a quantum-squeezed light source. Finally, if it proves to meet the requirements, our TES detector may be used as a second, independent detection system to search for an axion signal at the ALPS II experiment.

1. Introduction

For good reason, quantum sensors are gaining popularity in fundamental physics applications. Transition Edge Sensors, or TESs, are one promising technology that enables a variety of fundamental physics searches. TESs are cryogenic detectors that exploit the properties of superconductivity to measure single photons or other particle quanta [1]. TESs are effectively very sensitive microcalorimeters. A superconducting material operates on the steep transition between the critical temperature T C and normal conducting temperatures T N on a resistance–temperature curve. When a particle is incident on the TES, the energy deposited heats the material. The relatively small temperature change results in a comparatively large resistance change, which is read out through electrical circuitry, including Superconducting Quantum Interference Devices (SQUIDs), as a voltage change.
While there are other sensors exploiting the properties of superconductivity, such as Superconducting Nanowire Single Photon Detectors (SNSPDs), TESs offer the distinct advantage of allowing the user to deduce the energy of the incoming particle, meaning that TESs can act as microcalorimeters. Given a fixed-wavelength source, TESs can also naturally act as single-photon counters. Their energy and photon-number resolution make TESs very versatile and desirable for many fundamental physics applications.
At DESY in Hamburg, we are characterizing TESs as well as using them for fundamental physics searches. We operate tungsten-based TESs made by NIST [2], and packaged into two-channel TES modules with SQUIDs by PTB [3,4], as shown in Figure 1. Our facilities include two fully equipped laboratories with dilution refrigerators, enabling simultaneous measurements for characterization and fundamental physics searches. In this document, we summarize the characterization efforts of our TES modules—which we refer to as TES detectors—including energy calibration, system detection efficiency, simulations of the TES response, and future methods to reduce background rates. We end with three current and future fundamental physics applications of our TESs, including projections for a direct dark matter search, a proposal for measurements of quantum-squeezed light, and a discussion of the possibility of a TES-based detector in the Any Light Particle Search II (ALPS II) experiment at DESY. This manuscript is meant to be a concise summary of our activities, and further details can be found in the corresponding references.

2. Characterization Efforts

We use tungsten TESs ( T C = 140 mK) from NIST with a 25 μ m × 25 μ m × 20 nm active volume. To be optimized for 1064 nm photon detection, they are embedded in an optical stack, and have demonstrated ≥95% quantum efficiency [2]. We operate our TES detectors with the goal of having the lowest dark count rates possible, and have measured post-analysis rates as low as 6.9 · 10 6 Hz in our lab when no fiber is attached in an analysis focused on the 1064 nm region of interest [5].
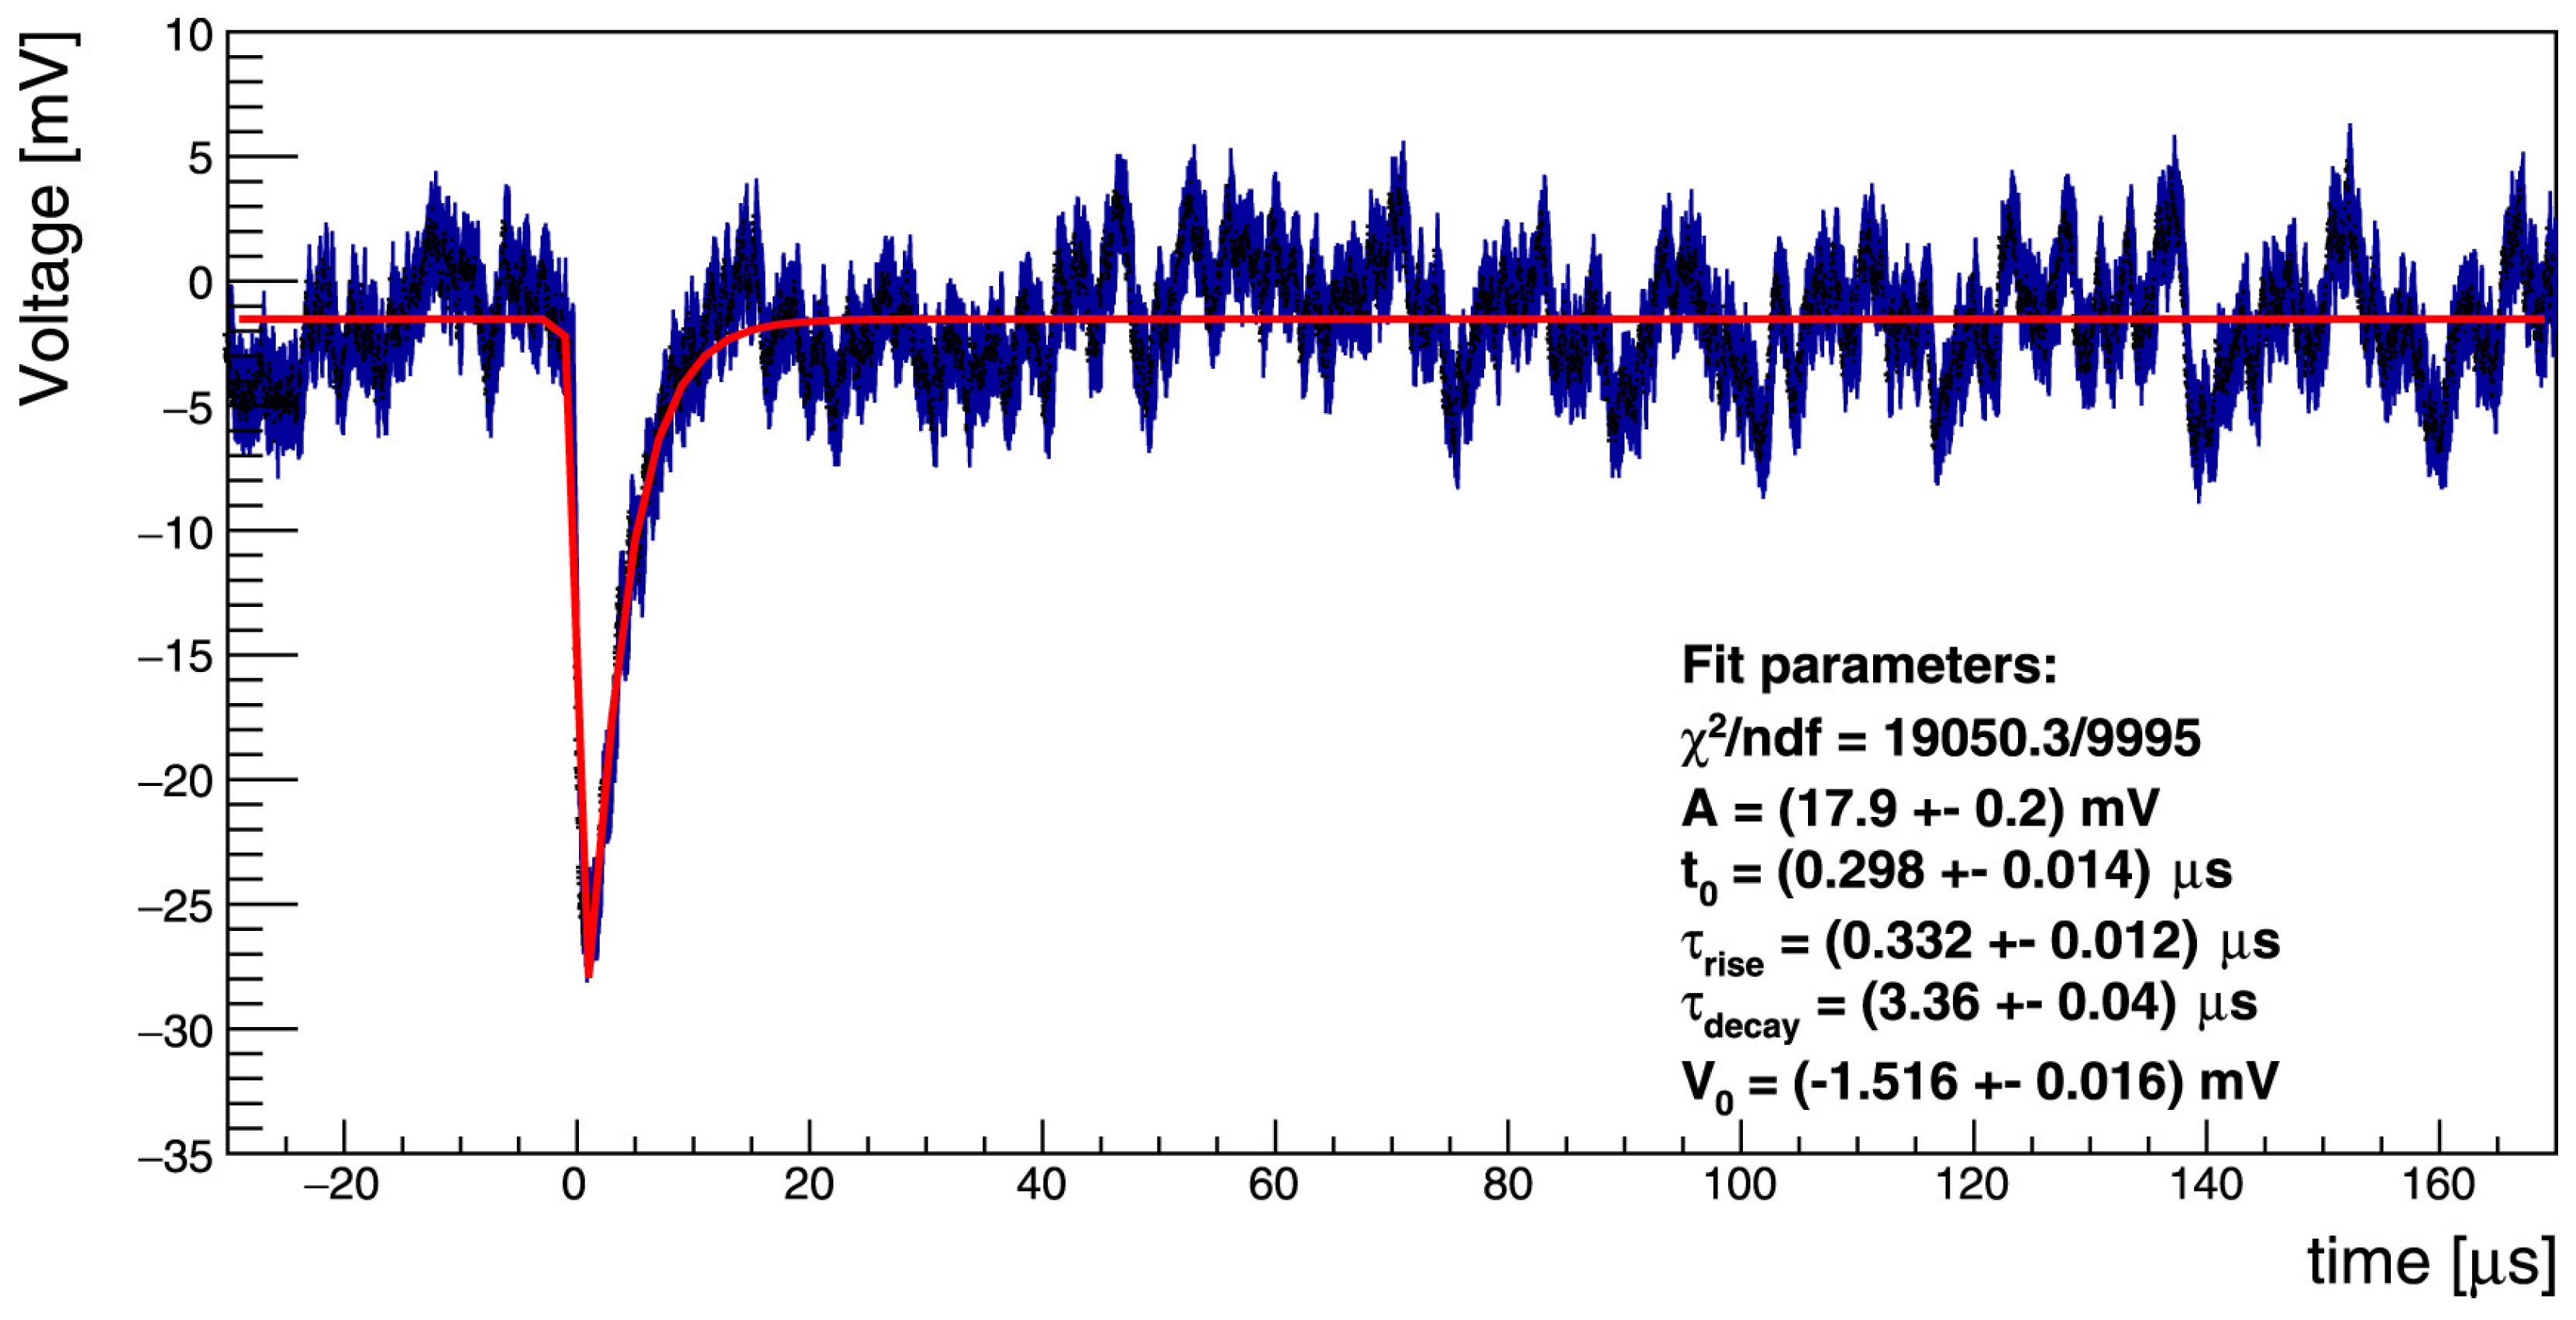
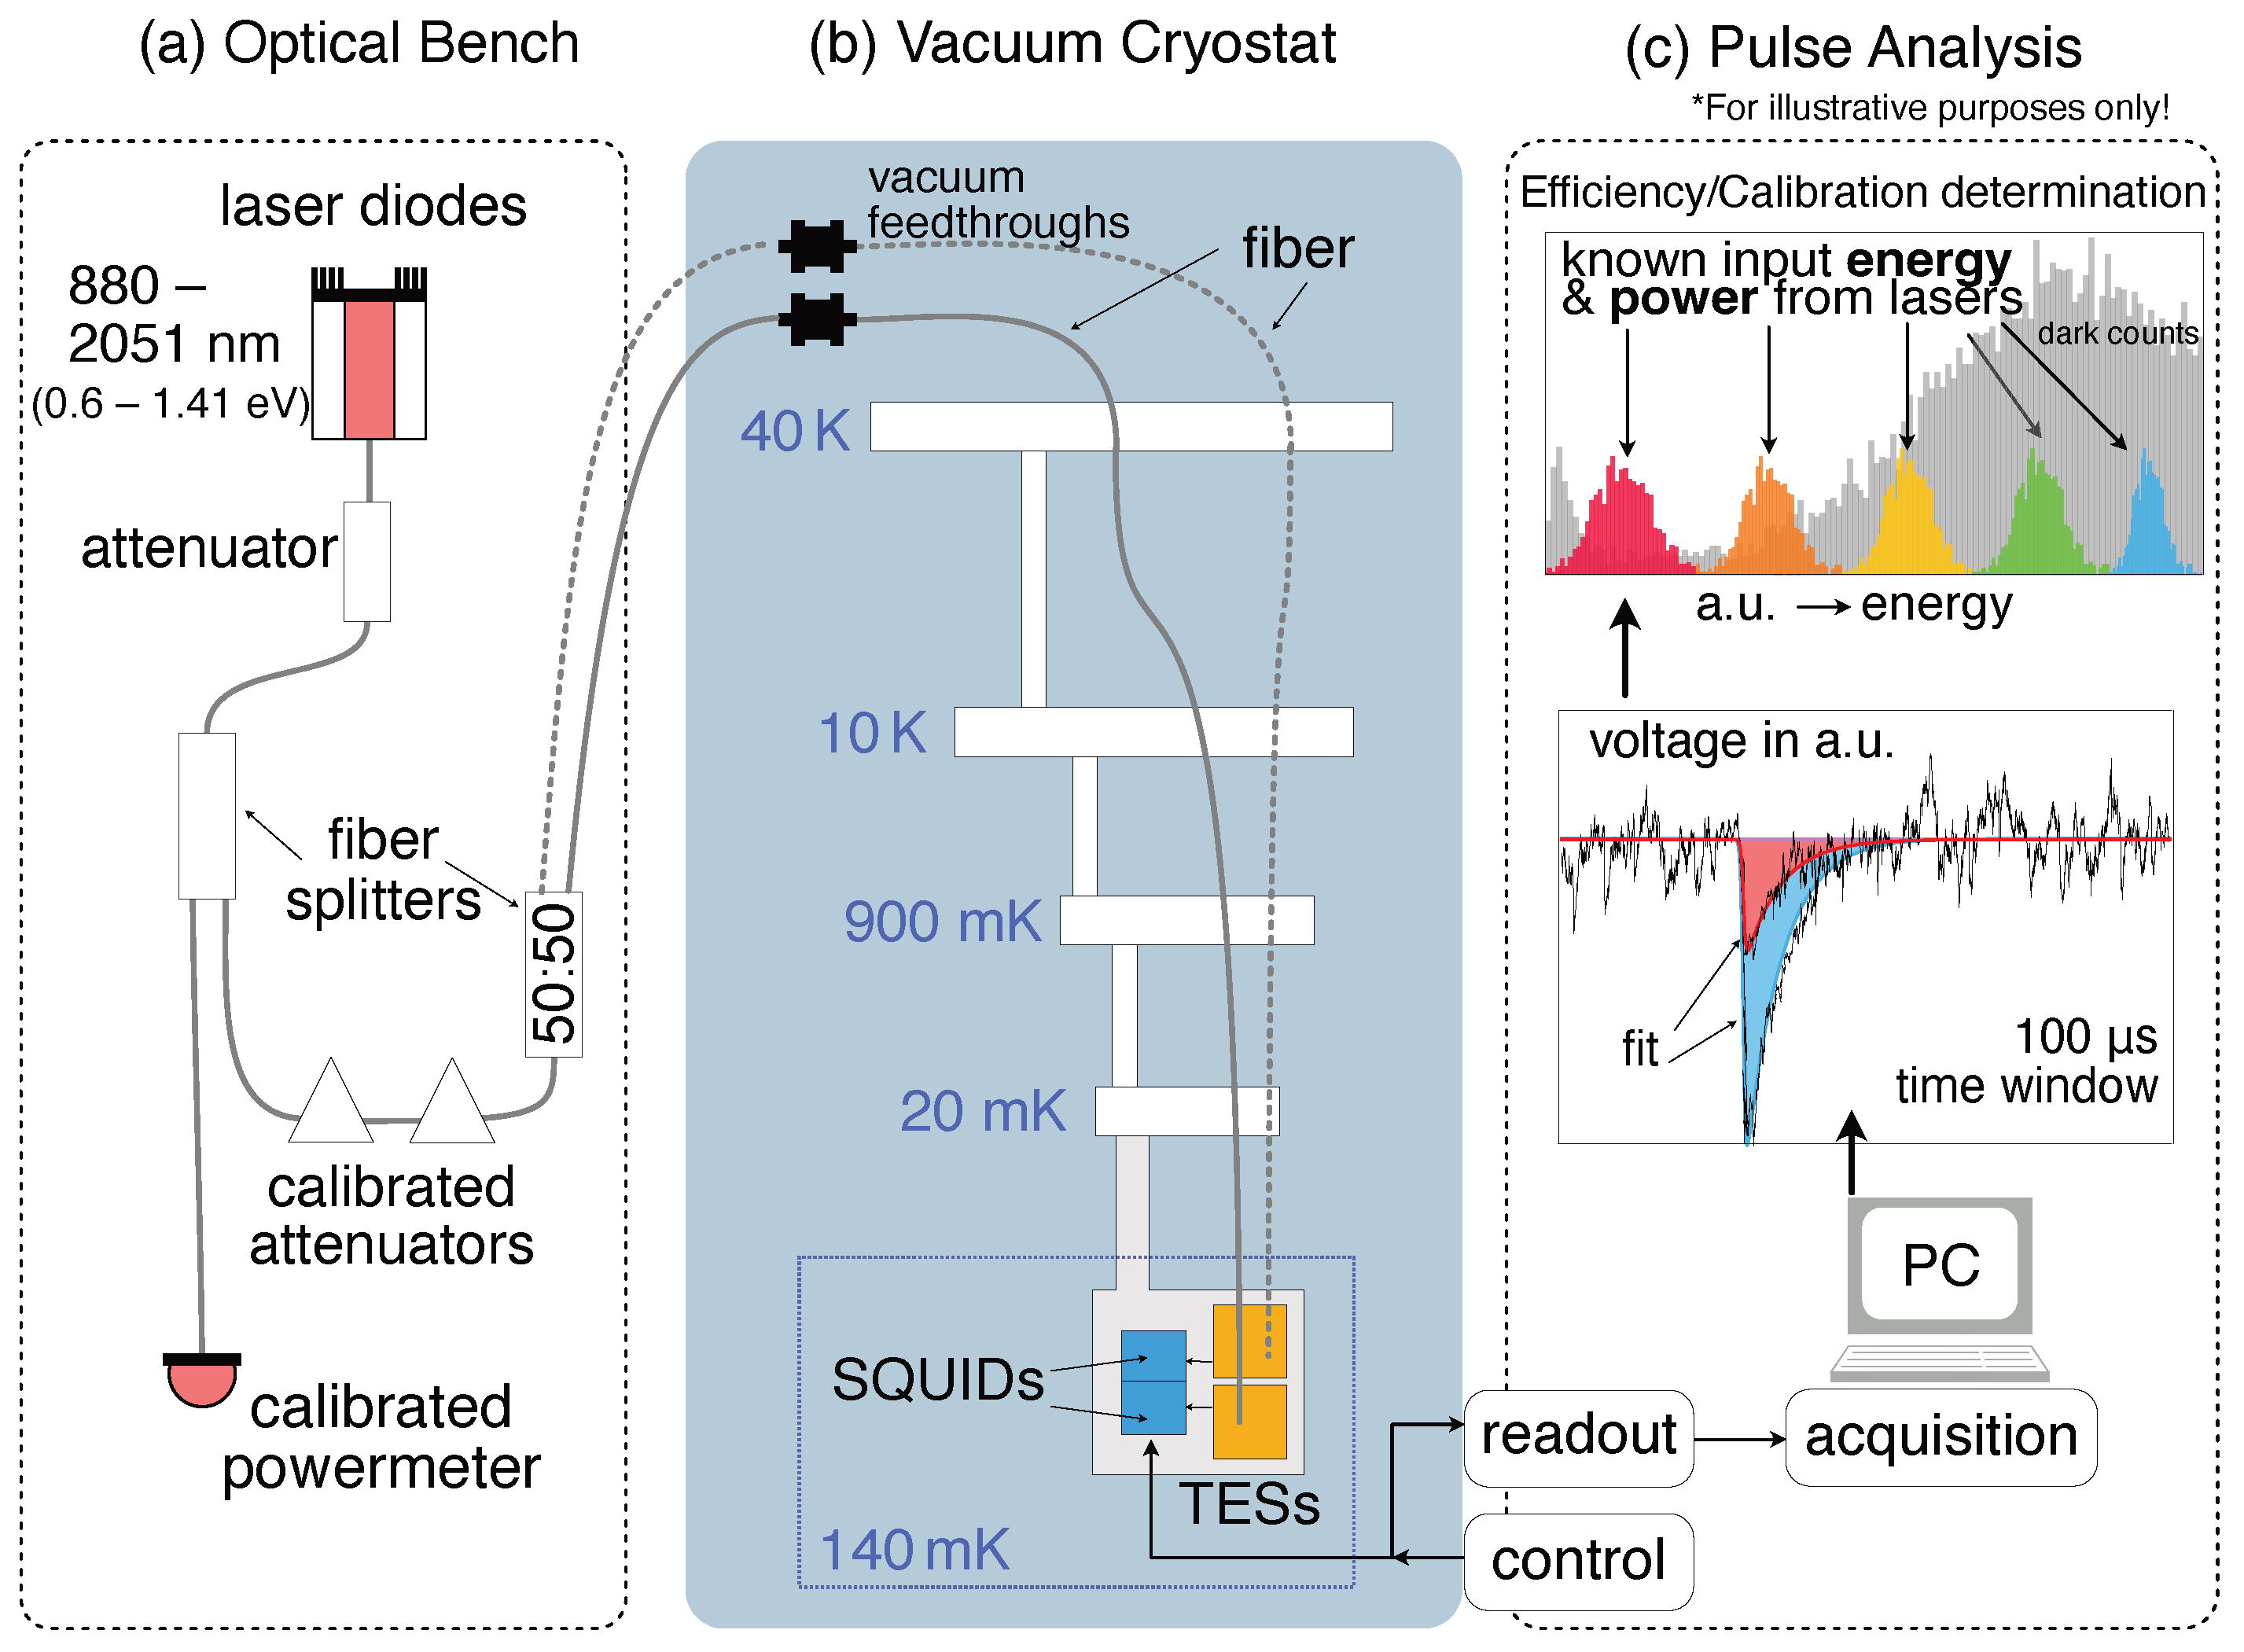
We operate our TES detectors in dilution refrigerators with base temperatures around 25 mK. Characterization of the detectors necessitates sending laser light to the TESs through optical fiber vacuum feedthroughs. The TES modules include sleeves made from zirconia, deisgned for optimal coupling of light to the TESs via optical fibers. In this way, the optical fiber can be inserted and removed on demand. We perform most characterization measurements with the optical fiber inserted into the fiber sleeve to couple-in laser light from outside the BluFors (Helsinki, Finland) cryostat. Each incoming particles is recorded as a voltage pulse, which is digitized with a 50 MHz sampling rate in 200 μ s windows, and later analyzed. A sample voltage pulse from a 1064 nm laser source is shown in Figure 2. The energy of the incoming particle can be deduced from the integral of such a voltage pulse [1]. A cartoon example of a characterization workflow can be found in Figure 3. For further details about our TES detectors and analysis procedures, please see Refs. [5,6,7].

2.1. Energy Calibration

As previously mentioned, one strong benefit of TESs is their energy resolution capabilities. Though they are optimized for 1064 nm, our TESs as installed are expected to be most sensitive to optical wavelengths between 1600 nm and 800 nm (0.775–1.41 eV), based on limitations from the reflective properties of the optical stack. The TESs in principle could be sensitive down to even longer optical wavelengths; however, fiber curling within the cryostat currently suppresses them, so we are unable to explore this possibility [8]. We note that particles are not suppressed by the reflective properties of the optical stack, and that the TES can be sensitive to particles with energy anywhere above the detection threshold, which can be as low as around ∼0.3 eV [9]. As previously mentioned, the energy deposited by a particle is proportional to the integral of the voltage pulse (e.g., Figure 2) we record [1]. In Refs. [10,11], it was verified that there is a linear relationship between the pulse height and energy in the probed regions between 1 and 3 eV. We have since decided to use the integral of the pulse as an energy parameter due to it being more robust against noise.
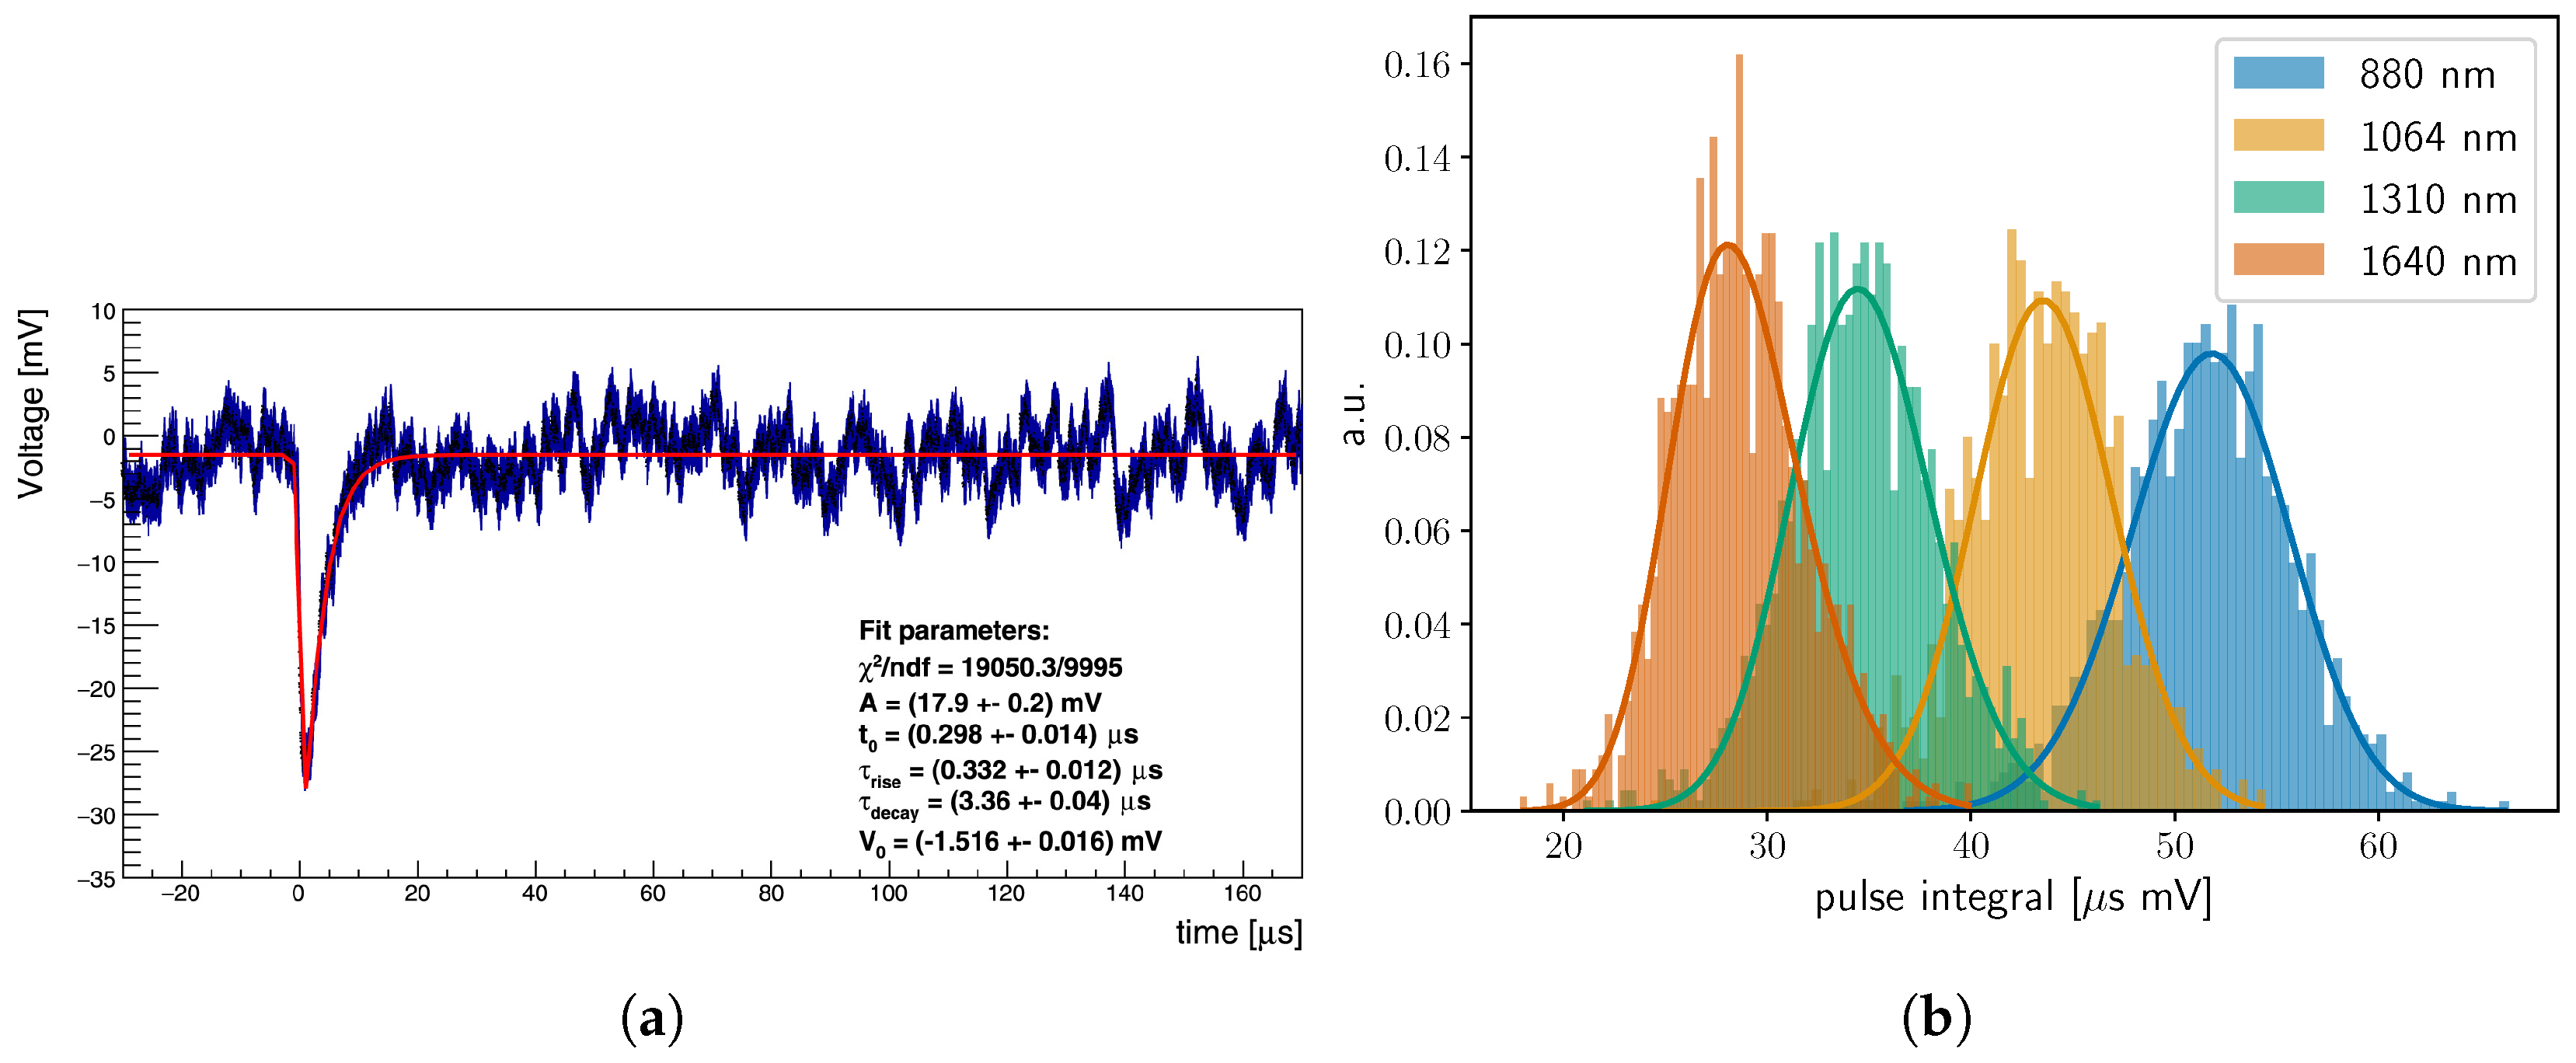
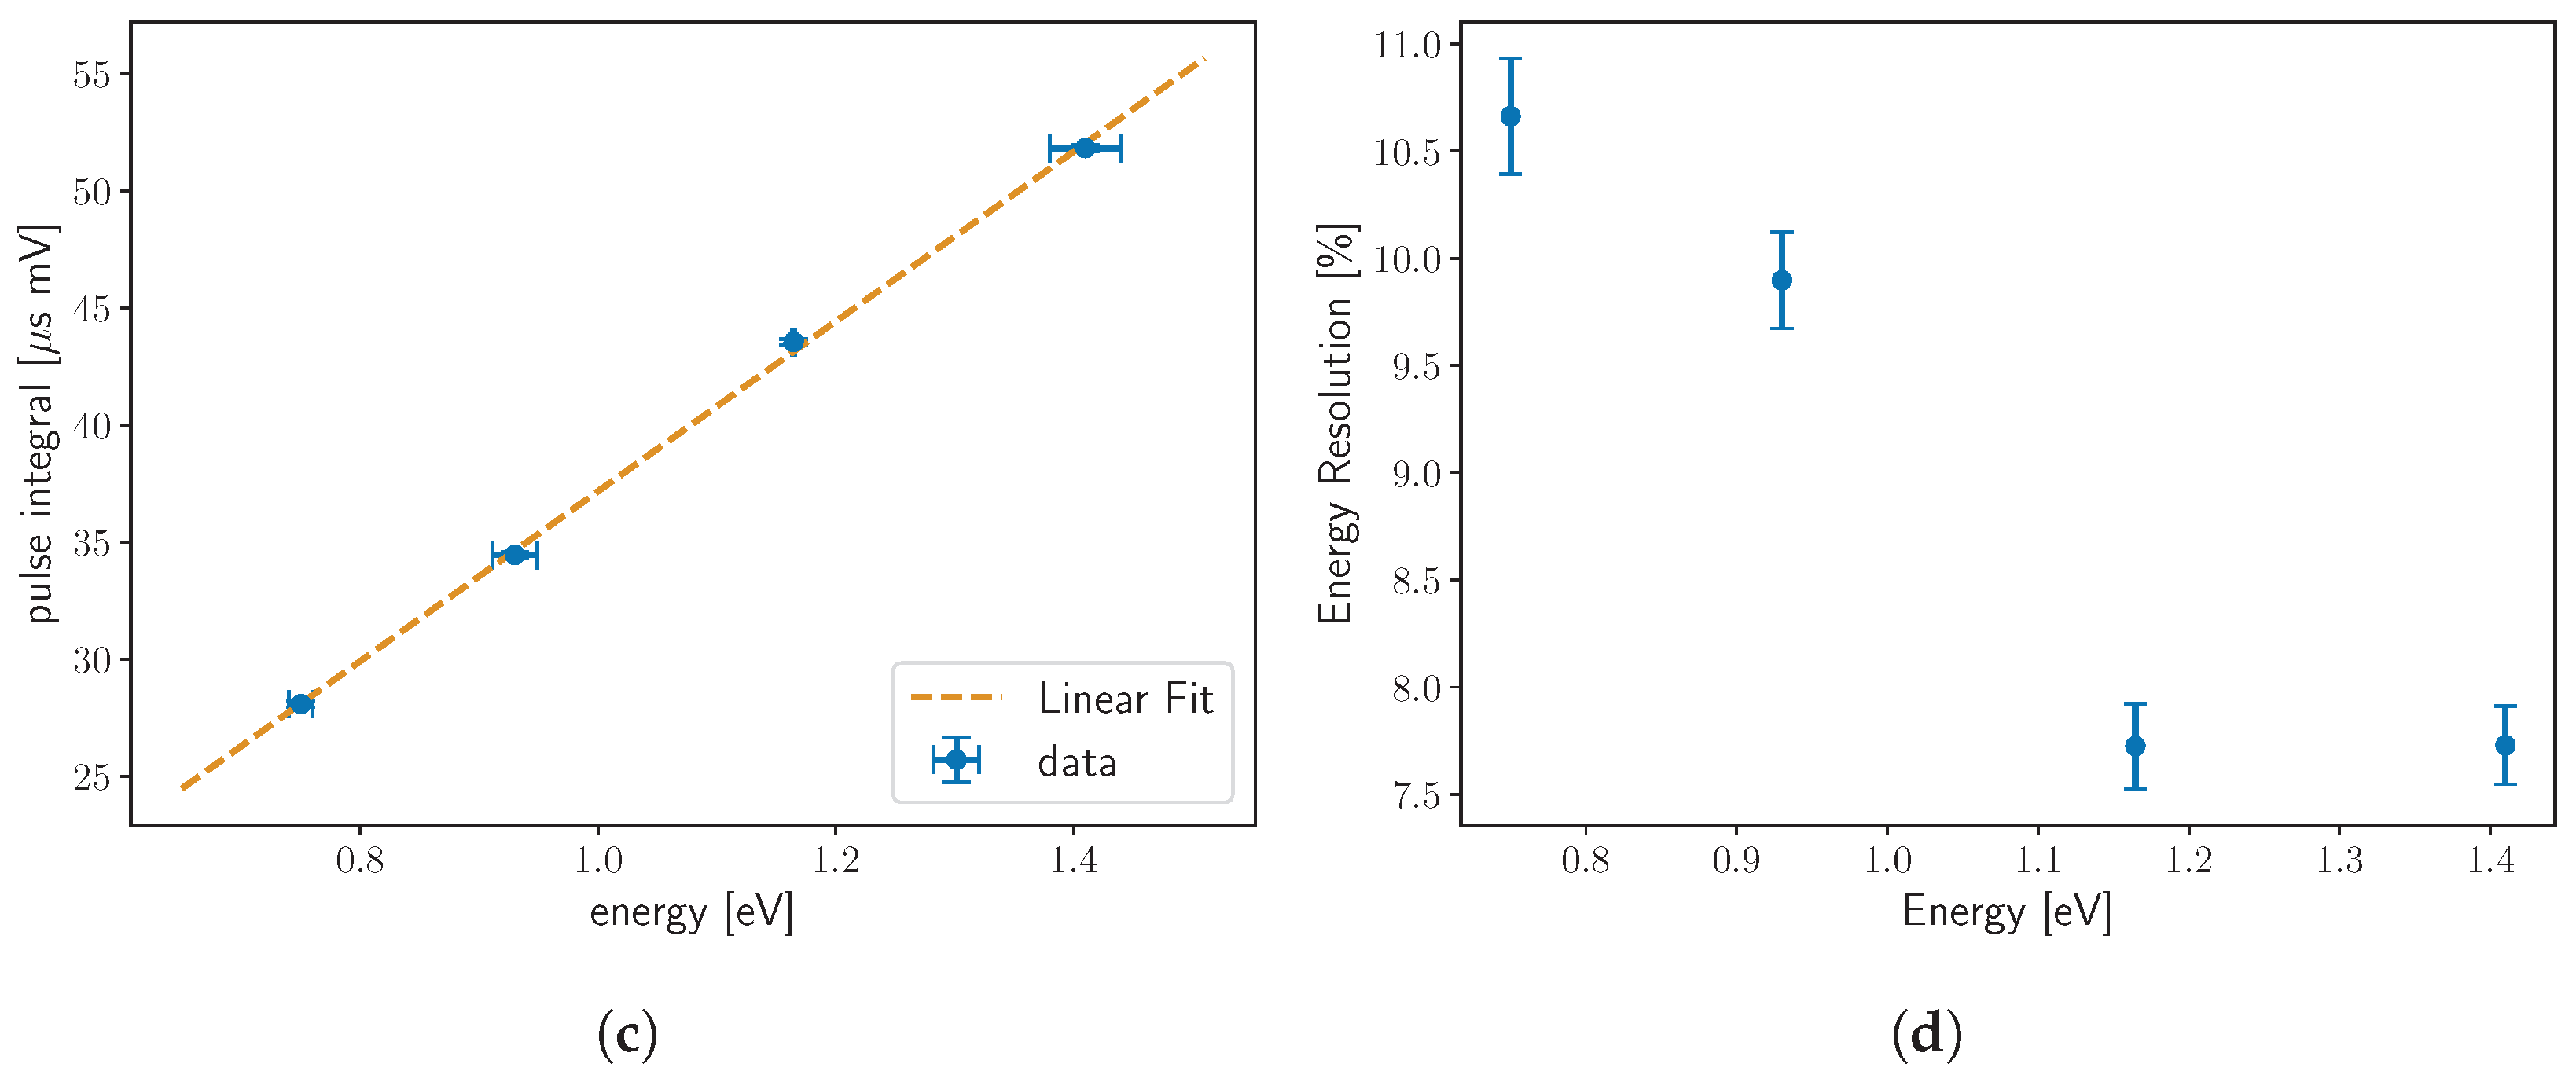
To fully exploit the energy resolution capabilities of our TES detectors, we calibrate their energy response through the relevant energy window. To accomplish this, we used laser diodes of 4 different energies, ranging from 1640 nm to 880 nm (∼0.756–1.41 eV). The laser light is sent to the TESs via optical fiber. For the results shown here, the fiber tip was not inserted directly into the fiber sleeve and was instead hanging nearby the TES. This is because the calibration was performed for a measurement where no optical fiber is necessary, and could induce additional backgrounds (see Section 2.3). After recording TES pulses for each wavelength of laser light and determining each pulse integral, the pulse integrals are histogrammed for each wavelength (Figure 4b), and a linear mapping is made from the mean μ of pulse integral distribution to the known laser energy, shown in Figure 4c. We define the energy resolution as Δ E / E = σ / μ , where σ is the standard deviation of the histogram. The resulting energy resolution ranges from ∼8% at 1.409 eV (880 nm) to ∼11% at 0.756 eV (1640 nm), as can be seen in Figure 4d. The resolution here likely suffers because the fiber is not inserted into the fiber sleeve, and is expected to improve in future measurements where the optical fiber is coupled to the TES. With a fiber attached and an analysis method in the frequency domain, we have already demonstrated the ability to achieve energy resolutions as low as 5% at 1064 nm [12]. The theoretical best energy resolution at 1064 nm is 0.7%, calculated by the method described in Ref. [1] with our unique TES parameters. It is well known, and also described in Ref. [1], that TESs often do not reach these low levels. Through a dedicated pulse simulation study, we have found that the energy resolution of our TES modules at 1064 nm is limited by electronic noise [6,13].

2.2. System Detection Efficiency

Though the TESs have quantum efficiencies above 95%, coupling the TESs to optical fiber induces extra losses. For fiber-coupled experiments, it is essential to understand the full system detection efficiency, or SDE, which accounts for losses due to fiber connections such as mating sleeves, and coupling to the TES chip. At this time, we focus on determining the SDE at 1064 nm, the optimal wavelength for our sensors. Our current method, summarized in Figure 5 inspired by Ref. [14], relies on measuring the power of a strongly attenuated continuous wave (CW) (∼1 mW original power) laser light, and dividing it with a 99:1% beam splitter. The 99% line (∼pW) is monitored by a calibrated power meter, referenced as P 0 , and the 1% line is sent to the TES after further attenuation (∼fW). This scheme is necessary because the lowest commercially available power meter is only sensitive down to ∼pW, but the TES would be saturated at that level. We then count the number of pulses arriving at the TES, and calculate the efficiency, η , using
η = P T E S P i n ,
where P i n is the power sent to the TES. P i n is determined from the original laser energy with P i n = P 0 10 L t o t / 10 , where L t o t is the total attenuation of the laser power sent to the power meter, including the splitting from the 99:1% splitter. With this method, we estimate an SDE of >80%. The main contributors to the (statistical) uncertainty of the efficiency are the uncertainty of the measured photon pulses, as well as the uncertainty of the measured power in the photo diode (which in turn depends on uncertainties of the power calibration). The overall error budget is derived similarly to as in Ref. [15]. Preliminary results suggest overall uncertainties of the order of a few percent. The dominating systematic uncertainty is given by the fiber alignment of the mating sleeves. A study to quantify this uncertainty is ongoing. We furthermore plan to upgrade our system with a pulsed laser to determine the SDE similarly to as in Ref. [3]. Our system is currently being set up, and new measurements and results are expected in the coming months.

2.3. Simulations

In addition to our hardware characterization efforts, we have performed simulations of the TES response to better understand our backgrounds. The simulations are 2-fold. First, GEANT4 [16] is used to simulate radioactive backgrounds, such as cosmic muons and intrinsic radioactivity. Then, the energy information from particle interactions in GEANT4 is input into a COMSOL [17] simulation, where heat transfer and the TES dynamics are modeled. Pulses are simulated based on the TES model [1], and are later fitted. The fitting parameters, especially the pulse height and decay time ( τ d e c a y ), are compared to those from data, confirming which simulated backgrounds are in agreement with experimental data. The simulations have proven very successful. They are consistent with zirconia present in the fiber sleeves potentially being a dominant background source in our experiment, with an expected rate of ∼ 10 2 Hz [6], which is very near the experimental raw trigger rate with no fiber connected [18]. This information was used to manufacture a new module with no fiber sleeves, which is planned for use in a future direct search for dark matter. The simulation also confirmed that cosmic rays do not play a large role in our backgrounds, with expected rates of 8 · 10 5 Hz. Further detail about the simulations can be found in [6].

2.4. Backgrounds and Background Reduction

For our intended uses, we wish to have dark count rates as low as possible. We have measured the dark count rates after analyses, with a focus on 1064 nm photon-like events as low as 6.9 · 10 6 Hz, with no optical fiber attached [5,7], and ∼ 10 4 Hz with a fiber attached, depending on the cuts used [18].We have photon-like background sources from two main areas. For fiber-coupled experiments, the predominant background is blackbody photons coupling into the TES from the warm, air-side fiber tip. A detailed study of the expected blackbody background in our TES detectors can be found in Ref. [18]. For experiments where no fiber is inserted, intrinsic radioactivity is expected to be the largest background (see Section 2.3). For measurements near threshold (∼0.3 eV), including searches for direct dark matter, we expect that electronic baseline noise is the largest background.
To address backgrounds from blackbody photons in the region around 1064 nm, a cold optical filter bench is being developed in collaboration with the University of Southern Denmark. The idea is to use a narrow-band optical filter around 1064 nm installed inside the cryostat to filter blackbody photons that may be introduced from the warm, air-side fiber tip. Since the filter itself is cold, blackbody photons can be filtered without being re-introduced by the optics. In an enclosed setup, we use a fiber collimator to send the photons from fiber to free space, where the light will pass through an optical filter, before another fiber coupler will re-couple the light to optical fiber that is then routed to the TES. In order to avoid significant losses, it is essential to align the couplers and optics extremely precisely. Because cooling the apparatus results in thermal contraction, it is necessary to do this alignment while cold and in vacuum conditions. This is accomplished using externally controllable cryogenic-compatible piston stages [19]. Vibrational isolation is also necessary to reduce microphonics effects. A CAD drawing of the current design of the device can be found in Figure 6. Preliminary testing of the prototype device is currently in progress, and transmissions up to 60% have been achieved when no optical filter is present. Auto-alignment procedures are currently being developed, and improved transmission is expected in the near future.
For additional background reduction in post-processing, machine learning algorithms are currently being investigated. An initial study based on random forest and multilayer perceptron algorithms can be found in Ref. [7], and a more detailed analysis based on convolutional neural networks will be published soon.

3. Physics Applications

In addition to characterizing our TES detectors, we take advantage of the low dark count rates, photon number, and energy resolution, and high quantum efficiency of our detectors through a variety of ongoing and planned physics searches.

3.1. Direct Dark Matter

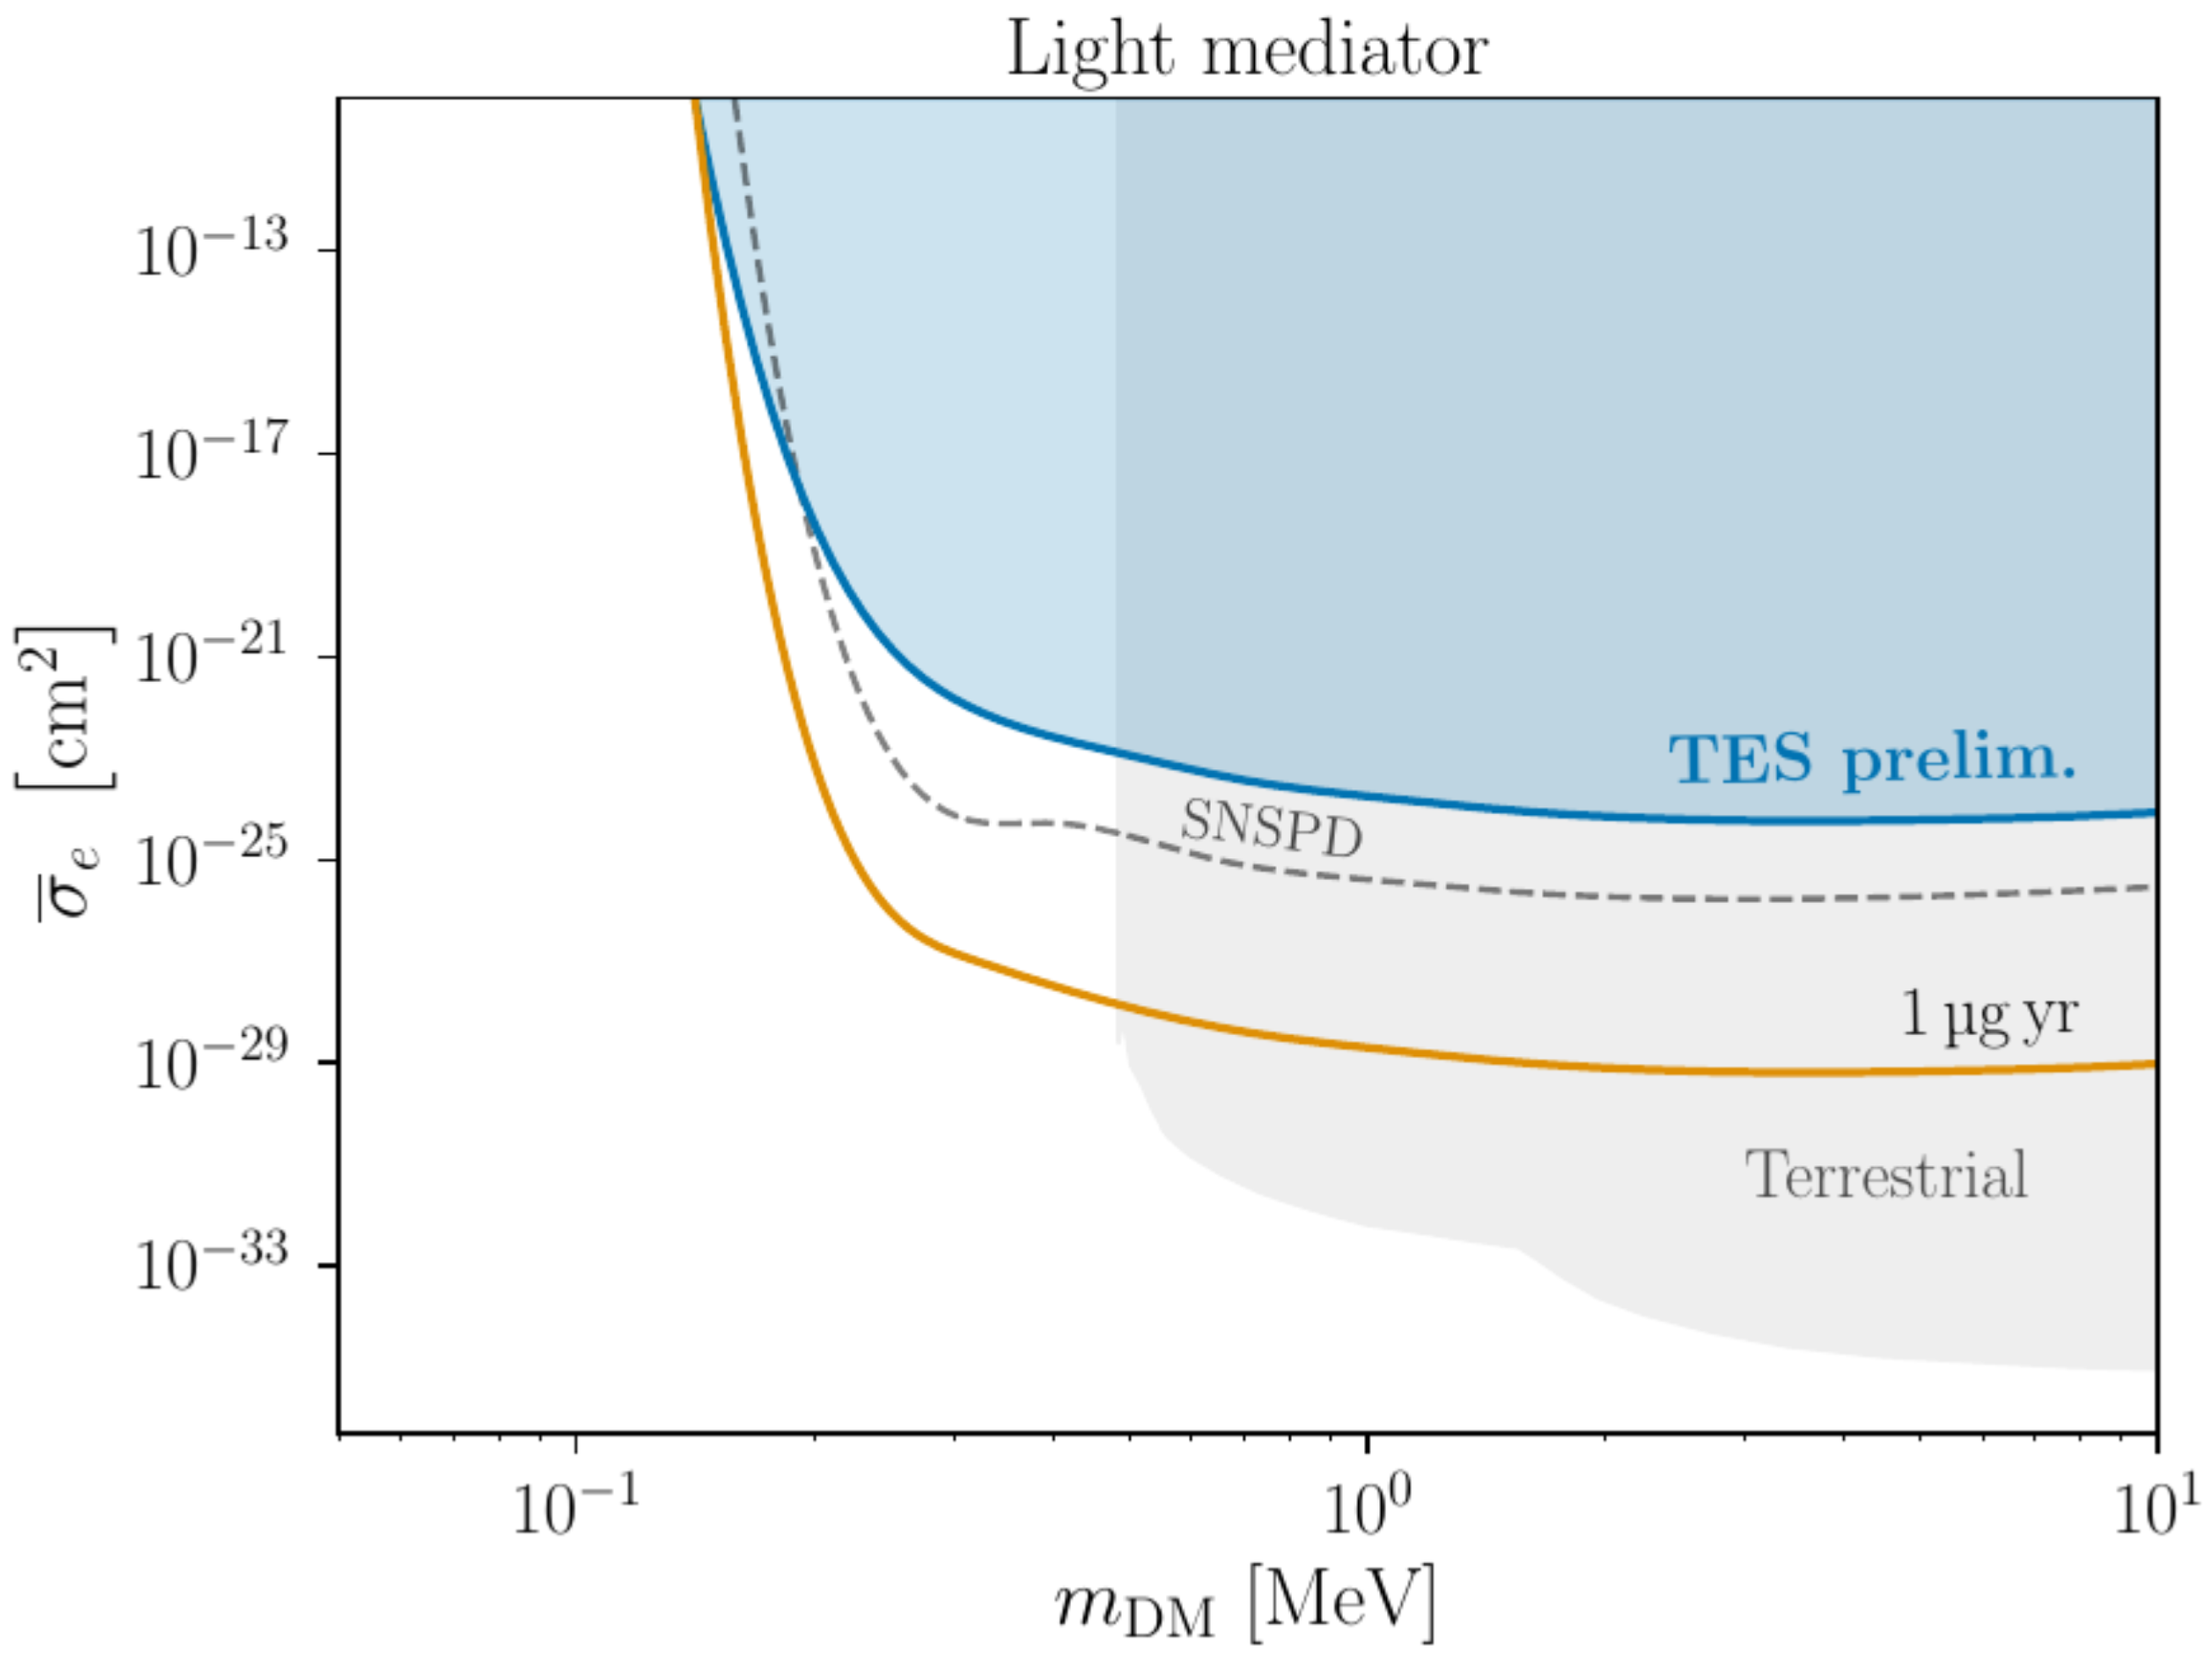
The low dark count rates, energy resolution, and low thresholds achievable with our detectors make them extremely suitable for direct searches for MeV-scale dark matter (DM), as suggested by Ref. [20]. While other searches for direct dark matter have used TESs to measure energy deposited in a separate target material, TESs have, up to now, never been used as both the target material and detector. The projected exclusion sensitivity, assuming the optimal performance of one of our TES detectors at the time of this presentation, can be found in Ref. [21], and is summarized in Figure 7. Since then, we have conducted a search for direct dark matter in a 489 h run, where the fiber tip was removed from the TES. A preprint with the finalized exclusion curves based on this work for dark matter electron and nucleon scattering, as well as absorption, is available in Ref. [9].

3.2. Measuring Squeezed Light

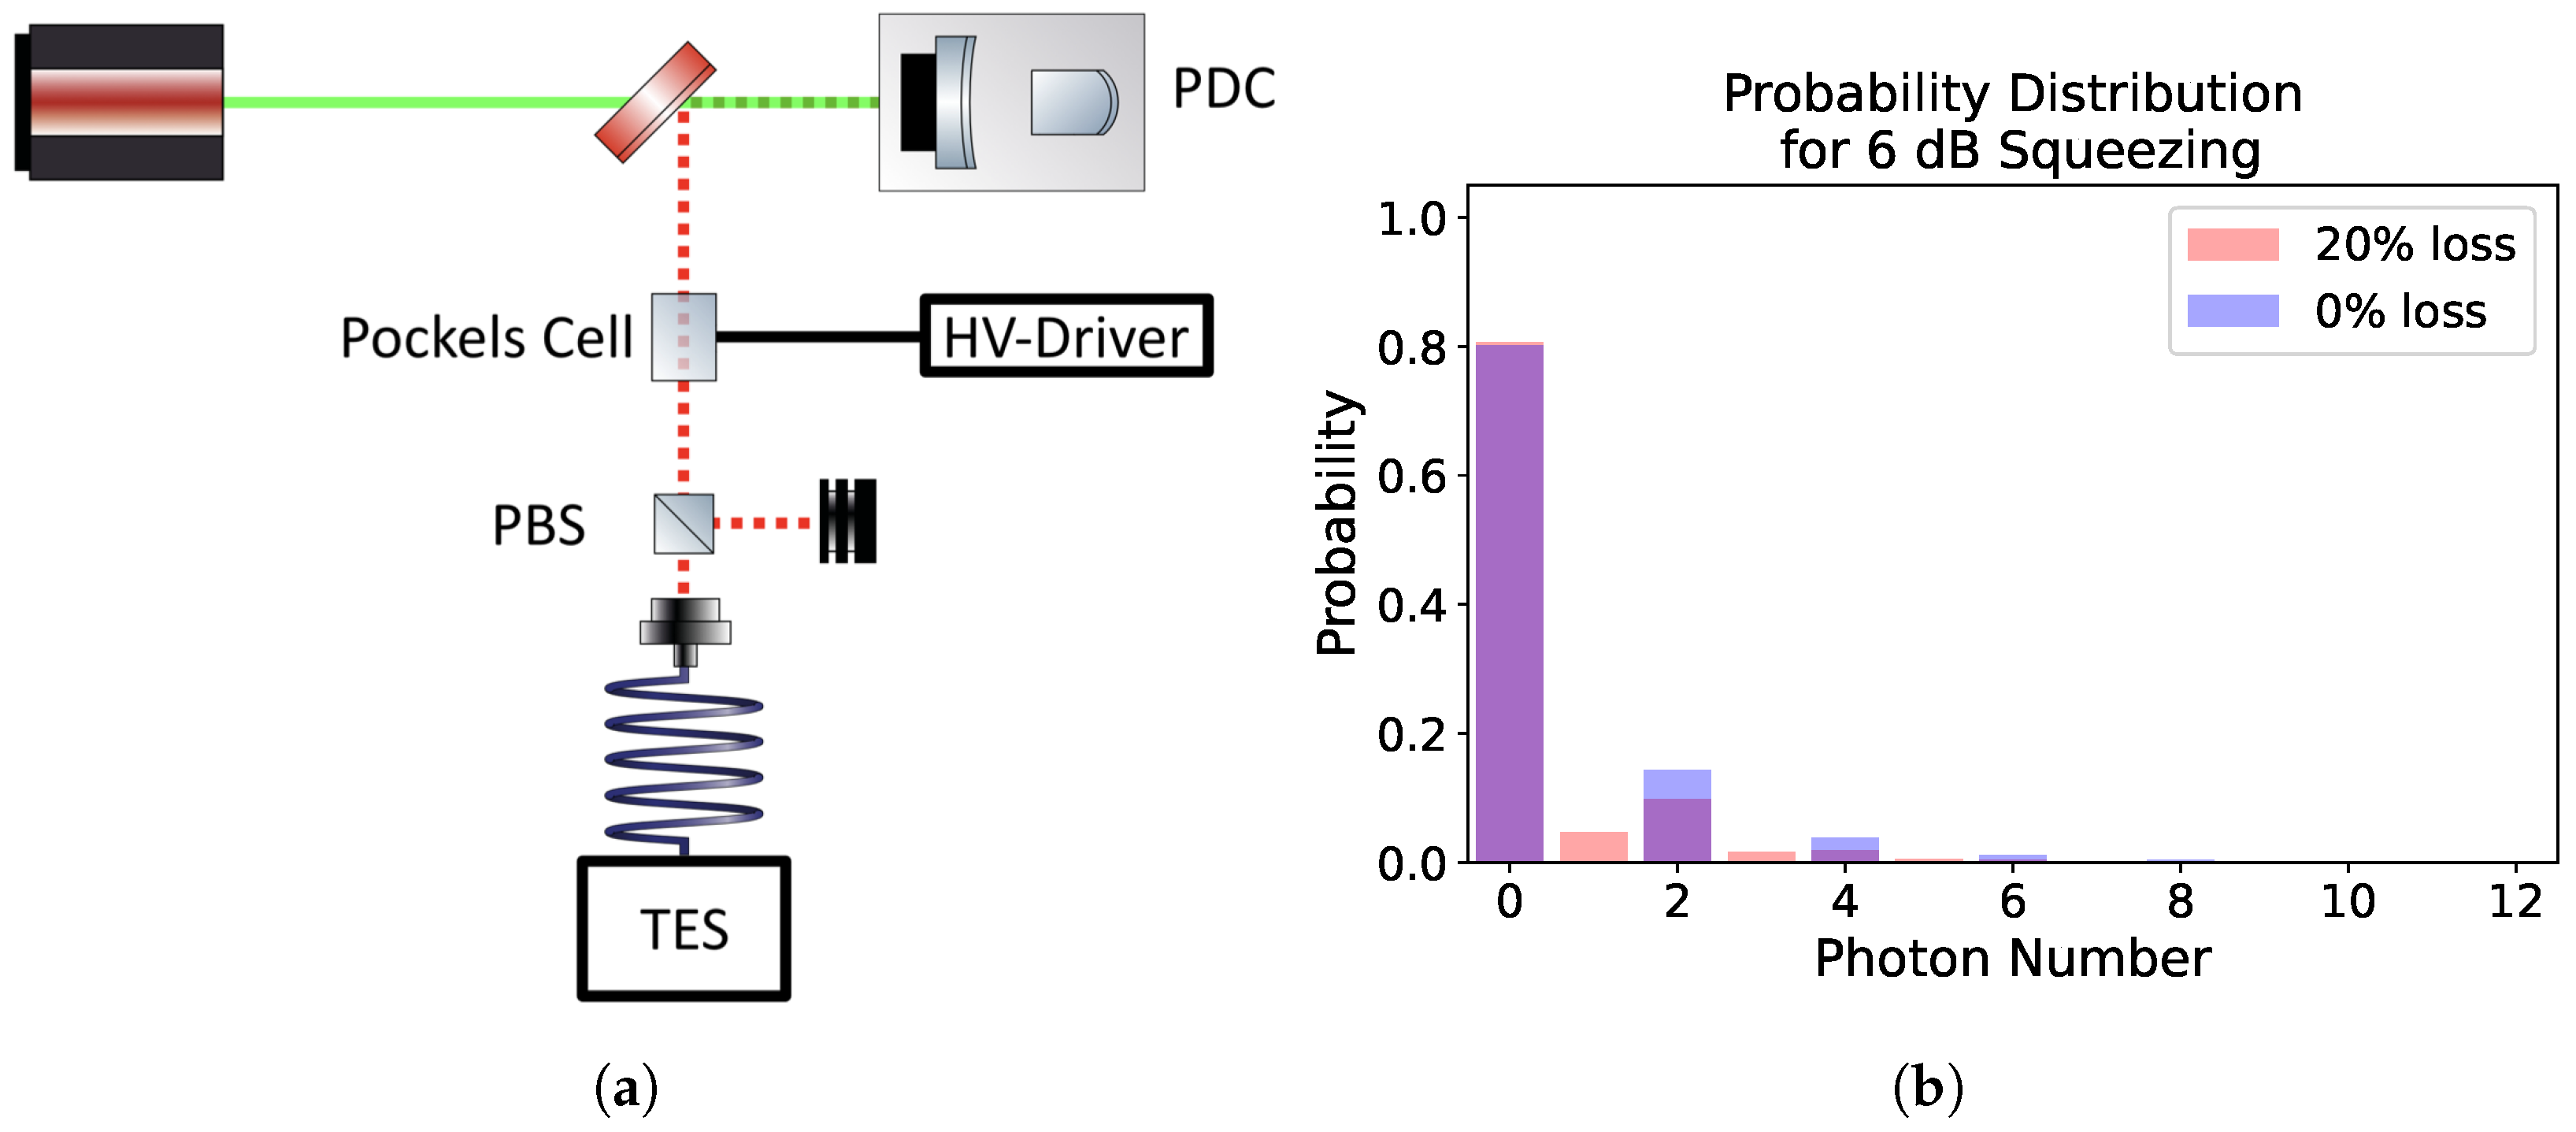
The photon-number resolving power of our detectors lends well to quantum sensing applications. One such application is the measurement of the even-number photon distribution of a squeezed vacuum source. In quantum computing, large-amplitude Schrödinger cat states are necessary for the generation of so-called “GKP” states, which are excellent qubit candidates due to their potential universality, scalability, and fault tolerance [22]. Photon subtraction is a standard approach for generating cat states using squeezed vacuum, which produces photons in integer multiples of two [23,24]. The amplitude of cat states increases with the number of subtracted photons, and it is therefore desirable to have the ability to accurately detect high-number photon pairs. To this end, we have proposed to use our TES detectors to measure the even-number photon distribution of a squeezed vacuum source created by a group at the University of Hamburg. We aim to establish a prototype experiment to measure squeezing around 6 dB, up to two photon pairs (four photons), before improving the setup to expand to higher squeezing levels, up to 15 dB, and thus a higher number of photon pairs.
Since our proposal, Ref. [25] have already used a Ti-Au TES to perform four-photon subtraction from a squeezed vacuum. Our proposal uses a complementary technique, employing Pockels cells instead of optical choppers, and will be focused on a high-statistics measurement of the photon number distribution. A simplified schematic of our proposed measurement, as well as an expected photon number distribution with 6 dB squeezing, are shown in Figure 8. We estimated the expected photon number distribution in the following way. The probability P S V S ( n , r ) of finding n photons in a squeezed vacuum state is 0 for odd photon number states, while for even number states, it is given by
P S V S ( 2 n , r ) = t a n h ( r ) n c o s h ( r ) ( 2 n ) ! 2 n n ! 2 ,
where r is the squeezing factor. To account for losses, we use the photon distribution for a Fock N state with loss l, which is given by the binomial distribution (see Ref. [26])
P ( n , N , l ) = N n ( 1 l ) n · l ( N n ) .
We finally estimated the photon number distribution for a lossy squeezed state by summing over the individual distributions for each Fock state weighted by their probability P S V S ( n , r )
P l o s s y ( l , n , r ) = i = 0 P S V S ( i , r ) · binomial ( n , i , l ) .
We expect to begin measurements in the coming months.

3.3. Secondary Detector for ALPS II

The ALPS II experiment at DESY searches for axions and axion-like particles using the “Light-Shining-Through-a-Wall” technique, taking advantage of the axion coupling to photons [27]. A strong infrared laser shines through a high magnetic field region, where infrared photons may convert to axions, traverse a light-tight barrier, and be reconverted to infrared photons in a second magnetic field region. Mode-matched optical cavities in the conversion and regeneration regions increase the probability of photon conversion and reconversion, allowing ALPS to surpass the sensitivity of previous-generation experiments. The success of ALPS II relies on the ability to detect the reconverted infrared photons. At the target sensitivity for the coupling of axions to two photons, g a γ γ 2 × 10 11 Ge V 1 , the signal rate is expected to be about 1 photon/day (∼ 10 5 Hz). To successfully detect this signal, ALPS II requires a detector with a background rate less than 1 photon/day, or < 7.7 · 10 6 Hz, for a 5 σ detection after 20 measurement days. ALPS II currently employs a heterodyne detection scheme [28], which has proven very successful. The first science campaign was performed in Spring 2024, and the results will be available soon. In case of a detection with the heterodyne detector, an independent detector with different systematics is necessary to confirm the signal. With low dark count rates, good energy resolution (∼5% at 1064 nm [18]), and high quantum-efficiency, our TES detector systems are good candidates. To be successful in ALPS II, we still need to demonstrate a high SDE, as outlined in Section 2.2, and to reduce the fiber-coupled dark count rate after background rejection in data analysis, which is currently ∼ 10 4 Hz. New optics will also be necessary to couple the TES to the ALPS II system. We discussed our efforts to further reduce the background rates for fiber-coupled experiments in Section 2.4, including by using a cold optical filter.

4. Conclusions and Future Work

TES-based detectors have great potential for fundamental physics searches due to their energy and photon-number resolution, high detection efficiency, and low dark count rates. At DESY, we are characterizing TES detectors and using them for fundamental physics searches in two fully equipped laboratories. We have found post-analysis dark count rates as low as 6.9 · 10 6 Hz [5] and energy resolution as good as 5% [18] in the region around 1064 nm. We calibrated our detectors from about 0.76 to 1.41 eV, and are able to estimate a system detection efficiency of >80%. In the future, we expect improvements in our efficiency determination by using an upgraded setup with a pulsed laser system. Simulations indicate that we have a good understanding of our background sources both with a fiber (blackbody radiation [18]) and without a fiber (zirconia from fiber sleeves [6]) attached. Experimental efforts are currently underway to mitigate backgrounds from blackbody radiation using a cold filter bench with narrow-band optical filter, and transmissions up to 60% without the optical filter present have been achieved.
In addition to our characterization efforts, we have performed a measurement to search for direct dark matter with our TES detectors [21], and have proposals to use our detectors in measurements of quantum-squeezed light and as a secondary detector for the ALPS II experiment.
We are using the insights gained from our characterization efforts and physics searches to continue making advances in low-background detection using TESs. To this end, we have been working with NIST and PTB on future detector designs. One example is a detector module without fiber sleeves. This is useful in applications in experiments where no optical fiber is necessary, such as direct dark matter searches. Removal of the fiber sleeve removes a known zirconia background, and may enable more sensitive searches. Such a module has been prepared, and future searches for direct dark matter are planned in the coming years.

Author Contributions

Conceptualization, K.-S.I., F.J., A.L., M.M. and G.O.; experimental efforts, K.-S.I., M.M., D.M., G.O., E.R., J.A.R.G. and C.S.; simulations, J.A.R.G.; data analysis, M.M., G.O., E.R., J.A.R.G. and C.S.; writing— original draft preparation, G.O.; writing— reviewing and editing, K.-S.I., F.J., A.L., M.M., D.K.N., G.O., E.R., J.A.R.G. and C.S.; supervision, R.H.H., F.J., A.L. and M.M.; project administration, R.H.H., F.J. and A.L.; funding acquisition, R.H.H., K.-S.I., F.J., A.L., M.M. and G.O. All authors have read and agreed to the published version of the manuscript.

Funding

Manuel Meyer and Elmeri Rivasto acknowledge the support given by the European Research Council (ERC) under the European Union’s Horizon 2020 research and innovation program, grant agreement No. 948689 (AxionDM). We acknowledge the support given by the Deutsche Forschungsgemeinschaft (DFG, German Research Foundation) under Germany’s Excellence Strategy—EXC 2121 “Quantum Universe”—390833306. Additionally, Robert H. Hadfield, Dmitry Morozov, and Devendra Kumar Namburi thank the UK Science and Technology Facilities Council (STFC) for the funding given through the project ‘Quantum Enhanced Interferometry for New Physics’ (STFC awards ST/T005920/1, ST/W006278/1, ST/Y004396/1).

Institutional Review Board Statement

Not applicable.

Informed Consent Statement

Not applicable.

Data Availability Statement

Data is contained within the article.

Acknowledgments

We thank Adriana Lita and the late Sae Woo Nam from the National Institute of Standards and Technology, USA, for the TES devices. We thank Joern Beyer and Marco Schmidt from Physikalisch-Technische Bundesanstalt and Humboldt Universität zu Berlin, Berlin, Germany, for the SQUID modules, and vital advice and support. We also thank Stephan Grebien from Universität Hamburg, for contributing to the experimental design of the squeezed light project and corresponding simulations.

Conflicts of Interest

The authors declare no conflicts of interest.

References

  1. Irwin, K.D.; Hilton, G.C. Transition-Edge Sensors. In Cryogenic Particle Detection; Enss, C., Ed.; Springer: Berlin/Heidelberg, Germany, 2005; Volume 99, p. 63. [Google Scholar] [CrossRef]
  2. Lita, A.; Calkins, B.; Pellouchoud, L.; Miller, A.; Nam, S. Superconducting transition-edge sensors optimized for high-efficiency photon-number resolving detectors. In Proceedings of the SPIE Symposium on SPIE Defense, Security, and Sensing, Orlando, FL, USA, 5–9 April 2010; Volume 7681. [Google Scholar] [CrossRef]
  3. Schmidt, M.; von Helversen, M.; López, M.; Gericke, F.; Schlottmann, E.; Heindel, T.; Kück, S.; Reitzenstein, S.; Beyer, J. Photon-Number-Resolving Transition-Edge Sensors for the Metrology of Quantum Light Sources. J. Low Temp. Phys. 2018, 193, 1243–1250. [Google Scholar] [CrossRef]
  4. Drung, D.; Abmann, C.; Beyer, J.; Kirste, A.; Peters, M.; Ruede, F.; Schurig, T. Highly Sensitive and Easy-to-Use SQUID Sensors. IEEE Trans. Appl. Supercond. 2007, 17, 699–704. [Google Scholar] [CrossRef]
  5. Shah, R. A TES Detector for ALPS II: Characterising a Cryogenic, Low-Background, Low Energy Single Photon Detector. Ph.D. Thesis, Mainz University, Mainz, Germany, 2023. [Google Scholar] [CrossRef]
  6. Rubiera Gimeno, J.A. Optimizing a Transition Edge Sensor Detector System for Low Flux Infrared Photon Measurements at the ALPS II Experiment. Ph.D. Thesis, Staats-und Universitätsbibliothek Hamburg, Hamburg, Germany, 2024. [Google Scholar]
  7. Meyer, M.; Isleif, K.; Januschek, F.; Lindner, A.; Othman, G.; Rubiera Gimeno, J.A.; Schwemmbauer, C.; Schott, M.; Shah, R. A First Application of Machine and Deep Learning for Background Rejection in the ALPS II TES Detector. Ann. Phys. 2024, 536, 2200545. [Google Scholar] [CrossRef]
  8. Jay, J.A. An Overview of Macrobending and Microbending of Optical Fibers; Corning Inc.: New York, NY, USA, 2010. [Google Scholar]
  9. Schwemmbauer, C.; Hadas, G.D.; Hochberg, Y.; Isleif, K.; Januschek, F.; Lehmann, B.V.; Lindner, A.; Lita, A.E.; Meyer, M.; Othman, G.; et al. First direct search for light dark matter interactions in a transition-edge sensor. arXiv 2025, arXiv:2506.18982. [Google Scholar] [CrossRef]
  10. Dreyling-Eschweiler, J.; Bastidon, N.; Döbrich, B.; Horns, D.; Januschek, F.; Lindner, A. Characterization, 1064 nm photon signals and background events of a tungsten TES detector for the ALPS experiment. J. Mod. Opt. 2015, 62, 1132–1140. [Google Scholar] [CrossRef]
  11. Bastidon, N. The Cryogenic Photon Detection System for the ALPS II Experiment: Characterization, Optimization and Background Rejection. Ph.D. Thesis, Universität Hamburg, Hamburg, Germany, 2016. [Google Scholar]
  12. Rubiera Gimeno, J.A.; Januschek, F.; Isleif, K.S.; Lindner, A.; Meyer, M.; Othman, G.; Schwemmbauer, C.; Shah, R. A TES system for ALPS II - Status and Prospects. Proc. Sci. 2023, 449, 567. [Google Scholar] [CrossRef]
  13. Rubiera Gimeno, J.A.; Isleif, K.S.; Januschek, F.; Lindner, A.; Meyer, M.; Othman, G.; Schott, M.; Shah, R.; Sohl, L. The TES detector of the ALPS II experiment. Nucl. Instrum. Methods Phys. Res. Sect. A Accel. Spectrometers Detect. Assoc. Equip. 2023, 1046, 167588. [Google Scholar] [CrossRef]
  14. López, M.; Hofer, H.; Kück, S. Detection efficiency calibration of single-photon silicon avalanche photodiodes traceable using double attenuator technique. J. Mod. Opt. 2015, 62, 1732–1738. [Google Scholar] [CrossRef] [PubMed]
  15. Gerrits, T.; Migdall, A.; Bienfang, J.C.; Lehman, J.; Nam, S.W.; Splett, J.; Vayshenker, I.; Wang, J. Calibration of free-space and fiber-coupled single-photon detectors. Metrologia 2020, 57, 015002. [Google Scholar] [CrossRef]
  16. Agostinelli, S.; Allison, J.; Amako, K.; Apostolakis, J.; Araujo, H.; Arce, P.; Asai, M.; Axen, D.; Banerjee, S.; Barrand, G.; et al. Geant4—A simulation toolkit. Nucl. Instrum. Methods Phys. Res. Sect. A Accel. Spectrometers Detect. Assoc. Equip. 2003, 506, 250–303. [Google Scholar] [CrossRef]
  17. COMSOL Multiphysics ® v. 6.2. COMSOL AB, Stockholm, Sweden. Available online: https://www.comsol.com (accessed on 2 September 2025).
  18. Rubiera Gimeno, J.A.; Isleif, K.S.; Januschek, F.; Lindner, A.; Meyer, M.; Othman, G.; Rivasto, E.; Shah, R.; Schwemmbauer, C. Simulation and measurement of Black Body Radiation background in a Transition Edge Sensor. arXiv 2025, arXiv:2505.08555. [Google Scholar] [CrossRef]
  19. Cryo Tip Tilt Piston Stages, by JPE. Available online: https://www.jpe-innovations.com/cryo-uhv-products/cryo-tip-tilt-piston-stages/ (accessed on 7 January 2025).
  20. Hochberg, Y.; Zhao, Y.; Zurek, K.M. Superconducting Detectors for Superlight Dark Matter. Phys. Rev. Lett. 2016, 116, 011301. [Google Scholar] [CrossRef] [PubMed]
  21. Schwemmbauer, C.; Hochberg, Y.; Isleif, K.S.; Januschek, F.; Lehmann, B.; Lindner, A.; Lita, A.E.; Meyer, M.; Nam, S.W.; Othman, G.; et al. Direct dark matter searches using ALPS II’s TES detection system. Proc. Sci. 2024, 449, 120. [Google Scholar] [CrossRef]
  22. Fukui, K.; Takeda, S. Building a large-scale quantum computer with continuous-variable optical technologies. J. Phys. B 2022, 55, 012001. [Google Scholar] [CrossRef]
  23. Cochrane, P.T.; Milburn, G.J.; Munro, W.J. Macroscopically distinct quantum-superposition states as a bosonic code for amplitude damping. Phys. Rev. A 1999, 59, 2631–2634. [Google Scholar] [CrossRef]
  24. Ralph, T.C.; Gilchrist, A.; Milburn, G.J.; Munro, W.J.; Glancy, S. Quantum computation with optical coherent states. Phys. Rev. A 2003, 68, 042319. [Google Scholar] [CrossRef]
  25. Endo, M.; Nomura, T.; Sonoyama, T.; Takahashi, K.; Takasu, S.; Fukuda, D.; Kashiwazaki, T.; Inoue, A.; Umeki, T.; Nehra, R.; et al. High-Rate Four Photon Subtraction from Squeezed Vacuum: Preparing Cat State for Optical Quantum Computation. arXiv 2025, arXiv:2502.08952. [Google Scholar] [CrossRef]
  26. Leonhardt, U. Measuring the Quantum State of Light; Cambridge University Press: Cambridge, UK, 1997; Chapter 4.1.3. [Google Scholar]
  27. Bähre, R.; Döbrich, B.; Dreyling-Eschweiler, J.; Ghazaryan, S.; Hodajerdi, R.; Horns, D.; Januschek, F.; Knabbe, E.A.; Lindner, A.; Notz, D.; et al. Any light particle search II—Technical Design Report. J. Instrum. 2013, 8, T09001. [Google Scholar] [CrossRef]
  28. Hallal, A.; Messineo, G.; Ortiz, M.D.; Gleason, J.; Hollis, H.; Tanner, D.; Mueller, G.; Spector, A. The heterodyne sensing system for the ALPS II search for sub-eV weakly interacting particles. Phys. Dark Universe 2022, 35, 100914. [Google Scholar] [CrossRef]
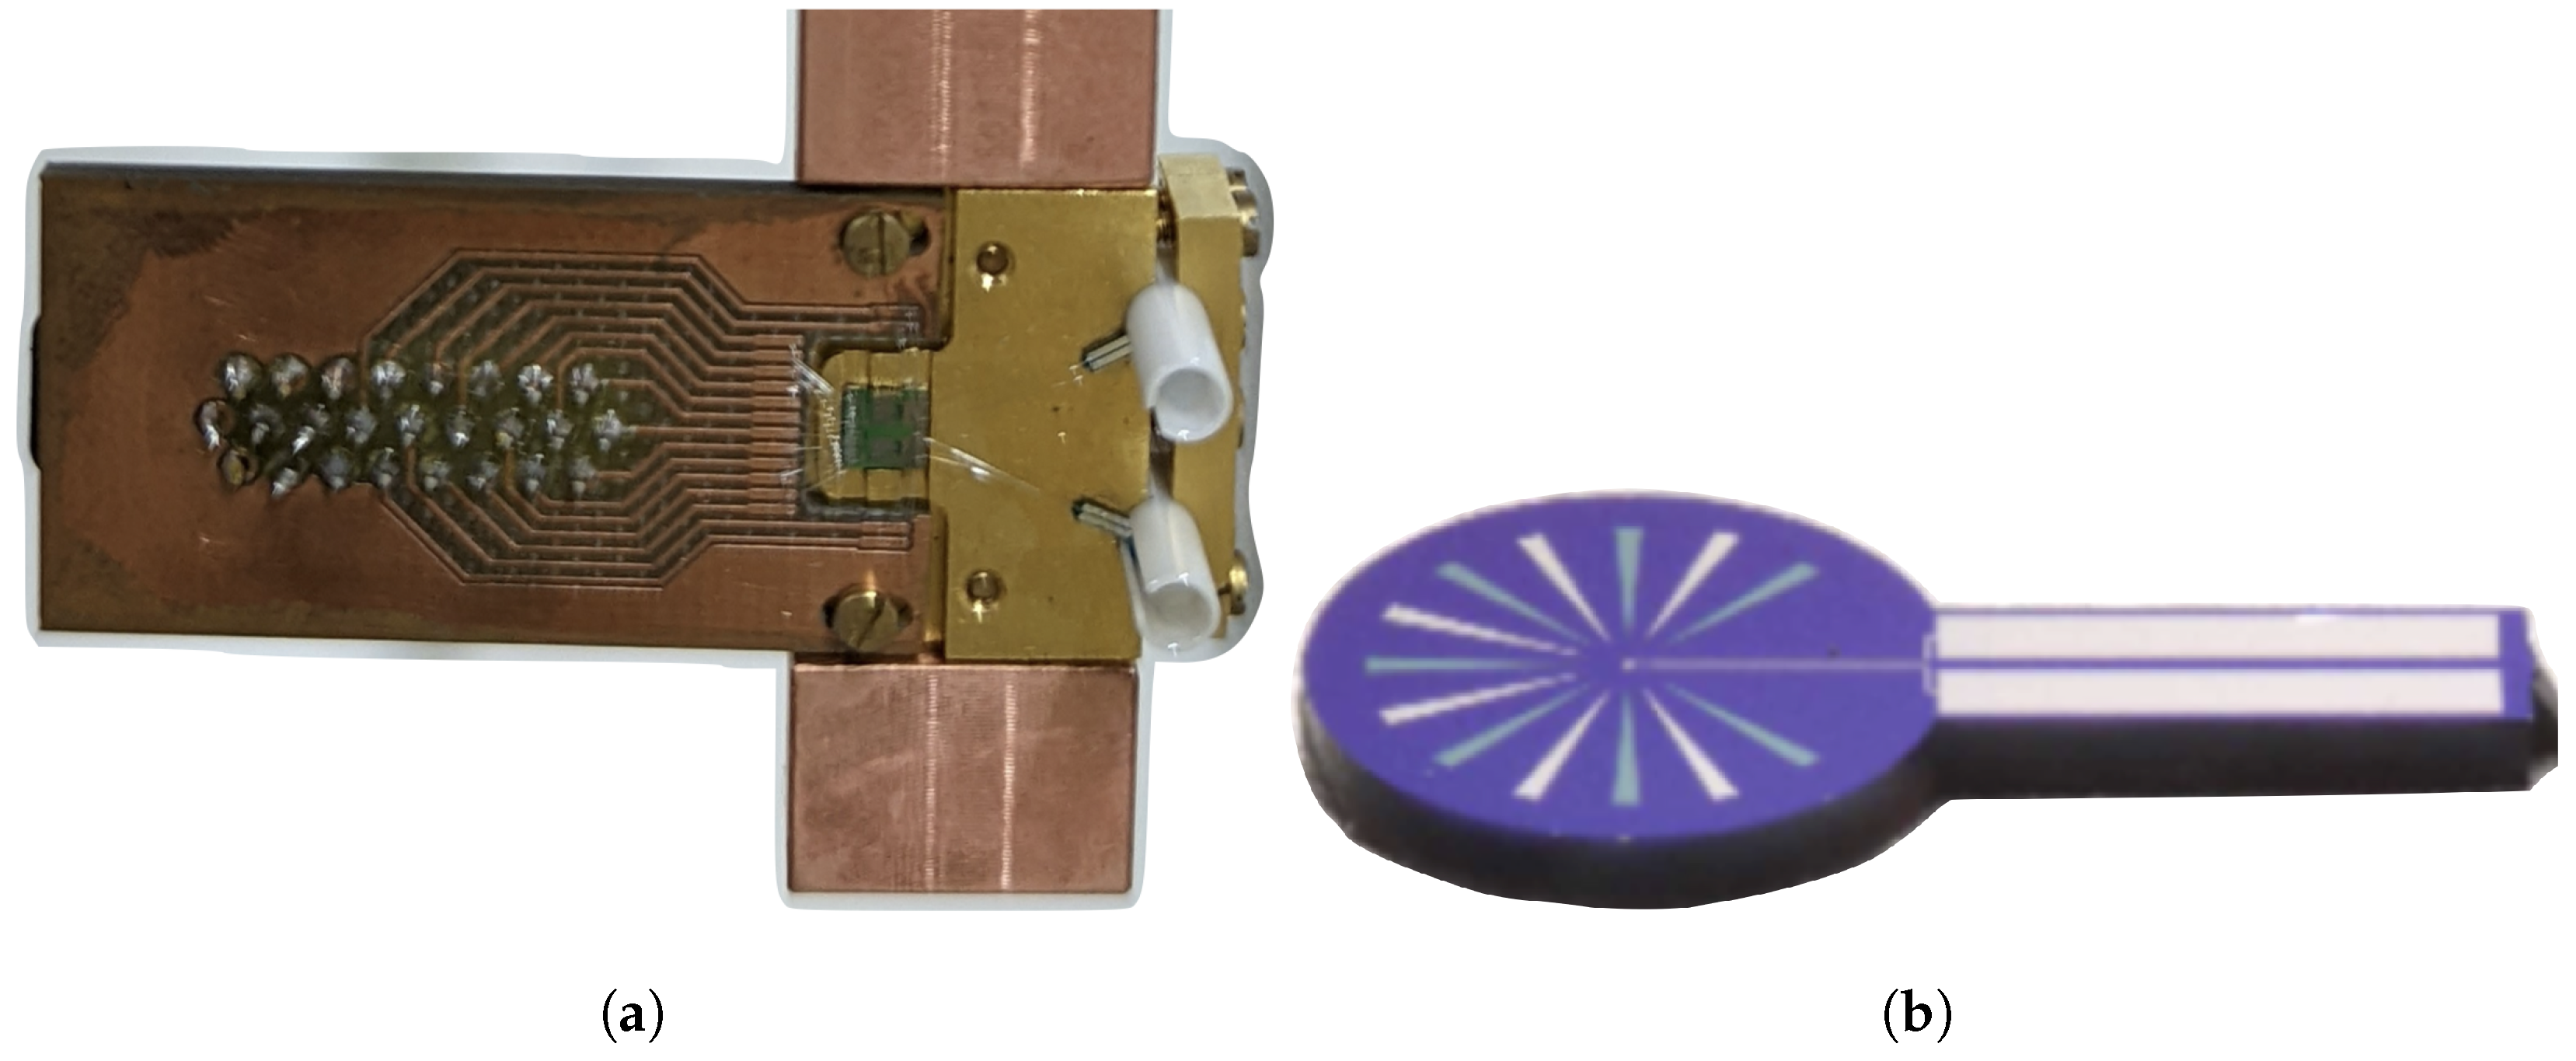
Figure 1. (a) Two-channel TES module, prepared by PTB, installed on a cold finger (partially visible). (b) Individual TES chip, designed and manufactured by NIST. Taken from Ref. [2]. The TES chips are installed on the TES module (a) within the white cylindrical fiber sleeves (zirconia), on the right-hand side of the image.
Psf 11 00002 g001
Figure 2. Example voltage pulse from a 1064 nm laser with corresponding fit. The integral of this pulse is proportional to the particle energy.
Psf 11 00002 g002
Figure 3. Cartoon of an example characterization measurement for energy calibration.
Psf 11 00002 g003
Figure 4. Summary of the energy calibration efforts. (a) Example voltage pulse from a 1064 nm laser with corresponding fit. (b) Histograms of the pulse integrals for each wavelength, with skewed Gaussian fit. (c) Energy calibration curve with linear fit. (d) Energy resolution. Errorbars are calculated from Gaussian error propagation based on the uncertainty of the corresponding fit parameters.
Psf 11 00002 g004aPsf 11 00002 g004b
Figure 5. Simplified cartoon of the experimental setup for dedicated efficiency measurements. All transmission lines indicate optical fiber.
Psf 11 00002 g005
Figure 6. CAD drawing of the current design of the optical filter bench on a vibrational isolation stage. For an idea of scale, the longest dimension here is about 20 cm.
Psf 11 00002 g006
Figure 7. Exclusion curves for DM-electron scattering with a light mediator in the ∼MeV mass range, originally motivating the use of TESs. The dotted line shows results from a first-generation experiment employing SNSDPs, and the orange line shows the projected sensitivity based on a 1 μ gyr exposure. The blue shaded area represents a preliminary projection for a possible exclusion limit using our TESs. For complete information, see Ref. [21]. Since this presentation, a new generation of SNSPDs has surpassed preliminary TES projections. Updated exclusion curves for both TES and SNSPD can be found in Ref. [9] Figure credit: Benjamin Lehmann.
Psf 11 00002 g007
Figure 8. Proposed measurement scheme to use our TES detectors to measure quantum-squeezed light. (a) Simplified experimental setup. PDC denotes parametric down-conversion, and PBS denotes polarizing beam splitter. (b) Simulation of the expected photon distribution, assuming 6 dB squeezing. The photons from a squeezed vacuum should only come in integer-multiples of two; odd-number photons arise due to losses. Figure credit: Stephan Grebien.
Psf 11 00002 g008
Disclaimer/Publisher’s Note: The statements, opinions and data contained in all publications are solely those of the individual author(s) and contributor(s) and not of MDPI and/or the editor(s). MDPI and/or the editor(s) disclaim responsibility for any injury to people or property resulting from any ideas, methods, instructions or products referred to in the content.