
Effect of Cricket (Acheta domesticus) Flour Added to Mixture Powder to Obtain a Traditional Beverage (Chucula) on Its Physicochemical Characteristics †


 , and
, and
Abstract
:1. Introduction
2. Materials and Methods
2.1. Raw Materials and Sample Preparation
2.2. Analytical Determinations
2.2.1. Humidity
2.2.2. Water Absorption Index and Water Solubility Index
2.2.3. Crude Protein
2.2.4. Optical Properties
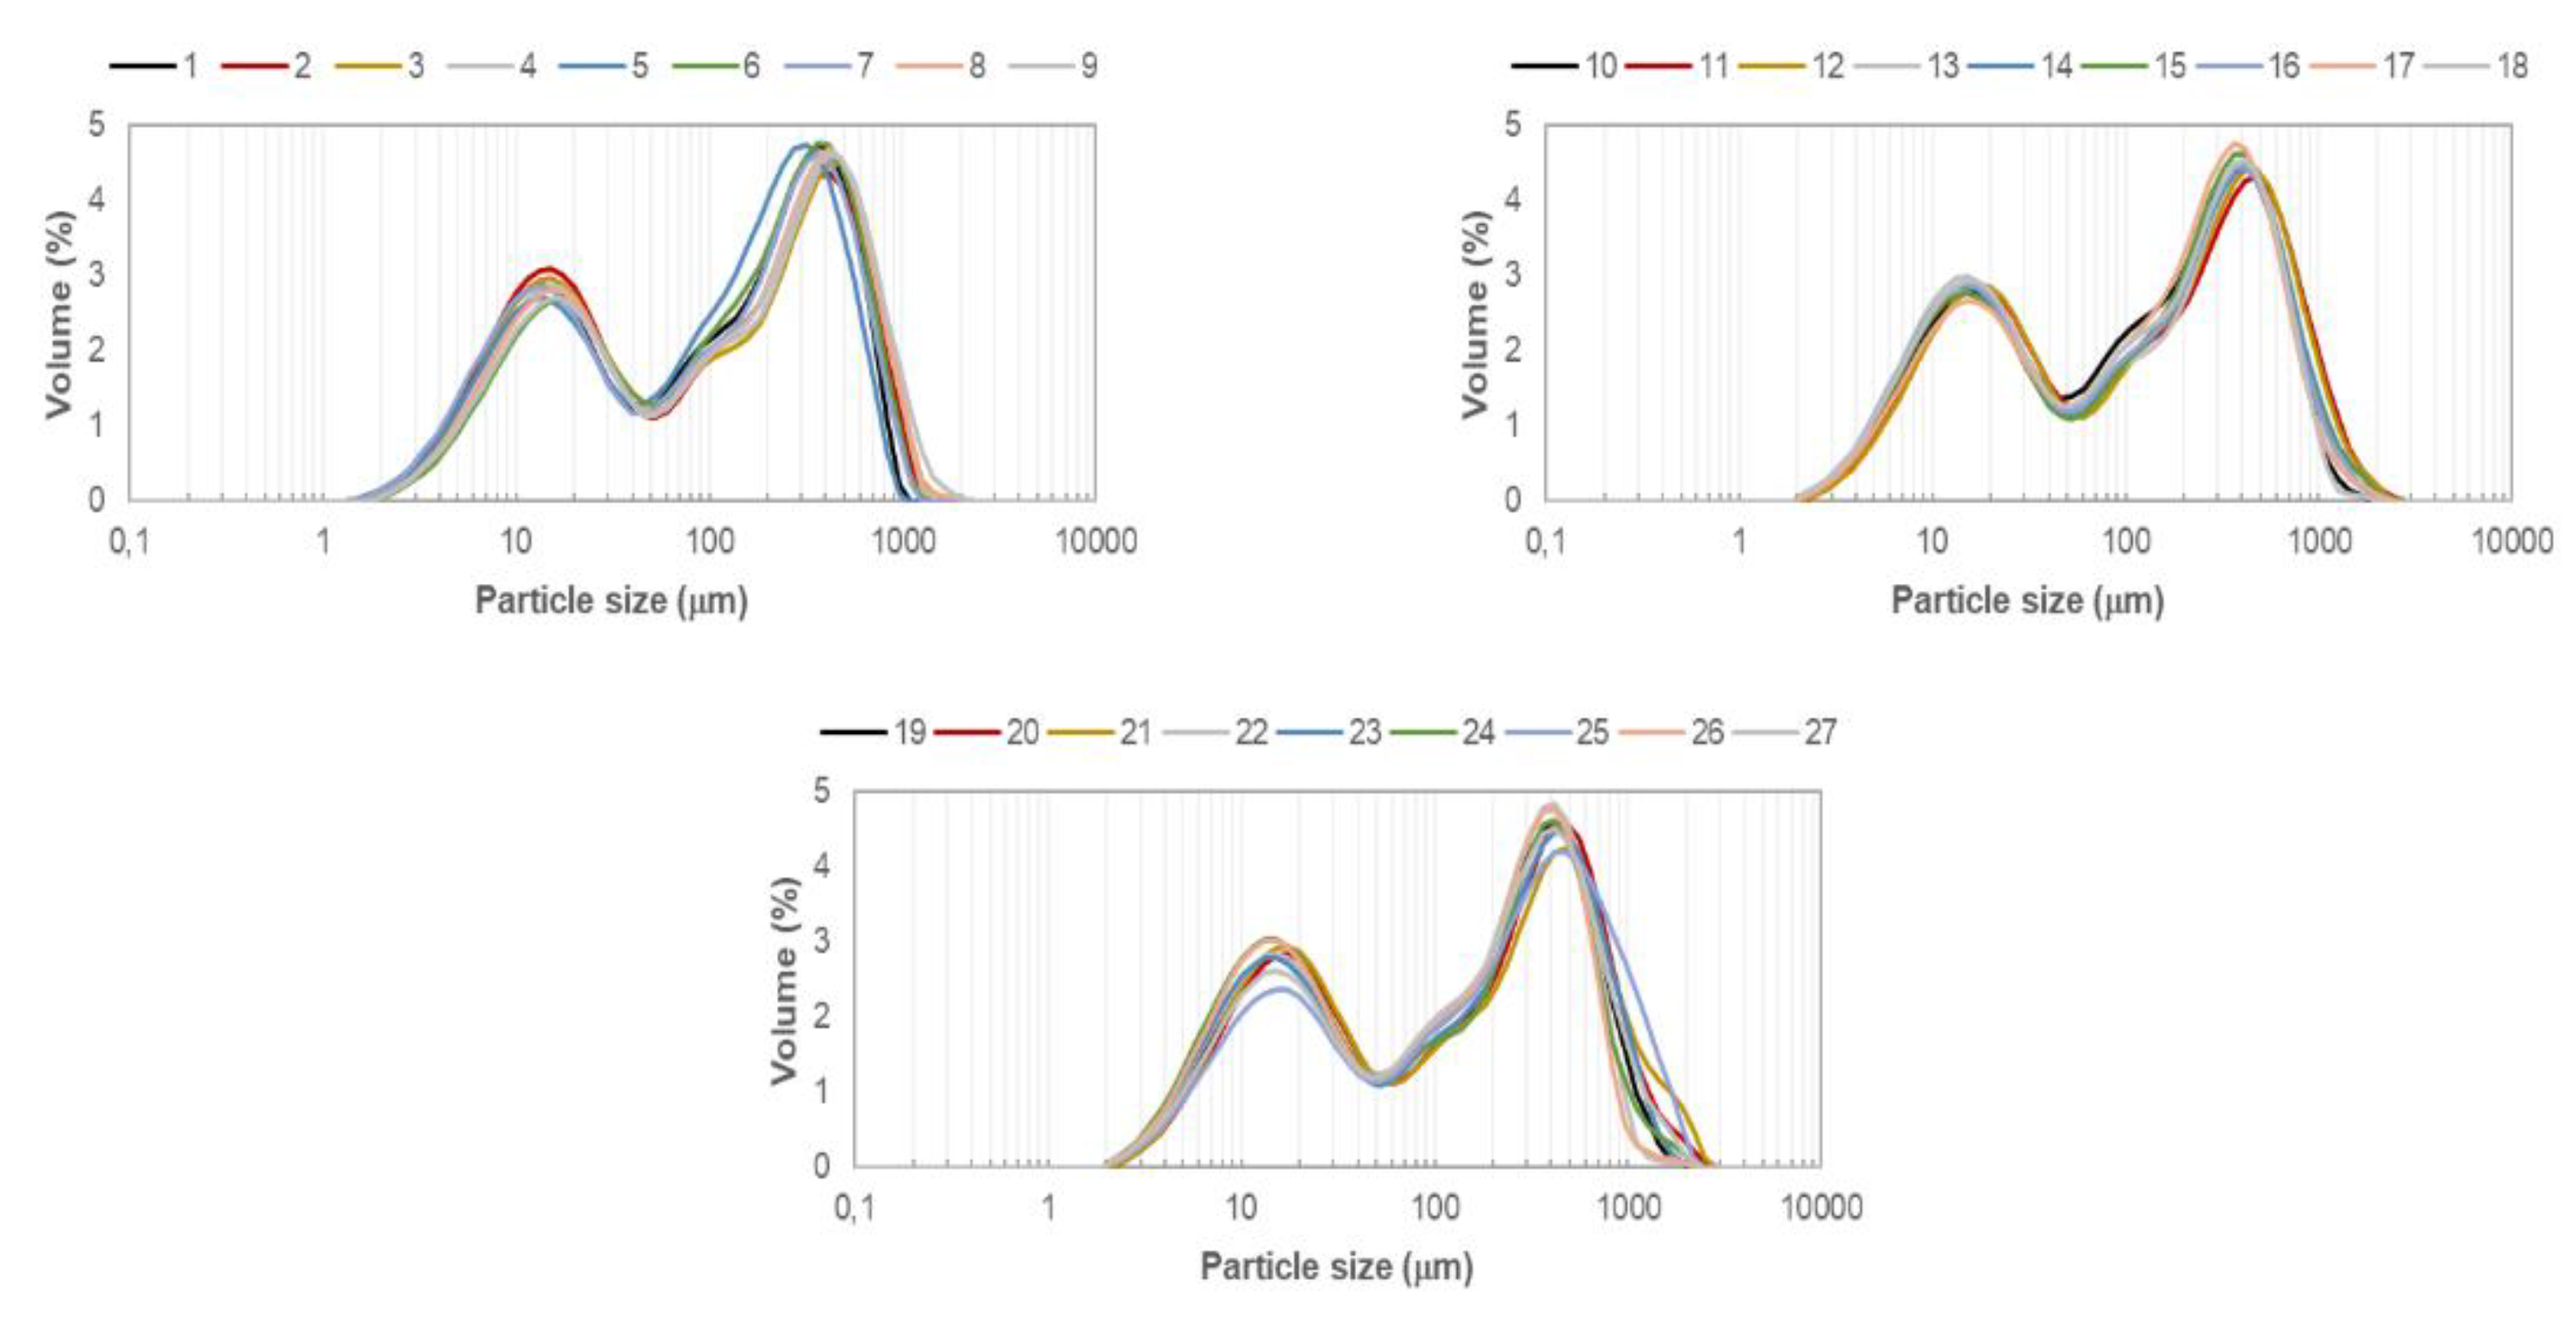
2.2.5. Particle Size Distribution
2.3. Statical Analysis
3. Results and Discussion
Author Contributions
Funding
Institutional Review Board Statement
Informed Consent Statement
Data Availability Statement
Conflicts of Interest
References
- Bustos, J. Mezcla de Tradición y Vanguardia en la Sostenibilidad de la Cadena de Valor de la Chucula. Master’s Thesis, Biotrade and Sustainable Development, Catholic University of Perú, Lima, Peru, 2019. [Google Scholar]
- Rincón, S. Cocinas Tradicionales en Riesgo del Departamento de Cundinamarca; Bogotá Workshop School Foundation: Bogotá, Colombia, 2012. [Google Scholar]
- Van Huis, A.; Van Itterbeeck, J.; Klunder, H.; Mertens, E.; Halloran, A.; Muir, G.; Vantomme, P. Edible Insects: Future Prospects for Food and Feed Security, 1st ed.; FAO Forestry Paper: Rome, Italy, 2013; p. 201. [Google Scholar]
- Singh, N.; Smith, A.C. A comparison of wheat starch, whole wheat meal and oat flour in the extrusion cooking process. J. Food Eng. 1997, 34, 15–32. [Google Scholar] [CrossRef]
- Müller, J.; González-Martínez, C.; Chiralt, A. Poly (lactic) acid (PLA) and starch bilayer films, containing cinnamaldehyde, obtained by compression moulding. Eur. Polym. J. 2019, 95, 56–70. [Google Scholar] [CrossRef]
- Durá, S. Estudio del Valor Nutricional y Functional del Cacao en Polvo con Diferentes Grados de Alcanilización. Master’s Thesis, Food Science and Technology, Polytechnic University of Valencia, Valencia, Spain, 2016. [Google Scholar]
- Barrios, K.B. Desarrollo de un Prototipo de Tortilla Funcional de Maíz (Zea mays) y Harina de Grillo (Acheta domesticus) Como Fuente de Proteína para Dieta Humana. Ph.D. Thesis, Food Agroindustry, Panamerican Agricultural School, Tegucigalpa, Honduras, 2017. [Google Scholar]
- Johansson, M.; Xanthais, E.; Langton, M.; Menzel, C.; Vilaplana, F.; Johansson, D.P.; Lopez-Sánchez, P. Mixed legume systems of pea protein and unrefined lentil fraction: Textural properties and microstructure. LWT Food Sci. Technol. 2021, 144, 111212. [Google Scholar] [CrossRef]
- Boukid, F.; Rosell, C.M.; Castellari, M. Pea protein ingredients: A mainstream ingredient to (re)formulate innovative foods beverages. Trends Food Sci. Technol. 2021, 110, 729–742. [Google Scholar] [CrossRef]
- Meza, C.D. Elaboración, Evaluación Nutrimental y Nutracéutica de una Botana a Partir de Harina Extruidas Maíz/Frijol. Ph.D. Thesis, Food Science and Technology, Autonomous University of Queretaro, Santiago de Querétaro, Mexico, 2011. [Google Scholar]
- Margalef, A.; Bonomo, A.; Ggottifredi, J.C. Formulación y Desarrollo de Mezclas Extruidas de Maíz y Soja. Bachelor’s Thesis, Research Institute for the Chemical Industry, National University of Salta, Salta, Argentina, 1998. [Google Scholar]
- Talens, P. Evaluación del Color y Tolerancia de Color en Alimentos a Través del Espacio CIELAB. Academic Document, Department of Food Technology, Polytechnic University of Valencia, Valencia, Spain, 2017. [Google Scholar]

| Sample | CF | Cocoa | Flour | Humidity (%) | CP (%) | WAI | WSI (%) |
|---|---|---|---|---|---|---|---|
| 1 | 1.13 | 26.25 | 72.62 | 2.962 ± 0.004 b | 16.55 ± 0.16 ihg | 2.37 ± 0.18 dcb | 13.3 ± 0.4 abcde |
| 2 | 0.00 | 30.00 | 70.00 | 2.96 ± 0.04 b | 16.4 ± 0.2 ih | 2.51 ± 0.07 cba | 12.7 ± 0.9 efg |
| 3 | 2.13 | 28.75 | 69.12 | 2.888 ± 0.002 bcd | 17.4 ± 0.2 fe | 2.7 ± 0.4 a | 13.4 ± 0.5 abc |
| 4 | 2.25 | 27.50 | 70.25 | 2.70 ± 0.03 fg | 17.23 ± 0.07 gfe | 2.25 ± 0.03 a | 13.3 ± 0.2 abcde |
| 5 | 7.00 | 25.00 | 68.00 | 2.43 ± 0.02 k | 19.6 ± 0.7 a | 2.31 ± 0.03 dcb | 13.17 ± 0.08 abcdef |
| 6 | 0.00 | 25.00 | 75.00 | 2.288 ± 0.003 lm | 17.9 ± 0.3 ed | 2.206 ± 0.006 d | 13.29 ± 0.13 abcde |
| 7 | 4.62 | 26.25 | 69.12 | 2.316 ± 0.106 l | 16.110 ± 0.014 i | 2.520 ± 0.006 ba | 12.72 ± 0.05 defg |
| 8 | 0.00 | 25.00 | 75.00 | 2.21 ± 0.02 m | 15.94 ± 0.12 i | 2.485 ± 0.015 cba | 12.554 ± 0.004 fg |
| 9 | 0.00 | 25.00 | 75.00 | 2.21 ± 0.02 m | 15.9 ± 0.4 i | 2.2 ± 0.2 d | 12.4 ± 0.5 g |
| 10 | 7.00 | 25.00 | 68.00 | 2.62 ± 0.02 h | 19.7 ± 0.3 a | 2.26 ± 0.03 d | 13.04 ± 0.13 bcdef |
| 11 | 2.25 | 27.50 | 70.25 | 2.8709 ± 0.0003 cd | 17.5 ± 0.3 fe | 2.292 ± 0.015 dc | 13.3 ± 0.3 abcde |
| 12 | 1.13 | 28.75 | 70.12 | 2.719 ± 0.017 f | 16.3 ± 0.7 ih | 2.33 ± 0.03 dcb | 12.9 ± 0.2 bcdefg |
| 13 | 0.00 | 30.00 | 70.00 | 2.861 ± 0.017 cd | 16.9 ± 0.3 hgf | 2.42 ± 0.03 dcb | 12.9 ± 0.4 cdefg |
| 14 | 1.13 | 28.75 | 70.12 | 2.53 ± 0.05 ij | 16.943 ± 0.019 hgf | 2.2612 ± 0.0105 d | 13.25 ± 0.09 abcde |
| 15 | 2.13 | 28.75 | 69.12 | 2.61 ± 0.06 hi | 17.36 ± 0.05 fe | 2.30 ± 0.05 dcb | 13.011 ± 0.118 bcdefg |
| 16 | 2.13 | 28.75 | 69.12 | 2.83 ± 0.05 de | 17.34 ± 0.06 fe | 2.34 ± 0.05 dcb | 13.56 ± 0.07 ab |
| 17 | 4.62 | 26.25 | 69.12 | 2.51 ± 0.03 jk | 17.462 ± 0.002 fe | 2.36 ± 0.18 dcb | 13.1 ± 0.7 abcdef |
| 18 | 2.25 | 27.50 | 70.25 | 2.64 ± 0.02 gh | 17.5 ± 0.3 fe | 2.31 ± 0.07 dcb | 13.1 ± 0.3 bcdef |
| 19 | 1.13 | 26.25 | 72.62 | 2.74 ± 0.06 f | 17.72 ± 0.14 ed | 2.29 ± 0.09 dc | 13.10 ± 0.18 bcdef |
| 20 | 1.13 | 28.75 | 70.12 | 2.87 ± 0.07 cd | 17.6 ± 0.2 fed | 2.331 ± 0.019 dcb | 13.41 ± 0.06 abc |
| 21 | 2.00 | 30.00 | 68.00 | 2.82 ± 0.05 de | 17.544 ± 0.119 fe | 2.32 ± 0.05 dcb | 13.38 ± 0.04 abcd |
| 22 | 1.13 | 26.25 | 72.62 | 2.761 ± 0.013 ef | 16.5 ± 0.5 ih | 2.213 ± 0.006 d | 13.77 ± 0.04 a |
| 23 | 2.00 | 30.00 | 68.00 | 2.96 ± 0.02 b | 17.6 ± 0.6 fed | 2.41 ± 0.02 dcb | 12.95 ± 0.19 bcdefg |
| 24 | 0.00 | 30.00 | 70.00 | 3.043 ± 0.019 a | 16.5 ± 0.4 ih | 2.34 ± 0.07 dcb | 12.9 ± 0.9 bcdefg |
| 25 | 7.00 | 25.00 | 68.00 | 2.938 ± 0.015 bc | 19.5 ± 0.2 ba | 2.31 ± 0.06 dcb | 13.2 ± 0.9 abcdef |
| 26 | 2.00 | 30.00 | 68.00 | 1.33 ± 0.05 n | 18.3 ± 0.9 dc | 2.35 ± 0.03 dcb | 12.8 ± 0.2 cdefg |
| 27 | 4.62 | 26.25 | 69.12 | 0.941 ± 0.003 ñ | 18.74 ± 0.14 cb | 2.32 ± 0.02 dcb | 12.7 ± 0.2 efg |
| Sample | D (4.3) | d (0.1) | d (0.5) | d (0.9) |
|---|---|---|---|---|
| 1 | 209 ± 8 fghij | 8.32 ± 0.09 ef | 119 ± 8 efgh | 552 ± 22 fghi |
| 2 | 200 ± 13 hij | 7.58 ± 0.16 jk | 105 ± 9 h | 543 ± 37 fghi |
| 3 | 220 ± 27 defghij | 7.8 ± 0.4 ijk | 117 ± 21 efgh | 593 ± 69 cdefgh |
| 4 | 220 ± 20 defghij | 8.24 ± 0.17 efg | 124 ± 18 cdefgh | 584 ± 47 cdefgh |
| 5 | 195.7 ± 10.2 i | 8.8 ± 0.4 c | 127 ± 17 bcdefg | 500 ± 20 i |
| 6 | 207 ± 14 efghij | 9.2 ± 0.4 ab | 133.1 ± 11.3 bcdef | 530 ± 36 ghi |
| 7 | 219 ± 7 defghij | 8.15 ± 0.13 efgh | 126 ± 6 bcdefgh | 578 ± 21 defghi |
| 8 | 223 ± 17 cdefghij | 8.4 ± 0.3 de | 132 ± 16 bcdef | 581 ± 39 cdefgh |
| 9 | 243 ± 25 bcd | 8.8 ± 0.3 c | 146 ± 12 bc | 628 ± 66 bcde |
| 10 | 208 ± 32 efghij | 8.8 ± 0.5 c | 119 ± 22 defgh | 547 ± 81 fghi |
| 11 | 230 ± 26 bcdefgh | 8.4 ± 0.2 ef | 124 ± 14 cdefgh | 605 ± 69 bcdefg |
| 12 | 228 ± 31 bcdefghi | 8.4 ± 0.4 de | 129 ± 22 bcdefg | 591 ± 79 cdefgh |
| 13 | 224 ± 32 cdefghij | 8.0 ± 0.3 fghi | 119 ± 28 defgh | 593 ± 70 cdefgh |
| 14 | 237 ± 13 bcdef | 8.25 ± 0.13 efg | 129 ± 7 bcdefg | 614 ± 33 bcdef |
| 15 | 236 ± 27 bcdef | 8.4 ± 0.3 de | 140 ± 19 bcd | 601 ± 70 bcdefg |
| 16 | 224 ± 29 cdefghij | 8.2 ± 0.3 efgh | 125 ± 29 bcdefgh | 581 ± 75 cdefgh |
| 17 | 222 ± 30 defghij | 8.9 ± 0.5 bc | 138 ± 25 bcde | 558 ± 63 efghi |
| 18 | 204 ± 28 ghij | 8.3 ± 0.3 efg | 114 ± 16 fgh | 540 ± 70 fghi |
| 19 | 230 ± 37 bcdefg | 8.3 ± 0.2 ef | 136 ± 24 bcde | 600 ± 102 bcdefg |
| 20 | 237 ± 36 bcde | 8.05 ± 0.18 fghi | 135 ± 12 bcdef | 612 ± 98 bcdef |
| 21 | 256 ± 23 b | 7.9 ± 0.2 hij | 126 ± 13 bcdefgh | 672 ± 78 b |
| 22 | 209 ± 23 efghij | 8.1 ± 0.2 efgh | 125 ± 17 cdefgh | 542 ± 52 fghi |
| 23 | 248 ± 39 bcd | 8.0 ± 0.3 ghi | 143 ± 31 bc | 655 ± 100 bcd |
| 24 | 219 ± 40 defghij | 7.5 ± 0.2 k | 109 ± 25 gh | 576 ± 99 defghi |
| 25 | 315 ± 34 a | 9.5 ± 0.4 a | 187 ± 32 a | 833 ± 91 a |
| 26 | 198 ± 27 ij | 7.80 ± 0.14 ijk | 109 ± 14 gh | 519 ± 61 hi |
| 27 | 253 ± 35 bc | 8.7 ± 0.2 cd | 147 ± 17 b | 658 ± 103 bc |
| Sample | L* | a* | b* | h*ab | C*ab |
|---|---|---|---|---|---|
| 1 | 50.375 ± 0.107 g | 10.94 ± 0.04 mn | 16.10 ± 0.03 q | 55.80 ± 0.08 jkl | 19.46 ± 0.04 p |
| 2 | 48.3 ± 0.3 p | 12.28 ± 0.16 b | 17.91 ± 0.16 c | 55.58 ± 0.12 n | 21.71 ± 0.2 b |
| 3 | 44.24 ± 0.15 o | 13.47 ± 0.04 a | 18.675 ± 0.017 a | 54.20 ± 0.06 ñ | 23.03 ± 0.04 a |
| 4 | 50.65 ± 0.13 f | 11.37 ± 0.04 i | 17.32 ± 0.02 jk | 56.72 ± 0.09 cd | 20.72 ± 0.03 jk |
| 5 | 49.97 ± 0.05 i | 11.22 ± 0.04 jk | 17.13 ± 0.08 m | 56.77 ± 0.19 c | 20.48 ± 0.05 m |
| 6 | 50.793 ± 0.019 ef | 11.348 ± 0.005 i | 17.195 ± 0.010 lm | 56.58 ± 0.02 e | 20.602 ± 0.008 l |
| 7 | 51.73 ± 0.07 b | 11.01 ± 0.04 m | 16.460 ± 0.016 p | 56.23 ± 0.08 gh | 19.80 ± 0.03 o |
| 8 | 51.5 ± 0.4 c | 10.88 ± 0.09 n | 16.57 ± 0.14 o | 56.71 ± 0.04 cde | 19.83 ± 0.17 o |
| 9 | 51.46 ± 0.04 c | 11.080 ± 0.008 l | 16.90 ± 0.05 ñ | 56.74 ± 0.08 cd | 20.20 ± 0.04 n |
| 10 | 49.76 ± 0.03 jk | 11.615 ± 0.013 h | 17.643 ± 0.013 ef | 56.64 ± 0.03 cde | 21.122 ± 0.015 fg |
| 11 | 49.95 ± 0.03 i | 11.68 ± 0.02 gh | 17.387 ± 0.006 ij | 56.10 ± 0.05 hi | 20.947 ± 0.009 i |
| 12 | 49.62 ± 0.06 kl | 11.820 ± 0.008 ef | 17.31 ± 0.02 jk | 55.68 ± 0.03 lmn | 20.96 ± 0.02 hi |
| 13 | 49.428 ± 0.013 m | 11.9500 ± 0.0115 c | 17.45 ± 0.08 i | 55.60 ± 0.10 mn | 21.15 ± 0.07 efg |
| 14 | 49.588 ± 0.102 klm | 11.958 ± 0.019 c | 17.55 ± 0.04 gh | 55.724 ± 0.018 klm | 21.23 ± 0.04 cde |
| 15 | 49.50 ± 0.10 lm | 11.89 ± 0.04 cde | 17.390 ± 0.010 ij | 55.638 ± 0.112 mn | 21.066 ± 0.017 gh |
| 16 | 49.93 ± 0.05 ij | 11.69 ± 0.07 gh | 17.81 ± 0.04 d | 56.728 ± 0.105 cd | 21.30 ± 0.06 c |
| 17 | 51.12 ± 0.15 d | 11.17 ± 0.04 k | 17.56 ± 0.03 fgh | 57.55 ± 0.12 a | 20.81 ± 0.02 i |
| 18 | 50.19 ± 0.16 h | 11.72 ± 0.07 g | 17.62 ± 0.05 efgh | 56.36 ± 0.08 fg | 21.16 ± 0.08 efg |
| 19 | 50.39 ± 0.02 g | 11.795 ± 0.013 f | 17.628 ± 0.017 efg | 56.21 ± 0.03 hi | 21.209 ± 0.019 cdef |
| 20 | 50.42 ± 0.08 g | 11.635 ± 0.018 h | 17.17 ± 0.07 lm | 55.88 ± 0.10 j | 20.74 ± 0.06 jk |
| 21 | 49.11 ± 0.05 n | 11.89 ± 0.02 cd | 17.54 ± 0.14 h | 55.86 ± 0.25 jk | 21.189 ± 0.104 def |
| 22 | 50.82 ± 0.06 ef | 11.37 ± 0.09 i | 17.24 ± 0.07 kl | 56.610 ± 0.115 de | 20.651 ± 0.105 kl |
| 23 | 49.76 ± 0.08 jk | 11.95 ± 0.06 c | 18.010 ± 0.014 b | 56.44 ± 0.13 f | 21.61 ± 0.04 b |
| 24 | 50.4000 ± 0.1003 g | 11.870 ± 0.014 de | 17.65 ± 0.04 e | 56.08 ± 0.04 i | 21.27 ± 0.04 cd |
| 25 | 50.93 ± 0.08 e | 11.24 ± 0.03 i | 17.39 ± 0.03 ij | 57.12 ± 0.07 b | 20.70 ± 0.04 kl |
| 26 | 50.258 ± 0.013 gh | 11.325 ± 0.006 i | 17 ± 0 n | 56.360 ± 0.013 fg | 20.443 ± 0.004 m |
| 27 | 51.938 ± 0.010 a | 10.768 ± 0.010 p | 16.873 ± 0.005 p | 57.455 ± 0.017 a | 20.015 ± 0.009 p |
Publisher’s Note: MDPI stays neutral with regard to jurisdictional claims in published maps and institutional affiliations. |
© 2021 by the authors. Licensee MDPI, Basel, Switzerland. This article is an open access article distributed under the terms and conditions of the Creative Commons Attribution (CC BY) license (https://creativecommons.org/licenses/by/4.0/).
Share and Cite
Montoro, A.; Sotelo-Díaz, L.I.; Filomena-Ambrosio, A.; Igual, M.; Martínez-Monzó, J.; García-Segovia, P. Effect of Cricket (Acheta domesticus) Flour Added to Mixture Powder to Obtain a Traditional Beverage (Chucula) on Its Physicochemical Characteristics. Biol. Life Sci. Forum 2021, 6, 20. https://doi.org/10.3390/Foods2021-11008
Montoro A, Sotelo-Díaz LI, Filomena-Ambrosio A, Igual M, Martínez-Monzó J, García-Segovia P. Effect of Cricket (Acheta domesticus) Flour Added to Mixture Powder to Obtain a Traditional Beverage (Chucula) on Its Physicochemical Characteristics. Biology and Life Sciences Forum. 2021; 6(1):20. https://doi.org/10.3390/Foods2021-11008
Chicago/Turabian StyleMontoro, Ariadna, Luz Indira Sotelo-Díaz, Annamaria Filomena-Ambrosio, Marta Igual, Javier Martínez-Monzó, and Purificación García-Segovia. 2021. "Effect of Cricket (Acheta domesticus) Flour Added to Mixture Powder to Obtain a Traditional Beverage (Chucula) on Its Physicochemical Characteristics" Biology and Life Sciences Forum 6, no. 1: 20. https://doi.org/10.3390/Foods2021-11008
APA StyleMontoro, A., Sotelo-Díaz, L. I., Filomena-Ambrosio, A., Igual, M., Martínez-Monzó, J., & García-Segovia, P. (2021). Effect of Cricket (Acheta domesticus) Flour Added to Mixture Powder to Obtain a Traditional Beverage (Chucula) on Its Physicochemical Characteristics. Biology and Life Sciences Forum, 6(1), 20. https://doi.org/10.3390/Foods2021-11008