Proceeding Paper

Development of an Empirical Model for Estimating Quinoa Canopy Cover from NDVI Under Different Irrigation and Fertilization Stress Conditions †

1
AgroBiotech Center, Faculty of Sciences and Techniques, Cadi Ayyad University, Marrakech 40000, Morocco
2
Center for Remote Sensing Applications (CRSA), Mohammed VI Polytechnic University (UM6P), Benguerir 43150, Morocco
3
Laboratory of Fluid Mechanics and Energetics, Faculty of Sciences Semlalia, Cadi Ayyad University, Marrakech 40000, Morocco
4
AgroBiotech Center, Faculty of Sciences Semlalia, Cadi Ayyad University, Marrakesh 40000, Morocco
5
African Sustainable Agriculture Research Institute (ASARI), Mohammed VI Polytechnic University, Laayoune 70000, Morocco
*
Author to whom correspondence should be addressed.
Presented at the 3rd International Online Conference on Agriculture (IOCAG 2025), 22–24 October 2025; Available online: https://sciforum.net/event/IOCAG2025.
Biol. Life Sci. Forum 2025, 54(1), 36; https://doi.org/10.3390/blsf2025054036
Published: 1 April 2026
(This article belongs to the Proceedings of The 3rd International Online Conference on Agriculture)

Abstract

Canopy cover (CC) is crucial for crop monitoring and model calibration. This study developed an empirical equation relating NDVI to CC for quinoa under four treatments with different irrigation and fertilization levels in Morocco’s water-scarce Chichaoua region. Treatments ranged from optimal (100% irrigation, 100% fertilization) to severe stress (40% irrigation, 25% fertilization), tested from March to June 2023, showing strong NDVI-CC correlations (0.77–0.98). Cross-validation identified the best-performing model, CC (%) = 141.75 × (NDVI) − 30.913, derived from moderate stress conditions. This linear equation demonstrated good predictive accuracy across all treatments (R2 = 0.60–0.96, RMSE = 8.79–14.99 (% CC), NRMSE = 0.26–0.36, EF = 0.54–0.74, d = 0.77–0.90), providing a practical tool for estimating quinoa canopy cover in water-limited environments.

1. Introduction

Quinoa (Chenopodium quinoa Willd), a pseudocereal with a 7000-year history of domestication in the Andean highlands, has emerged as a key crop for addressing global food security challenges. Its exceptional nutritional profile and resilience to harsh environmental conditions, particularly drought stress, make it a valuable option for sustainable agricultural systems [1,2,3].
Canopy cover (CC) is a critical parameter for characterizing crop growth and is widely used in crop simulation models such as AquaCrop [4] and SIMDualKc [5]. Calibrating and validating these models require observed CC data, which are typically labor-intensive to measure through ground-based methods. NDVI, which can be readily obtained from satellite imagery, offers a practical and accessible alternative for deriving CC when reliable empirical relationships are established.
Numerous empirical equations relating NDVI to CC have been developed for various crops, including wheat [6], horticultural crops [7], soybean [8], and other agricultural species. However, crop-specific NDVI-CC relationships are essential due to variations in canopy architecture, leaf optical properties, and growth patterns. For quinoa, such empirical equations remain lacking, particularly under varying irrigation and fertilization stress conditions. This research gap limits the ability to derive observed CC from NDVI for crop model applications in water-limited agricultural systems.
This study aims to develop an empirical equation relating NDVI to CC specifically for quinoa crops that can be applied across different irrigation and fertilization stress conditions. The developed relationship will provide a practical tool for estimating quinoa canopy cover from NDVI measurements, facilitating crop model applications and contributing to improved crop monitoring and decision making in water-scarce environments.

2. Materials and Methods

2.1. Study Site and Experimental Design

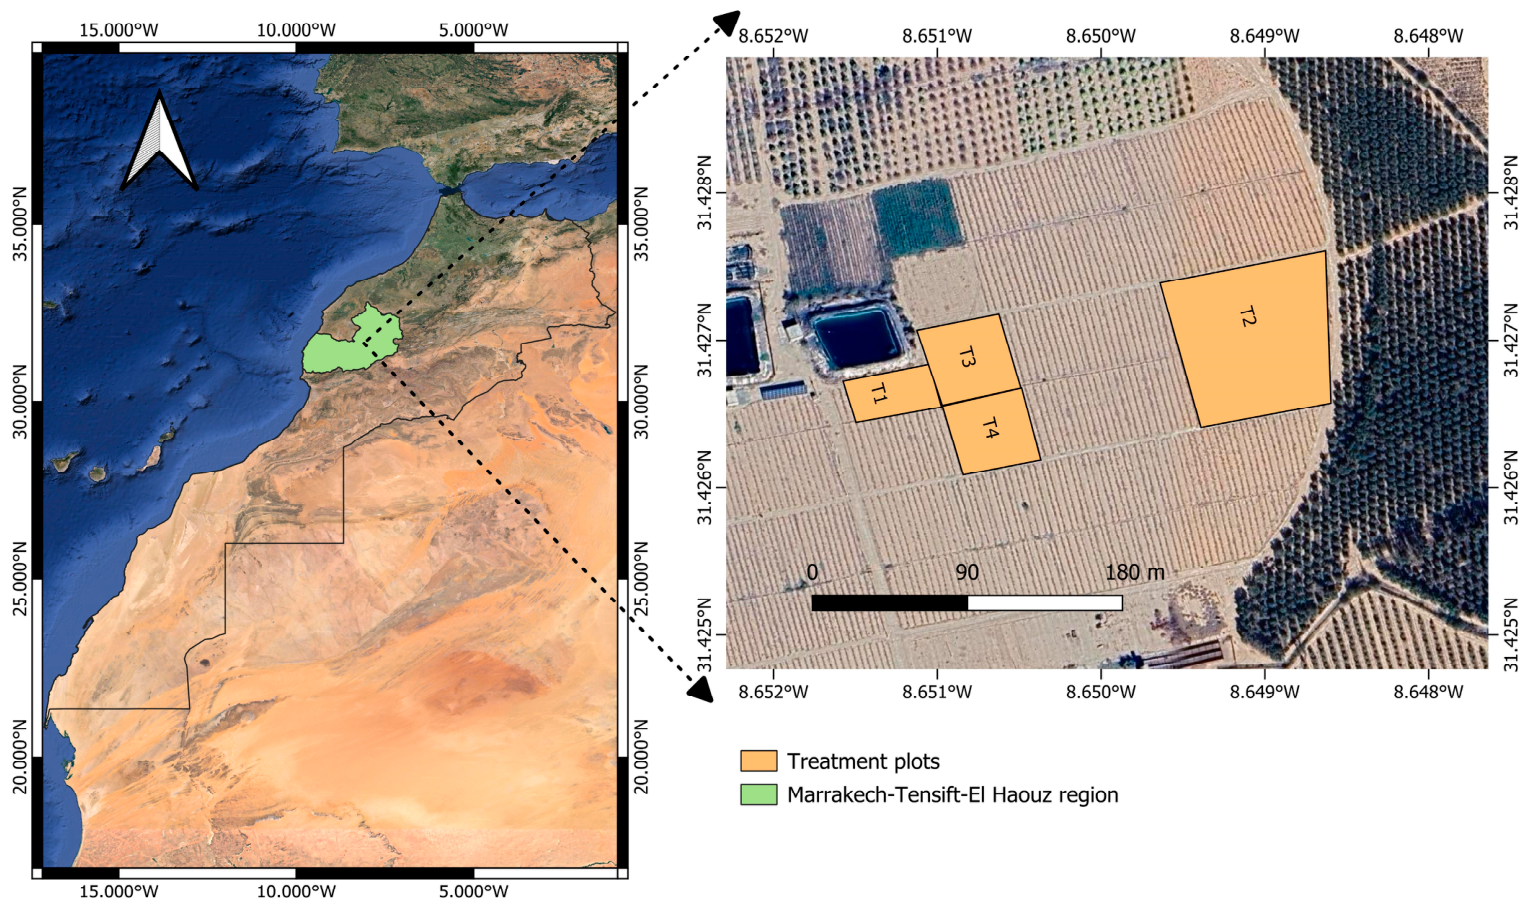
The field experiment was conducted from 7 March to 20 June 2023, in the semi-arid Chichaoua region of central Morocco (31°25′36.4″ N, 8°39′05.9″ W, Figure 1). This area is characterized by erratic rainfall patterns with annual precipitation below 250 mm and reference evapotranspiration exceeding 1600 mm per year [9].
Four treatment plots representing different combinations of irrigation and fertilization levels were established (Table 1), T1 (100% irrigation, 100% fertilization), T2 (80% irrigation, 100% fertilization), T3 (60% irrigation, 25% fertilization), and T4 (40% irrigation, 25% fertilization), with percentages relative to optimal crop requirements. Quinoa was cultivated in rows spaced 80 cm apart. During the establishment phase (first 45 days after sowing), uniform irrigation of 80 mm was applied equally across all treatments through drip irrigation to ensure adequate crop establishment, with no differentiation in irrigation between treatments during this period. After this establishment period, differentiated irrigation regimes based on percentage of optimal crop water requirements were implemented, with an additional 138 mm applied to T1, 120 mm to T2, 88 mm to T3, and 67 mm to T4. Irrigation events were scheduled at two-day intervals, with application durations adjusted according to meteorological conditions.
Basal NPK fertilization at planting consisted of 250 kg/ha for 100% treatments (T1, T2) and 62.5 kg/ha for 25% treatments (T3, T4). Additional nitrogen was applied during critical growth stages at rates of 84.8 kg/ha for 100% fertilization plots and 17.7 kg/ha for 25% fertilization plots.

2.2. NDVI and Canopy Cover Measurements

Hemispherical photographs were acquired using a Canon EOS 600D digital camera (Canon Inc., Tokyo, Japan) fitted with a Sigma 4.5 mm F2.8 EX DC Circular Fisheye HSM lens (Sigma Corporation, Kanagawa, Japan), which offered a 180° field of view and a focal length between 17 and 55 mm. To maintain horizontal stability during image capture, the camera was positioned on a tripod equipped with a self-leveling mount and circular bubble level. The lens aperture was set to F22 to ensure appropriate light control [10]. At each of the 10 sampling dates, six photographs were taken per field: three within the quinoa crop rows and three in the inter-row spaces. These images were subsequently processed using a MATLAB (R2023a) algorithm [11] to determine gap fraction and calculate canopy cover percentage, defined as the fraction of ground surface area covered by the vertical projection of the plant canopy, expressed in this study as a percentage (%). The Normalized Difference Vegetation Index (NDVI) was measured directly in the field using a GreenSeeker handheld optical sensor (Trimble Inc., Westminster, CO, USA). At each of the 10 sampling dates, six measurements were taken per field: three within the quinoa crop rows and three in the inter-row spaces. For each sampling date, the NDVI samples taken per treatment plot were averaged to obtain a single representative NDVI value.

2.3. Data Analysis

Linear and quadratic regression models relating NDVI to CC were developed for each treatment plot (T1–T4). Cross-validation was performed by applying each plot-specific equation to predict CC in the remaining three plots. Model performance was evaluated using the coefficient of determination (R2), root-mean-square error (RMSE, expressed in the same units as CC—percentage (%)), its normalized value (NRMSE), index of agreement (d), percent bias (PBIAS) and the Nash–Sutcliffe modeling efficiency (EF). The most representative equation was identified based on its predictive accuracy across all treatment conditions.
The performance metrics were calculated as follows, where Oi and Pi represent the individual observed and predicted values, respectively; O ¯ and P ¯ are their means; and n is the sample size.
R 2 = ( Σ ( O i O ¯ ) ( P i P ¯ ) ) 2 Σ ( O i O ¯ ) 2 Σ ( P i P ¯ ) 2
R M S E = 1 n i = 1 n ( O i P i ) 2
N R M S E = 1 n i = 1 n ( O i P i ) 2 O ¯
d = 1 i = 1 n ( P i O i ) 2 i = 1 n ( | P i P ¯ | + | O i O ¯ | ) 2
PBIAS = i = 1 n (   P i O i ) i = 1 n O i × 100
EF = 1 i = 1 n (   O i P i ) i = 1 n ( O i O ¯ )

3. Results

3.1. Temporal Evolution of NDVI and Canopy Cover Across Treatments

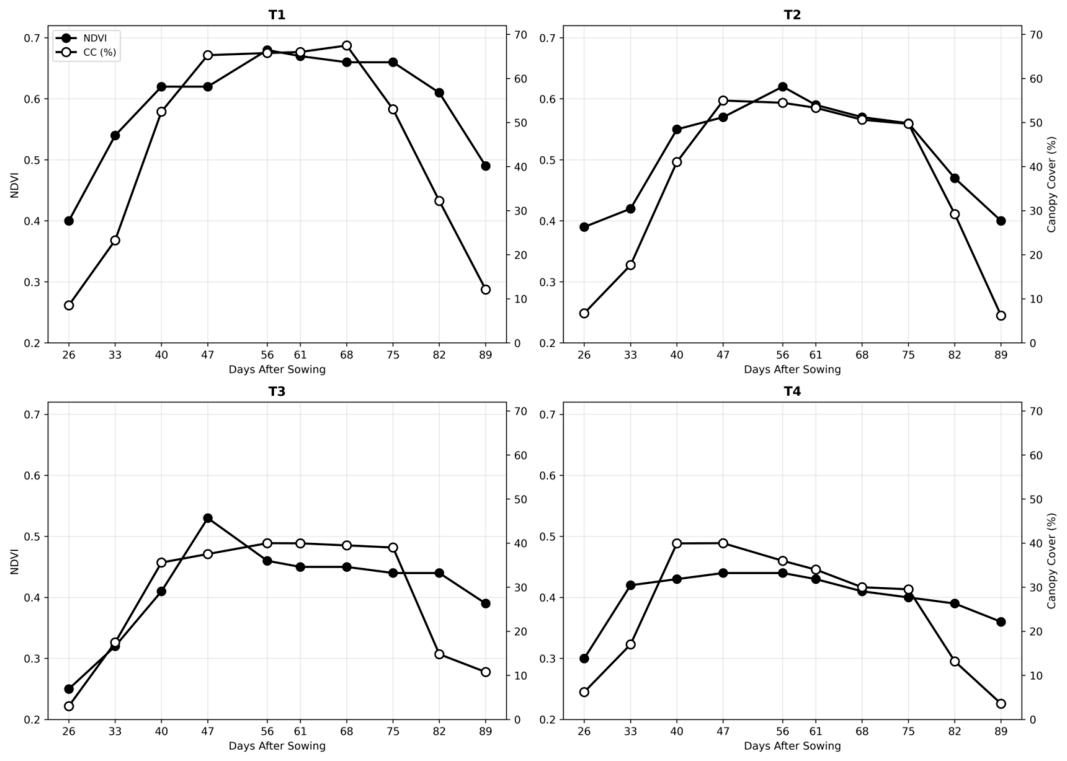
The temporal dynamics of NDVI and canopy cover throughout the growing season revealed strong correlations between both parameters, with correlation coefficients of 0.91, 0.98, 0.77, and 0.83 for T1, T2, T3, and T4, respectively (Figure 2). T1 showed the highest performance, reaching a maximum NDVI of 0.68 at 56 DAS (days after sowing) and a peak canopy cover of 67.49% at 68 DAS. T2 achieved a maximum NDVI of 0.62 at 56 DAS and a peak canopy cover of 55% at 47 DAS. T3 exhibited the lowest values with a maximum NDVI of 0.53 at 47 DAS and a peak canopy cover of 40% at 56 DAS. T4 reached a maximum NDVI of 0.44 at 47 DAS and a peak canopy cover of 40% at 47 DAS. Across all treatments, both parameters increased during 26–56 DAS, plateaued during 56–75 DAS, and declined after 75 DAS, with the magnitude and timing of these phases influenced by water and fertilizer availability. Some discrepancies observed during the establishment phase (first 45 DAS) between treatments receiving the same irrigation and fertilization conditions, such as T1 vs. T2 and T3 vs. T4, can be attributed to natural inter-plot variability in germination and early plant establishment inherent to manual sowing, as well as to inherent measurement uncertainty associated with the limited number of sampling points per plot. The partial stabilization of CC in T3 following the decline in NDVI after 45 DAS is consistent with the physiological maintenance of structural leaf area under moderate water stress, as further discussed in Section 4.

3.2. Development and Validation of Empirical NDVI-Canopy Cover Equations

Given the strong correlations observed between NDVI and canopy cover across all treatments, both linear and quadratic regression models were developed using data from each individual treatment plot. To identify the most robust and transferable equation, each treatment-specific model was cross-validated by applying it to predict CC values across all four treatment plots. To select the most robust and transferable equation, cross-validation performance was assessed using six complementary metrics: R2, RMSE, NRMSE, EF, d, and PBIAS. The average performance of equations derived from each treatment when applied across all plots are presented in Table 2. The T1-derived equation showed the weakest overall transferability, with the lowest average R2 (0.76), the highest RMSE (18.80 (% CC)) and NRMSE (0.65), a negative EF (−1.21) indicating predictions worse than the observed mean, and the largest systematic bias (PBIAS = −56.26%). The T4-derived equation performed similarly poorly, with high RMSE (17.68 (% CC)), high NRMSE (0.49), negative EF (−0.06), and a large PBIAS (29.97%). The T2-derived equation showed competitive performance with R2 = 0.80 and d = 0.83, but its relatively higher RMSE (12.78 (% CC)), low EF (0.10), and systematic underestimation (PBIAS = −21.15%) indicated limited consistency across treatments. The T3-derived equation outperformed all others simultaneously across every metric, R2 = 0.80, RMSE = 10.57 (% CC), NRMSE = 0.32, EF = 0.60, d = 0.84, and PBIAS = 9.86%, confirming its superior generalizability across all irrigation and fertilization conditions. Moreover, unlike equations derived from T1, T2, and T4, which produced physically impossible negative CC predictions for early- and late-season observations with low NDVI values, the T3-derived equation generated no such unrealistic predictions across the full range of observed NDVI values, further confirming its physical consistency and practical reliability. Based on the cross-validation results, the linear model derived from T3 field data was selected as the most representative equation due to its combination of high R2, lowest RMSE and NRMSE: CC (%) = 141.75 × (NDVI) − 30.913.

3.3. Predictive Performance of the T3 Model Across All Treatments

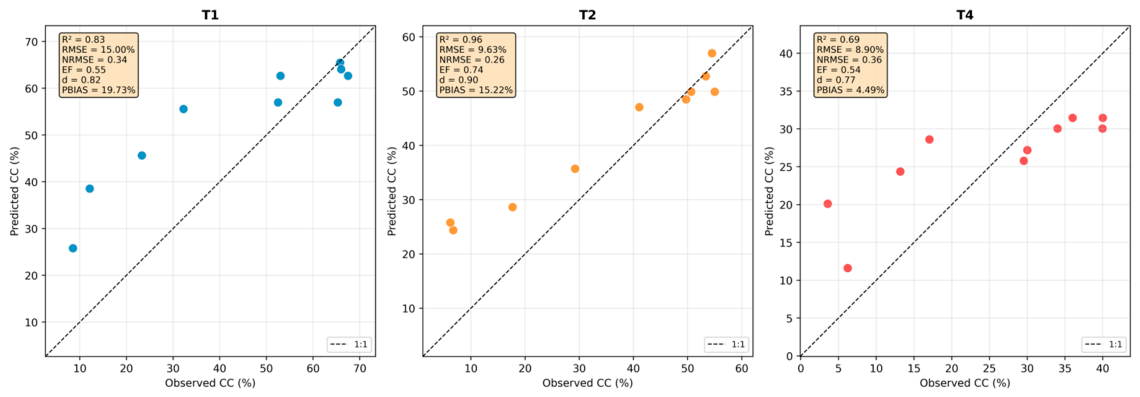
The performance of the T3-derived linear model (CC = 141.75 × NDVI − 30.913) when applied to predict canopy cover across T1, T2, and T4 treatment plots is illustrated in Figure 3. The model demonstrated varying levels of accuracy across different irrigation and fertilization regimes. The best prediction accuracy was achieved for T2 (R2 = 0.96, RMSE = 9.63 (% CC), NRMSE = 0.26, EF = 0.74, d = 0.90, PBIAS = 15.22%), indicating excellent agreement between predicted and observed CC values. For T1, the model showed good performance (R2 = 0.83, RMSE = 15.00 (% CC), NRMSE = 0.34, EF = 0.55, d = 0.82, PBIAS = 19.73%). The T4 treatment showed moderate performance (R2 = 0.69, RMSE = 8.90 (% CC), NRMSE = 0.36, EF = 0.54, d = 0.77, PBIAS = 4.49%). Although T4 had the lowest absolute RMSE, this is attributable to its lower mean CC range rather than better model fit, as confirmed by its higher NRMSE (0.36) compared to T2 (0.26). All three treatments showed positive EF values, confirming that the T3-derived equation provides better predictions than simply using the observed mean across all conditions. Overall, the T3-derived equation demonstrated robust transferability across different water and nutrient management scenarios, confirming its applicability as a practical tool for estimating quinoa canopy cover from NDVI measurements under varying stress conditions.

4. Discussion

The strong correlations between NDVI and CC across treatments (r = 0.77 to 0.98) confirm NDVI as a reliable indicator for estimating quinoa canopy cover. The decrease in correlation coefficients observed under increased water stress (T3 and T4) can be attributed to increased canopy spatial heterogeneity, greater soil background interference from sparse vegetation, and altered leaf optical properties under water deficit, all of which introduce additional variability in the NDVI signal beyond simple canopy cover changes.
The T3-derived equation (CC = 141.75 × NDVI − 30.913) was selected as the most representative model based on cross-validation results, achieving the highest average R2 (0.80) with the lowest RMSE (10.57 (% CC)) when applied across all plots. Beyond its superior statistical performance, T3’s robustness can be attributed to the intermediate stress conditions (60% irrigation, 25% fertilization) under which it was developed. Under high irrigation and fertilization (T1 and T2), quinoa plants maintain relatively high and stable canopy cover throughout the season, resulting in limited variation in CC values. Conversely, under severe stress (T4), plants experience consistently low canopy development with restricted growth, also resulting in limited CC variation. In contrast, T3’s moderate stress conditions allow plants to experience a wider range of canopy cover values as stress gradually intensifies from early growth to maturity. This broader spectrum of CC-NDVI combinations captured in the T3 dataset provides a more comprehensive calibration that better generalizes across different management scenarios, explaining its superior transferability to other stress conditions.
The moderate NDVI-CC R2 observed for T3 (0.59) reflects a partial decoupling between NDVI and CC under moderate water stress, as irrigation is reduced, photosynthetic activity declines and NDVI decreases while structural leaf area and thus CC is partially maintained, introducing scatter in the regression. Notably, this broader dynamic range of NDVI-CC combinations captured under T3 conditions is precisely what makes this equation the most generalizable across all stress conditions.

5. Conclusions

This study successfully developed an empirical linear equation (CC = 141.75 × NDVI − 30.913) for estimating quinoa canopy cover from NDVI measurements under varying irrigation and fertilization stress conditions. The equation, derived from moderate stress conditions (60% irrigation, 25% fertilization), demonstrated robust transferability across all treatments with good predictive accuracy (R2 = 0.80, RMSE = 10.57 (% CC), NRMSE = 0.32, EF = 0.60, d = 0.84, PBIAS = 9.86%). This relationship provides a practical tool for deriving canopy cover from readily available satellite NDVI, facilitating crop model calibration and validation in water-scarce environments. The developed equation contributes to improved crop monitoring and decision making for sustainable quinoa cultivation in semi-arid regions. In this study, canopy cover and NDVI were measured using hemispherical photography and a handheld GreenSeeker sensor, respectively. Future studies could consider the use of UAVs equipped with multispectral cameras or high-resolution satellite imagery such as Sentinel-2, which would allow more efficient and spatially continuous acquisition of NDVI and canopy cover data, providing a scalable approach for crop monitoring across larger areas.

Author Contributions

Conceptualization, L.J., S.E.-R. and S.K.; methodology, L.J., S.E.-R. and S.K.; software, L.J.; validation, L.J., S.E.-R. and S.K.; formal analysis, L.J.; investigation, L.J.; data curation, L.J., S.E.-R. and S.K.;writing—original draft preparation, L.J.; writing—review and editing, L.J., S.E.-R., S.K., J.E., Z.B., H.A.B.A., A.M. and A.C.; visualization, L.J.; resources, S.E.-R. and S.K.; supervision, S.E.-R., S.K. and J.E.; project administration, S.E.-R. and S.K.; funding acquisition, S.E.-R. and S.K. All authors have read and agreed to the published version of the manuscript.

Funding

This research was funded by PRIMA-AQUEDUCT (Grant No. PRIMA-2166), and the GEANTech project (Sustainable Water Management in Agriculture: Innovation of a Synergistic Approach with New Technologies and Collective Intelligence), supported by the Moroccan Ministry of Higher Education, Scientific Research and Innovation and the OCP Foundation through the APRD research program.

Data Availability Statement

Data will be made available on request.

Acknowledgments

We gratefully acknowledge the International Joint Laboratory Télédétection et Ressources en Eau en Méditerranée semi-Aride (LMI TREMA, https://tremaucam.wixsite.com/lmitrema, accessed on 16 December 2025) for providing the data.

Conflicts of Interest

The authors declare no conflict of interest.

References

  1. Lupa-Condo, N.E.; Lope-Ccasa, F.C.; Salazar-Joyo, A.A.; Gutiérrez-Rosales, R.O.; Jellen, E.N.; Hansen, N.C.; Anculle-Arenas, A.; Zeballos, O.; Llasaca-Calizaya, N.W.; Mayta-Anco, M.E. Phenotyping for Effects of Drought Levels in Quinoa Using Remote Sensing Tools. Agronomy 2024, 14, 1938. [Google Scholar] [CrossRef]
  2. Vega-Gálvez, A.; Miranda, M.; Vergara, J.; Uribe, E.; Puente, L.; Martínez, E.A. Nutrition Facts and Functional Potential of Quinoa (Chenopodium quinoa Willd.), an Ancient Andean Grain: A Review. J. Sci. Food Agric. 2010, 90, 2541–2547. [Google Scholar] [CrossRef] [PubMed]
  3. Bazile, D.; Bertero, H.D.; Nieto, C. State of the Art Report on Quinoa around the World in 2013; FAO: Rome, Italy, 2015. [Google Scholar]
  4. Jin, X.; Li, Z.; Feng, H.; Ren, Z.; Li, S. Estimation of Maize Yield by Assimilating Biomass and Canopy Cover Derived from Hyperspectral Data into the AquaCrop Model. Agric. Water Manag. 2020, 227, 105846. [Google Scholar] [CrossRef]
  5. Paço, T.A.; Paredes, P.; Pereira, L.S.; Silvestre, J.; Santos, F.L. Crop Coefficients and Transpiration of a Super Intensive Arbequina Olive Orchard Using the Dual Kc Approach and the Kcb Computation with the Fraction of Ground Cover and Height. Water 2019, 11, 383. [Google Scholar] [CrossRef]
  6. Gitelson, A.A.; Kaufman, Y.J.; Stark, R.; Rundquist, D. Novel Algorithms for Remote Estimation of Vegetation Fraction. Remote Sens. Environ. 2002, 80, 76–87. [Google Scholar] [CrossRef]
  7. Trout, T.J.; Johnson, L.F.; Gartung, J. Remote Sensing of Canopy Cover in Horticultural Crops. HortScience 2008, 43, 333–337. [Google Scholar] [CrossRef]
  8. de la Casa, A.; Ovando, G.; Bressanini, L.; Martínez, J.; Díaz, G.; Miranda, C. Soybean Crop Coverage Estimation from NDVI Images with Different Spatial Resolution to Evaluate Yield Variability in a Plot. ISPRS J. Photogramm. Remote Sens. 2018, 146, 531–547. [Google Scholar] [CrossRef]
  9. Jallal, L.; Er-Raki, S.; Khabba, S.; Ezzahar, J.; Kaissi, O.; Rafi, Z.; Chehbouni, A. Simulation of the Pea Crop Development Using AquaCrop Model in Chichaoua Region, Morocco: Application for Irrigation Management. Agric. Water Manag. 2025, 322, 109943. [Google Scholar] [CrossRef]
  10. Ribas Costa, V.A.; Durand, M.; Robson, T.M.; Porcar-Castell, A.; Korpela, I.; Atherton, J. Uncrewed Aircraft System Spherical Photography for the Vertical Characterization of Canopy Structural Traits. New Phytol. 2022, 234, 735–747. [Google Scholar] [CrossRef] [PubMed]
  11. Khabba, S.; Duchemin, B.; Hadria, R.; Er-Raki, S.; Ezzahar, J.; Chehbouni, A.; Lahrouni, A.; Hanich, L. Evaluation of Digital Hemispherical Photography and Plant Canopy Analyzer for Measuring Vegetation Area Index of Orange Orchards. J. Agron. 2009, 8, 67–72. [Google Scholar] [CrossRef]
Figure 1. Geographical location of the experimental site and treatment plots, Chichaoua region, Morocco. Orange polygons indicate the treatment plots (T1, T2, T3, and T4), and the green area on the map indicates the Marrakech-Tensift-El Haouz region.
Blsf 54 00036 g001
Figure 2. Temporal evolution of NDVI and canopy cover across different irrigation and fertilization treatments.
Blsf 54 00036 g002
Figure 3. Observed versus predicted canopy cover using the T3-derived linear model across all treatment conditions.
Blsf 54 00036 g003
Table 1. Irrigation and fertilization levels, shown as a percentage of the optimum.
T1T2T3T4
Irrigation (%)100806040
Fertilization (%)1001002525
Area (ha)0.150.880.240.24
Table 2. Average cross-validation performance of treatment-specific NDVI-CC equations across all plots.
TreatmentR2RMSE (% CC)NRMSEdEFPBIAS
T10.7618.80.650.75−1.21−56.26
T20.812.780.420.830.10−21.15
T30.810.570.320.840.609.86
T40.7617.680.490.81−0.0629.97
Disclaimer/Publisher’s Note: The statements, opinions and data contained in all publications are solely those of the individual author(s) and contributor(s) and not of MDPI and/or the editor(s). MDPI and/or the editor(s) disclaim responsibility for any injury to people or property resulting from any ideas, methods, instructions or products referred to in the content.