Proceeding Paper

Comparative Analysis of Raw and Preprocessed Vis–NIR and MIR Spectra for Soil Property Estimation †

by
Yasas Gamagedara
and
Nuwan K. Wijewardane
*
Department of Agricultural & Biological Engineering, Mississippi State University, Starkville, MS 39762, USA
*
Author to whom correspondence should be addressed.
†
Presented at the 3rd International Online Conference on Agriculture (IOCAG 2025), 22–24 October 2025; Available online: https://sciforum.net/event/IOCAG2025.
Biol. Life Sci. Forum 2025, 54(1), 21; https://doi.org/10.3390/blsf2025054021
Published: 13 February 2026
(This article belongs to the Proceedings of The 3rd International Online Conference on Agriculture)

Abstract

Demand for rapid and cost-effective soil analysis has increased the use of spectroscopy, particularly in the visible–near-infrared (Vis–NIR) and mid-infrared (MIR) regions. Using 8304 soil samples from the United States Department of Agriculture spectral library, this study evaluated the effects of raw and preprocessed spectra on the prediction accuracy of eleven key soil properties across Vis–NIR and MIR regions using multiple machine learning algorithms. Spectral preprocessing, combining baseline correction and standard normal variate transformation, consistently improved prediction accuracy compared to the raw spectra. Overall, MIR-based models consistently outperformed Vis–NIR across all soil properties, with the largest performance gains observed for potassium, bulk density, and nitrate nitrogen. Among the machine learning approaches evaluated, artificial neural networks and categorical boosting algorithms provided the strongest and most consistent predictive performance across both spectral regions. These findings demonstrate that combining appropriate spectral preprocessing, spectral region selection, and advanced machine learning algorithms can substantially improve soil property prediction using spectroscopy.

1. Introduction

Diffuse reflectance spectroscopy has become an increasingly important tool for soil analysis, offering a rapid and cost-efficient alternative to traditional laboratory methods [1,2]. Its capacity to predict a wide range of soil chemical and physical properties makes it valuable for large-scale soil monitoring and precision agriculture [3]. Soil spectroscopy commonly utilizes two spectral regions: visible–near-infrared (Vis–NIR) and mid-infrared (MIR). Mid-infrared spectroscopy provides strong diagnostic signals due to fundamental vibrational absorptions, whereas Vis–NIR spectroscopy is widely used in field applications because of its portability and ease of deployment [4,5].
Despite these advantages, unprocessed spectral data (hereafter referred to as raw spectra) often contain baseline shifts, scattering effects, and instrument-specific noise, which can compromise model accuracy [6,7,8]. To address these challenges, spectral preprocessing techniques such as baseline correction and standard normal variate transformation are commonly applied to enhance the extraction of relevant spectral features [9].
Although spectral preprocessing is widely adopted in the literature, systematic comparisons between raw and preprocessed spectra across different spectral regions and machine learning algorithms, particularly for a diverse set of soil properties, remain limited [10]. To address this gap, this study compared the prediction accuracy of raw and preprocessed Vis-NIR and MIR spectra using eight machine learning algorithms to predict eleven key soil properties. A subset of samples from a large, standardized soil spectral library was used in this study to ensure consistency and robustness in model evaluation.
The objectives of this work are to identify which soil properties benefit most from spectral preprocessing, determine the most effective spectral region, and assess which machine learning algorithms provide the most consistent and reliable predictions. Accordingly, this study aims to support the development of large-scale, cost-effective soil assessment approaches that are relevant for precision agriculture and soil health monitoring initiatives.

2. Materials and Methods

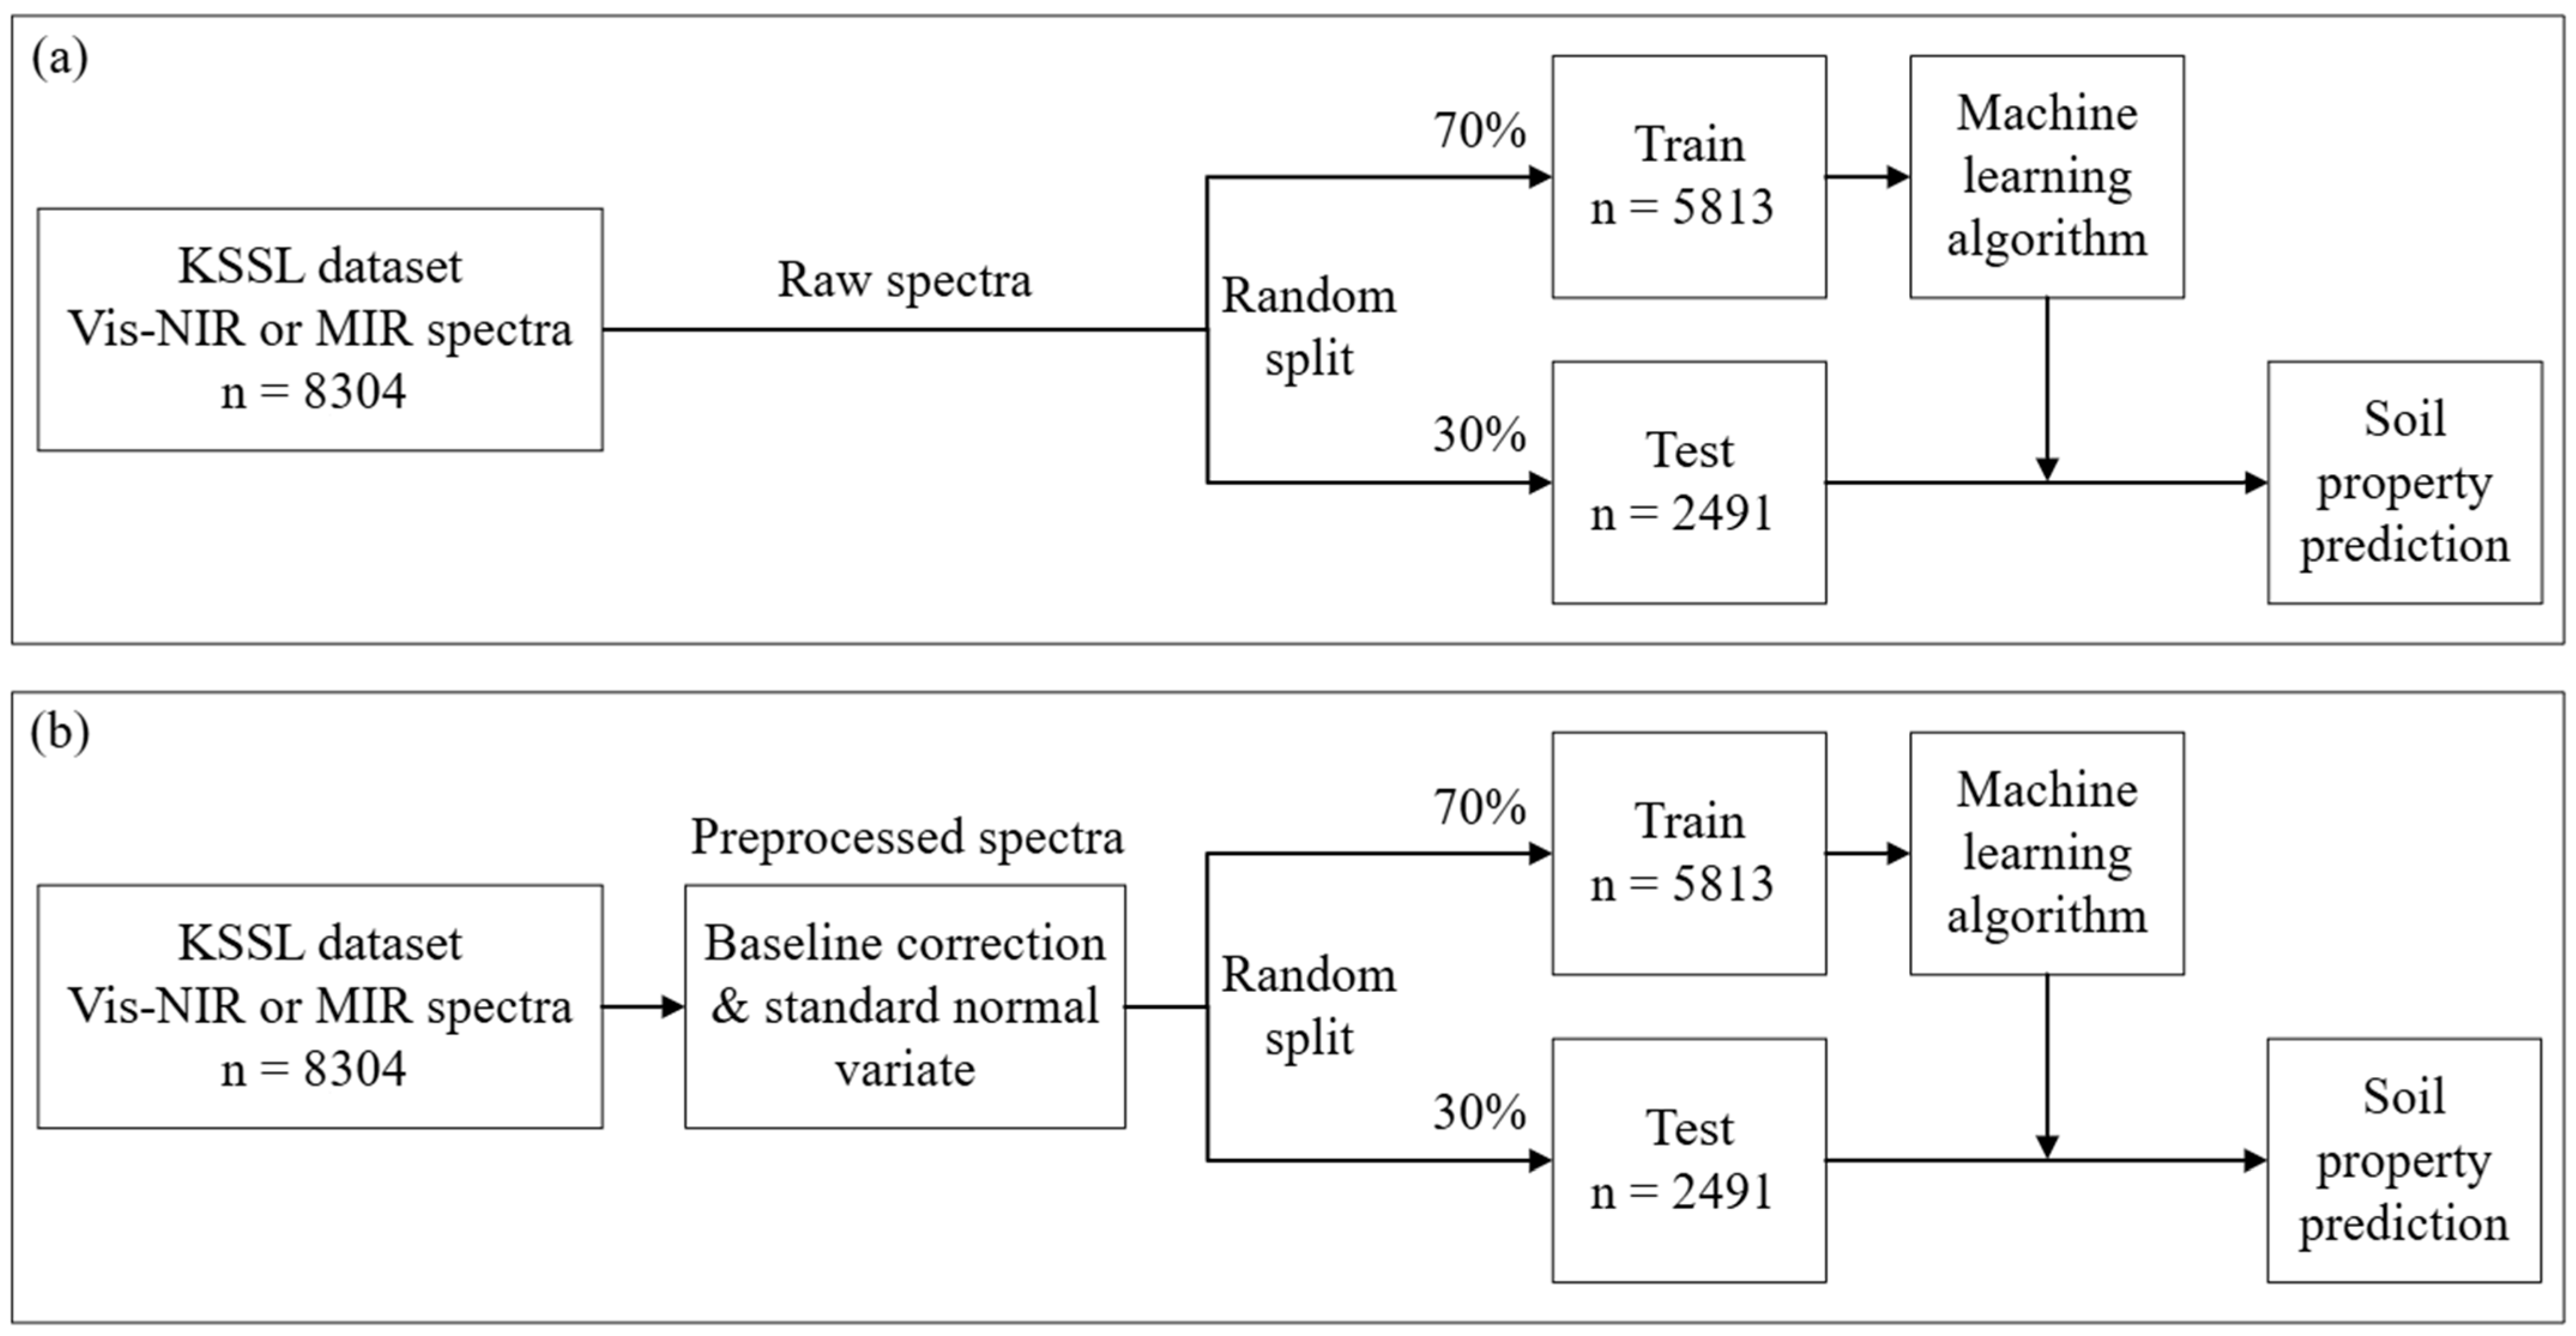
A schematic overview of the methodological workflow is provided in Figure 1, illustrating the main stages of the study, including soil spectral data selection, spectral preprocessing, machine learning model training, and soil property prediction. Figure 1a shows the workflow using raw spectral data, while Figure 1b presents the workflow for preprocessed spectral data.

2.1. KSSL Dataset

The United States Department of Agriculture–Natural Resources Conservation Service–National Soil Survey Center–Kellogg Soil Survey Laboratory (KSSL) maintains a large soil spectral library that includes both Vis–NIR and MIR spectra, representing diverse soil types, depths, and properties across the United States [11,12]. From this library, a subset of 8304 soil samples with spectra available in both the Vis–NIR and MIR regions was selected for this study. These samples included laboratory reference measurements of organic carbon, total carbon, total nitrogen, cation exchange capacity, clay, sand, total sulfur, pH, potassium, bulk density, and nitrate nitrogen.
Soil spectra were acquired following standardized KSSL protocols [13]. All soil samples were air-dried and ground to pass a 2 mm sieve prior to spectral measurement. Visible–near-infrared spectra were acquired in diffuse reflectance mode using an ASD LabSpec 2500 spectrometer equipped with a MugLight accessory (Analytical Spectral Devices, Boulder, CO, USA), covering wavelengths from 350 to 2500 nm at 1 nm intervals. Each spectrum represents the average of 100 internal scans, and background measurements using a white reference were performed at regular intervals [14,15]. For MIR spectral acquisition, ground soil samples were further fine-ground to <0.18 mm and analyzed using a Bruker Vertex 70 Fourier-transform infrared spectrometer equipped with a high-throughput screening (HTS-XT) accessory (Bruker Optics Inc., Ettlingen, Germany). Mid-infrared spectra were collected over the wavenumber range of 4000–350 cm−1 at a spectral resolution of 4 cm−1 using 32 co-added scans per sample. Samples were prepared in standardized 96-well microplates prior to measurement, and background measurements using a gold reference were performed for each soil sample [12,16,17].

2.2. Spectral Preprocessing

Two spectral preprocessing techniques—baseline correction and standard normal variate transformation—were applied to the KSSL dataset (Figure 1b). Baseline correction was used to remove background offsets and baseline drift in the spectra, while standard normal variate transformation was applied to reduce scattering effects and normalize spectral intensity differences among samples. These methods were evaluated in combination, and the performance of raw spectra was retained as a reference for comparison. Detailed descriptions of the baseline correction and standard normal variate transformation are provided in [18] and [19], respectively.

2.3. Machine Learning Algorithms

As shown in Figure 1, the KSSL dataset (n = 8304) was randomly split into training (70%) and testing (30%) subsets. The same train–test split was applied across all algorithms to ensure fair comparison. Model hyperparameters were optimized using grid search and algorithm-specific tuning procedures. Eight machine learning algorithms were evaluated in this study, including ridge regression (Ridge), artificial neural network (ANN), categorical boosting (CatBoost), k-nearest neighbors (KNN), least absolute shrinkage and selection operator (LASSO), elastic net regression (ElasticNet), random forest (RF), and partial least squares regression (PLSR). Model performance was assessed using R2, root mean square error, bias, and ratio of performance to interquartile distance. For concision, only R2 results are presented in the main text, with all additional performance metrics are provided in Table S1. All analyses were conducted using Python (version 3.13.9) libraries [20].

3. Results

3.1. Soil Property Distributions

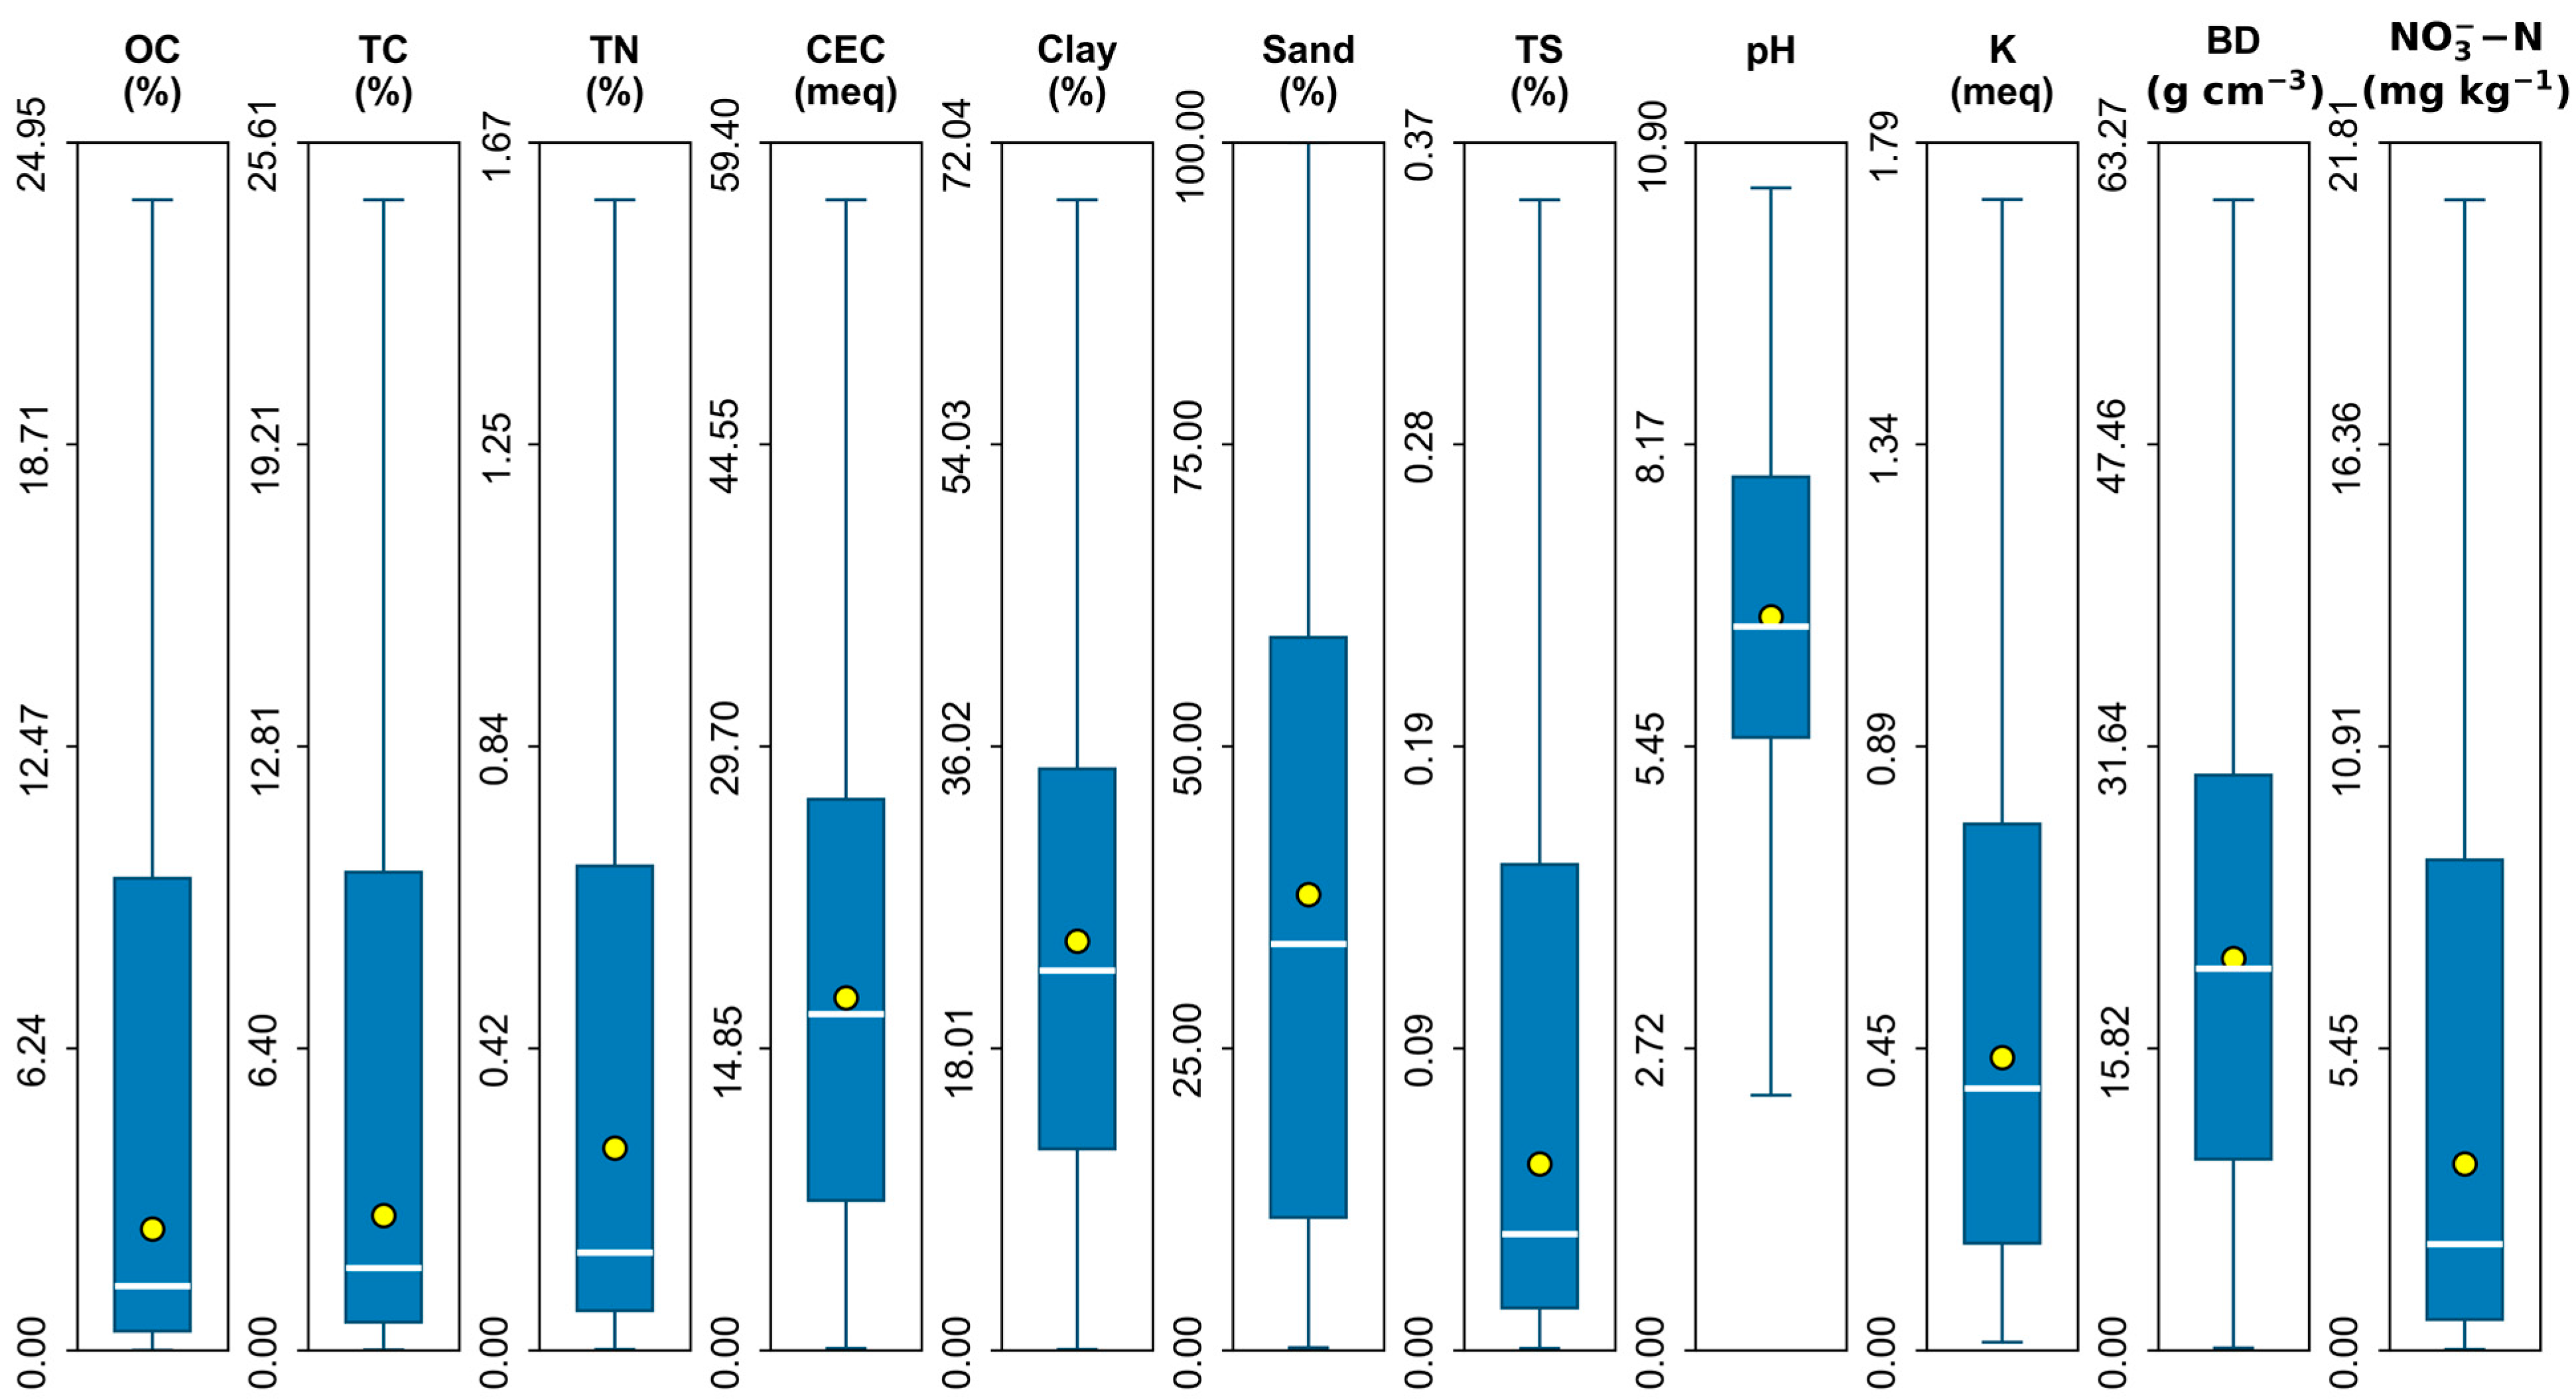
The distributions of the eleven soil properties used in this study are shown in Figure 2. All properties exhibited wide variability across the dataset, reflecting the range of soils represented in the KSSL dataset. With the exception of pH, most properties displayed long upper tails, indicating skewed distributions. Soil pH values span a broad range from acidic to moderately alkaline conditions. Organic carbon, total carbon, total nitrogen, total sulfur, and nitrate nitrogen exhibited similar right-skewed distribution patterns. In contrast, cation exchange capacity, clay, sand, potassium, and bulk density showed comparable but less strongly right-skewed distribution trends.

3.2. Spectral Variations

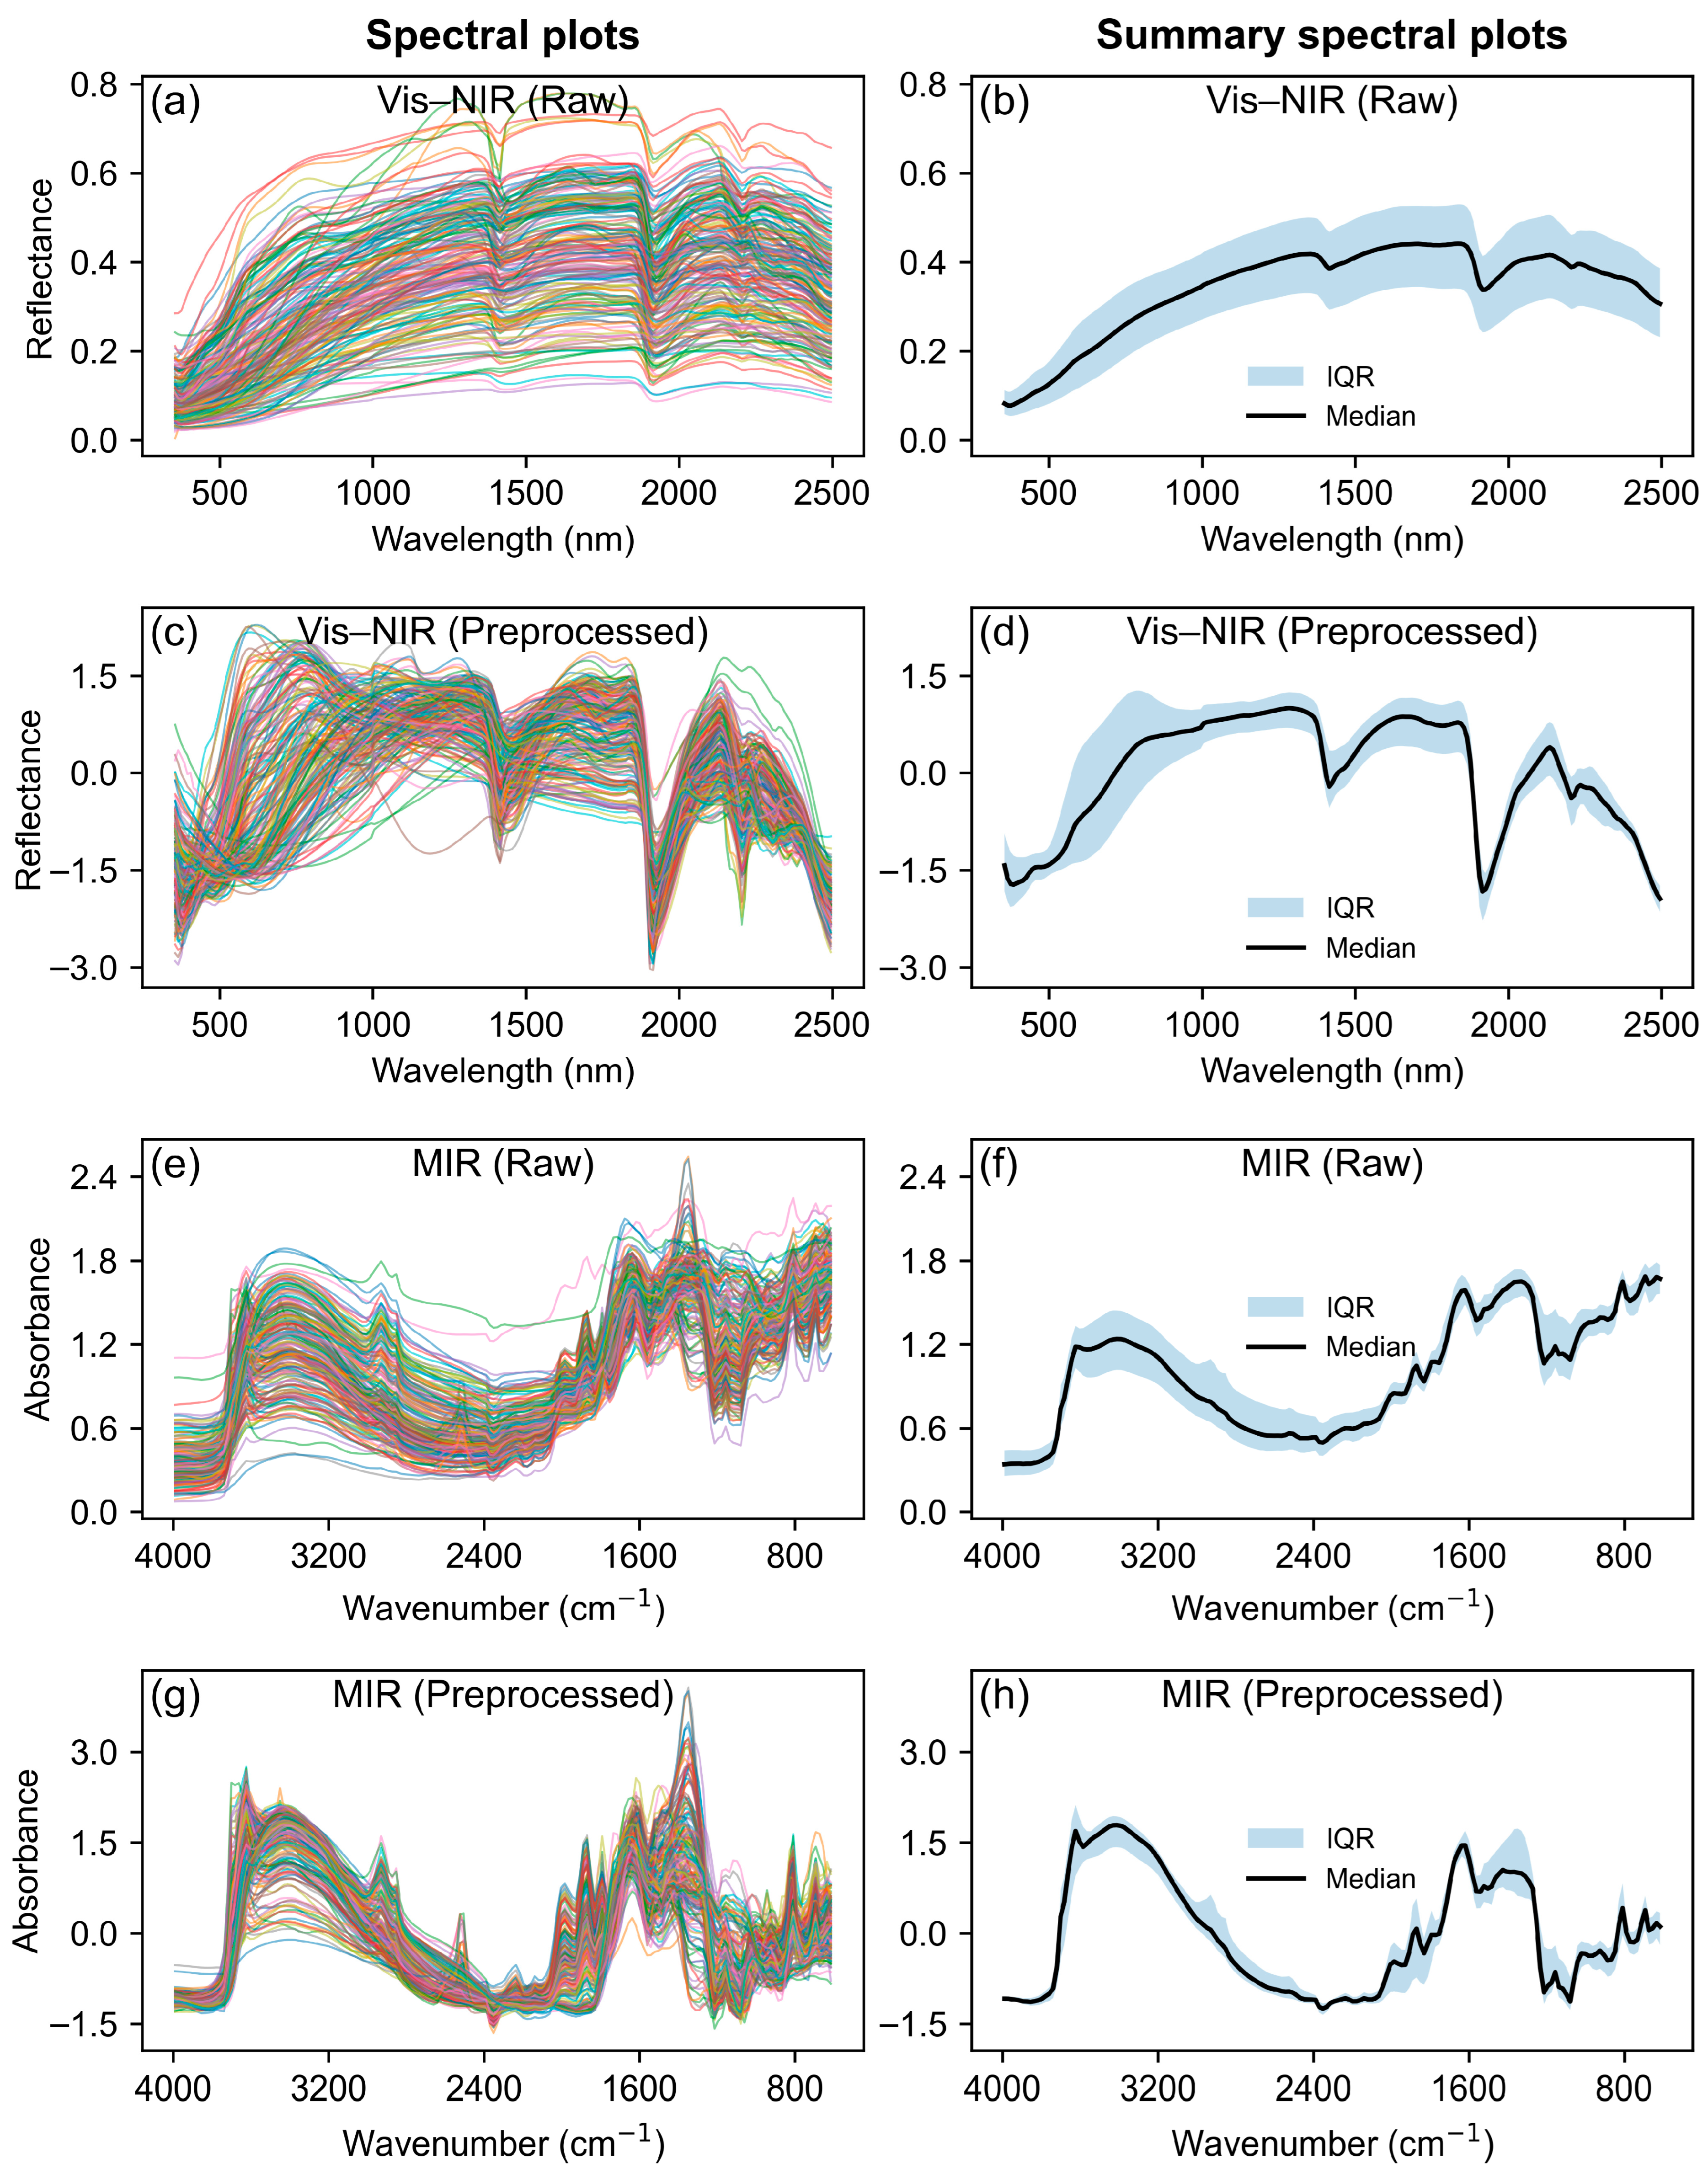
Spectral variations for both raw and preprocessed Vis–NIR and MIR datasets are illustrated in Figure 3. The raw Vis–NIR spectra (Figure 3a) exhibit strong scattering and baseline shifts, which mask subtle reflectance features across the wavelength range. After applying baseline correction and standard normal variate transformation, these distortions were substantially reduced, revealing clearer and more interpretable spectral characteristics (Figure 3c). In contrast, the MIR spectra displayed distinct absorption peaks in both raw (Figure 3e) and processed (Figure 3g) forms, reflecting the strong vibrational signals associated with fundamental molecular bonds. Preprocessing in the MIR region primarily reduced spectral spread by minimizing noise and sample-to-sample variability. The median and interquartile range plots (Figure 3b,d,f,h) confirm that preprocessing decreases spectral variability across both regions, with the most pronounced improvements observed in Vis–NIR, where baseline effects were inherently stronger.

3.3. Model Performance

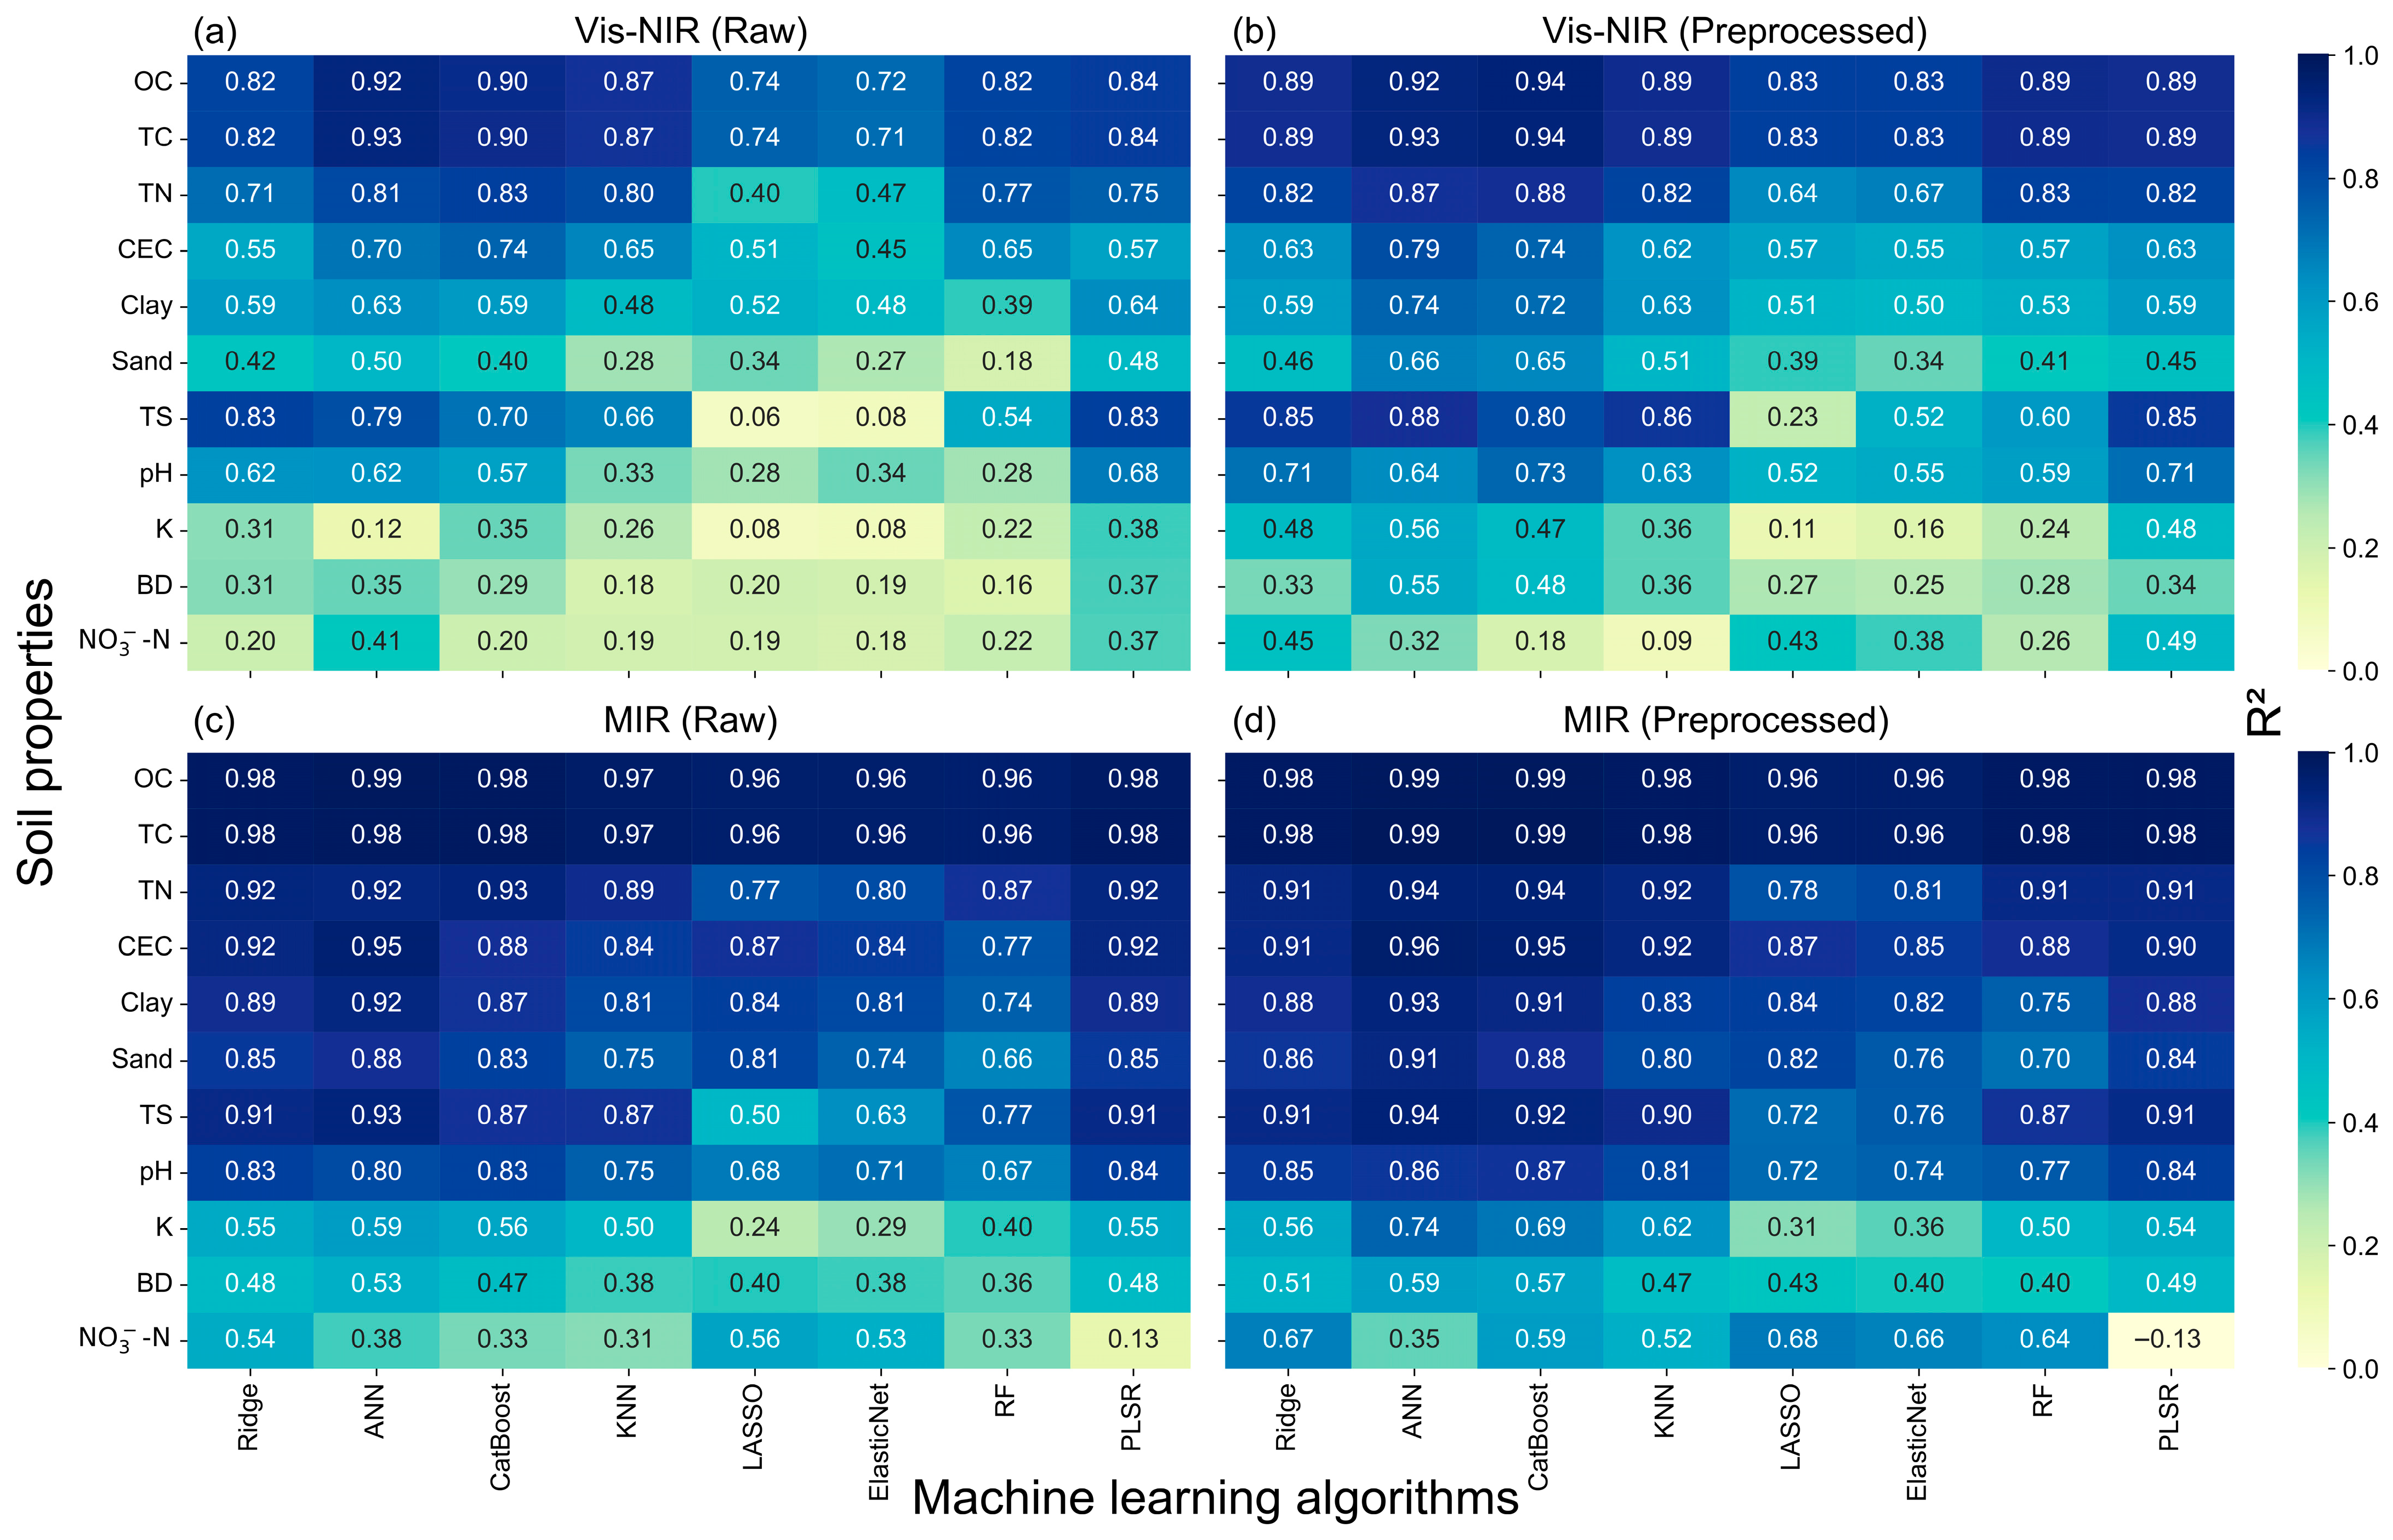
Across all machine learning algorithms and preprocessing conditions, MIR consistently outperformed Vis–NIR in predicting soil properties, yielding higher and more stable R2 values. Figure 4 summarizes the predictive performance of all models based exclusively on validation using the independent test dataset. Under raw and preprocessed conditions, MIR models achieved strong predictive accuracy for most soil properties (R2 > 0.80), particularly for organic carbon, total carbon, total nitrogen, cation exchange capacity, clay, sand, total sulfur, and pH (Figure 4c,d). Preprocessing further enhanced MIR performance, especially for soil properties that were less predictable using raw MIR spectra. For example, potassium improved from 0.59 to 0.74 using ANN, bulk density improved from 0.53 to 0.59 using ANN, and nitrate nitrogen increased from 0.56 to 0.68 using LASSO.
In contrast, Vis–NIR exhibited greater variability across soil properties and models. High accuracy (R2 > 0.80) was obtained for organic carbon, total carbon, total nitrogen, and total sulfur under both raw and preprocessed conditions (Figure 4a,b). Other soil properties showed moderate but meaningful R2 improvements following preprocessing. For example, cation exchange capacity increased from 0.70 to 0.79 using ANN), clay improved from 0.63 to 0.74 using ANN, sand improved from 0.50 to 0.66 using ANN, and pH improved from 0.57 to 0.73 using CatBoost. Despite these enhancements, Vis–NIR continued to yield lower accuracy for potassium, bulk density, and nitrate nitrogen (R2 < 0.60).
Among the machine learning algorithms, ANN and CatBoost were the most consistent and highest-performing algorithms in the MIR region across all soil properties (except nitrate nitrogen). In the Vis–NIR region, Ridge, ANN, CatBoost, and PLSR produced the highest but most variable performances, depending on the soil property and preprocessing condition.

4. Discussion

The wide variability observed across the eleven soil properties reflects the broad range of soil types and conditions represented in the KSSL dataset [2,12,16]. The right-skewed distributions observed for most properties indicate that lower to moderate values are more common, with fewer samples exhibiting high concentrations or extreme values. Similar right-skewed distribution patterns for organic carbon, total carbon, total nitrogen, total sulfur, and nitrate nitrogen are consistent with their close association with soil organic matter and nutrient pools, which often occur at relatively low levels across large geographic datasets [21]. Soil pH exhibited a broad range from acidic to moderately alkaline conditions, indicating substantial heterogeneity in soil chemical environments across the dataset. The contrasting distributions of clay and sand content highlight the diversity of soil textures in the dataset and help explain differences in properties such as cation exchange capacity, which is typically higher in finer-textured soils [22]. This variability provides a strong fundamental foundation for developing and generalizable prediction models [23,24].
Results from this study clearly showed that spectral preprocessing—specifically baseline correction combined with standard normal variate transformation —plays a critical role in improving soil property prediction accuracy, particularly within the Vis–NIR region where scattering, illumination differences, and baseline shifts are more pronounced [25]. Preprocessing effectively reduced spectral noise, minimizing baseline variation, and enhanced the clarity of diagnostic features in both spectral domains (Figure 3). These improvements translate into more stable modeling performance. Although MIR spectra already show strong, well-defined absorptions due to fundamental molecular vibrations [26,27], preprocessing still led to notable accuracy gains for certain chemical properties such as potassium, bulk density, and nitrate nitrogen. This indicated that even high-quality MIR signals benefit from normalization and noise reduction, which help reveal subtle but important spectral features. In contrast, Vis–NIR continued to showed weaker predictive performance for potassium, bulk density, and nitrate nitrogen despite improvements with preprocessing, suggesting inherently lower spectral sensitivity in this region for these properties [28]. Nevertheless, preprocessing substantially reduced spectral variability and improved performance for several properties, supporting its necessity for Vis–NIR applications.
The strong and consistent performance of ANN and CatBoost across both spectral regions highlighted the importance of flexible, nonlinear machine learning algorithms in soil spectroscopy. These algorithms are capable of capturing complex, nonlinear relationships between spectral data and soil properties that traditional linear regression algorithms often fail to represent [29,30]. Their superior R2 values and lower prediction errors further emphasized the advantages of modern nonlinear machine learning approaches. Consistent with these findings, previous studies have reported improved prediction accuracy for organic carbon, pH, and clay using ANN compared to PLSR [31], while CatBoost has been shown to outperform RF in predicting clay content [32].
Overall, the findings reinforced that MIR spectroscopy—particularly when combined with baseline correction and standard normal variate transformation and coupled with ANN or CatBoost machine learning algorithms—provides the most accurate and reliable predictions across a broad range of soil properties. However, Vis–NIR spectroscopy remains advantageous for portable and field-based applications, especially when appropriate spectral preprocessing and machine learning algorithms are applied. Collectively, these results emphasize the importance of integrating effective spectral preprocessing, informed spectral region selection, and advanced machine learning approaches to improve the robustness and generalizability of soil spectroscopy workflows across diverse soil conditions.

5. Conclusions

This study demonstrated that applying spectral preprocessing substantially improved the predictive reliability of both Vis–NIR and MIR spectra. Although several soil properties, including organic carbon, total carbon, total nitrogen, and total sulfur, were already predicted with high accuracy using raw spectra, preprocessing further enhanced model stability and interpretability. However, given the wide range of preprocessing techniques reported in the literature, such improvements are not universal; therefore, preprocessing methods should be done carefully, considering the spectral characteristics and the soil properties of interest.
With respect to spectral region, MIR consistently outperformed Vis–NIR for every soil property, reflecting its stronger fundamental absorptions and higher sensitivity to soil chemical and physical properties. Across all machine learning algorithms, ANN and CatBoost emerged as the most reliable and highest-performing approaches across spectral regions and preprocessing conditions.
Overall, this study demonstrates that integrating appropriate spectral preprocessing, informed spectral region selection, and advanced machine learning algorithms significantly enhances the accuracy, robustness, and generalizability of soil property predictions using spectroscopy. These findings support the development of scalable and cost-effective soil assessment workflows and highlight their relevance for precision agriculture and soil health monitoring across diverse soil conditions.

Supplementary Materials

The following supporting information can be downloaded at: https://www.mdpi.com/article/10.3390/blsf2025054021/s1, Table S1: Comparison of predictive performance for soil properties using visible and near-infrared (Vis–NIR) and mid-infrared (MIR) spectral data under raw and preprocessed (combination of baseline correction and standard normal variate transformation) conditions. Model performance is reported for eight machine learning algorithms: partial least squares regression (PLSR), random forest (RF), artificial neural network (ANN), categorical boosting (CatBoost), k-nearest neighbors (KNN), ridge regression (Ridge), least absolute shrinkage and selection operator (LASSO), and elastic net regression (Elastic Net). Performance metrics include root mean square error (RMSE), coefficient of determination (R2), mean prediction bias (Bias), and ratio of performance to interquartile distance (RPIQ). A subset of the United States Department of Agriculture–Natural Resources Conservation Service–National Soil Survey Center–Kellogg Soil Survey Laboratory soil spectral library (KSSL; n = 8304) was randomly split into training (70%) and testing (30%) subsets for to model development and soil property prediction.

Author Contributions

Conceptualization, Y.G.; methodology, Y.G.; software, Y.G.; validation, Y.G. and N.K.W.; formal analysis, Y.G.; investigation, Y.G.; resources, Y.G. and N.K.W.; data curation, Y.G.; writing—original draft preparation, Y.G.; writing—review and editing, N.K.W.; visualization, Y.G.; supervision, N.K.W. All authors have read and agreed to the published version of the manuscript.

Funding

This research received no external funding.

Institutional Review Board Statement

Not applicable.

Informed Consent Statement

Not applicable.

Data Availability Statement

The soil spectral and laboratory data used in this study originate from the United States Department of Agriculture–Natural Resources Conservation Service–National Soil Survey Center–Kellogg Soil Survey Laboratory soil spectral library. These data are publicly accessible and can be requested through the following link: https://www.nrcs.usda.gov/conservation-basics/natural-resource-concerns/soil/kellogg-soil-survey-laboratory-kssl (accessed on 1 August 2024).

Acknowledgments

The authors acknowledge the staff of the United States Department of Agriculture–Natural Resources Conservation Service–National Soil Survey Center–Kellogg Soil Survey Laboratory for providing access to the visible–near-infrared and mid-infrared spectral libraries that made this research possible. We also extend our appreciation for their long-standing efforts in maintaining and curating the national soil characterization database, which supports soil science research worldwide.

Conflicts of Interest

The authors declare no conflicts of interest.

Abbreviations

The following abbreviations were used in this manuscript:
Vis–NIRVisible–near-infrared
MIRMid-infrared
KSSL datasetA subset of the United States Department of Agriculture–Natural Resources Conservation Service–National Soil Survey Center–Kellogg Soil Survey Laboratory soil spectral library
RidgeRidge regression
ANNArtificial neural network
CatBoostCategorical boosting
KNNk-Nearest neighbors
LASSOLeast absolute shrinkage and selection operator
ElasticNetElastic net regression
RFRandom forest
PLSRPartial least squares regression

References

  1. Shepherd, K.D.; Walsh, M.G. Development of Reflectance Spectral Libraries for Characterization of Soil Properties. Soil Sci. Soc. Am. J. 2002, 66, 988–998. [Google Scholar] [CrossRef]
  2. Shepherd, K.D.; Walsh, M.G. Infrared Spectroscopy—Enabling an Evidence-Based Diagnostic Surveillance Approach to Agricultural and Environmental Management in Developing Countries. J. Infrared Spectrosc. 2007, 15, 1–19. [Google Scholar] [CrossRef] [Scilit]
  3. Ahmadi, A.; Emami, M.; Daccache, A.; He, L. Soil Properties Prediction for Precision Agriculture Using Visible and Near-Infrared Spectroscopy: A Systematic Review and Meta-Analysis. Agronomy 2021, 11, 433. [Google Scholar] [CrossRef] [Scilit]
  4. Madari, B.E.; Reeves, J.B.; Machado, P.L.O.A.; Guimarães, C.M.; Torres, E.; McCarty, G.W. Mid- and near-Infrared Spectroscopic Assessment of Soil Compositional Parameters and Structural Indices in Two Ferralsols. Geoderma 2006, 136, 245–259. [Google Scholar] [CrossRef] [Scilit]
  5. Pirie, A.; Singh, B.; Islam, K. Ultra-Violet, Visible, near-Infrared, and Mid-Infrared Diffuse Reflectance Spectroscopic Techniques to Predict Several Soil Properties. Soil Res. 2005, 43, 713–721. [Google Scholar] [CrossRef] [Scilit]
  6. Dotto, A.C.; Dalmolin, R.S.D.; Ten Caten, A.; Grunwald, S. A Systematic Study on the Application of Scatter-Corrective and Spectral-Derivative Preprocessing for Multivariate Prediction of Soil Organic Carbon by Vis-NIR Spectra. Geoderma 2018, 314, 262–274. [Google Scholar] [CrossRef] [Scilit]
  7. Gholizadeh, A.; Borůvka, L.; Saberioon, M.M.; Kozák, J.; Vašát, R.; Němeček, K. Comparing Different Data Preprocessing Methods for Monitoring Soil Heavy Metals Based on Soil Spectral Features. Soil Water Res. 2015, 10, 218–227. [Google Scholar] [CrossRef] [Scilit]
  8. Seybold, C.A.; Ferguson, R.; Wysocki, D.; Bailey, S.; Anderson, J.; Nester, B.; Schoeneberger, P.; Wills, S.; Libohova, Z.; Hoover, D.; et al. Application of Mid-Infrared Spectroscopy in Soil Survey. Soil Sci. Soc. Am. J. 2019, 83, 1746–1759. [Google Scholar] [CrossRef] [Scilit]
  9. Kramer, K.E.; Morris, R.E.; Rose-Pehrsson, S.L. Comparison of Two Multiplicative Signal Correction Strategies for Calibration Transfer without Standards. Chemom. Intell. Lab. Syst. 2008, 92, 33–43. [Google Scholar] [CrossRef] [Scilit]
  10. Gamagedara, Y.; Feng, G.; Waiser, T.; Tagert, M.L.; Martins, V.S.; Wijewardane, N.K. Application of Calibration Transfer Techniques between Different Mid-infrared Spectrometers/Modules to Improve Accuracy in Estimating Soil Properties. Soil Sci. Soc. Am. J. 2025, 89, e70147. [Google Scholar] [CrossRef] [Scilit]
  11. Wijewardane, N.K.; Ge, Y.; Morgan, C.L.S. Prediction of Soil Organic and Inorganic Carbon at Different Moisture Contents with Dry Ground VNIR: A Comparative Study of Different Approaches. Eur. J. Soil Sci. 2016, 67, 605–615. [Google Scholar] [CrossRef] [Scilit]
  12. Dangal, S.R.S.; Sanderman, J.; Wills, S.; Ramirez-Lopez, L. Accurate and Precise Prediction of Soil Properties from a Large Mid-Infrared Spectral Library. Soil Syst. 2019, 3, 11. [Google Scholar] [CrossRef] [Scilit]
  13. Soil Survey Staff. Kellogg Soil Survey Laboratory Methods Manual; Soil Survey Investigations Report No. 42, Version 6.0.; Part1: Current Methods; U.S. Department of Agriculture, Natural Resources Conservation Service: Washington, DC, USA, 2022. [Google Scholar]
  14. Wijewardane, N.K.; Ge, Y.; Wills, S.; Loecke, T. Prediction of Soil Carbon in the Conterminous United States: Visible and Near Infrared Reflectance Spectroscopy Analysis of the Rapid Carbon Assessment Project. Soil Sci. Soc. Am. J. 2016, 80, 973–982. [Google Scholar] [CrossRef] [Scilit]
  15. Wills, S.; Loecke, T.; Sequeira, C.; Teachman, G.; Grunwald, S.; West, L.T. Overview of the U.S. Rapid Carbon Assessment Project: Sampling Design, Initial Summary and Uncertainty Estimates. In Soil Carbon; Hartemink, A.E., McSweeney, K., Eds.; Springer International Publishing: Cham, Switzerland, 2014; pp. 95–104. ISBN 978-3-319-04083-7. [Google Scholar]
  16. Gamagedara, Y.; Wijewardane, N.K.; Feng, G.; Seybold, C.; Williams, M.; Tagert, M.L.; Martins, V.S. Can We Use a Mid-Infrared Fine-Ground Soil Spectral Library to Predict Non-Fine-Ground Spectra? Geoderma 2024, 443, 116799. [Google Scholar] [CrossRef] [Scilit]
  17. Shepherd, K.D.; Ferguson, R.; Hoover, D.; Van Egmond, F.; Sanderman, J.; Ge, Y. A Global Soil Spectral Calibration Library and Estimation Service. Soil Secur. 2022, 7, 100061. [Google Scholar] [CrossRef] [Scilit]
  18. Eilers, P.; Boelens, H. Baseline Correction with Asymmetric Least Squares Smoothing. Leiden Univ. Med. Cent. Rep. 2005, 1, 5. [Google Scholar]
  19. Barnes, R.J.; Dhanoa, M.S.; Lister, S.J. Standard Normal Variate Transformation and De-Trending of Near-Infrared Diffuse Reflectance Spectra. Appl. Spectrosc. 1989, 43, 772–777. [Google Scholar] [CrossRef] [Scilit]
  20. Python Software Foundation. Python Language Reference, version 3.13.9; Python Software Foundation: Wilmington, DE, USA, 2025. Available online: https://www.python.org (accessed on 18 January 2026).
  21. Tipping, E.; Somerville, C.J.; Luster, J. The C:N:P:S Stoichiometry of Soil Organic Matter. Biogeochemistry 2016, 130, 117–131. [Google Scholar] [CrossRef] [Scilit]
  22. Räty, M.; Keskinen, R.; Yli-Halla, M.; Hyvönen, J.; Soinne, H. Estimating Cation Exchange Capacity and Clay Content from Agricultural Soil Testing Data. Agric. Food Sci. 2021, 30, 131–145. [Google Scholar] [CrossRef] [Scilit]
  23. Rossel, R.A.V.; Behrens, T. Using Data Mining to Model and Interpret Soil Diffuse Reflectance Spectra. Geoderma 2010, 158, 46–54. [Google Scholar] [CrossRef] [Scilit]
  24. Stenberg, B.; Viscarra Rossel, R.A.; Mouazen, A.M.; Wetterlind, J. Visible and Near Infrared Spectroscopy in Soil Science. In Advances in Agronomy; Elsevier: Amsterdam, The Netherlands, 2010; Volume 107, pp. 163–215. ISBN 978-0-12-381033-5. [Google Scholar]
  25. Rinnan, Å.; Berg, F.V.D.; Engelsen, S.B. Review of the Most Common Pre-Processing Techniques for near-Infrared Spectra. TrAC Trends Anal. Chem. 2009, 28, 1201–1222. [Google Scholar] [CrossRef] [Scilit]
  26. Ng, W.; Minasny, B.; Jeon, S.H.; McBratney, A. Mid-Infrared Spectroscopy for Accurate Measurement of an Extensive Set of Soil Properties for Assessing Soil Functions. Soil Secur. 2022, 6, 100043. [Google Scholar] [CrossRef] [Scilit]
  27. Bellon-Maurel, V.; McBratney, A. Near-Infrared (NIR) and Mid-Infrared (MIR) Spectroscopic Techniques for Assessing the Amount of Carbon Stock in Soils—Critical Review and Research Perspectives. Soil Biol. Biochem. 2011, 43, 1398–1410. [Google Scholar] [CrossRef] [Scilit]
  28. Soriano-Disla, J.M.; Janik, L.J.; Viscarra Rossel, R.A.; Macdonald, L.M.; McLaughlin, M.J. The Performance of Visible, Near-, and Mid-Infrared Reflectance Spectroscopy for Prediction of Soil Physical, Chemical, and Biological Properties. Appl. Spectrosc. Rev. 2014, 49, 139–186. [Google Scholar] [CrossRef] [Scilit]
  29. Guo, Y.; He, J.; Chen, Z.; Zhang, Y.; Wei, P.; Ye, S.; Shi, Z.; Zhang, H.; Zeng, K.; Wang, L. Exploration of the Primary Controlling Factors of Soil Organic Carbon in Agricultural Land Based on the CatBoost Model and Multisource Data. In Proceedings of the International Conference on Remote Sensing, Mapping, and Image Processing (RSMIP 2025), Sanya, China, 17–19 January 2025; Tosti, F., Alvarez, R., Eds.; SPIE: Bellingham, WA, USA, 2025; p. 6. [Google Scholar]
  30. Tiwari, S.K.; Saha, S.K.; Kumar, S. Prediction Modeling and Mapping of Soil Carbon Content Using Artificial Neural Network, Hyperspectral Satellite Data and Field Spectroscopy. Adv. Remote Sens. 2015, 4, 63–72. [Google Scholar] [CrossRef]
  31. Kuang, B.; Tekin, Y.; Mouazen, A.M. Comparison between Artificial Neural Network and Partial Least Squares for On-Line Visible and near Infrared Spectroscopy Measurement of Soil Organic Carbon, pH and Clay Content. Soil Tillage Res. 2015, 146, 243–252. [Google Scholar] [CrossRef] [Scilit]
  32. Chen, W.; Wan, X.; Ding, J.; Wang, T. Enhancing Clay Content Estimation through Hybrid CatBoost-GP with Model Class Selection. Transp. Geotech. 2024, 45, 101232. [Google Scholar] [CrossRef] [Scilit]
Figure 1. Schematic representation of the modeling workflows used in this study for raw and preprocessed visible–near-infrared (Vis–NIR) and mid-infrared (MIR) spectra. Panel (a) illustrates the workflow using raw spectra, in which a subset of the United States Department of Agriculture–Natural Resources Conservation Service–National Soil Survey Center–Kellogg Soil Survey Laboratory soil spectral library (KSSL, n = 8304) was randomly split into training (70%) and testing (30%) subsets prior to machine learning algorithm training and soil property prediction. Panel (b) presents the workflow for preprocessed spectra, where baseline correction and standard normal variate transformation were applied before the same train–test split and model training.
Blsf 54 00021 g001
Figure 2. Distribution of 11 laboratory-measured soil properties in a subset of the United States Department of Agriculture–Natural Resources Conservation Service–National Soil Survey Center–Kellogg Soil Survey Laboratory soil spectral library (KSSL, n = 8304). Boxplots represent organic carbon (OC), total carbon (TC), total nitrogen (TN), cation exchange capacity (CEC), clay, sand, total sulfur (TS), pH, potassium (K), bulk density (BD), and nitrate nitrogen (NO3−–N). Boxes represent the interquartile range (IQR), center lines indicate medians, points indicate mean, and whiskers extend to 1.5 × IQR. Outliers are not shown.
Blsf 54 00021 g002
Figure 3. Raw and visible–near-infrared (Vis–NIR) and mid-infrared (MIR) spectra for a subset of the United States Department of Agriculture–Natural Resources Conservation Service–National Soil Survey Center–Kellogg Soil Survey Laboratory soil spectral library (KSSL, n = 8304). The left column shows the full set of spectral curves, while the right column presents the corresponding summary statistics, including the median spectrum and interquartile range (IQR; 25th–75th percentile). Panels (a) and (e) display the raw Vis–NIR reflectance and MIR absorbance spectra, respectively, and panels (c,g) show spectra after baseline correction and standard normal variate transformation. Panels (b,d,f,h) illustrate the median spectral profiles with their associated IQR bands.
Blsf 54 00021 g003
Figure 4. Comparison of predictive performance for soil properties using Vis–NIR and MIR spectral data under raw and preprocessed (combination of baseline correction and standard normal variate transformation) conditions. Panels (a) and (b) present Vis–NIR results for raw and preprocessed, respectively, while panels (c,d) present MIR results under the same conditions. Each heatmap shows the coefficient of determination (R2) for eight machine learning algorithms: ridge regression (Ridge), artificial neural network (ANN), categorical boosting (CatBoost), k-nearest neighbors (KNN), least absolute shrinkage and selection operator (LASSO), elastic net regression, random forest (RF), and partial least squares regression (PLSR). Predictions were evaluated across eleven soil properties: organic carbon (OC), total carbon (TC), total nitrogen (TN), cation exchange capacity (CEC), clay, sand, total sulfur (TS), pH, potassium (K), bulk density (BD), and nitrate nitrogen (NO3−–N). Higher R2 values (dark blue background) indicate better predictive performance. The y-axis lists soil properties, and the x-axis lists machine learning algorithms. All results are based on predictions from the independent test dataset.
Blsf 54 00021 g004
Disclaimer/Publisher’s Note: The statements, opinions and data contained in all publications are solely those of the individual author(s) and contributor(s) and not of MDPI and/or the editor(s). MDPI and/or the editor(s) disclaim responsibility for any injury to people or property resulting from any ideas, methods, instructions or products referred to in the content.