Proceeding Paper

In-Field Hyperspectral Proximal Sensing for Estimating Grapevine Water Status to Support Smart Precision Viticulture †

1
Department of Geosciences, Environment and Spatial Planning, Faculty of Sciences, University of Porto, Rua do Campo Alegre, S/N, 4169-007 Porto, Portugal
2
Social-Environmental and Water Resources Institute, Federal Rural University of Amazon, Presidente Tancredo Neves Av., 2501, Belém 66077-830, PA, Brazil
3
INESC TEC—Institute for Systems and Computer Engineering, Technology and Science, Campus da Faculdade de Engenharia, Universidade do Porto, Rua Dr. Roberto Frias, S/N, 4200-465 Porto, Portugal
4
Associação para o Desenvolvimento da Viticultura Duriense, Edifício Centro de Excelência da Vinha e do Vinho Parque de Ciência e Tecnologia de Vila Real, Régia Douro Park, 5000-033 Vila Real, Portugal
*
Author to whom correspondence should be addressed.
Presented at the 3rd International Electronic Conference on Agronomy, 15–30 October 2023; Available online: https://iecag2023.sciforum.net/.
Biol. Life Sci. Forum 2023, 27(1), 54; https://doi.org/10.3390/IECAG2023-15871
Published: 7 November 2023
(This article belongs to the Proceedings of The 3rd International Electronic Conference on Agronomy)

Abstract

:
Predawn leaf water potential (Ψpd) is the main parameter to determine plant water status, and it has been broadly used to support irrigation management. However, the Scholander pressure chamber methodology is laborious, time-consuming and invasive. This study examined a low-cost hyperspectral proximal sensor to estimate the Ψpd in grapevine (Vitis vinifera L.). For this, both the Ψpd and spectral reflectance (340–850 nm) were accessed in grapevines in a commercial vineyard located in the Douro Wine Region, northeast Portugal. A machine-learning algorithm was tested and validated to assess grapevine’s water status. The experiment was performed in a randomized design with 12 grapevines (cv. Touriga Nacional) per irrigation treatment: non-irrigated, 30% crop evapotranspiration (Etc), and 60% Etc. The dataset was analyzed using Principal Component Analysis (PCA), and the machine-learning regression algorithm applied was Extreme Gradient Boosting (Xgboost). Results from the validation dataset (n = 108) for the Xgboost tested exhibited a root mean square error (RMSE) of 0.23 MPa, a mean absolute error (MAPE) of 16.57% and an R² value of 0.95. These results demonstrate that the hyperspectral sensor and Xgboost algorithm show potential for predicting the Ψpd in vineyards, regardless of a plant’s water status.

1. Introduction

Viticulture is an activity of major economic importance in Mediterranean regions. However, climatic changes have affected wine production and quality over the years in these regions [1]. Because of that, irrigated vineyards have been increasing due to the necessity to reduce climatic changes’ effects on viticulture [2]. Simultaneously, human habits demand water resources and put pressure on agriculture to reduce water waste and improve irrigation management [2,3].
Predawn leaf water potential (Ψpd) is an eco-physiological indicator used to assess grapevine’s water status and support irrigation management in vineyards [4]. Commonly, it is measured using a Scholander pressure chamber. Nonetheless, this method is destructive, time-consuming, laborious, and depends on set of measurement points to represent large planting areas [5].
Technological advances such as optical sensors are a fast, cost-effective, and non-invasive method to estimate Ψpd with high accuracy [6]. Specifically, hyperspectral proximal sensors and machine-learning algorithms showed good results in predicting Ψpd [7]. However, more studies are necessary to develop this technology, focusing on making it economical and readily available to wine producers [8]. This study examined a low-cost hyperspectral proximal sensor to estimate the Ψpd in grapevine (Vitis vinifera L.).

2. Materials and Methods

2.1. Test Site

The research was carried out in Quinta dos Aciprestes (41.21° N; 7.43° W; 145 m), a commercial vineyard (wine company Real Companhia Velha) in the Douro Wine Region, northeast of Portugal (Figure 1). The vines in the test site follow a Bilateral Royat System, with canopy height around 1.5 m and plant spacing of 2.2 m × 1 m. The cultivar studied was Touriga Nacional, in a randomized design in 2 plots, with two replicate areas. Each plot included three irrigation treatments: non-irrigated, irrigation to replace 30% of evapotranspiration (Etc) water volume, and 60% Etc, managed by the wine company. For each irrigation treatment, we considered six grapevines, totaling 36 grapevines being assessed.

2.2. Predawn Leaf Water Potential and Spectroscopy Methodology

The predawn leaf water potential (Ψpd) was measured using a Scholander pressure chamber [9] (PMS600, Albany, OR, USA) at predawn on one leaf from each vine per block sampled. The hyperspectral data were measured using a prototype directed vertically close to the leaf, which recorded reflectance signatures between 340 nm and 850 nm of the electromagnetic spectrum [10]. The Ψpd and hyperspectral data were measured in the same leaves during six consecutive weeks in 2022 after veraison (25 July) on evaluation dates: 28 July—3 days after veraison (DAV), 4 August (10 DAV), 11 August (17 DAV), 19 August (25 DAV), 25 August (31 DAV) and 1 September (38 DAV), totaling 216 observations.

2.3. Statistical and Principal Component Analysis

A one-way analysis of variance (ANOVA) with a p-value associated with Fisher’s exact test (p ≤ 0.05) was performed to compare the means of Ψpd between the irrigation treatments and the evaluation dates.
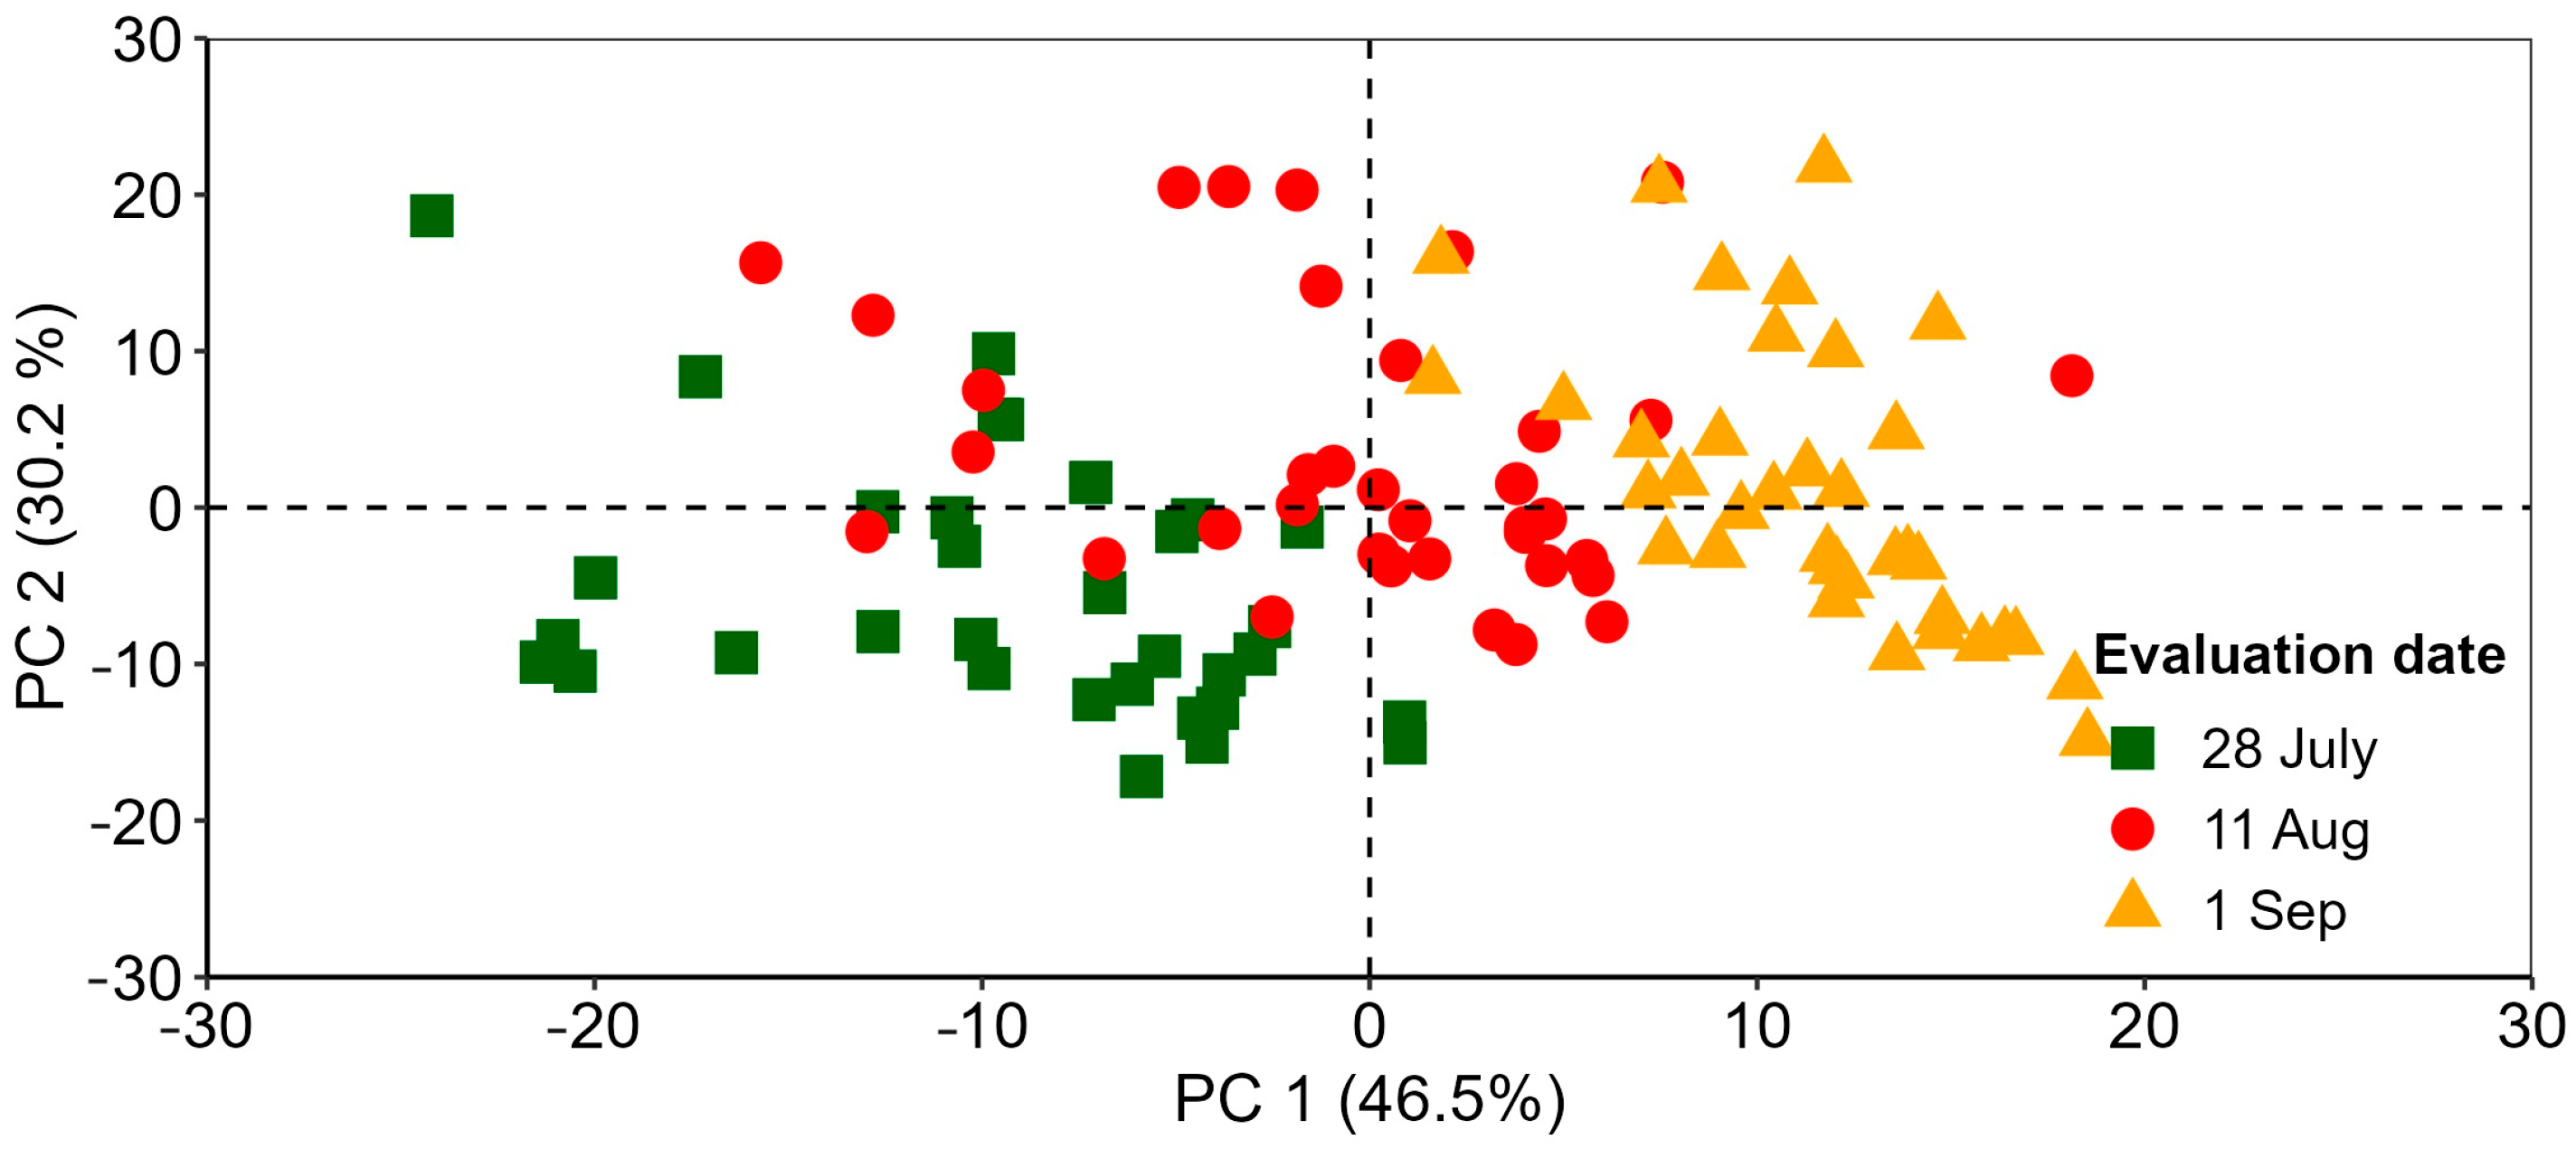
A Principal Component Analysis (PCA) was performed to discover patterns that could explain the variance of spectral data on evaluation dates. The PCA considered three evaluation dates to represent the different stages of grape ripening: 28 July (3 DAV), 11 August (17 DAV) and 1 September (38 DAV).

2.4. Data Processing and Modelling

A multiplicative scattering correction logarithm was applied in the hyperspectral reflectance to correct baseline and scattering artefacts in spectra data before algorithm processing [7].
The machine-learning algorithm tested was Extreme Gradient Boosting (Xgboost). For Xgboost’s application, the dataset was randomly split into two sub-datasets: 50% to calibration (n = 108 observations) and 50% to validation (n = 108 observations) [11]. The statistical analysis and machine-learning algorithm were computed in R (version 4.2.3) [12].
Model performance in estimating Ψpd was evaluated based on the coefficient of determination (R²), root mean square error (RMSE), and mean absolute error (MAPE).

3. Results

Table 1 presents statistical results of the measured Ψpd and shows significant differences among all the evaluation dates and irrigation treatments. Considering the evaluation dates, non-irrigated grapevines presented a better statistical mean than irrigated grapevines. Due to a 1.6 mm precipitation on 10 August (16 DAV), the values of the Ψpd since 4 August showed a variability, mainly in 30% Etc treatment.
Figure 2 shows PCA that the spectral data in the evaluation dates indicate different cycles of leaf development. The first two principal components accounted for a variance > 75%. The figure represents the clustering according the dates of assessment, suggesting that the leaf’s ageing and abiotic stress (e.g., water stress) was be detectable through spectral data. The spectral data is grouped by evaluation date in a pattern related to the changes in the leaves’ composition caused by aging.
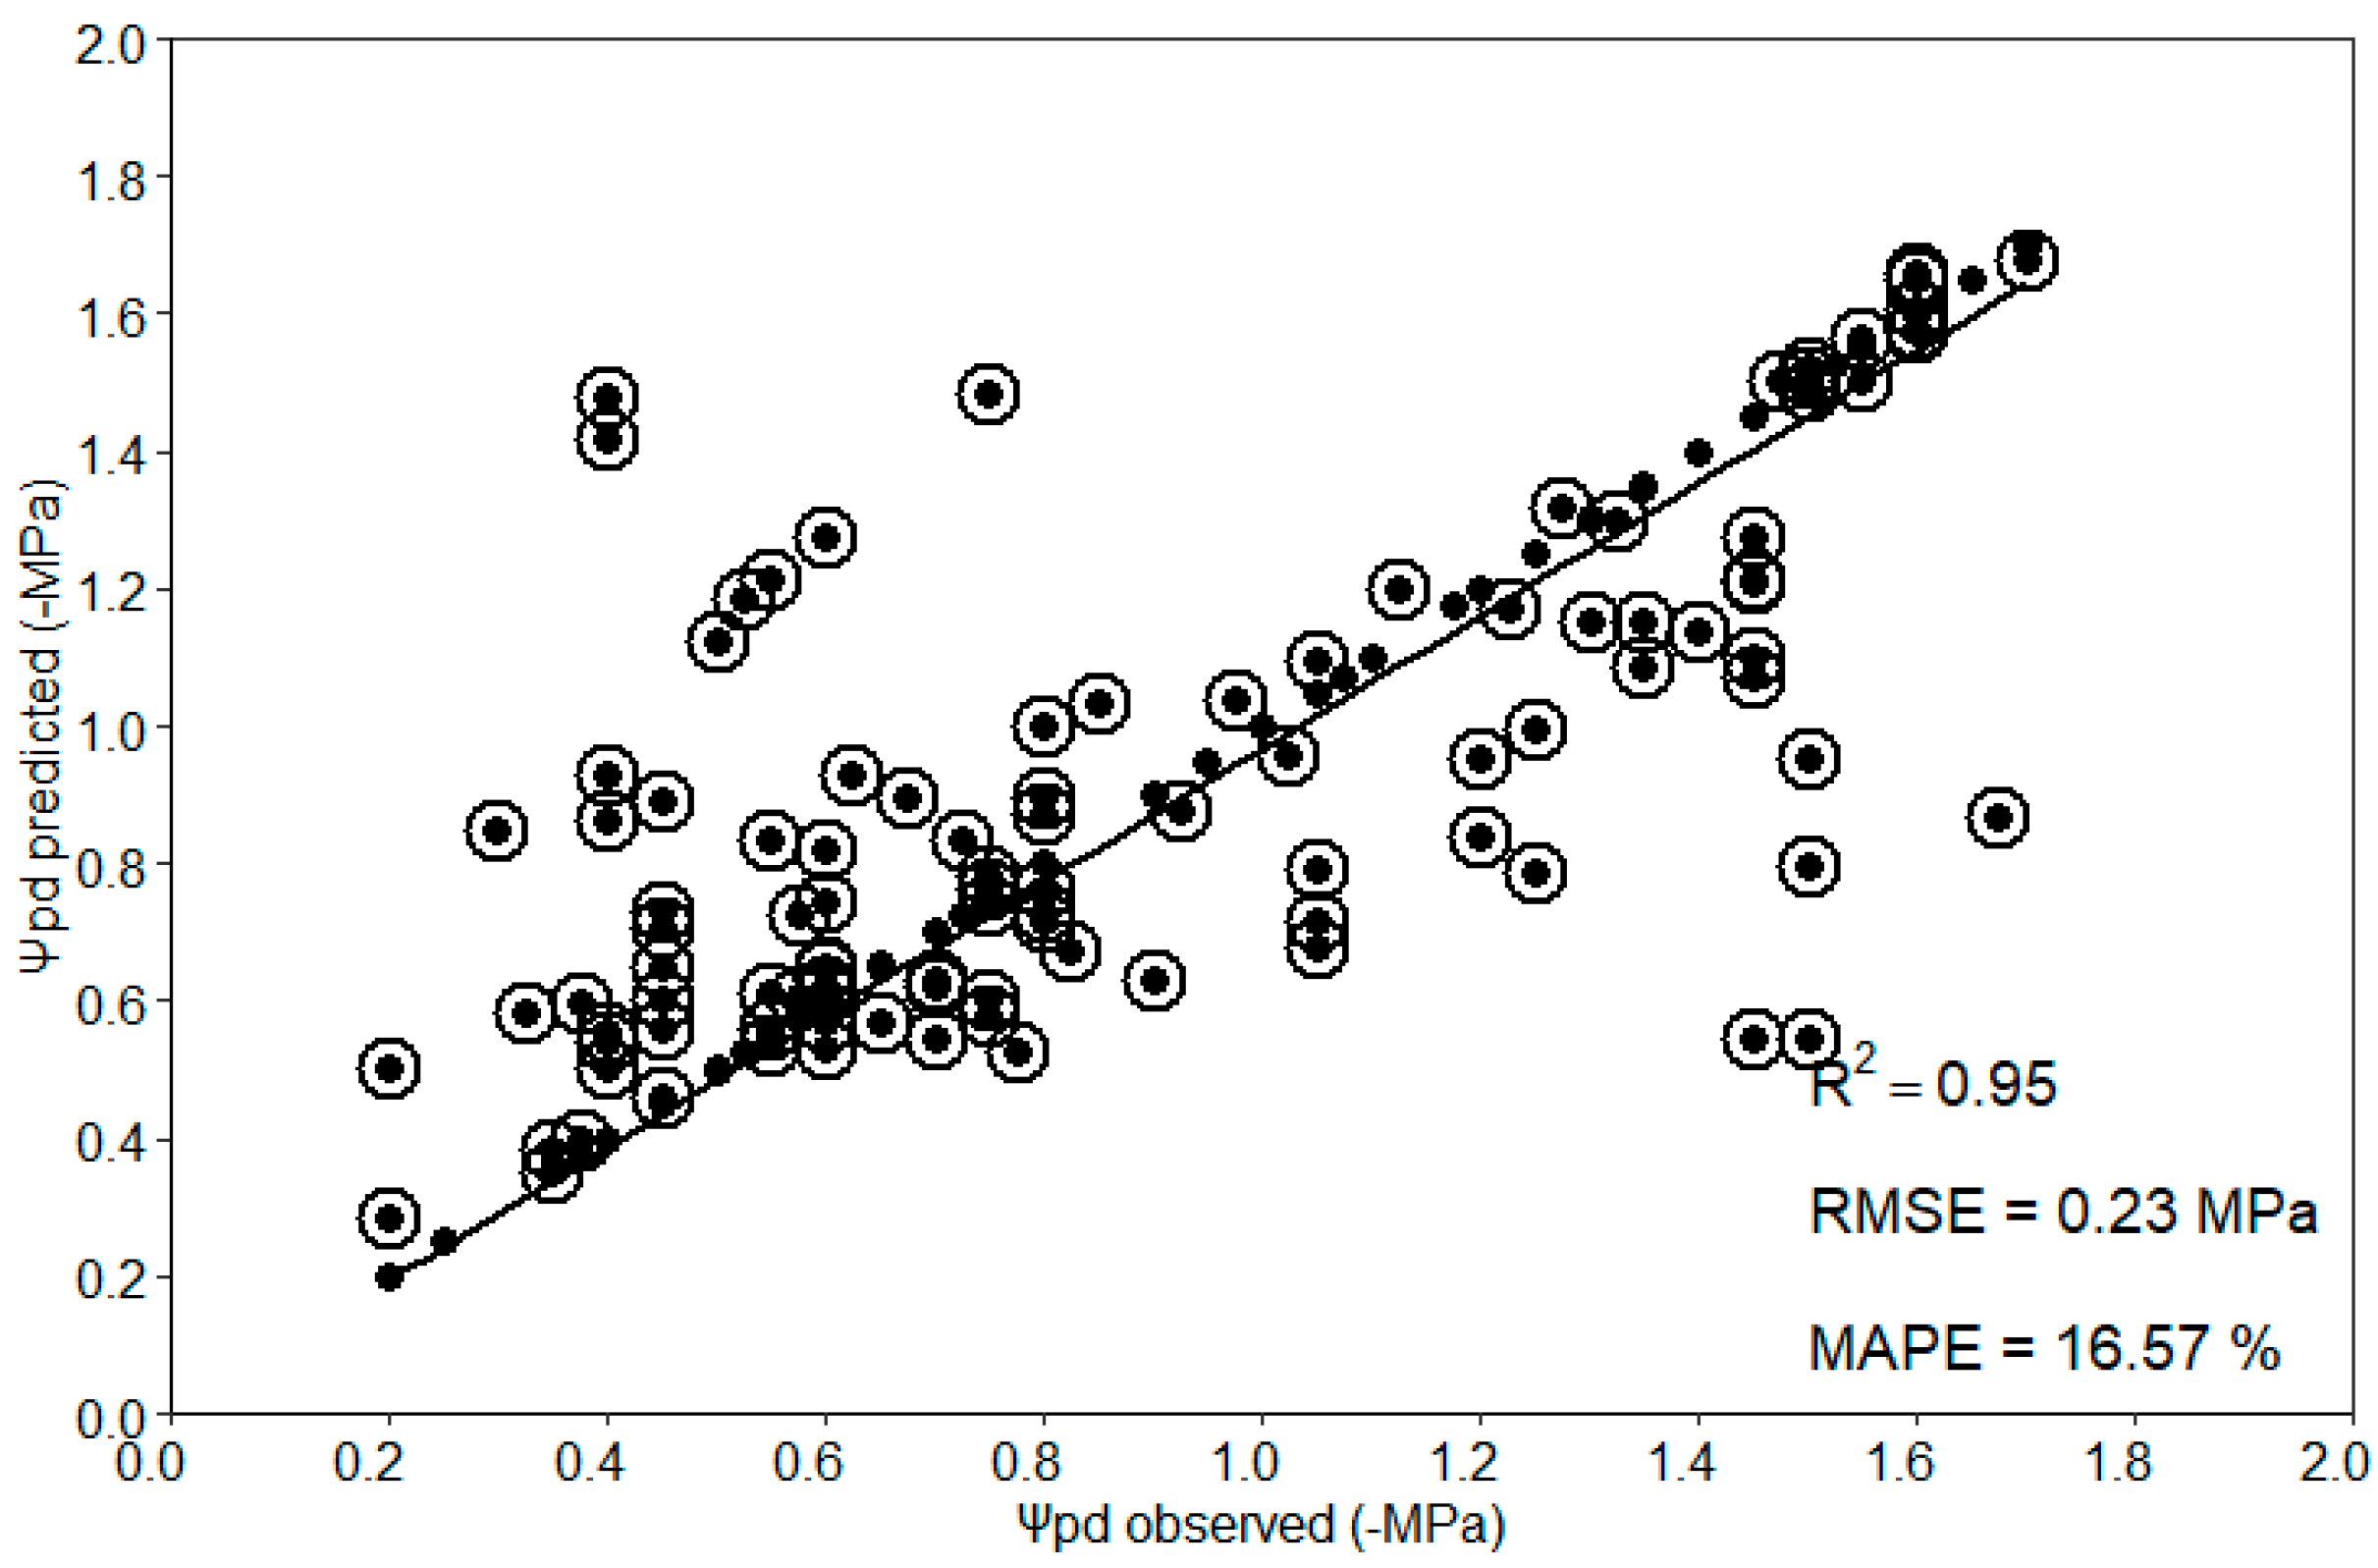
Table 2 and Figure 3 show the performance of the Extreme Gradient Boosting regression model. This model performed a variance of 0.95% in Ψpd prediction, the RMSE of 0.23 MPa and the MAPE of 16.57%. The R2 of 1 and RMSE of 0.00 in the training dataset indicate that there is a tendency of overfitting behavior observed in data features, probably due to the structure of the data. Figure 3 supports the tendency of overfitting, showing an effective metric for the training dataset and a lower prediction in the validation dataset.

4. Discussion

Low water regimes can induce water stress symptoms in grapevines and affect their phenology. Water stress causes stomata closure; in consequence, leaf temperatures increase through reducing transpiration rates and reducing CO2 concentration, along with photodamage to photosystem II (PSII) reaction centers [13]. Spectral sensors provide information about plant physiology before water stress impacts on grapevine productivity.
The low-cost hyperspectral proximal sensor shows promising results in estimating the Ψpd in grapevine. The prototype sensor predicted the Ψpd considering a variance between −0.2 MPa and −1.7 MPa with an error of 0.23 MPa. These results allow for the use of the sensor by grapevine producers that conduct their vineyard under deficit irrigation. In these areas, the irrigation schedule starts when vineyards present Ψpd values below −0.4 MPa [14], inside the range detected by the sensor studied.
Even though the Scholander pressure chamber is a recognized method to access Ψpd, it is not widely applicable in large vineyards, besides being time and labor consuming. Jointly, the sensor and the Extreme Gradient Boosting model provide real-time and reliable detections of plants’ water status. They can be used to support irrigation decisions by winegrowers in an automated system that would allow adjustments in irrigation to the site-specific characteristics, according to yield and quality objectives [15].

5. Conclusions

This work shows the applicability of a low-cost hyperspectral proximal sensor and the Extreme Gradient Boosting regression model in predicting Ψpd by considering different evaluation dates and irrigation treatments. These results indicate the potential for this model and sensor to be applied in vineyards to support irrigation management.
There are other applications of this sensor to be studied, such as integrating this sensor in robots to optimize the measurements of Ψpd in vineyards, and quantifying berry quality parameters and leaves’ pigments.

Author Contributions

Conceptualization, E.D., R.T., I.G., H.P., L.R. and M.C.; methodology, E.D., R.T., I.G., H.P., R.M. and M.C.; validation, I.G., C.B., M.C., F.S. and R.M.; formal analysis, E.D., R.T. and M.C.; investigation, E.D., R.T., L.R., I.G., C.B., F.S., R.M. and M.C.; writing—original draft preparation, E.D., R.T., H.P. and M.C.; writing—review and editing, E.D., R.T., H.P. and M.C.; visualization, I.G., R.M., M.C.; supervision, H.P. and M.C.; project administration, M.C.; funding acquisition, F.S. and M.C. All authors have read and agreed to the published version of the manuscript.

Funding

This research was funded by National Funds through the FCT—Fundação para a Ciência e a Tecnologia, I.P. (Portuguese Foundation for Science and Technology) within the project OmicBots: High-Throughput Integrative Omic-Robots Platform for a Next Generation Physiology-based Precision Viticulture, with reference PTDC/ASP-HOR/1338/2021. https://www.fc.up.pt/omicbots/, accessed on 11 January 2024.

Institutional Review Board Statement

Not applicable.

Informed Consent Statement

Not applicable.

Data Availability Statement

The data supporting this study’s findings are available on request from the corresponding author, [MC]. The data are not publicly available due to information that could compromise the privacy of research participants (industry includes).

Acknowledgments

Renan Tosin and Leandro Rodrigues acknowledge Fundação para a Ciência e Tecnologia (FCT) PhD research grants Ref. SFRH/BD/145182/2019 and SFRH/BD 2023.01424. Rui Martins acknowledges Fundação para a Ciência e Tecnologia (FCT) research contract grant (CEEIND/017801/2018). Erica David acknowledges Santander Bank international mobility scholarship. The authors thank the wine company Real Companhia Velha and Associação para o Desenvolvimento da Viticultura Duriense (ADVID) for the field work facilities.

Conflicts of Interest

The authors declare no conflicts of interest.

References

  1. Jones, G.V.; Alves, F. Impacts of Climate Change on Wine Production: A Global Overview and Regional Assessment in the Douro Valley of Portugal. Int. J. Glob. Warm. 2012, 4, 383–406. [Google Scholar] [CrossRef]
  2. Costa, J.M.; Vaz, M.; Escalona, J.; Egipto, R.; Lopes, C.; Medrano, H.; Chaves, M.M. Modern viticulture in southern Europe: Vulnerabilities and strategies for adaptation to water scarcity. Agric. Water Manag. 2016, 164, 5–18. [Google Scholar] [CrossRef]
  3. Finco, A.; Bentivoglio, D.; Chiaraluce, G.; Alberi, M.; Chiarelli, E.; Maino, A.; Mantovani, F.; Montuschi, M.; Raptis, K.G.C.; Semenza, F.; et al. Combining Precision Viticulture Technologies and Economic Indices to Sustainable Water Use Management. Water 2022, 14, 1493. [Google Scholar] [CrossRef]
  4. Pôças, I.; Tosin, R.; Gonçalves, I.; Cunha, M. Toward a generalized predictive model of grapevine water status in Douro region from hyperspectral data. Agric. For. Meteorol. 2020, 280, 107793. [Google Scholar] [CrossRef]
  5. Tosin, R.; Pôças, I.; Gonçalves, I.; Cunha, M. Estimation of grapevine predawn leaf water potential based on hyperspectral reflectance data in Douro wine region. Vitis 2020, 59, 9–18. [Google Scholar] [CrossRef]
  6. Romero, M.; Luo, Y.; Sud, B.; Fuentes, S. Vineyard water status estimation using multispectral imagery from an UAV platform and machine learning algorithms for irrigation scheduling management. Comput. Electron. Agric. 2018, 147, 109–117. [Google Scholar] [CrossRef]
  7. Tosin, R.; Martins, R.; Pôças, I.; Cunha, M. Canopy VIS-NIR spectroscopy and self-learning artificial intelligence for a generalised model of predawn leaf water potential in Vitis vinifera. Biosyst. Eng. 2022, 219, 235–258. [Google Scholar] [CrossRef]
  8. Mirás-Avalos, J.; Araujo, E. Optimization of Vineyard Water Management: Challenges, Strategies, and Perspectives. Water 2021, 13, 746. [Google Scholar] [CrossRef]
  9. Scholander, P.F.; Bradstreet, E.D.; Hemmingsen, E.A.; Hammel, H.T. Sap Pressure in Vascular Plants: Negative hydrostatic pressure can be measured in plants. Science 1965, 148, 339–346. [Google Scholar] [CrossRef] [PubMed]
  10. Martins, R.C.; Barroso, T.G.; Jorge, P.; Cunha, M.; Santos, F. Unscrambling spectral interference and matrix effects in Vitis vinifera vis-nir spectroscopy: Towards analytical grade ‘in vivo’ sugars and acids quantification. Comput. Electron. Agric. 2022, 194, 106710. [Google Scholar] [CrossRef]
  11. Kuhn, M.; Johnson, K. Applied Predictive Modeling; Springer: New York, NY, USA, 2013; Volume 26. [Google Scholar]
  12. R Core Team. R: A Language and Environment for Statistical Computing; R Foundation for Statistical Computing: Vienna, Austria, 2023. [Google Scholar]
  13. Maimaitiyiming, M.; Ghulam, A.; Bozzolo, A.; Wilkins, J.L.; Kwasniewski, M.T. Early Detection of Plant Physiological Responses to Different Levels of Water Stress Using Reflectance Spectroscopy. Remote Sens. 2017, 9, 745. [Google Scholar] [CrossRef]
  14. Gonçalves, I. Impactes das Alterações Climáticas na Vitivinicultura da Região Demarcada do Douro e Medidas de Adaptação; Universidade de Trás-os-Montes e Alto Douro: Vila Real, Portugal, 2021. [Google Scholar]
  15. Fernandes de Oliveira, A.; Mameli, M.G.; Lo Cascio, M.; Sirca, C.; Satta, D. An Index for User-Friendly Proximal Detection of Water Requirements to Optimized Irrigation Management in Vineyards. Agronomy 2021, 11, 323. [Google Scholar] [CrossRef]
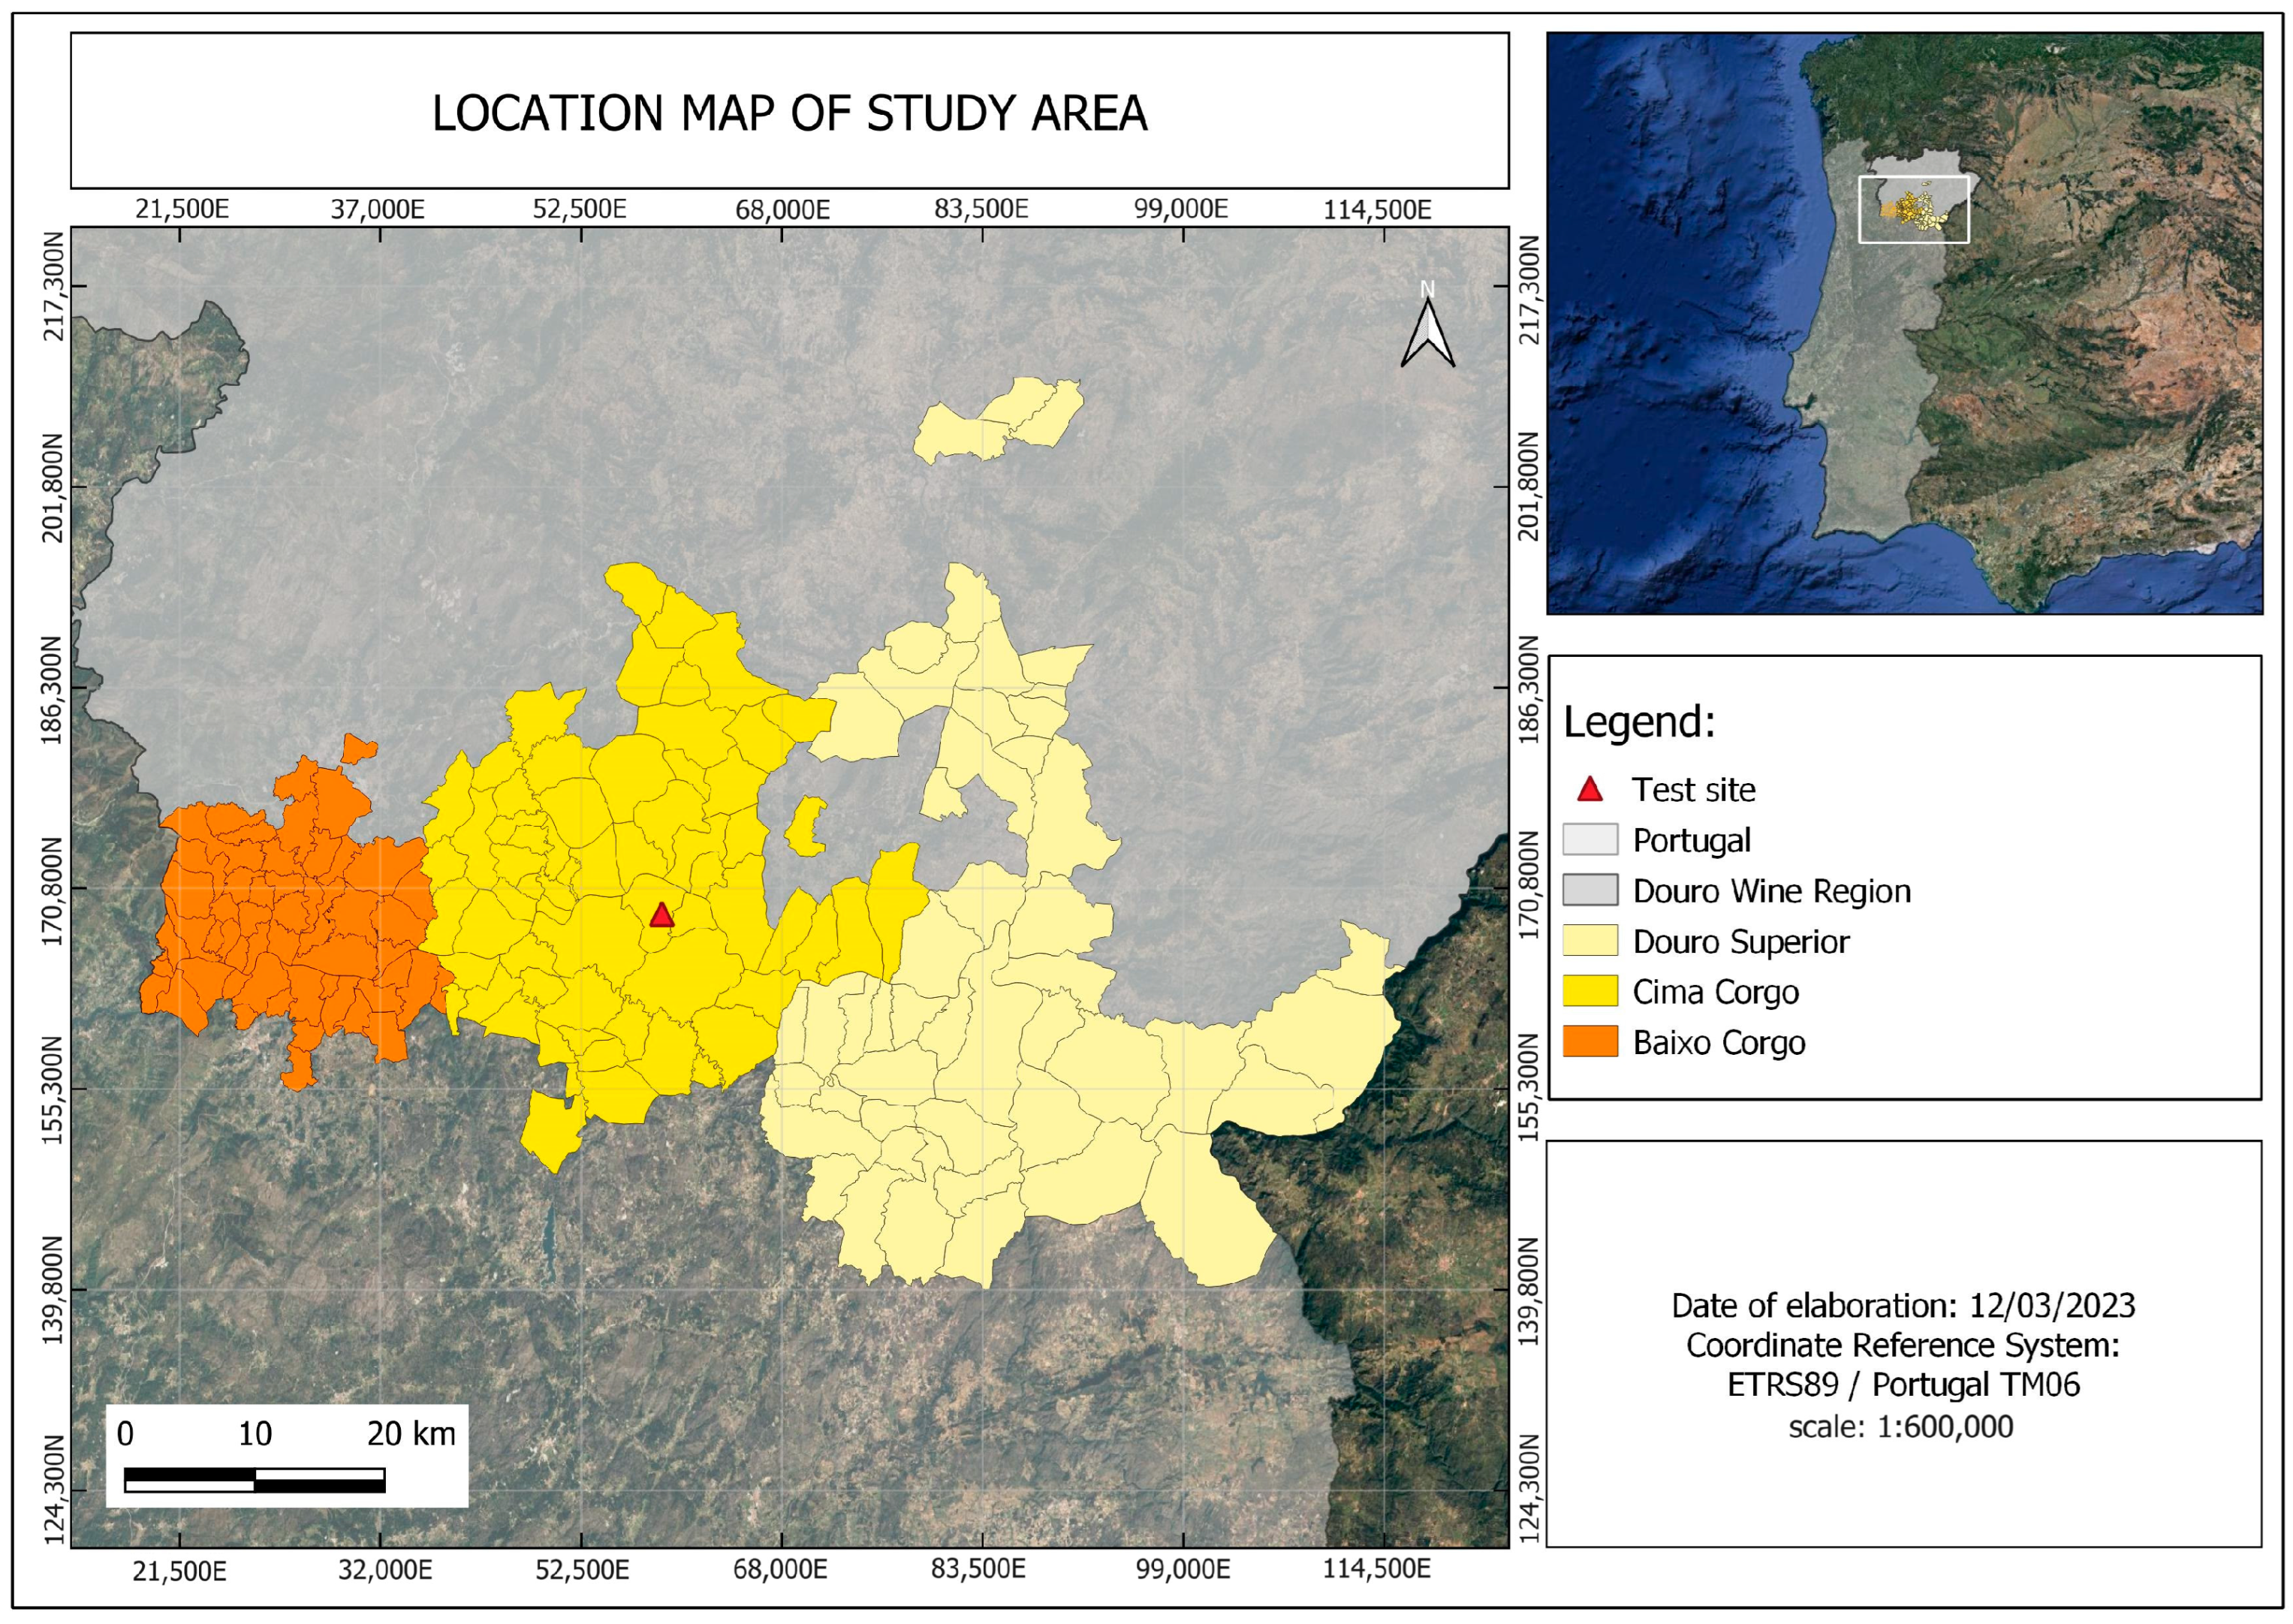
Figure 1. Location of study area in northeast of Portugal.
Blsf 27 00054 g001
Figure 2. Principal component analysis of spectral data according to three evaluation dates: beginning (28 July), middle (11 August) and end (1 September) of the cycle of leaf development.
Blsf 27 00054 g002
Figure 3. Extreme Gradient Boosting model for estimating predawn leaf water potential (Ψpd) with predicted and observed values measured using a Scholander pressure chamber. Circled observations are the validation dataset (n = 108 observations).
Blsf 27 00054 g003
Table 1. Statistical results of predawn leaf water potential (Ψpd, MPa) for the irrigation treatments in different evaluation dates during the stages of grape ripening.
Evaluation DateNon-Irrigated30% Etc60% EtcANOVA F
28 July−1.263 ± 0.226 bA−0.560 ± 0.072 dB−0.469 ± 0.119 bB5.72 × 10−14 ***
4 August−1.294 ± 0.185 bA−1.096 ± 0.231 aB−0.575 ± 0.020 aC7.12 × 10−11 ***
11 August−1.475 ± 0.116 aA−0.729 ± 0.090 cB−0.650 ± 0.122 aB<2 × 10⁻¹⁶ ***
19 August−1.490 ± 0.123 aA−0.717 ± 0.095 cB−0.433 ± 0.087 bC<2 × 10⁻¹⁶ ***
25 August−1.558 ± 0.095 aA−0.752 ± 0.155 cB−0.446 ± 0.075 bC<2 × 10⁻¹⁶ ***
1 September−1.538 ± 0.124 aA−0.958 ± 0.146 bB−0.390 ± 0.120 bC<2 × 10⁻¹⁶ ***
Mean−1.436 A−0.802 B−0.494 C<2 × 10⁻¹⁶ ***
ANOVA F1.08 × 10−5 ***4.04 × 10⁻¹² ***7.48 × 10⁻⁸ ***
ANOVA F is the p-value associated with Fisher’s exact test performed in the ANOVA. Means with a p-value less than 0.05 are considered statistically different. Means followed by the same lowercase letter in the same column (among dates) or means followed by the same uppercase letter in the same line (among irrigation treatments) are not significantly different (α = 5%). The asterisk in Table 1 indicates the p-value and represents the statistical significance of the Analysis of Variance (ANOVA). A value with *** signifies that the test was highly significant, with a probability value of p ≤ 0.001.
Table 2. Model performance metrics of training and validation datasets.
Training DatasetValidation DatasetTotal
R210.890.95
RMSE (MPa)0.000.320.23
MAPE (%)0.0933.3616.57
Disclaimer/Publisher’s Note: The statements, opinions and data contained in all publications are solely those of the individual author(s) and contributor(s) and not of MDPI and/or the editor(s). MDPI and/or the editor(s) disclaim responsibility for any injury to people or property resulting from any ideas, methods, instructions or products referred to in the content.