1. Introduction
Water is an inherent necessity for the survival of living organisms, yet its availability and preservation pose a substantial challenge for humanity. In our current research endeavor, we delve into the study of soil moisture (SM), a pivotal parameter in resource management essential for ensuring optimal water productivity and sustainability.
Numerous environmental studies have explored this subject, employing diverse methodologies to monitor SM. Prior investigations have demonstrated the potential of combining radar and optical data to achieve several objectives: (i) recovering SM levels in cereal fields [
1], (ii) mapping irrigated and rainfed areas [
2], (iii) scrutinizing landscape alterations alongside socio-economic and environmental factors [
3], and (iv) establishing correlations between radar backscatter and SM [
4]. More recently, researchers in [
5] harnessed neural networks to estimate SM in exclusively unvegetated soils across two research sites in France and Tunisia. In this instance, the neural networks were trained using synthetic data generated through the modified integral equation model (IEM) and validated solely with real unvegetated soil data.
This paper presents a holistic approach involving the synergy of three methods for estimating and monitoring water reserves: (1) the utilization of a formula termed ER to assess the water condition of agricultural land and unvegetated soils, employing Sentinel 1 data; (2) the introduction of two novel composite images to monitor moisture levels and changes in crop patterns; and (3) the application of unsupervised classification techniques such as ISODATA and k-means to track the impact of climate variations on land usage.
2. Dataset
2.1. Study Site
The research area is situated in the southwestern part of Tunisia, specifically within the Kairouan region, as illustrated in
Figure 1. Additionally, it is bounded by latitudes 35° to 35°45′ N and longitudes 9°30′ to 10°15′ E. This region is renowned for its arid climate and the excessive depletion of its groundwater resources.
2.2. Sentinel’s Data
We obtained the satellite data from the Sentinel-2 and Sentinel-1 GRD Level 1 missions, which were acquired through the “
https://scihub.copernicus.eu/dhus/#/home, accessed on 5 March 2023” platform. Sentinel-2′s MSI sensor offers multi-spectral imagery, while Sentinel-1′s synthetic aperture radar antenna provides polarimetric VV and VH data.
2.3. GCP Measures
Numerous GPS points were recorded at the site, covering various land uses such as orchards, vegetable cultivation, cereal fields, bare soils, and fallow land. Two separate measurement campaigns were conducted, one in June 2019 and another in October 2019, as indicated in
Figure 1. We consider three different soil coverage types namely: cereals (LC1), fallow (LC2) and bare soil (LC3).
2.4. EP Data
The validation of the soil moisture (SM) estimates generated by our proposed method involved comparison with the measured average deviations of precipitation over consecutive months, referred to as (EP), which were calculated based on the monthly precipitation data for the year 2019, as illustrated in
Figure 2.
3. Methodologies
3.1. The Proposed ER Formula
We introduce a formula for relative deviation, denoted as ER and expressed by Equation (1). The ER formula is characterized as a two-dimensional function.
where ER (k,l) represents the relative deviation of the average backscatter value σ (k,l), where k denotes the polarization of the Sentinel 1 image (VV or VH), and l corresponds to the respective month.
3.2. Images Composite Method
We utilized two distinctly colored composition images to monitor changes in humidity and crop patterns:
- -
A colored composition derived from Sentinel2′s bands (B8, B4, and B3). This is primarily employed for land cover identification, particularly vegetation detection.
- -
A colored composition created from Sentinel1′s polarizations. We assigned the VH polarization image to the green channel and the VV polarization image to the red channel, primarily to visualize variations in humidity relief.
The composite image creation process was conducted using the QGIS platform. To enhance the contrast in the colored composition images generated from Sentinel1 data, we applied an enhancement technique that took into account the minimum (equal to 0) and maximum values from the histograms. Additionally, a grayscale threshold of 40 (equal to the maximum value) was applied to both the VH and VV images.
3.3. Machine Learning Methods (ML)
The k-means algorithm is employed for clustering data into distinct groups or clusters based on their similarity. This iterative algorithm’s objective is to minimize the within-cluster sum of squares, often referred to as inertia.
On the other hand, the ISODATA (iterative self organizing data analysis technique) methodology is a clustering technique utilized for data analysis and pattern recognition. ISODATA combines elements from the k-means algorithm and the principles of self-organizing systems.
For our analysis, we applied both the k-means and ISODATA algorithms to the set of Sentinel2 spectral bands (B2, B3, B4 and B8). These classification processes were executed using the QGIS platform.
4. Results
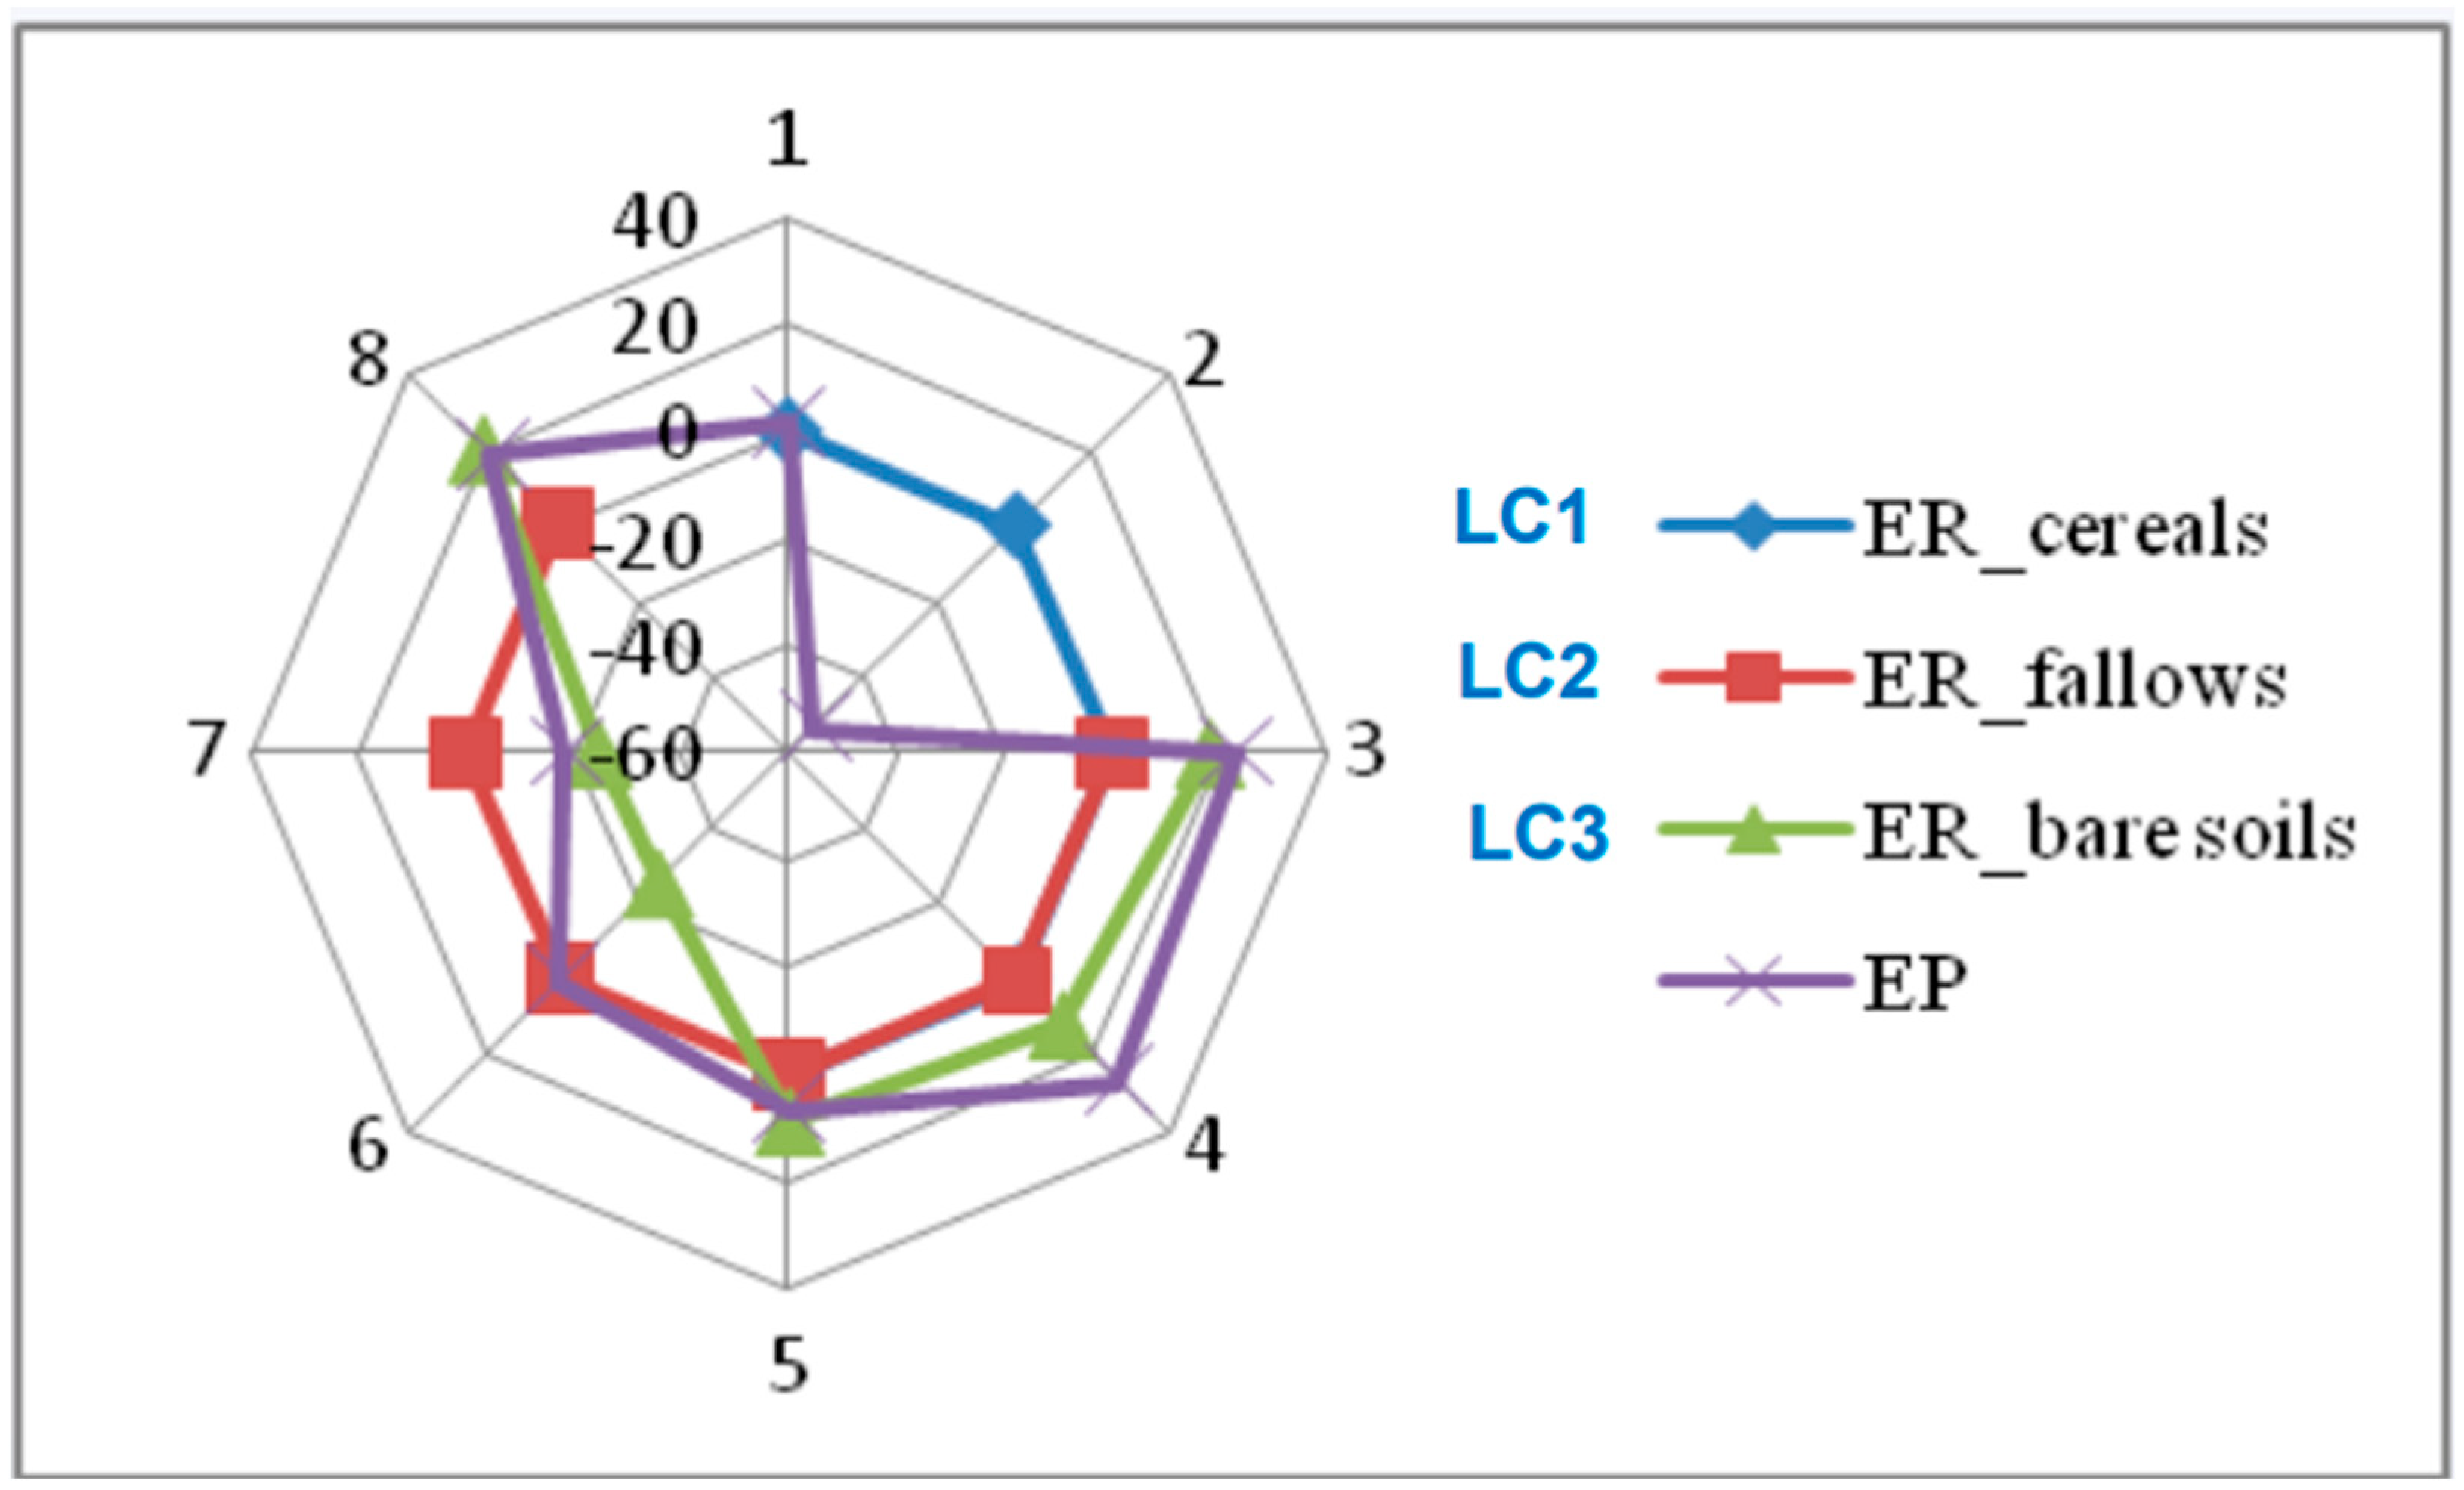
4.1. ER Model Results
We examined the relationship between EP (measured average deviations of precipitation) and ER values across three land use categories: LC1, LC2, and LC3. The findings revealed that when VH polarization was considered:
- -
ER < 0 for LC3, and ER approximately equals 0 for LC1 and LC2 when EP ≤ 0.
- -
ER > 0 for LC3, and ER approximately equals 0 for LC1 and LC2 when (0 < EP ≤ 20 mm).
- -
ER > 0 for all land cover types (LC), with an increase corresponding to higher rainfall, as shown in
Figure 3.
4.2. Image Composite Results
Soil moisture (SM) estimation was conducted through a multi-date analysis of composite images from Sentinel 1 in VH polarization, as presented in
Table 1. Meanwhile, the detection of changes in crops was achieved by analyzing multi-date composite images from Sentinel 2, as depicted in
Figure 4.
Upon scrutinizing the Sentinel 1 composite images illustrated in
Figure 5, it becomes evident that when the polarization backscatter coefficient VV shows an increase from one month to the next, it signifies the occurrence of substantial rainfall. Conversely, if this coefficient remains stable while the VH polarization coefficient decreases, it suggests the absence of rainfall. However, if both VV and VH coefficients decrease, it indicates relatively lower levels of rainfall.
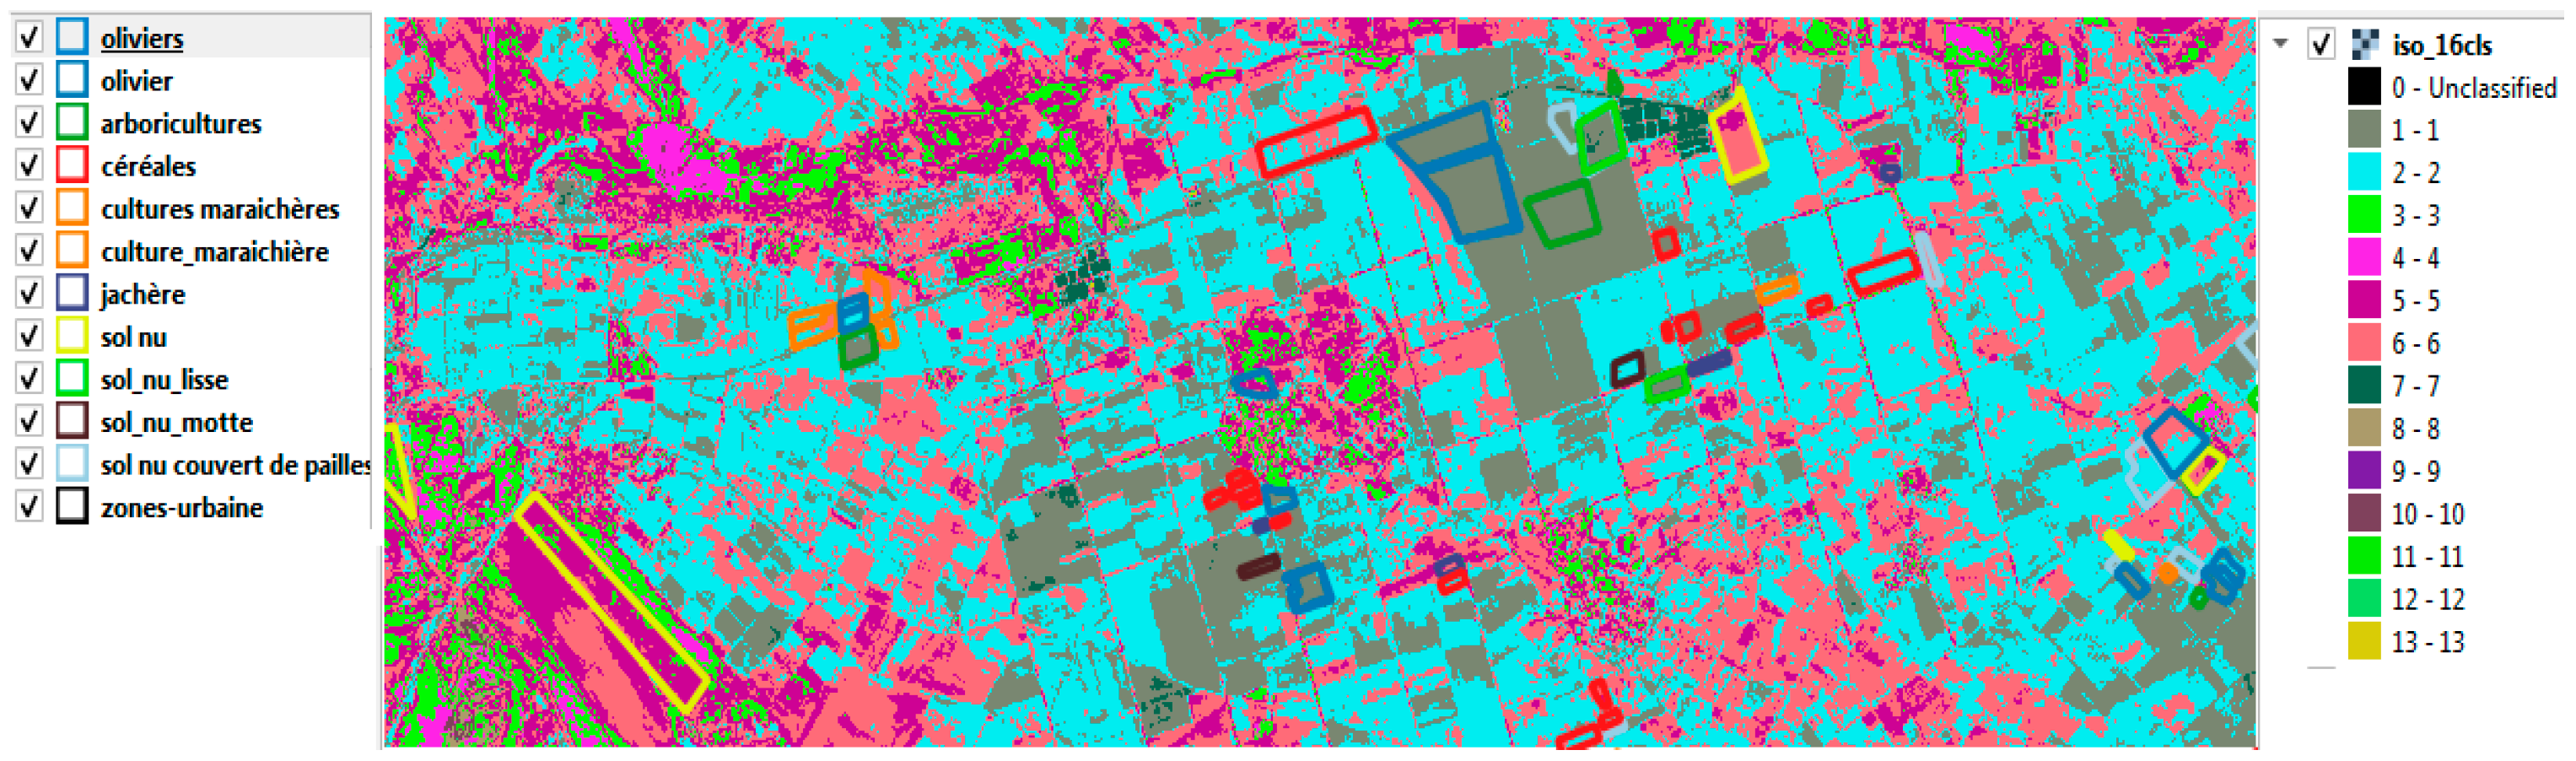
4.3. Results by ML Classifier
The employed classification methods function similarly in recognizing land uses and aiding in the prediction of land use patterns, as depicted in
Figure 6 and
Figure 7. However, when employing either the ER method or the Sentinel 1 composite image method, it becomes challenging to discern changes in land cover, such as the presence or harvesting of cereals or their growth stage.
The growth stages of cereals can be outlined as follows: (i) January to March marks the grain’s growing season; (ii) from March to May, growth tends to stabilize; and (iii) from May until the end of June, cereals enter the maturity phase. Through the utilization of unsupervised classifiers, we were able to identify certain parcels of cereals that had been harvested in June 2019.
5. Discussion
The results of the ER model provide the best accuracy for soil moisture classification. The Sentinel1 composite images contained by using VH and VV polarizations allow us to classify LC moisture and the Sentinel2 composite images control vegetation growth.
Sentinel 1 composite images offer insights into the radar wave backscatter characteristics. These composite images serve as valuable resources for tasks such as soil classification and wetland mapping. The k-means and ISODATA classification methods enable the segmentation of the image into multiple classes, with each class representing a homogenous region of the image based on its spectral properties. This segmentation is particularly useful for soil mapping and crop monitoring purposes.
6. Conclusions
The collaboration among the three methods outlined in this article holds utmost significance. The sequential processing steps should entail: (1) conducting unsupervised classification, (2) computing ERVH, and (3) estimating PE based on Sentinel1 composite images. By adhering to this procedural sequence, we can effectively forecast both soil moisture levels and the growth stages of crops.
Author Contributions
Conceptualization, O.C.; methodology, O.C. and C.M.C.; software, O.C.; validation, S.B., O.C. and C.M.C.; formal analysis, O.C. and C.M.C.; investigation, O.C. and C.M.C.; resources, S.B., O.C. and C.M.C.; data curation, S.B., O.C. and C.M.C.; writing—original draft preparation, O.C.; Sánchez, M; writing—review and editing, S.B., O.C. and C.M.C.; visualization, S.B., O.C. and C.M.C.; supervision, O.C. and C.M.C.; project administration, O.C.; funding acquisition, S.B. All authors have read and agreed to the published version of the manuscript.
Funding
This research received no external funding.
Institutional Review Board Statement
Not applicable.
Data Availability Statement
Data sharing is not applicable.
Conflicts of Interest
The authors declare no conflict of interest.
References
- Ayari, E.; Kassouk, Z.; Lili-Chabaane, Z.; Baghdadi, N.; Bousbih, S.; Zribi, M. Cereal crops soil parameters retrieval using L-Band ALOS-2 and C-Band Sentinel-1 Sensors. Remote Sens. 2021, 13, 1393–1418. [Google Scholar] [CrossRef]
- Bousbih, S.; Zribi, M.; Lili-Chabaane, Z.; Mougenot, B.; Pelletier, C.; El Hajj, M.; Baghdadi, N. Sentinel-1 and Sentinel-2 data for characterizing the states of continental surface over a semi-arid region in Tunisia. In Proceedings of the 2020 Mediterranean and Middle-East Geoscience and Remote Sensing Symposium (M2GARSS), Tunis, Tunisia, 9–11 March 2020; pp. 285–288. [Google Scholar]
- Mekki, I.; Ferchichi, I.; Taouajouti, N.; Faysse, N.; Zaïri, A.A. Oasis extension trajectories in Kebili territory, Southern Tunisia: Drivers of development and actors’ discourse. New Medit Mediterr. J. Econ. Agric. Environ. 2022, 85–101. [Google Scholar] [CrossRef]
- Han, D.; Vahedifard, F.; Aanstoos, J.V. Investigating the correlation between radar backscatter and in situ soil property measurements. Int. J. Appl. Earth Obs. Geoinf. 2017, 57, 136–144. [Google Scholar] [CrossRef]
- Ettalbi, M.; Baghdadi, N.; Garambois, P.-A.; Bazzi, H.; Ferreira, E.; Zribi, M. Soil Moisture Retrieval in Bare Agricultural Areas Using Sentinel-1 Images. Remote Se1S S²Qwns 2023, 15, 3502. [Google Scholar] [CrossRef]
| Disclaimer/Publisher’s Note: The statements, opinions and data contained in all publications are solely those of the individual author(s) and contributor(s) and not of MDPI and/or the editor(s). MDPI and/or the editor(s) disclaim responsibility for any injury to people or property resulting from any ideas, methods, instructions or products referred to in the content. |
© 2023 by the authors. Licensee MDPI, Basel, Switzerland. This article is an open access article distributed under the terms and conditions of the Creative Commons Attribution (CC BY) license (https://creativecommons.org/licenses/by/4.0/).


