Article

Short-Term Effects of Eccentric Strength Training on Hematology and Muscle Ultrasound in University Students

by
Juan Carlos Giraldo García
1,2,3,4,
Julián Echeverri Chica
5,
German Campuzano Zuluaga
6,
Gloria María Ruiz Rengifo
1,2,7,
Donaldo Cardona Nieto
1,
Juan Cancio Arcila Arango
1,4 and
Oliver Ramos-Álvarez
2,8,9,10,*
1
Politécnico Colombiano Jaime Isaza Cadavid, Medellín 050021, Colombia
2
GESTAS Research Group, Politécnico Colombiano Jaime Isaza Cadavid, Medellin 050021, Colombia
3
Sports Science Department, Universidad Pablo de Olavide, 41013 Sevilla, Spain
4
Health Sciences Department, University of Antioquia, Medellin 050010, Colombia
5
Bioarray Genetic Diagnosis Laboratory, Bogotá 11013, Colombia
6
Clinical and Anatomical Pathology and Haematopathology, Clinical Haematological Laboratory, Medellin 050021, Colombia
7
Health Sciences Department, University of CES, Medellin 050001, Colombia
8
Departamento de Educación, Área de Educación Física y Deportiva, Universidad de Cantabria, Los Castros Avenue, 50, 39005 Santander, Spain
9
Health Economics Research Group, Valdecilla Biomedical Research Institute (IDIVAL), 39011 Santander, Spain
10
Technology Applied to Occupational, Equality and Health Research Group (TALIONIS), Faculty of Health Sciences, University of A Coruña, de Oza As Xubias University Campus, 15006 A Coruña, Spain
*
Author to whom correspondence should be addressed.
Youth 2025, 5(3), 72; https://doi.org/10.3390/youth5030072
Submission received: 22 April 2025 / Revised: 28 May 2025 / Accepted: 4 July 2025 / Published: 10 July 2025

Abstract

Strength training has established itself as an essential component in physical conditioning programmes, not only to improve sports performance, but also for health purposes. To evaluate the effects of a strength training protocol with a predominance of the eccentric component on blood count, blood chemistry, and quadriceps muscle ultrasound in university students. 31 students (22.3 ± 4.14 years) of the professional programme in Sports of the Politécnico Colombiano Jaime Isaza Cadavid participated. A mesocycle was developed with three weekly sessions of eccentric training focused on the lower body and core zone. Pre and post-intervention measurements were taken anthropometry, haemogram, lipid profile, ultrasound of the right quadriceps, Bosco test, and Rockport test. The Wilcoxon signed-rank test was used, and the effect size was calculated using rank correlation. Statistically significant changes were observed in haematocrit, mean corpuscular volume, HDL, muscle thickness and echo-intensity, vertical jump power, and maximal oxygen consumption. A four-week eccentric strength training programme generates improvements in haematology, lipid profile, muscle quality assessed by ultrasound, and functional performance in university students.

1. Introduction

Physical activity (PA) is a fundamental strategy in the prevention of non-communicable chronic diseases. PA has an effect on health status and induces metabolic changes that are reflected in modifications in blood count and blood chemistry parameters. Elevated cholesterol levels, for example, are responsible for one-third of ischaemic heart diseases worldwide (Murray et al., 2003; Zhu et al., 2025). Although the assessment of peak oxygen consumption is an excellent measure of human health status, strength is also an excellent way to evaluate this health condition. For this reason, strength training has become a fundamental component of the training plan, not only with the aim of improving performance but also with the exclusive objective of maintaining or improving health. The metabolic function of striated skeletal muscle is indisputable, and this function is closely linked to the demands placed on muscle tissue during training. These stimuli generate mechanical alterations in the structure of the muscle fibre and energetic changes that produce adaptations leading to improved function expressed through strength, which results in a reduction and modification of adipose tissue in both quantity and metabolic quality. The modifications that occur in erythrocyte mass and lipid profile correspond to an adaptation phenomenon (Calderón, 2007), and this has been widely studied, particularly in endurance sports, though not so in strength and power sports. Strength training is increasingly being used as a training method, and when performed in circuits, it manages to break the monotony—something that people, particularly young people, tend to avoid.
The sedentary young population is increasingly larger, and the decline in strength is a consequence of such behaviour (Chalapud Narváez & Molano Tobar, 2021). This condition is particularly frequent among university students and is becoming an important risk factor for non-communicable chronic diseases (Carbone et al., 2020). Leisure time is becoming increasingly limited, and this is one of the excuses used for not exercising regularly. The possibility of performing strength exercises in short sessions is an alternative that could benefit those who, due to their commitments, are unable to exercise regularly. In this regard, strength training, including plyometric training, has been shown to be particularly effective in improving muscular performance both in young athletes and recreational sportspeople (Lum et al., 2019; Makaruk et al., 2011; Ramírez-delaCruz et al., 2022). One of the reasons why training leads to strength gains is that it causes damage to the muscle fibre, which stimulates an increase in the number of sarcomeres (Proske & Morgan, 2001).
In addition, Schoenfeld (2010) has established that the range of 6–12 repetitions with moderate loads (65–80% of 1RM) and rests between 60 and 90 s is optimal for muscle growth. In this study to promote the hypertrophy of muscle fibres we rely on various authors, who have suggested that an effective programming should include between two and three sessions per week, according to Schoenfeld (2010), this training volume should be structured with four to six sets of four to eight repetitions, using an intensity of 80 to 100% of the 1RM during the eccentric phase, which should be performed with a higher load than the concentric phase (Menon et al., 2012). In addition, it is recommended to maintain a time under tension of between 2 and 6 s during this eccentric phase. As for recovery, Franchi et al. (2017) propose a rest period of 48–72 h after a high-intensity eccentric stimulus, which coincides with the observations of Proske and Morgan (2001), who indicate that the muscle damage caused by this type of contraction can persist for up to 48 h, making it necessary to respect at least this interval to favour muscle regeneration processes.
Ultrasound (US) is a highly useful tool primarily in the diagnosis of sports injuries involving soft tissues. US, for all practical reasons, in addition to being highly reproducible (Santos & Armada-da-Silva, 2017), becomes a useful tool for achieving the objective of quantifying the changes generated by exercise in the musculoskeletal system, and in striated skeletal muscle in particular. After reviewing research studies on the use of ultrasound in the measurement of muscle hypertrophy (Gentil et al., 2015; Marcon et al., 2015; Menon et al., 2012; Sarto et al., 2021), one can observe an alternative for safely and reliably quantifying the changes produced in muscle, both in the field of high performance and in exercise for health. The US can also provide information about muscle architecture, including pennation angle (the angle at which muscle fibres are arranged) and fascicle structure (Sarto et al., 2021). Ultrasound images can also be analysed based on colour, specifically the greyscale. It is a very useful method in the ultrasound evaluation of muscle in elderly people to define its fat and muscle fibre content. In other words, it is a way of assessing muscle quality (Sarto et al., 2021). Due to its safety, ultrasound would be an excellent method for evaluating and monitoring muscle mass both in quantity and quality, and the changes produced by training or by the natural evolution of the individual.
The objective of the present study is to evaluate the effects of strength training on the blood count, blood chemistry, and quantitative muscular ultrasound of the quadriceps muscle in a group of university students after the application of a strength exercise protocol with a predominance of the eccentric component.

2. Materials and Methods
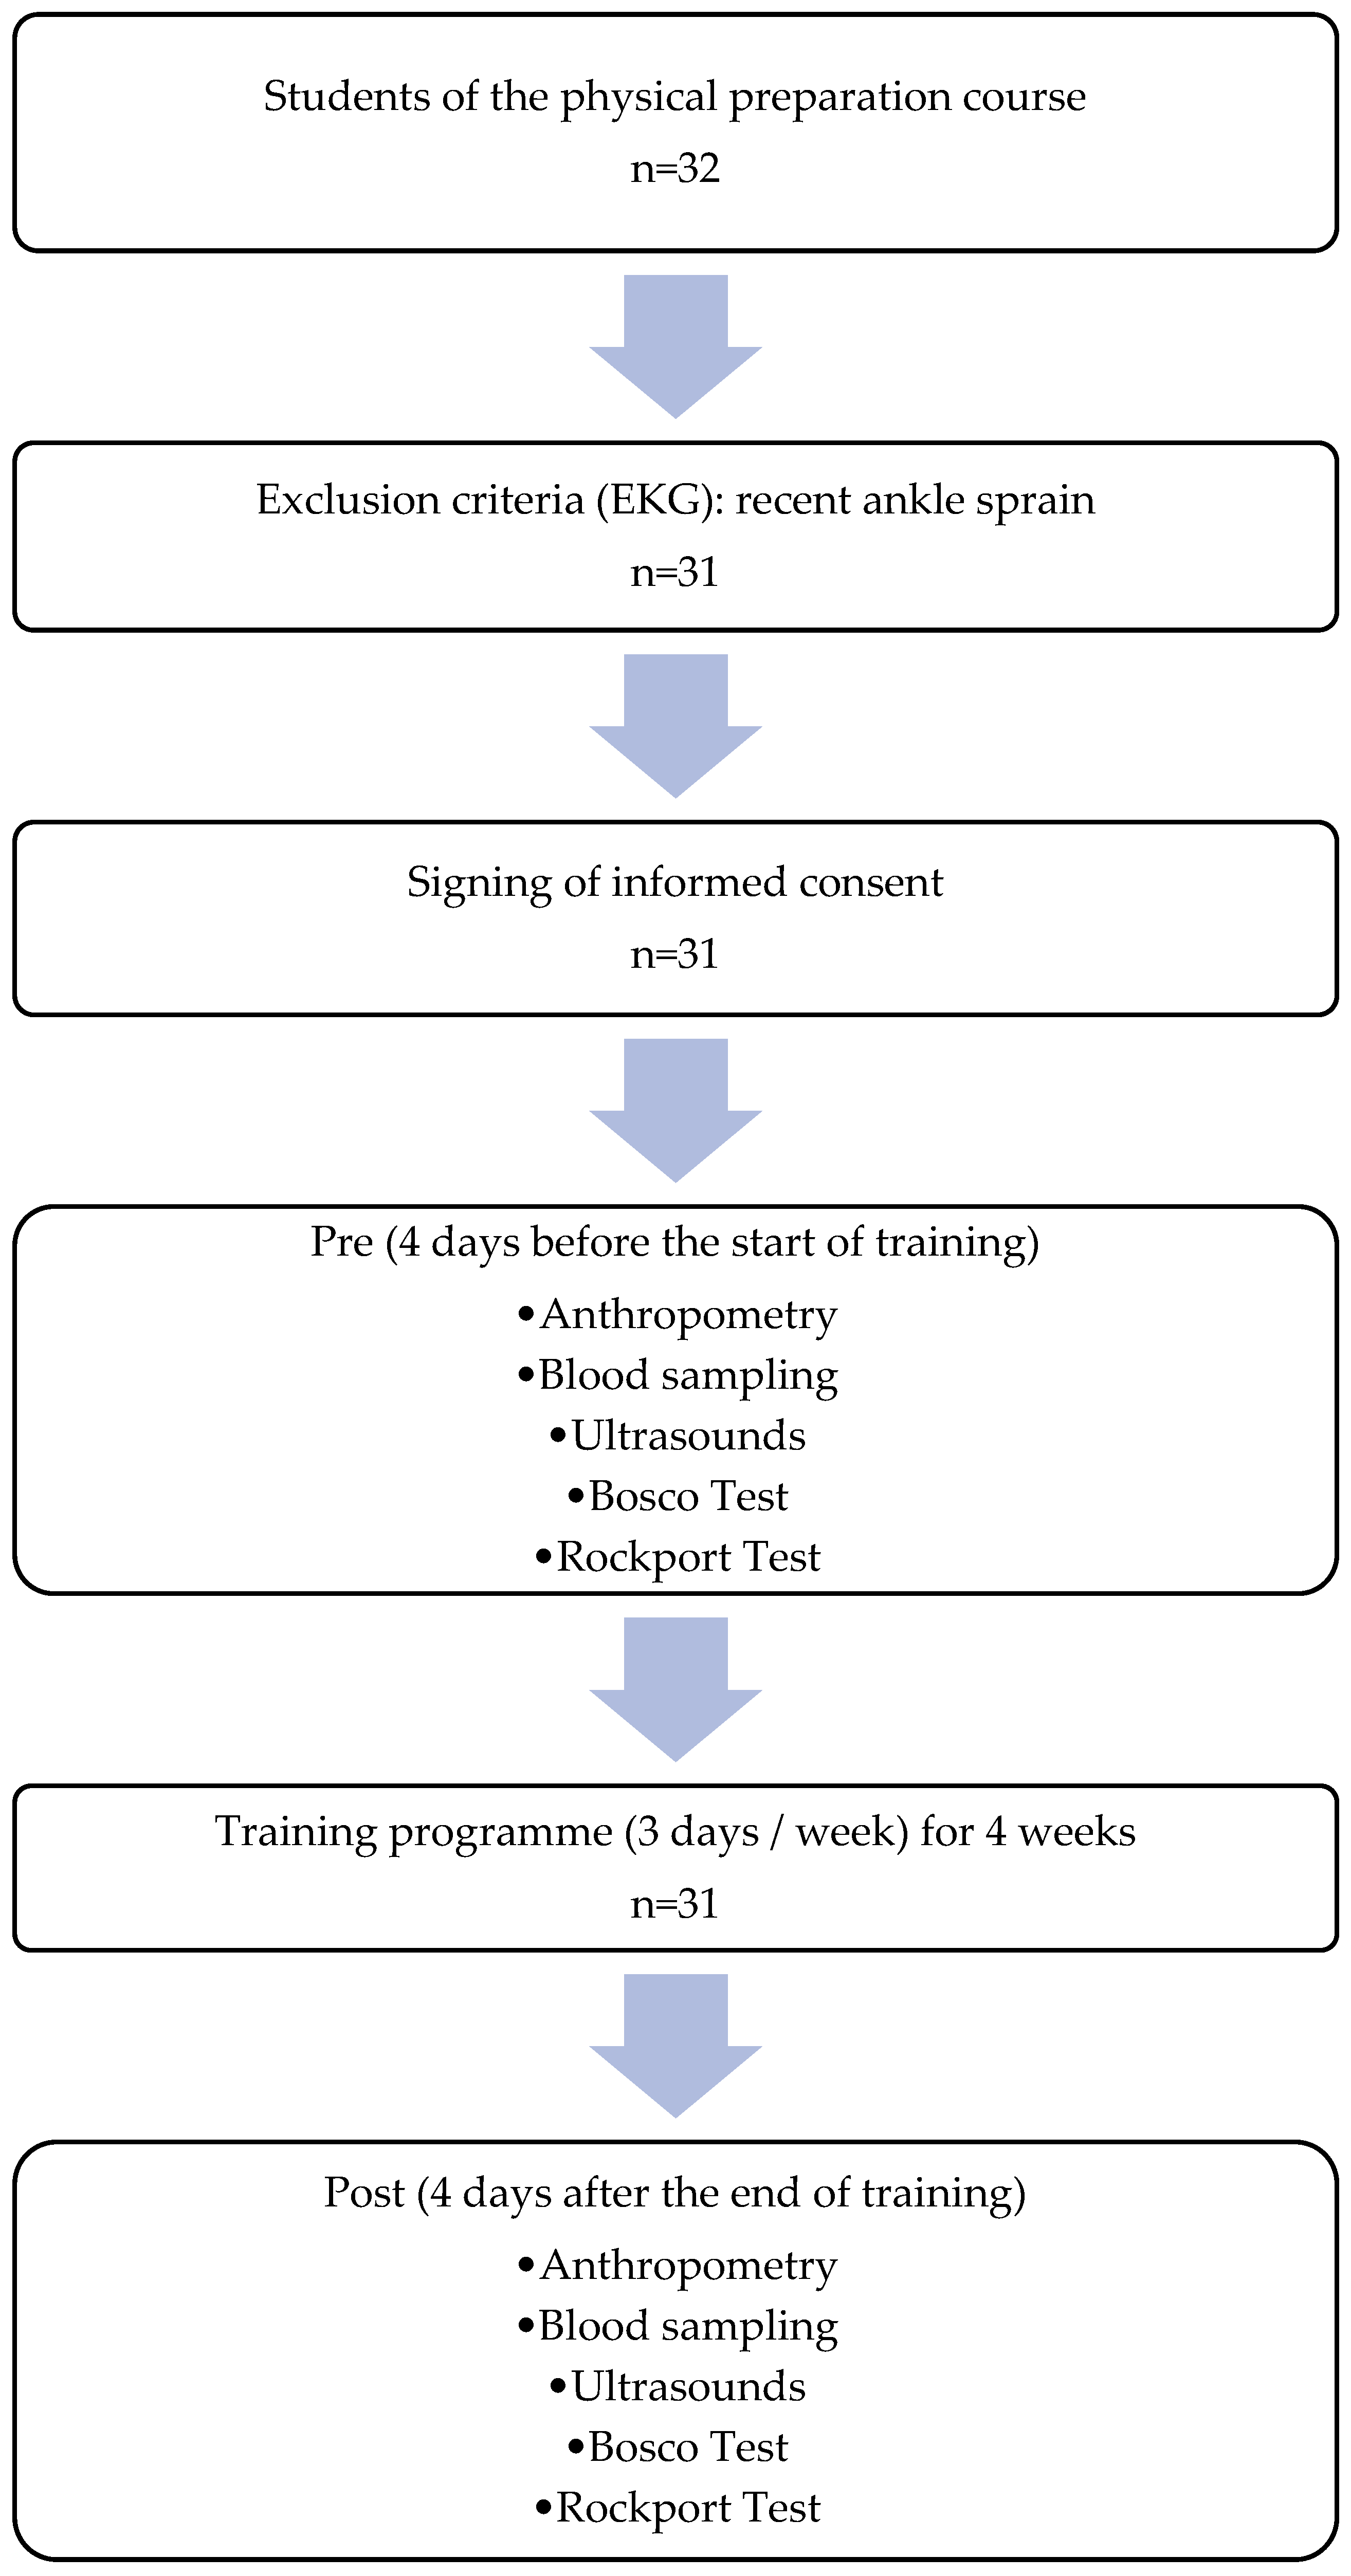
2.1. Participants

Thirty-one students (22.3 ± 4.14 years of age), twenty-five men and six women from the professional programme in Sports, enrolled in the Physical Conditioning course at the Institución Universitaria Politécnico Colombiano Jaime Isaza Cadavid, participated in the study after signing the informed consent form. Each subject was required to maintain their usual dietary habits and to refrain from consuming alcohol during the two days prior to the measurements.
The following exclusion criteria were applied: musculoskeletal injuries, cardiovascular diseases, pharmacological and/or nutritional treatment, having initiated a training programme within the last three months, electrocardiographic findings that contraindicated exercise, and failure to sign and submit the informed consent form. This study complies with the Declaration of Helsinki for research involving human beings and was approved by the Ethics Committee of the Politécnico Colombiano Jaime Isaza Cadavid, under file number #201801007381.

2.2. Procedure

The protocol consisted, in the following order, of anthropometric measurements, electrocardiogram, blood sampling for blood count and lipid profile, ultrasound of the right quadriceps muscle, Bosco test, and Rockport test before and after the intervention (except for the electrocardiogram), as part of a strength training programme with emphasis on the eccentric phase, carried out three times per week for four weeks. The tests were performed four days prior to the start of the training programme, and the post-intervention tests were conducted on the fourth day after the final training session to avoid the acute effects of exercise. During the intervention period, students continued their regular academic activities, excluding any additional strength-related stimuli (Figure 1).

2.3. Training Protocol

The training programme was originally designed for a six-week intervention, with load progression structured according to references such as Schoenfeld (2010), who states that consistent training over a period of 6–10 weeks can induce hypertrophy through eccentric exercise (Schoenfeld, 2010), although in some cases changes may be observed from the fourth week, becoming more significant after weeks 8–12 (Wernbom et al., 2007). Regarding the recommended frequency for inducing hypertrophy in muscle fibres, Schoenfeld (2010) suggests performing between 2 and 3 sessions per week, with 4 to 6 sets of 4 to 8 repetitions at 80–100% of 1RM during the eccentric phase, using a higher load than in the concentric phase (Menon et al., 2012). A time under tension of 2 to 6 s during the eccentric phase is recommended, and for recovery, Franchi et al. (Franchi et al., 2017) suggest a rest period of 48–72 h following an intense eccentric stimulus. Proske & Morgan (2001) report that the effects of muscle damage induced by eccentric exercise can persist for up to 48 h; therefore, a minimum interval of this duration is recommended to promote adequate muscle regeneration.
Due to an abrupt interruption of activities by the university students, who declared themselves on ‘academic strike’, the eccentric training programme was carried out for 4 weeks, with a total of 12 sessions, instead of the initially planned 6 weeks and 18 sessions. A mesocycle was structured, in which each microcycle included three weekly eccentric training sessions focusing on the lower body and core area, along with one active recovery session through regular sport. A total of 12 sessions were held on Mondays, Wednesdays, and Fridays at 10 a.m., each lasting approximately 45 min. Before each session, a 10 min warm-up was performed, where the core and lower body were prepared with exercises from the football training programme suggested by Restrepo et al. (2022), with emphasis on mobility, isometric and concentric contraction, with gestures typical of the game, preparing the participant for the respective microcycle, taking into account the progression of the phases, loads and intensity, with the aim of preparing the body for the main activity and improving body control (Restrepo et al., 2022).
The planning of the workload, in terms of % of 1RM, number of sets, and repetitions, is detailed in Table 1, with the protocol validated by the corresponding author. Each phase specifies the number of days, the work percentage, sets, and repetitions. The intervention began with Phase 1, which consisted of 6 sessions of Neuromuscular Adaptation and technique improvement (Kraemer & Ratamess, 2004), in order to prepare the body for the main activity, improve body control and prevent injuries; it was planned according to Bompa & Buzzichelli (2015), for 2 weeks, with 6 sessions, working the first week at 60% of 1 RM, with 4 sets and 10 repetitions; using foundational exercises, which were adjusted in load and complexity as the programme progressed. This was followed by Phase 2: Hypertrophy and Progressive Load, with an increase in volume and mechanical tension (Schoenfeld, 2010); then Phase 3: Muscular Hypertrophy, and finally Phase 4: Maximum Intensity and Strength (not implemented due to the cessation of the academic period). The aim of Phases 3 and 4 was to recruit high-threshold motor units (Zatsiorsky et al., 2020).
The total time under tension (TUT) was established following the recommendations of Benavides-Villanueva and Wilk (Benavides-Villanueva & Ramirez-Campillo, 2022; Wilk et al., 2019). Considering that the optimal time per repetition to promote hypertrophic adaptations ranges between 2 and 6 s, a controlled eccentric phase of 4 to 6 s was chosen, combined with a fast concentric phase of 1 to 2 s. As a result, the total TUT per set ranged from 30 to 70 s, depending on the number of repetitions performed for each exercise.
The programme included fundamental exercises such as eccentric squats and eccentric Romanian deadlifts (slow, controlled descent between 4 and 6 s), eccentric bench press (5 s descent), eccentric pull-ups (6–8 s descent), box step-downs with a 6 s descent phase, core training combining prone and lateral planks with eccentric lower limb work, and jumps. Rest time between sets was established according to Mazzetti et al. (Mazzetti et al., 2000), with rest intervals ranging from 60 to 120 s in Phases 1 and 3, reduced to 45–90 s in Phase 2, and proposed as 60–150 s in Phase 4, which was not implemented due to the cessation of academic activities by all students of the university. Table 1 details the workload characteristics for the different phases.

2.4. Laboratory Test

For the measurement of analytes, peripheral blood samples were taken from the 31 participants before and after the implementation of the strength exercise protocol over four weeks. Each participant was instructed on the basal pre-analytical conditions: they were required to maintain an 8 to 12 h fast prior to venipuncture and to have refrained from smoking or consuming alcohol in the 48 h before the test. A blood sample was taken from each participant in a lavender-top tube with EDTA for the complete blood count and a yellow-top tube for obtaining plasma serum for blood chemistry tests. A sixth-generation complete blood count (type VI) was performed using a Sysmex XN-series analyser; each blood count was accompanied by a peripheral blood smear stained with Wright. For the blood chemistry measurements, the Alinity M analyser by Abbott was used. Prior to each measurement, the equipment was calibrated and quality controlled. All results were obtained on the same day as the sample collection.

2.5. Quantitative Ultrasound

Transverse and longitudinal images were obtained from the femoral quadriceps in the right limb using a B-mode ultrasound device (B-Ultrasonic Diagnostic System, Contec, CMS600P2, Qinhuangdao, Hebei, China). A linear transducer (gain: 58, frequency: 7.5 MHz; depth: 6 centimetres), covered with a sufficient amount of water-soluble transmission gel to avoid compression of the dermal surface, was placed perpendicular to the longitudinal and transverse axis of the femoral quadriceps at the midpoint between the anterior superior iliac spine and the superior pole, and between the latter and the superolateral angle of the patella for the anterior and lateral images, respectively. Subjects were evaluated in a supine position, having rested for at least 5 min and having not performed any vigorous physical exercise earlier that day. Two longitudinal and two transverse images were taken at each midpoint. The frozen image was digitised and later analysed using the open-source software ImageJ (National Institute of Health, Bethesda, MD, USA, version IJ 1.46). The anterior transverse images were used to measure: the muscle thickness of the rectus femoris (from the inferior margin of the anterior fascia of the rectus femoris to the superior margin of the posterior fascia of the rectus femoris), the thickness of the vastus intermedius (from the inferior margin of the intermuscular fascia to the periosteum of the femur), and the total thickness of the anterior quadriceps (from the inferior margin of the rectus femoris to the periosteum of the femur). The lateral transverse images were used to measure: the muscle thickness of the vastus lateralis (from the inferior margin of the anterior fascia of the vastus lateralis to the superior margin of the posterior fascia of the vastus lateralis), the thickness of the vastus intermedius in lateral view (from the inferior margin of the intermuscular fascia to the periosteum of the femur), and the total thickness of the lateral quadriceps (from the inferior margin of the vastus lateralis to the periosteum of the femur). Transverse images were also used to determine the EI (echo intensity) of the different muscles evaluated using the histogram function in ImageJ. The region of interest was selected as the largest rectangular area of each muscle without including fascia. The average of the two images was expressed as a value between 0 (black) and 255 (white). EI correction was performed using the thickness of the subcutaneous adipose tissue as proposed by Young, and the fat percentage was measured using the method proposed by the same author for all muscles (Young et al., 2015). Additionally, as a control strategy, the difference in EI of the fat relative to each portion of the quadriceps evaluated was calculated, corresponding to Dif1 to Dif6 (Wu et al., 2010). The longitudinal images were used to determine the pennation angle of the rectus femoris and the vastus lateralis. The values used for statistical analysis for muscle thickness and pennation angle were the averages of the two measurements of each image.

2.6. Vertical Jump Tests

For both the squat jump (SJ) and the countermovement jump (CMJ), the execution criteria described by Lorenzo and his research team were followed (Lorenzo et al., 2020).
The formulas used to calculate SJ and CMJ power were those proposed by Sayers (Sayers et al., 1999).

2.7. Aerobic Power Test

The Rockport Fitness Walking Test was conducted on the institution’s football field following the protocol described by the author and validated—both the test and the formula for calculating maximum oxygen consumption—in university students by Dolgener (Dolgener et al., 1994).

2.8. Statistical Analysis
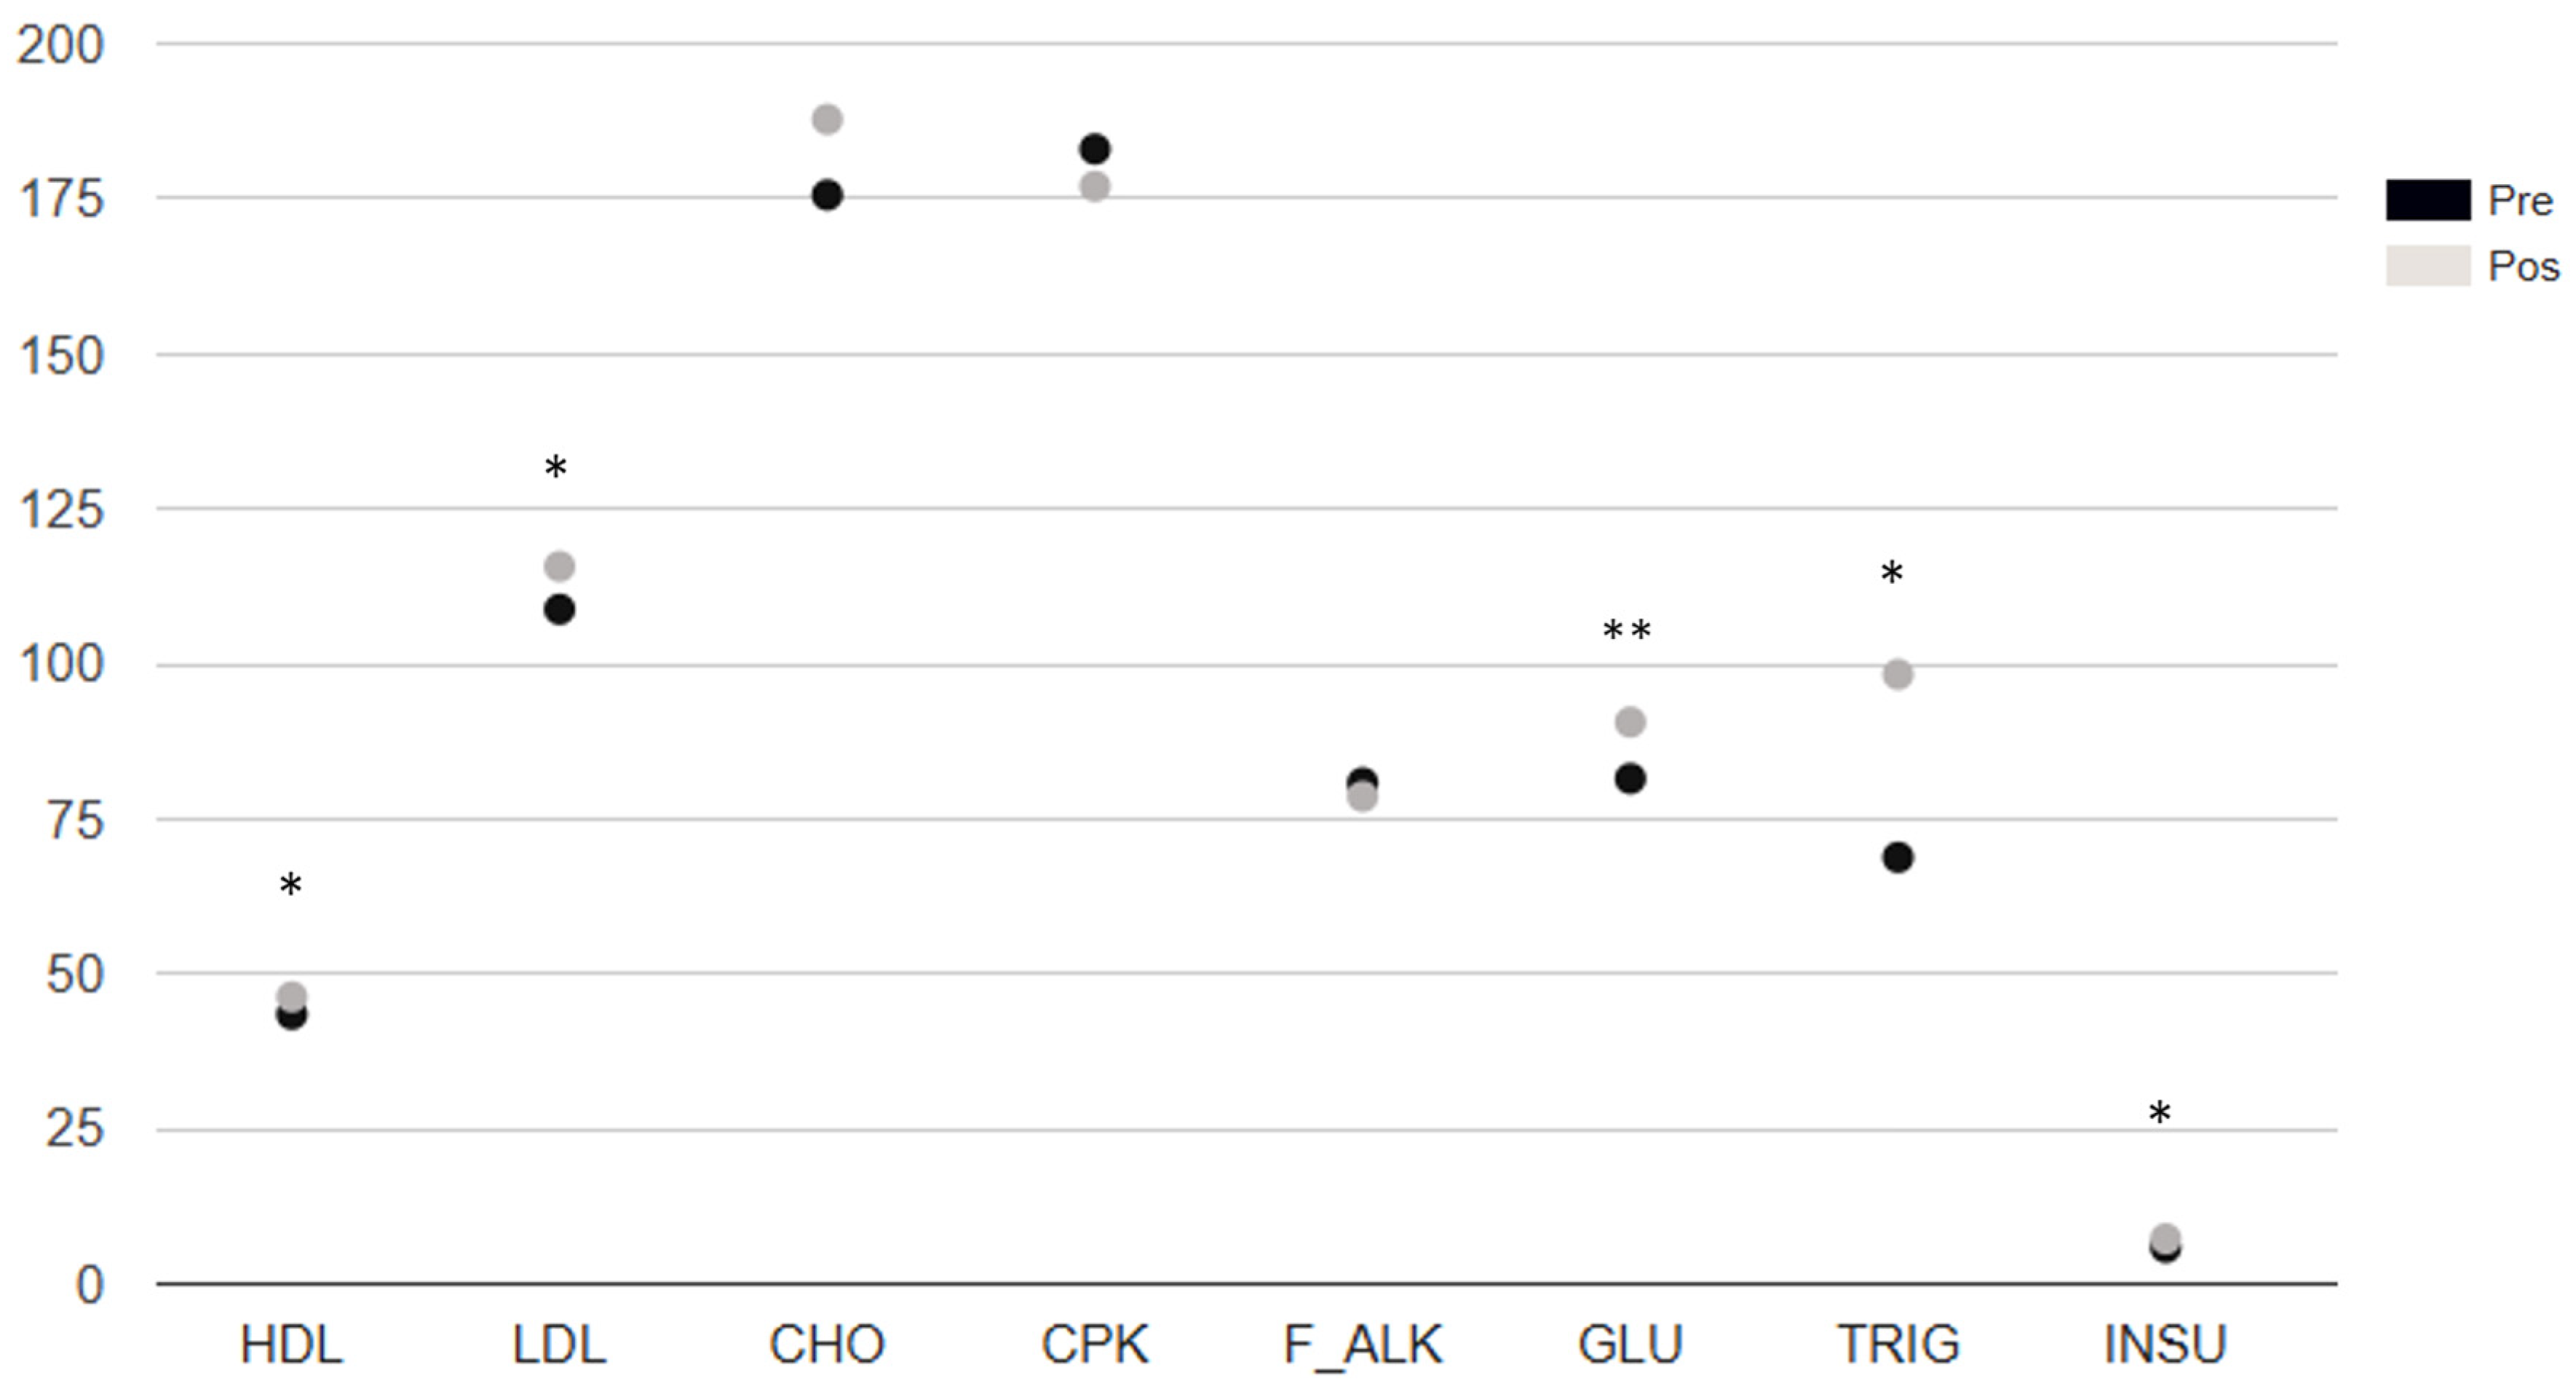
For the descriptive analysis of the ultrasound, Rockport, Bosco, blood count, and biochemical variables, absolute and relative distributions were used along with summary indicators such as the median and the median absolute deviation. The Shapiro–Wilk test was used to assess normality.
To evaluate the before-and-after differences following the intervention in the haematological, ultrasound, Rockport, Bosco, and blood chemistry variables, the Wilcoxon signed-rank test was applied. Similarly, the effect size for the Wilcoxon test was calculated using rank correlation; an effect size between 0.1 and 0.3 was considered small, between 0.3 and 0.5 moderate, and above 0.5 large. The analysis was performed using the statistical software Stata 10.

3. Results

A total of 31 students enrolled in the Physical Conditioning course, from the sixth level of the Professional Programme in Sports at the Politécnico Colombiano Jaime Isaza Cadavid, were evaluated. The group consisted of 6 women (19.35%) and 25 men (80.65%) who did not perform strength training in their regular routines (Table 2). No electrocardiographic findings were observed that would contraindicate training in any of the participants.
Muscle thickness (MT) increased significantly in the variables RF Thickness (p < 0.01, ES = 0.500), AT Thickness (p < 0.01, ES = 0.484), VL Thickness (p < 0.05, ES = 0.377), and LT Thickness (p < 0.01, ES = 0.516), with effect sizes ranging from large to very large. Echo-intensity (EI) decreased significantly in the variables that had subcutaneous tissue EI as internal control: Dif1 (p < 0.01, ES = 0.686), Dif3 (p < 0.01, ES = 0.524), and Dif4 (p < 0.01, ES = 0.560), with superior effect sizes. No significant changes were found in the pennation angles measured, although the RF Pennation Angle yielded a moderate effect size (p = 0.0552, ES = 0.345) (Table 3).
The pre- and post-intervention changes in the haematological variables are shown in Table 4, while the blood chemistry variables appear in Table 5.
There were statistically significant changes in haematocrit (p = 0.0033, ES: large), mean corpuscular volume (p = 0.0015, ES: large), MCH (p = 0.0459, ES: moderate), MPV (p = 0.0344, ES: moderate), and PLT_RET (p = 0.0232, ES: moderate).
Most of the parameters in the biochemical analysis showed statistically significant changes. HDL (p = 0.0224, ES: moderate), LDL (p = 0.0041, ES: large), CHO (p = 0.0054, ES: moderate), GLU (p < 0.0001, ES: large), TRIG (p = 0.0347, ES: moderate), and INSU (p = 0.0072, ES: moderate) increased (Figure 2).
In the Rockport test, heart rate did not show statistically significant differences when comparing the pre- and post-test results, but maximum oxygen consumption improved significantly in the post-intervention test (Table 5).
All the different power assessment variables from the Bosco test showed statistically significant changes (p < 0.01, large effect size) (Figure 3).

4. Discussion

Our study demonstrated significant changes in haematological variables, blood chemistry, and quantitative muscle ultrasound after just four weeks of a strength training protocol with emphasis on the eccentric component.
After four weeks of strength training, there was an increase in the thickness of the rectus femoris (RF) and vastus lateralis (VL), as well as in the total thickness of the quadriceps measured in both the anterior and lateral regions, which includes both muscles. A decrease in echo intensity (EI) was also observed in both the RF and VL. However, no statistically significant differences were found in the pennation angle of any of the muscles assessed via ultrasound.
Various studies have shown increases in muscle thickness following the application of a strength training programme. Harput et al. conducted a study in adolescents (15.7 ± 1.1 years old) who followed a plyometric training programme for six weeks. A significant increase in vastus lateralis thickness was observed (Harput et al., 2023). In the study conducted by Kudo et al., the thickness of the medial gastrocnemius also increased significantly after strength training in a group of young men and women (Ramírez-delaCruz et al., 2022). The systematic review and meta-analysis by Ramírez-delaCruz et al. concluded that a strength training programme appears to be effective in increasing muscle thickness in different lower limb muscles (Ramírez-delaCruz et al., 2022), including those assessed in our study, the RF and VL. Our results are consistent with previously reported findings of increased muscle thickness in both the anterior (RF) and lateral (VL) regions of the quadriceps.
The study by Harput et al., mentioned previously, also assessed echo intensity (EI) as in our research, finding a statistically significant decrease in the VL after a six-week strength training programme (Harput et al., 2023). Other studies have demonstrated correlations between vertical jump and EI in young men and women with an average age of 24.3 in men and 21.5 in women (Mangine et al., 2014). This lower EI is associated in older adults with reduced fat content, while in adolescents and young adults, EI and vertical jump height are similarly correlated in both the rectus femoris and vastus lateralis (Stock & Thompson, 2021). Ultrasound imaging makes it possible to assess changes in muscle EI as a measure of muscle quality (the lower the EI, the higher the quality of the muscle), and both are related to different physical performance tests across populations of varying ages (Kleinberg et al., 2016; Stock & Thompson, 2021). EI is affected by training (Mota et al., 2017), and fat infiltration is the main cause of increased muscle EI with advancing age (Reimers et al., 1993). Special mention should be made of the subtraction of fat EI from muscle EI as measured in our study using the variables Dif1 to Dif6, some of which showed statistically significant differences. Since the subcutaneous fat tissue EI serves as an internal reference from the same subject, it allows for comparison across different ultrasound devices and suggests a more accurate way to assess the changes generated by strength training.
In the study conducted by Kudo et al. on young men and women (21.2 ± 3.9 years of age) who underwent a six-week strength training programme, no statistically significant differences were observed in the pennation angle of the medial gastrocnemius (Kudo et al., 2020), which is consistent with the findings of various studies that also quantitatively assessed ultrasound changes in different muscles (Kudo et al., 2020). Marušić et al. also evaluated the muscle architecture of the hamstrings after six weeks of plyometric training, finding a decrease in the pennation angle along with an increase in fascicle length (Marušič et al., 2020). A study by Monti et al. assessed ultrasound changes in the vastus lateralis during a strength training programme and found statistically significant changes at six weeks of training (Monti et al., 2020), but not at weeks 2 and 4. These findings are consistent with the results of our study, which had to be conducted over only four weeks.
In our study, the pennation angle increased in the rectus femoris but not significantly, showing a moderate effect size, while in the vastus lateralis it decreased, also without statistical significance. These changes in muscle thickness are not accompanied by an increase in pennation angle and could be explained by an increase in fascicle length, which was not measured in our study. The study by Kudo et al. demonstrated that an increase in fascicle length may explain the lack of change in pennation angle, as it is related to achieving an optimal angle for movement execution (Kudo et al., 2020). Moreover, it is important to consider that the effect of plyometric training on muscle architecture is influenced by many variables such as age, sex, training level, and familiarity with the method, among others, which may lead to contradictory results (Ramírez-delaCruz et al., 2022).
In 1990, a study observed a slight but significant decrease in haemoglobin after six weeks of strength training (Schobersberger et al., 1990). In our study, both MCH and MCHC decreased significantly. This decrease is an adaptation to primarily aerobic exercise and is due to haemodilution, where blood volume increases, making red blood cells appear less concentrated. The improvement in maximal oxygen uptake in the Rockport test helps to explain this change. Another study conducted in Poland on sedentary individuals who followed a training programme over four mesocycles evaluated haematological and biochemical markers at the end of each four-week cycle (Kostrzewa-Nowak et al., 2020). The first mesocycle consisted of circuit training, including plyometric exercises, and its results allow for comparison with our study at its conclusion.
In addition, a study conducted in Singapore on healthy young individuals obtained similar results when comparing groups undergoing strength training three times per week on consecutive versus non-consecutive days. The results at four weeks from the first study and at twelve weeks from the second showed outcomes very similar to ours, with an increase in haematocrit but a decrease in mean corpuscular haemoglobin and mean corpuscular haemoglobin concentration (Yang et al., 2018). It is worth highlighting that when comparing athletes from different disciplines, haematocrit values are higher in strength-trained athletes than in those trained for endurance or mixed modalities (López Chicharro & Mojares, 2008). Sarkar et al. (Sarkar et al., 2020) conducted a study on Indian cyclists with at least four years of state-level competition, which showed no changes in variables such as haemoglobin following a concurrent training programme combining eccentric cycling and plyometric training over four weeks. The comparison with our study lies in the training duration. The difference in our findings, with a statistically significant increase in some red blood cell parameters, may be explained by the lower training level of the participants in our study (university students), while in the aforementioned study, the participants were high-performance cyclists.
Such a short training period as in our study produced statistically significant changes in haematocrit and haemoglobin, which suggests an increase in oxygen transport during strength training. Similar results were found in a study involving plyometric training in alpine skiers with a training duration of 12 weeks (Ibis et al., 2012). Other studies conducted in India on university students who were football and handball players evaluated haemoglobin and red blood cell count before and after twelve weeks of training in strength only, plyometrics only, combined plyometrics and strength, and a control group. In all intervention groups, haemoglobin and red blood cell count increased significantly when compared to the control group (Anand et al., 2019; Saran et al., 2019). When comparing the intervention groups among themselves, differences were observed in the group that followed plyometric training combined with circuit strength training compared to the plyometric-only and strength-only circuit training groups, regardless of which of the two was compared.
Regarding blood chemistry, strength training tends to have a positive effect, mainly on low-density lipoproteins, while high-density lipoproteins show inconsistent results (He et al., 2023; Tambalis et al., 2009). For example, in postmenopausal women, strength training decreases total cholesterol, LDL, and triglycerides, while the increase in HDL is smaller (He et al., 2023). When comparing aerobic training with circuit strength training in young women over an 8-week period, positive changes in the lipid profile were observed, with no significant differences between the two types of training (Beqa Ahmeti et al., 2020). This comparison was also made in obese adolescents over a 6-month period, showing a significant increase in HDL only in the aerobic training group, while LDL only decreased in the strength training group (Küçük Yetgin et al., 2020). It is important to mention that all studies in a systematic review showing contradictory results regarding HDL had a minimum duration of 12 weeks (Tambalis et al., 2009), while the meta-analysis identifying smaller changes found them mainly in short-duration interventions and in postmenopausal obese women or women with dyslipidaemia (He et al., 2023). Our study, with a duration of 4 weeks in young individuals, showed a negative effect with a significant increase in total cholesterol, LDL, and triglycerides, and a positive effect with an increase in HDL. It is important to consider that the abrupt end of the study due to force majeure led to earlier testing, particularly in the post-intervention laboratory analyses, with consequences related to the lack of compliance with the protocol that may have affected, especially, the blood chemistry results. It is uncommon for significant changes in the lipid profile to occur in 4 weeks unless a therapeutic plan with medication is being implemented. For this reason, the blood chemistry results should be interpreted with caution. Moreover, 48 h without alcohol consumption may not be sufficient to avoid the negative effects on adaptations to strength training (Lakićević, 2019; Nourshahi et al., 2024).
All the improvements in jump performance assessed with the SJ and CMJ demonstrate an increase in power and muscular strength levels, which in turn is a protective factor against cardiovascular diseases (Carbone et al., 2020) as well as a significant improvement in maximum oxygen consumption in the Rockport test, directly related to the increase in red blood cell parameters.

5. Conclusions

A four-week eccentric circuit strength training programme produces improvements in young university students, as evidenced by beneficial changes in haematology (erythrocyte series), lipid profile, quadriceps muscle hypertrophy and quality (ultrasound), and increased vertical jump power.

Limitations

For various reasons, we did not have a control group, which undoubtedly reduces the robustness of the results obtained. In addition, the low participation of female students prevented us from differentiating the effects of strength training by gender. However, we considered it equally important to include them in the study. The lack of strict control of diet and, in particular, alcohol consumption, constitutes a bias, as these factors can significantly alter the results of muscle adaptations to strength training and blood tests, especially in variables related to blood chemistry. Measurement of muscle fascicle length was not performed in our study and should be included in future research to quantify the effects of training on muscle size measured ultrasonographically. In addition, the sudden interruption of academic activities due to a student strike reduced the training programme to four weeks and may have led to a decrease in student participation in the research process.

Author Contributions

Conceptualization, J.C.G.G., G.M.R.R., D.C.N., J.E.C., J.C.A.A., G.C.Z. and O.R.-Á.; methodology, J.C.G.G., G.M.R.R., D.C.N., J.E.C., J.C.A.A., G.C.Z. and O.R.-Á.; software, J.C.G.G., G.M.R.R., D.C.N., J.E.C., J.C.A.A., G.C.Z. and O.R.-Á.; validation, J.C.G.G., G.M.R.R., D.C.N., J.E.C., J.C.A.A., G.C.Z. and O.R.-Á.; formal analysis, J.C.G.G., G.M.R.R., D.C.N., J.E.C., J.C.A.A., G.C.Z. and O.R.-Á.; investigation, J.C.G.G., G.M.R.R., D.C.N., J.E.C., J.C.A.A., G.C.Z. and O.R.-Á.; resources, J.C.G.G., G.M.R.R., D.C.N., J.E.C., J.C.A.A., G.C.Z. and O.R.-Á.; data curation, J.C.G.G., G.M.R.R., D.C.N., J.E.C., J.C.A.A., G.C.Z. and O.R.-Á.; writing—original draft, J.C.G.G., G.M.R.R., D.C.N., J.E.C., J.C.A.A., G.C.Z. and O.R.-Á.; writing—review and editing, J.C.G.G., D.C.N., J.E.C., J.C.A.A., G.C.Z. and O.R.-Á.; visualization, G.M.R.R. All authors have read and agreed to the published version of the manuscript.

Funding

This research received no external funding.

Institutional Review Board Statement

This study was conducted in accordance with the Declaration of Helsinki and approved by the Ethics Committee of Politécnico Colombiano Jaime Isaza Cadavid (protocol code #201801007381 and date of approval 12 October 2018).

Informed Consent Statement

Informed consent was obtained from all subjects involved in this study.

Data Availability Statement

The data presented in this study are available on request from the corresponding author.

Acknowledgments

We acknowledge all participants in this study.

Conflicts of Interest

The authors declare no conflicts of interest.

Abbreviations

The following abbreviations are used in this manuscript:
1RMOne-repetition maximum
A-VITVastus intermedius thickness in the anterior region
AEI-SFTEcho intensity of anterior subcutaneous fat tissue
ASFTAnterior subcutaneous fat tissue thickness
ATTAnterior total thickness
BandBand neutrophils (immature neutrophils)
BASBasophils
BAS_CITCitrated basophils
BMIBody mass index
CBCComplete blood count
CHOTotal cholesterol
CHrHemoglobin reticulocytes (CHr)
CMJCounter movement jump
CMJPCountermovement jump power
CMJPRRelative countermovement jump power
CPKCreatine phosphokinase
CRECreatinine
DAMMedian absolute deviation
Dif1Anterior fat EI minus RF EI
Dif2Anterior fat EI minus anterior VI EI
Dif3Anterior fat EI minus average of RF EI and anterior VI EI
Dif4Lateral fat EI minus VL EI
Dif5Anterior fat EI minus lateral VI EI
Dif6Lateral fat EI minus average of VL EI and lateral VI EI
EIEcho-intensity
EI-A-VIEcho intensity of the vastus intermedius in the anterior region
EI-L-VIEcho intensity of the vastus intermedius in the lateral region
EI-RFEcho intensity of the rectus femoris
EI-VLEcho intensity of the vastus lateralis
EOSEosinophils
F_ALKAlkaline phosphatase (also abbreviated as ALP)
GGTGamma-glutamyl transferase
GLUGlucose
GRATOXToxic granulations
HCTHematocrit
HDLHigh-density lipoprotein cholesterol
HGBHemoglobin
HRHeart rate
IMM_GRANImmature granulocytes
INSUInsulin
L-VITVastus intermedius thickness in the lateral region
LDLLow-density lipoprotein cholesterol
LEI-SFTEcho intensity of the lateral subcutaneous fat tissue
LSFTLateral subcutaneous fat thickness
LTTLateral total thickness
LYMLymphocytes
MCHMean corpuscular hemoglobin
MCHCMean corpuscular hemoglobin concentration
MCVMean corpuscular volume
MONMonocytes
MOR_PLAAbnormal platelet morphology
MPVMean platelet volume
MTMuscle thickness
nSample size
NEUNeutrophils
NRBCNucleated red blood cells
P-LCRPlatelet large cell ratio
PAPhysical activity
PA-RFPennation angle of the rectus femoris
PA-VLPennation angle of the vastus lateralis
PBASBasal protein
PCTPlateletcrit
PDWPlatelet distribution width
PLCRPlatelet large cell ratio (dup. of ANS)
PLTPlatelets
RBCRed blood cells
RDWRed cell distribution width
RDW-SDRed cell distribution width—standard deviation
RET-PLTReticulated platelets
RET#Reticulocyte count (absolute)
RET%Reticulocyte percentage
RFRectus femoris
RFTRectus femoris thickness
SDStandard deviation
SJSquat jump
SJPPower of the squat jump
SJPRRelative squat jump power
TRIGTriglycerides
TUTTotal time under tension
USUltrasound
VLVastus lateralis
VLTVastus lateralis thickness
VO2maxMaximum oxygen consumption
WBCWhite blood cells

References

  1. Anand, M., Vaithianathan, K., Saran, K. S., & Prasanna, T. A. (2019). Effect of game specific circuit training and plyometrics on selected physiological and hematological variables of handball players. Indian Journal of Public Health Research & Development, 10(7), 365. [Google Scholar] [CrossRef]
  2. Benavides-Villanueva, J., & Ramirez-Campillo, R. (2022). Entrenamiento con sobrecarga, duración de la repetición e hipertrofia: Una revisión de la literatura. Revista Ciencias de La Actividad Física, 23(1), 1–13. [Google Scholar] [CrossRef]
  3. Beqa Ahmeti, G., Idrizovic, K., Elezi, A., Zenic, N., & Ostojic, L. (2020). Endurance training vs. circuit resistance training: Effects on lipid profile and anthropometric/body composition status in healthy young adult women. International Journal of Environmental Research and Public Health, 17(4), 1222. [Google Scholar] [CrossRef]
  4. Bompa, T., & Buzzichelli, C. (2015). Periodization training for sports (3rd ed.). Human kinetics. [Google Scholar]
  5. Calderón, J. (2007). Fisiología aplicada al deporte. Editorial Tébar. [Google Scholar]
  6. Carbone, S., Kirkman, D. L., Garten, R. S., Rodriguez-Miguelez, P., Artero, E. G., Lee, D. C., & Lavie, C. J. (2020). Muscular strength and cardiovascular disease. Journal of Cardiopulmonary Rehabilitation and Prevention, 40(5), 302–309. [Google Scholar] [CrossRef]
  7. Chalapud Narváez, L. M., & Molano Tobar, N. J. (2021). Nivel de actividad física en universitarios de Popayán. Revista Cubana de Investigaciones Biomédicas, 40(4). Available online: https://revibiomedica.sld.cu/index.php/ibi/article/view/1083 (accessed on 3 July 2025).
  8. Dolgener, F. A., Hensley, L. D., Marsh, J. J., & Fjelstul, J. K. (1994). Validation of the rockport fitness walking test in college males and females. Research Quarterly for Exercise and Sport, 65(2), 152–158. [Google Scholar] [CrossRef]
  9. Franchi, M. V., Reeves, N. D., & Narici, M. V. (2017). Skeletal muscle remodeling in response to eccentric vs. concentric loading: Morphological, molecular, and mesolic adaptations. Frontiers in Physiology, 8, 447. [Google Scholar] [CrossRef]
  10. Gentil, P., Soares, S., & Bottaro, M. (2015). Single vs. multi-joint resistance exercises: Effects on muscle strength and hypertrophy. Asian Journal of Sports Medicine, 6(1). [Google Scholar] [CrossRef]
  11. Harput, G., Toprak, U., Colakoglu, F. F., Temel, E., Saylisoy, S., & Baltaci, G. (2023). Effects of plyometric training on sonographic characteristics of quadriceps muscle and patellar tendon, quadriceps strength, and jump height in adolescent female volleyball players. International Journal of Athletic Therapy and Training, 28(2), 89–96. [Google Scholar] [CrossRef]
  12. He, M., Hu, S., Wang, J., Wang, J., Găman, M. A., Hariri, Z., & Tian, Y. (2023). Effect of resistance training on lipid profile in postmenopausal women: A systematic review and meta-analysis of randomized controlled trials. European Journal of Obstetrics & Gynecology and Reproductive Biology, 288, 18–28. [Google Scholar] [CrossRef]
  13. Ibis, S., Hazar, S., & Demirci, I. (2012). The effect of plyometric training on hematological parameters in alpine skiers. Age (Years), 12(17). Available online: https://sportspa.ftos.untz.ba/index.php/sportspa/article/view/87/80 (accessed on 3 July 2025).
  14. Kleinberg, C. R., Ryan, E. D., Tweedell, A. J., Barnette, T. J., & Wagoner, C. W. (2016). Influence of lower extremity muscle size and quality on stair-climb performance in career firefighters. Journal of Strength and Conditioning Research, 30(6), 1613–1618. [Google Scholar] [CrossRef] [PubMed]
  15. Kostrzewa-Nowak, D., Nowakowska, A., Zwierko, T., Rybak, M., & Nowak, R. (2020). The influence of a health-related fitness training program on motor performance as well as hematological and biochemical parameters. International Journal of Environmental Research and Public Health, 17(2), 578. [Google Scholar] [CrossRef]
  16. Kraemer, W. J., & Ratamess, N. A. (2004). Fundamentals of resistance training: Progression and exercise prescription. Medicine & Science in Sports & Exercise, 36(4), 674–688. [Google Scholar] [CrossRef]
  17. Kudo, S., Sato, T., & Miyashita, T. (2020). Effect of plyometric training on the fascicle length of the gastrocnemius medialis muscle. Journal of Physical Therapy Science, 32(4), 277–280. [Google Scholar] [CrossRef]
  18. Küçük Yetgin, M., Agopyan, A., Küçükler, F. K., Gedikbaşı, A., Yetgin, S., Çelik Kayapınar, F., Özbar, N., Biçer, B., & Çotuk, H. B. (2020). The effects of resistance and aerobic exercises on adiponectin, insulin resistance, lipid profile and body composition in adolescent boys with obesity. Istanbul Medical Journal, 21(3), 182–189. [Google Scholar] [CrossRef]
  19. Lakićević, N. (2019). The effects of alcohol consumption on recovery following resistance exercise: A systematic review. Journal of Functional Morphology and Kinesiology, 4(3), 41. [Google Scholar] [CrossRef]
  20. Lorenzo, L. R., Del Olmo, M. F., Molina, J. S., & Acero, R. M. (2020). Criterios observables para la ejecución de pruebas de salto vertical: SJ, CMJ, CMJA, 1RJA. Revista de Entrenamiento Deportivo [Internet], 34. Available online: https://portalinvestigacion.udc.gal/documentos/608ca9d8af765575d40b1fb8 (accessed on 3 July 2025).
  21. López Chicharro, J. L., & Mojares, L. M. L. (2008). Fisiología Clínica del Ejercicio. Editorial Médica Panamericana. [Google Scholar]
  22. Lum, D., Tan, F., Pang, J., & Barbosa, T. M. (2019). Effects of intermittent sprint and plyometric training on endurance running performance. Journal of Sport and Health Science, 8(5), 471–477. [Google Scholar] [CrossRef]
  23. Makaruk, H., Winchester, J. B., Sadowski, J., Czaplicki, A., & Sacewicz, T. (2011). Effects of unilateral and bilateral plyometric training on power and jumping ability in women. Journal of Strength and Conditioning Research, 25(12), 3311–3318. [Google Scholar] [CrossRef]
  24. Mangine, G. T., Fukuda, D. H., LaMonica, M. B., Wells, A. J., Townsend, J. R., Jajtner, A. R., Fragala, M. S., Stout, J. R., & Hoffman, J. R. (2014). Influence of gender and muscle architecture asymmetry on jump and sprint performance. Journal of Sports Science & Medicine, 13(4), 904–911. [Google Scholar]
  25. Marcon, M., Ciritsis, B., Laux, C., Nanz, D., Nguyen-Kim, T. D. L., Fischer, M. A., Andreisek, G., & Ulbrich, E. J. (2015). Cross-sectional area measurements versus volumetric assessment of the quadriceps femoris muscle in patients with anterior cruciate ligament reconstructions. European Radiology, 25(2), 290–298. [Google Scholar] [CrossRef] [PubMed]
  26. Marušič, J., Vatovec, R., Marković, G., & Šarabon, N. (2020). Effects of eccentric training at long-muscle length on architectural and functional characteristics of the hamstrings. Scandinavian Journal of Medicine & Science in Sports, 30(11), 2130–2142. [Google Scholar] [CrossRef]
  27. Mazzetti, S. A., Kraemer, W. J., Volek, J. S., Duncan, N. D., Ratamess, N. A., Gómez, A. L., Newton, R. U., Hakkinen, K., & Fleck, S. J. (2000). The influence of direct supervision of resistance training on strength performance. Medicine & Science in Sports & Exercise, 32(6), 1175–1184. [Google Scholar] [CrossRef]
  28. Menon, M. K., Houchen, L., Harrison, S., Singh, S. J., Morgan, M. D., & Steiner, M. C. (2012). Ultrasound assessment of lower limb muscle mass in response to resistance training in COPD. Respiratory Research, 13(1), 119. [Google Scholar] [CrossRef]
  29. Monti, E., Franchi, M. V., Badiali, F., Quinlan, J. I., Longo, S., & Narici, M. V. (2020). The time-course of changes in muscle mass, architecture and power during 6 weeks of plyometric training. Frontiers in Physiology, 11, 946. [Google Scholar] [CrossRef]
  30. Mota, J. A., Stock, M. S., & Thompson, B. J. (2017). Vastus lateralis and rectus femoris echo intensity fail to reflect knee extensor specific tension in middle-school boys. Physiological Measurement, 38(8), 1529–1541. [Google Scholar] [CrossRef]
  31. Murray, C. J. L., Lauer, J. A., Hutubessy, R. C. W., Niessen, L., Tomijima, N., Rodgers, A., Lawes, C. M. M., & Evans, D. B. (2003). Effectiveness and costs of interventions to lower systolic blood pressure and cholesterol: A global and regional analysis on reduction of cardiovascular-disease risk. The Lancet, 361(9359), 717–725. [Google Scholar] [CrossRef]
  32. Nourshahi, M., Rostami, S., & Nazari, N. (2024). The impact of alcohol consumption on resistance training-induced muscle hypertrophy and alcohol-induced cardiomyopathy. Journal of Sport and Exercise Physiology, 17(2), 109–129. [Google Scholar]
  33. Proske, U., & Morgan, D. L. (2001). Muscle damage from eccentric exercise: Mechanism, mechanical signs, adaptation and clinical applications. The Journal of Physiology, 537(2), 333–345. [Google Scholar] [CrossRef]
  34. Ramírez-delaCruz, M., Bravo-Sánchez, A., Esteban-García, P., Jiménez, F., & Abián-Vicén, J. (2022). Effects of plyometric training on lower body muscle architecture, tendon structure, stiffness and physical performance: A systematic review and meta-analysis. Sports Medicine-Open, 8(1), 40. [Google Scholar] [CrossRef] [PubMed]
  35. Reimers, K., Reimers, C. D., Wagner, S., Paetzke, I., & Pongratz, D. E. (1993). Skeletal muscle sonography: A correlative study of echogenicity and morphology. Journal of Ultrasound in Medicine, 12(2), 73–77. [Google Scholar] [CrossRef] [PubMed]
  36. Restrepo, A., Cardona, D., & Ruiz, G. (2022). Programa de entrenamiento de la zona core en fútbol. In En Ciencias del deporte y de la actividad física (pp. 113–154). Kinesis. [Google Scholar]
  37. Santos, R., & Armada-da-Silva, P. A. S. (2017). Reproducibility of ultrasound-derived muscle thickness and echo-intensity for the entire quadriceps femoris muscle. Radiography, 23(3), e51–e61. [Google Scholar] [CrossRef] [PubMed]
  38. Saran, K. S., Vaithianathan, K., Anand, M., & Prasanna, T. A. (2019). Isolated and combined effect of plyometric and weight training on selected physical fitness and hematological variables of football players. Indian Journal of Public Health Research & Development, 10(7), 362. [Google Scholar] [CrossRef]
  39. Sarkar, S., Dasgupta, S., Meitei, K. K., Adhikari, S., Bandyopadhyay, A., & Dey, S. K. (2020). Effect of eccentric cycling and plyometric training on physiological and performance related parameters of trained junior track cyclists. Polish Journal of Sport and Tourism, 27(1), 14–20. [Google Scholar] [CrossRef]
  40. Sarto, F., Spörri, J., Fitze, D. P., Quinlan, J. I., Narici, M. V., & Franchi, M. V. (2021). Implementing ultrasound imaging for the assessment of muscle and tendon properties in elite sports: Practical aspects, methodological considerations and future directions. Sports Medicine, 51(6), 1151–1170. [Google Scholar] [CrossRef]
  41. Sayers, S. P., Harackiewicz, D. V., Harman, E. A., Frykman, P. N., & Rosenstein, M. T. (1999). Cross-validation of three jump power equations. Medicine & Science in Sports & Exercise, 31(4), 572–577. [Google Scholar] [CrossRef]
  42. Schobersberger, W., Tschann, M., Hasibeder, W., Steidl, M., Herold, M., Nachbauer, W., & Koller, A. (1990). Consequences of 6 weeks of strength training on red cell O2 transport and iron status. European Journal of Applied Physiology and Occupational Physiology, 60(3), 163–168. [Google Scholar] [CrossRef]
  43. Schoenfeld, B. J. (2010). The mechanisms of muscle hypertrophy and their application to resistance training. Journal of Strength and Conditioning Research, 24(10), 2857–2872. [Google Scholar] [CrossRef]
  44. Stock, M. S., & Thompson, B. J. (2021). Echo intensity as an indicator of skeletal muscle quality: Applications, methodology, and future directions. European Journal of Applied Physiology, 121(2), 369–380. [Google Scholar] [CrossRef]
  45. Tambalis, K., Panagiotakos, D. B., Kavouras, S. A., & Sidossis, L. S. (2009). Responses of blood lipids to aerobic, resistance, and combined aerobic with resistance exercise training: A systematic review of current evidence. Angiology, 60(5), 614–632. [Google Scholar] [CrossRef] [PubMed]
  46. Verkhoshansky, Y., & Siff, M. C. (2009). Supertraining. Verkhoshansky SSTM. [Google Scholar]
  47. Wernbom, M., Augustsson, J., & Thomeé, R. (2007). The influence of frequency, intensity, volume and mode of strength training on whole muscle cross-sectional area in humans. Sports Medicine, 37(3), 225–264. [Google Scholar] [CrossRef] [PubMed]
  48. Wilk, M., Gepfert, M., Krzysztofik, M., Golas, A., Mostowik, A., Maszczyk, A., & Zajac, A. (2019). The influence of grip width on training volume during the bench press with different movement tempos. Journal of Human Kinetics, 68(1), 49–57. [Google Scholar] [CrossRef] [PubMed]
  49. Wu, J. S., Darras, B. T., & Rutkove, S. B. (2010). Assessing spinal muscular atrophy with quantitative ultrasound. Neurology, 75(6), 526–531. [Google Scholar] [CrossRef]
  50. Yang, Y., Bay, P. B., Wang, Y. R., Huang, J., Teo, H. W. J., & Goh, J. (2018). Effects of consecutive versus non-consecutive days of resistance training on strength, body composition, and red blood cells. Frontiers in Physiology, 9, 725. [Google Scholar] [CrossRef]
  51. Young, H., Jenkins, N. T., Zhao, Q., & Mccully, K. K. (2015). Measurement of intramuscular fat by muscle echo intensity. Muscle & Nerve, 52(6), 963–971. [Google Scholar] [CrossRef]
  52. Zatsiorsky, V. M., Kraemer, W. J., & Fry, A. C. (2020). Science and practice of strength training. Human kinetics. [Google Scholar]
  53. Zhu, X.-Y., Shi, M.-Q., Jiang, Z.-M., Xiao-Li, Tian, J.-W., & Su, F.-F. (2025). Global, regional, and national burden of cardiovascular diseases attributable to metabolic risks across all age groups from 1990 to 2021: An analysis of the 2021 global burden of disease study data. BMC Public Health, 25, 1704. [Google Scholar] [CrossRef]
Figure 1. Procedure.
Youth 05 00072 g001
Figure 2. Biochemical analysis distribution. Note. p-value: * < 0.05 ** < 0.001 Wilcoxon signed-rank test. M: median. MAD: absolute deviation from the median, ES: effect size, p: * < 0.05, ** < 0.01. HDL: high-density lipoprotein cholesterol. LDL: low-density lipoprotein cholesterol. CHO: total cholesterol. CPK: creatine phosphokinase. F_ALK: alkaline phosphatase (also abbreviated as ALP). GLU: glucose. TRIG: triglycerides. INSU: insulin.
Youth 05 00072 g002
Figure 3. Analysis of vertical jump measurements. Note. SJ: squat Jump. CMJ: counter movement jump. SJP: Power of the squat jump. SJPR: Relative Squat Jump Power. CMJP: Countermovement Jump Power. CMJPR: Relative Countermovement Jump Power. p-value *: Wilcoxon signed-rank test. M: median. MAD: absolute deviation from the median, ES: Effect Size, p: * < 0.05, ** < 0.001.
Youth 05 00072 g003
Table 1. Load progression.
PhaseDays% 1RMSetsRepetitionsReference
11–660–70%4–510–12(Bompa & Buzzichelli, 2015)
27–970–80%4–58–10(Schoenfeld, 2010)
310–1280–90%5–65–6(Zatsiorsky et al., 2020)
413–18 *85–95%4–54–5(Verkhoshansky & Siff, 2009)
Note. 1RM: one maximum repetition. * Not carried out due to cessation of academic activities.
Table 2. Descriptive statistics.
DescriptionValue
n31
Age (years) (Mean ± SD)22.3 ± 4.14
Height (metres) (Mean ± SD)1.73 ± 0.08
Body Mass (kg) (Median ± MAD69 ± 13.64
BMI (kg/mÂ2) (Median ± MAD)23.54 ± 3.34
Note. n: sample size. MAD: absolute deviation from the median. SD: standard deviation. BMI: body mass index.
Table 3. Distribution of ultrasonographic aspects.
UltrasoundBeforeAfterp-Value *ES
MMADMMAD
ASFT5.123.055.693.560.82790.041
RFT25.934.0527.375.460.0044 **0.500
A-VIT20.452.9421.003.460.15890.255
ATT48.066.9149.087.410.0059 **0.484
AEI-SFT155.2217.01157.1611.970.11100.289
EI-RF116.2918.16112.059.610.18210.243
EI-A-VI90.0515.8890.3813.670.99990
PA-RF15.124.5617.02.620.05520.345
LSFT5.063.235.603.290.81290.044
VLT24.324.1825.124.040.0351 *0.377
L-VIT20.404.6319.514.370.82040.042
LTT47.597.9948.586.520.0032 **0.516
LEI-SFT151.5910.90155.489.980.13530.271
EI-VL119.7418.02117.3910.780.15740.257
EI-L-VI78.4714.6280.0319.120.39920.155
PA-VL16.133.5915.653.190.96150.011
Dif133.015.5441.1718.32<0.0001 **0.686
Dif267.1715.4071.7321.280.22410.222
Dif349.1114.0655.6313.730.0027 **0.524
Dif430.7824.9437.9219.890.0012 **0.560
Dif579.5213.8084.1023.020.85440.035
Dif656.6519.2759.7721.540.15740.257
Note. ASFT: Anterior subcutaneous fat tissue thickness. RFT: Rectus femoris thickness. A-VIT: Vastus intermedius thickness in the anterior region. ATT: Anterior total thickness. AEI-SFT: Echo intensity of anterior subcutaneous fat tissue. EI-RF: Echo intensity of the rectus femoris. EI-A-VI: Echo intensity of the vastus intermedius in the anterior region. PA-RF: Pennation angle of the rectus femoris. LSFT: Lateral subcutaneous fat thickness. VLT: Vastus lateralis thickness. L-VIT: Vastus intermedius thickness in the lateral region. LTT: Lateral total thickness. LEI-SFT: Echo intensity of the lateral subcutaneous fat tissue. EI-VL: Echo intensity of the vastus lateralis. EI-L-VI: Echo intensity of the vastus intermedius in the lateral region. PA-VL: Pennation angle of the vastus lateralis. Dif1: Anterior fat EI minus RF EI. Dif2: Anterior fat EI minus anterior VI EI. Dif3: Anterior fat EI minus average of RF EI and anterior VI EI. Dif4: Lateral fat EI minus VL EI. Dif5: Anterior fat EI minus lateral VI EI. Dif6: Lateral fat EI minus average of VL EI and lateral VI EI. p-value *: Wilcoxon signed-rank test. M: median. MAD: absolute deviation from the median, ES: Effect Size, p: * < 0.05, ** < 0.01.
Table 4. Distribution of haematological parameters.
Complete Blood Count (CBC)BeforeAfterp-Value *ES
MMADMMAD
RBC5.30.445.40.300.05130.350
HGB16.01.1916.20.890.06560.331
HCT46.63.1148.02.520.00330.514
MCV88.43.4189.33.850.00150.549
MCH30.01.3329.91.330.91120.021
MCHC33.60.7433.50.740.04590.358
RDW12.80.7412.30.590.03440.378
WBC6590889.566101541.90.45880.136
NEU3596868.83320948.80.07340.322
BAND00000.50000.254
EOS170103.8190118.60.18010.243
BAS4029.654029.650.87760.030
IMN_GRAN4029.654029.650.67160.078
LYM2220474.432320548.560.05850.340
MON510163.09490148.260.39070.157
NRBC0000n.an.a
PLT25934.1025132.620.43530.143
MPV10.10.7410.10.740.93450.016
PDW11.51.3311.51.630.59080.098
P-LCR00000.50000.254
PCT0000n.an.a
PLCR00000.99990.104
CRE0000n.an.a
GGT0000n.an.a
PBAS00000.99990.180
GRATOX00000.99990.180
BAS_CIT00000.50000.254
MOR_PLA00000.99990
RDW-SD41.11.7840.51.780.31960.181
RET%1.50.441.30.300.05390.346
RET#83.623.7276.621.790.14610.264
CHr36.12.5235.83.850.99990
RET-plt2.81.333.01.190.02320.404
Note. p-value *: Wilcoxon signed-rank test. M: median. MAD: absolute deviation from the median. ES: effect size, p: * < 0.05. RBC: red blood cells. HGB: hemoglobin. HCT: hematocrit. MCV: mean corpuscular volume. MCH: mean corpuscular hemoglobin. MCHC: mean corpuscular hemoglobin concentration. RDW: red cell distribution width. WBC: white blood cells. NEU: neutrophils. Band: band neutrophils (immature neutrophils). EOS: eosinophils. BAS: basophils. IMM_GRAN: immature granulocytes. LYM: lymphocytes. MON: monocytes. NRBC: nucleated red blood cells. PLT: platelets. MPV: mean platelet volume. PDW: platelet distribution width. P-LCR: platelet large cell ratio. PCT: plateletcrit. PLCR: platelet large cell ratio (dup. of ANS). CRE: creatinine. GGT: gamma-glutamyl transferase. PBAS: basal protein. GRATOX: toxic granulations. BAS_CIT: citrated basophils. MOR_PLA: abnormal platelet morphology. RDW-SD: red cell distribution width—standard deviation. RET%: reticulocyte percentage. RET#: reticulocyte count (absolute). CHr: hemoglobin reticulocytes. RET-PLT: reticulated platelets.
Table 5. Distribution of rockport test variables.
RockportBeforeAfterp-Value *ES
MMADMMAD
HR11919.2713229.650.28270.196
VO2max52.847.4754.098.270.01670.426
Note. Wilcoxon signed-rank test. HR: heart rate. VO2max: maximum oxygen consumption. DAM: absolute deviation from the median. n: sample size. BMI: body mass index. M: median. MAD: absolute deviation from the median. ES: Effect Size, p: * < 0.05, ** < 0.001.
Disclaimer/Publisher’s Note: The statements, opinions and data contained in all publications are solely those of the individual author(s) and contributor(s) and not of MDPI and/or the editor(s). MDPI and/or the editor(s) disclaim responsibility for any injury to people or property resulting from any ideas, methods, instructions or products referred to in the content.

