1. Introduction
In recent years, the intersection of youth empowerment, environmental activism, and geospatial technology has become increasingly significant (
Asmelash, 2019;
Connect4Climate, 2015;
Salvatore & Wolbring, 2021), and which has introduced significant innovative techniques for analyzing natural ecosystems, providing valuable insights for climate change studies (
Zahir et al., 2021). This technological provision is particularly evident within the context of the YouthMappers chapter, a global initiative that engages university students in mapping projects using OpenStreetMap (OSM) to address community challenges. The OSM platform plays a crucial role in addressing local challenges by providing open, accessible geospatial data such roads, buildings, and waterways that supports disaster response, infrastructure planning, and community development to better plan evacuation routes and resource allocation (
Suthakaran et al., 2022a). However, community-driven YouthMappers’ mapping effort filled critical data gaps left by official sources, offering real-time, updated information for community participatory mapping (
Suthakaran et al., 2022b). Through OSM, local YouthMappers and volunteers were empowered to contribute directly to climate resilience and spatial planning in their own communities (
Suthakaran et al., 2022a,
2022b). Sri Lanka is known for its rich biodiversity, yet also for being one of the countries most at risk of the effects of climate change (
Climate Change Secretariat, Ministry of Mahaweli Development and Environment, 2016), making it a prime use case to examine the role of development initiatives such as YouthMappers, bolstered by booster grant project, in the form it seeks to take in amplifying Climate Activism and Education.
Young people have increasingly emerged as crucial agents of change in the battle against climate change (
Asmelash, 2019). Their involvement in environmental activism is transforming the worldwide conversation on sustainability and climate resilience. Youth are concerned about the future they will inherit, and this drives their unique perspective towards climate action (
UNDP, 2022). Among other things that they have managed to do, they have helped through advocacy, policy change, and action such as grassroots movements. Youth possess the power to influence climate policy and public opinion through advocacy, innovation, and widespread community mobilization efforts (
Han & Ahn, 2020).
The role of youth in any type of activism is crucial, and technology is also an equally important component for the globalization of climate activism (
Dwivedi et al., 2022). This is particularly the case when OSM is being used, which is an open geospatial content system. By democratizing cartography, OSM provides tools and opportunities for places where authoritative maps are too old or unavailable (
Schröder-Bergen et al., 2022). An example of such a program is YouthMappers chapter, in which university students are involved in programs that promote OSM and environmental activism. It thereby actively engages young people in volunteering to prepare them for global and local needs, such as disaster management, urbanization, and mapping (
Solís et al., 2020).
However, as noted by the UNDP, Sri Lanka exemplifies the challenges faced by youth in addressing one of the most critical crises in the epoch of environmental degradation, with 96% of its disasters being climate- and weather-related, as reported by the Index for Risk Management (
UNDP, 2024). Sri Lanka is highly vulnerable to the impacts of climate change. Youth comprise approximately 23.2% of the population, and encouragingly, they are becoming increasingly aware of these issues and are actively advocating for urgent climate action and sustainable solutions (
UNDP, 2022). Generally, like their peers worldwide, Sri Lankan youth often draw public attention for the ‘wrong’ reasons. This is largely because, as a society, the country frequently fails to recognize their potential for the ‘right’ reasons (
UNDP, 2024). Therefore, it overlooks their positive contributions to society, hesitates to entrust them with leadership roles, and falls short of honoring our commitments to provide them the opportunities and space they need to thrive.
Samaraweera et al. (
2024) reported that projects have demonstrated a strong link between youths’ education and climate change resilience, highlighting how empowering young through education can enhance community adaptation and sustainability efforts. Engaging youth in addressing this adaptation is crucial for resilience and sustainable development. Youth-led initiatives, supported by technological tools like OSM, are having tangible impacts in Sri Lanka. For example, local YouthMappers chapters have undertaken projects to map flood-prone areas, monitor deforestation, and document biodiversity hotspots, thereby contributing valuable data for climate resilience planning.
However, the Humanitarian OSM Team (HOT) is an international organization committed to advancing humanitarian action and community development through open mapping. HOT has a vital role in fostering and amplifying the voluntary mapping efforts led by the Open Mapping Hub in the Asia–Pacific region. Established to drive the open mapping movement, the hub collaborates with open mapping organizations and communities from 25 countries, enabling the exchange of ideas, expertise, and best practices (
Open Mapping Hub—Asia Pacific, 2024). It also provides financial and technical support to significantly enhance local contributions to OSM. In this context, the OMH-AP has extended its support to Sri Lanka’s open mapping initiatives through a booster grant in 2023. Members of the OMH-AP and Sri Lankan OSM mappers have engaged in national dialog to strategize the enhancement of local mapping activities. The Eastern University, Sri Lanka, lead by the Department of Geography, has been identified as the ideal institution to lead these efforts. This university will serve as the fund administrator and spearhead the activities undertaken as a key part of the grant. The primary aim of the booster grant is to support mapping activities that promote knowledge dissemination about OSM/open mapping at a national level, thereby strengthening and uplifting the Sri Lankan OSM community. By engaging in open mapping activities and related research, students can connect with local and international communities, enhancing their skills, knowledge, and communication regarding open geospatial technology. Booster grants have been critical in improving the capacity of YouthMappers chapters. The financial resources offered by these grants enable the expansion of mapping projects to a wider area and greater depth, training workshops, and work with other stakeholders in the community (
Booster Grant Project, 2023). Such initiatives are made more feasible by booster grants, therefore enabling chapters to undertake more ambitious projects with broader reach in Climate Activism and Education. In the case of Sri Lanka for instance, booster grant-funded projects have made notable achievements, for instance, in the production of countrywide flood risk maps and the setting up of teaching schemes focusing on their country’s population and the issue of climate change (
Booster Grant Project, 2023). However, appreciating the role played by booster grant projects for improving YouthMappers chapters in Sri Lanka may assist in the development of best practices for the encouragement of youth environmental activism and education throughout the world. This study adds to the existing body of knowledge on youth, technology, and environmental mitigating factors by analyzing specific case studies and project results.
Therefore, this research aims to examine how the booster grant contributed to affecting the efficiency of projects in relation to youth involvement and education value practices in those mapping projects to the YouthMappers chapters and their efficacy in advancing climate activism and educational initiatives in Sri Lanka. This study attempts to answer the following research questions:
How have booster grant projects impacted the effectiveness of YouthMappers chapters in addressing climate-related challenges in Sri Lanka?
What levels of youth engagement and participation have been achieved in these projects?
What educational benefits and knowledge transfer have resulted from these mapping initiatives?
1.1. YouthMappers and the Role of OSM
YouthMappers, established in 2015 and hosted by Texas Tech University, is a global initiative that mobilizes university students to leverage OSM for addressing various community challenges. With a mission to cultivate a generation of leaders who create resilient communities through mapping, YouthMappers chapters operate across more than 60 countries (
YouthMappers, 2020), including Sri Lanka, engaging young people in meaningful and impactful projects. As an OSM and web-based platform, it enables users to create and share geospatial data freely (
Kaleel & Zahir, 2016;
White et al., 2023;
Zahir et al., 2025). It has become an indispensable tool for humanitarian efforts, disaster response, and sustainable development. The participatory nature of OSM allows for the democratization of geographic information, making detailed maps accessible even in regions where official data is scarce or outdated. This facet of OSM is more important in developing countries where there is a deficit of geographical information (
Haklay & Weber, 2008).
Chapters of YouthMappers have utilized OSM to solve a range of problems. For example, they contribute volunteer mapping for areas prone to flooding and evacuation sites and report on the state of infrastructures, among other things (
Suthakaran et al., 2022a;
Schelhorn et al., 2014). These maps are very important to local authorities together with local institutions in terms of their strategies and approaches to disaster response (
Khan et al., 2023). In addition, projects implemented by YouthMappers help in the protection of the environment by helping to map natural resources as well as designated areas for protection (
Suthakaran et al., 2022a). Thus, this data assists in conservation planning and monitoring, which are essential in the protection of ecosystems and biodiversity.
The educational influence of the geospatial volunteer mapping technology of YouthMappers is also worthy of attention for open-source volunteer mapping. By developing YouthMappers in areas with geospatial technologies and mapping, it can equip them with technical skills and inculcate civic responsibilities. Participants acquire relevant experience that will be useful in the carrying out of future jobs in urban planning, environmental studies, and disaster management. In addition, the fact that mapping is collective work encourages collaboration and community participation and therefore enhances the work carried out by enriching the educational maps, which are essential to local authorities and organizations in the design and execution of operational plans in response to disaster risks (
YouthMappers, 2020).
1.2. Booster Grant Support for Addressing Climate Challenges in Sri Lanka
Sri Lanka, an island nation in the Indian Ocean, is highly vulnerable to the adverse impacts of climate change (
Solís et al., 2020). According to
Samaraweera et al. (
2024), the country faces numerous environmental challenges, including rising sea levels, coastal erosion, increasing frequency of extreme weather events, and significant threats to biodiversity. These issues demand urgent and innovative solutions to promote sustainable development and environmental conservation.
In particular, Sri Lanka’s extensive coastline is particularly threatened by rising sea levels (
Thavanayagam et al., 2022;
Zahir et al., 2021), which intensify coastal erosion and jeopardize habitats and livelihoods, especially within fishing communities. Reports from the Intergovernmental Panel on Climate Change (IPCC) predict a potential global sea-level rise of up to one meter by the end of the century, placing Sri Lanka’s low-lying coastal areas at significant risk (
IPCC, 2019).
Further, according to
Jayawardena et al. (
2018), extreme meteorological conditions, including cyclones, floods, and droughts, have increased in terms of both frequency and their impact. It is worth noting that the severe flooding that occurred in 2017, which led to serious economic damages and the displacement of hundreds of thousands, demonstrated the urgent need for sound, comprehensive disaster risk reduction systems, targeting both preparedness and response (
DMC, 2017). In addition, the increasing loss of data indicates the deterioration of rainfall patterns, coupled with extended periods of drought, which also indicates the loss of more subsystems (
FAO, 2020). This has been more pronounced in the Central Highlands region, which is a significant source of water for both farming and food security purposes. A study by
Köpke et al. (
2019) assesses these moves as a phenomenon within a dominant socioeconomic trend and provides a desirable approach for the supply of agriculture produce along with permanent safe drinking water resources. At the global level, Sri Lanka has also further been classified as a global biogeographic basin, whose distinctive ecosystems are increasingly in danger from deforestation, climate change, habitat fragmentation, and unsustainable land use practices for agriculture (
Sarathchandra et al., 2021). The island has forests, wetlands, and coral reefs, which are rich in biodiversity, and it contains numerous flora and fauna species, many of which are indigenous to the island. But these ecological regions are facing severe threats, and therefore, the conservation of these regions, along with the biological diversity therein and the species that depend on them, is critical. Therefore, to tackle the effects of extreme events, it is crucial to create spatial protection methods utilizing open data sources. Volunteer initiatives, like those backed by the OSM platform, are vital in generating precise, accessible geospatial data to aid in disaster management, climate resilience, and community protection strategies. The booster grant project initiative enhances Sri Lanka’s response to these challenges by promoting community-driven open mapping projects. Such projects increase data availability and enable informed decisions for climate resilience and disaster management. This grant project incorporates OSM technologies into university curricula, organizing mapping workshops, developing open-access geodatabases, sharing spatial skills and knowledge for the public through students, and encouraging collaboration. These efforts help confront environmental issues, enhance disaster readiness, and promote sustainable development practices across the island.
1.3. The Catalyst Role of Booster Grants
The booster grant project has become essential in amplifying the impact and reach of YouthMappers chapters to offer crucial support for open-source mapping initiatives, allowing chapters to broaden their activities, involve more participants, and effectively address local challenges in Sri Lanka. The grants facilitate a wide range of activities, including project execution, training workshops, and community partnerships, while supporting the development of detailed flood risk maps, which are essential for disaster preparedness and mitigation (
OSM Wiki, 2023). By offering financial resources, the booster grant project empowers chapters to extend their work, enhance their influence, and increase youth engagement in climate activism and education (
UN, 2013). This project enables YouthMappers chapters in Sri Lanka to undertake ambitious, impactful projects, often covering costs related to equipment, travel, training workshops, and community outreach (
OSM Wiki, 2023). This financial support alleviates financial burdens, enabling chapters to focus on the quality and breadth of their mapping efforts.
One significant advantage of the booster grant project is its ability to nurture collaboration between YouthMappers chapters and local communities. In Sri Lanka, such partnerships have led to the establishment of comprehensive environmental education programs, fostering increased community awareness and participation in climate action. This project addresses the lack of a comprehensive geodatabase in Sri Lanka. However, access to geospatial data from the Survey Department is constrained by its incomplete nature and high costs, limiting widespread accessibility (
OSM Wiki, 2023). To bridge these gaps, the booster grant project has significantly advanced open-source spatial information in Sri Lanka by organizing University YouthMappers chapter workshops, establishing an open mapping helpdesk and research unit at Eastern University, and integrating OSM into the university curriculum. Moreover, knowledge of OSM-based mapping is largely restricted to universities, with minimal outreach to the broader community, especially women, who face additional barriers due to a lack of awareness. This limitation hinders the ability to assess vulnerability levels to climate and disasters through an open mapping platform. Additional challenges, including software constraints, high internet costs, language barriers, and coordination difficulties, further impede the deployment of OSM at the community level. To mitigate these issues, offline mapping tools and data collection apps should be promoted, allowing contributors to work without internet access constraints. Partnerships with local telecom providers could also offer subsidized data packages for mapping projects. Addressing language barriers requires translating training materials and platforms into local languages and encouraging peer-to-peer learning through local chapters. Additionally, developing visual-based training modules can enhance inclusivity. These measures can empower more diverse contributors, ensuring equitable access and broader participation in YouthMappers programs globally.
2. Materials and Methods
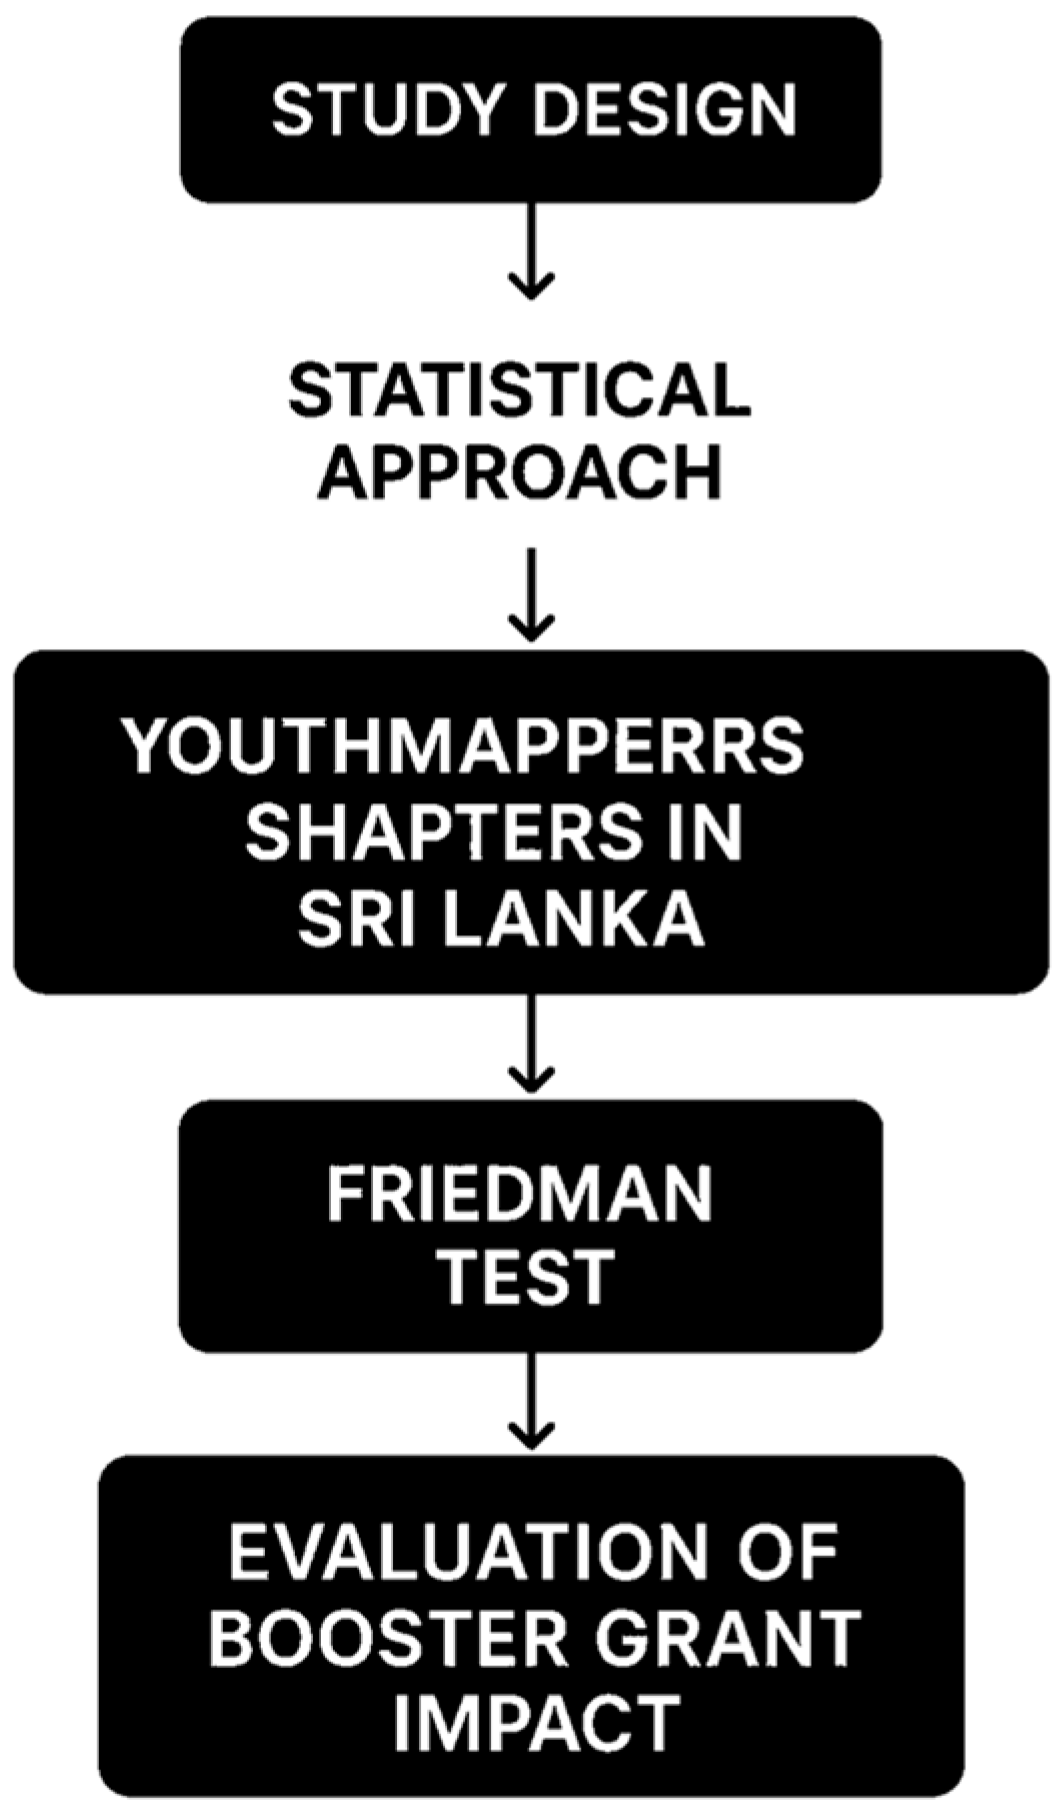
This study uses a statistical approach, combining geometric techniques to thoroughly assess the influence of booster grants on YouthMappers chapters in Sri Lanka (
Figure 1). A descriptive and exploratory design was used to assess five factors/dimensions: Capacity Building and Funding Support (CBFS), Climate Activism and Education (CAE), Community Engagement and Collaboration (CEC), Technical Skills and Resources (TSR), and Sustainability and Policy Integration (SPI). This study integrates survey-based data collection, statistical analysis, and predictive modeling to provide a robust evaluation.
2.1. Data Collection and Preprocessing
This study utilized data collected through a questionnaire survey involving 223 YouthMappers Chapter members from four Sri Lankan universities, including chapter leaders and beneficiaries of the booster grant project. It also incorporated a community-based participatory mapping process. The gathered information was analyzed using content analysis to extract meaningful insights, with a focus on youth perspectives and community involvement in the mapping initiative. Participants were actively engaged in climate activism, climate education, and OSM activities. Through mapping exercises, they generated tangible outputs such as the digitization of buildings and amenities, road tracing, and the tagging of environmental features. These geospatial contributions served as computable indicators of participation and engagement, reflecting the participants’ levels of climate awareness and activism. This approach facilitated an empirical assessment of how participatory mapping practices contribute to enhancing community resilience.
Initially, a comprehensive review of existing studies on geospatial data usage, YouthMappers chapter participants, climate vulnerability, and OSM engagement was conducted to identify key factors. Based on this review, draft questions were formulated covering five key factors/dimensions of CBFS, CAE, EC, TSR, and SPI. To validate the content and relevance of these questions, a pilot test was conducted with the YouthMappers chapter of a student from the South Eastern University of Sri Lanka who is familiar with mapping activities. Their feedback was used to refine the clarity, language, and structure of the questions, ensuring they were easily understandable across varying literacy levels. Furthermore, we were referred to academic experts in geography and the Disaster Management Centre (DMC) to assess the questionnaire’s alignment with the research objectives.
This aspect ensured the final survey instrument was both contextually appropriate and rationally robust, allowing us to gather high-quality geospatial data that reflect the community’s needs, capacities, and perspectives on open-source mapping for climate resilience. The surveys captured responses on the effectiveness of projects, youth engagement levels, and educational outcomes. The questions used a 5-point Likert scale, including Strongly Disagree (1), Disagree (2), Neutral (3), Agree (4), and Strongly Agree (5), which were converted into numerical values to assess agreement with statements across the five factors of CBFS, CAE, CEC, TSR, and SPI. Hence, the normalized data (Radial Basic Function—RBF) was sensitive to the scale. Specially, online surveys were administered by Google Forms, ensuring accessibility and broad reach across YouthMappers chapters in Sri Lanka. Similarly, reports and records from booster grant-supported initiatives were reviewed to identify tangible outcomes, such as disaster risk maps or resource mapping projects.
2.2. Statistical Analysis
The Friedman test, a non-parametric method, was applied to detect differences in participant responses across the five factors/dimensions. This helped identify statistically significant variations in project effectiveness and areas needing improvement. The Friedman test is a non-parametric statistical test used to detect differences in treatments across multiple test attempts (
Porkka et al., 2008). It is often used in situations where data are repeated measures. The following formula was used for the Friedman test statistic (
Q):
where
n is the number of subjects;
k is the number of conditions; and
Rj is the sum of ranks for each condition
Similarly, the Radial Basis Function (RBF) is a widely used mathematical function for interpolation, regression, and classification. It evaluates the distance between a given data point and a center, providing outputs based on a radial symmetric function. When using clustering or classification methods, if questionnaire data involves categorizing respondents based on the factors of CBFS, CAE, CEC, TSR, and SPI, the RBF can effectively model the non-linear boundaries between different groups. For example, RBF can be used to classify participants into categories such as ‘High Mapping Readiness’ or ‘Low Mapping Readiness’ based on their responses related to awareness, internet access, software/platform usage, and interest. However, the most common RBF is the Gaussian function, though others like multi-quadratic and inverse multi-quadratic functions are also used. For a data point
x, center
c, and scale parameter
σ, the Gaussian RBF is defined as
where ∥
x −
c∥ is the Euclidean distance between
x and
c, and
σ controls the spread or smoothness of the function.
The RBF model also analyzed relationships between dependent variables (CBFS, CAE, CEC, TSR, and SPI) and independent variables representing survey responses. The data was divided into percentages for the training and testing subsets to evaluate predictive accuracy. The model’s performance metrics included the Sum of Squares Error (SSE) and Average Relative Error (ARE).
However, a good RBF model requires selecting an optimal σ, center locations, and weights. For statistical analysis, RBF Neural Networks are commonly used. They consist of three layers:
The input layer receives the data points.
The hidden layer applies RBF kernels.
The output layer combines weighted outputs from the hidden layer.
RBFs excel in non-linear regression and classification tasks due to their ability to approximate complex functions. However, proper parameter cross-validation ensures a good fit while avoiding overfitting.
This comprehensive methodology provides a nuanced understanding of the influence of booster grants on YouthMappers chapters in Sri Lanka, offering actionable insights into enhancing youth-led Climate Activism and Education through the questionnaire survey.
3. Results
The key outputs of the project include mapping approximately 100,000 buildings and amenities, 100 km of roads, 500 points of interest, and 75–100 km of waterways. This initiative has also developed a web-based open-access geodatabase for Sri Lanka and trained 1500 participants, significantly boosting the number of YouthMappers chapter members at university levels, OSM members, and contributors (
OSM Wiki, 2023). These efforts aim to strengthen Sri Lanka’s OSM network, encouraging inclusivity, resilience, and capacity in geospatial education and practice.
However, based on statistical analysis, the Friedman test of a non-parametric statistical method is used to identify differences across multiple related samples. It is particularly effective for repeated measures or related group data. In this study, the test results reveal statistically significant differences among the variables across various factors, including CBFS, CAE, CEC, TSR, and SPI, with p < 0.001 for all dimensions.
For CBFS, CBFS(3), “Without the booster grant, we would have struggled to access essential open mapping equipment”, has the highest mean (4.54) and rank (4.15), showcasing strong agreement, whereas CBFS(4), “The booster grant enabled us to provide training for members in advanced mapping technologies”, has the lowest rating, suggesting areas for improvement. Similarly, in terms of CAE, CAE(5), “The chapter has successfully integrated climate education into its mapping activities”, is the most favorably rated, while CAE(2), “The chapter has been effective in educating the public about climate risks using the maps”, shows weaker agreement.
For CEC, CEC(3) and CEC(4) highlight strong participant agreement, while CEC(5) demonstrates the need for targeted improvements. In TSR, the strength lies in TSR(4), “Our team feels confident in using OSM and other mapping tools”, but TSR(3) reveals a gap in technical resource sufficiency. Finally, for SPI, SPI(3) and SPI(1) stand out positively, while SPI(4) reflects a key area requiring attention.
These findings provide actionable insights, emphasizing strengths like CBFS(3), CAE(5), CEC(3), TSR(4), and SPI(3), while identifying weaker areas such as CBFS(4), CAE(2), CEC(5), TSR(3), and SPI(4) for improvement. This comprehensive analysis is crucial for targeted interventions and strategic planning.
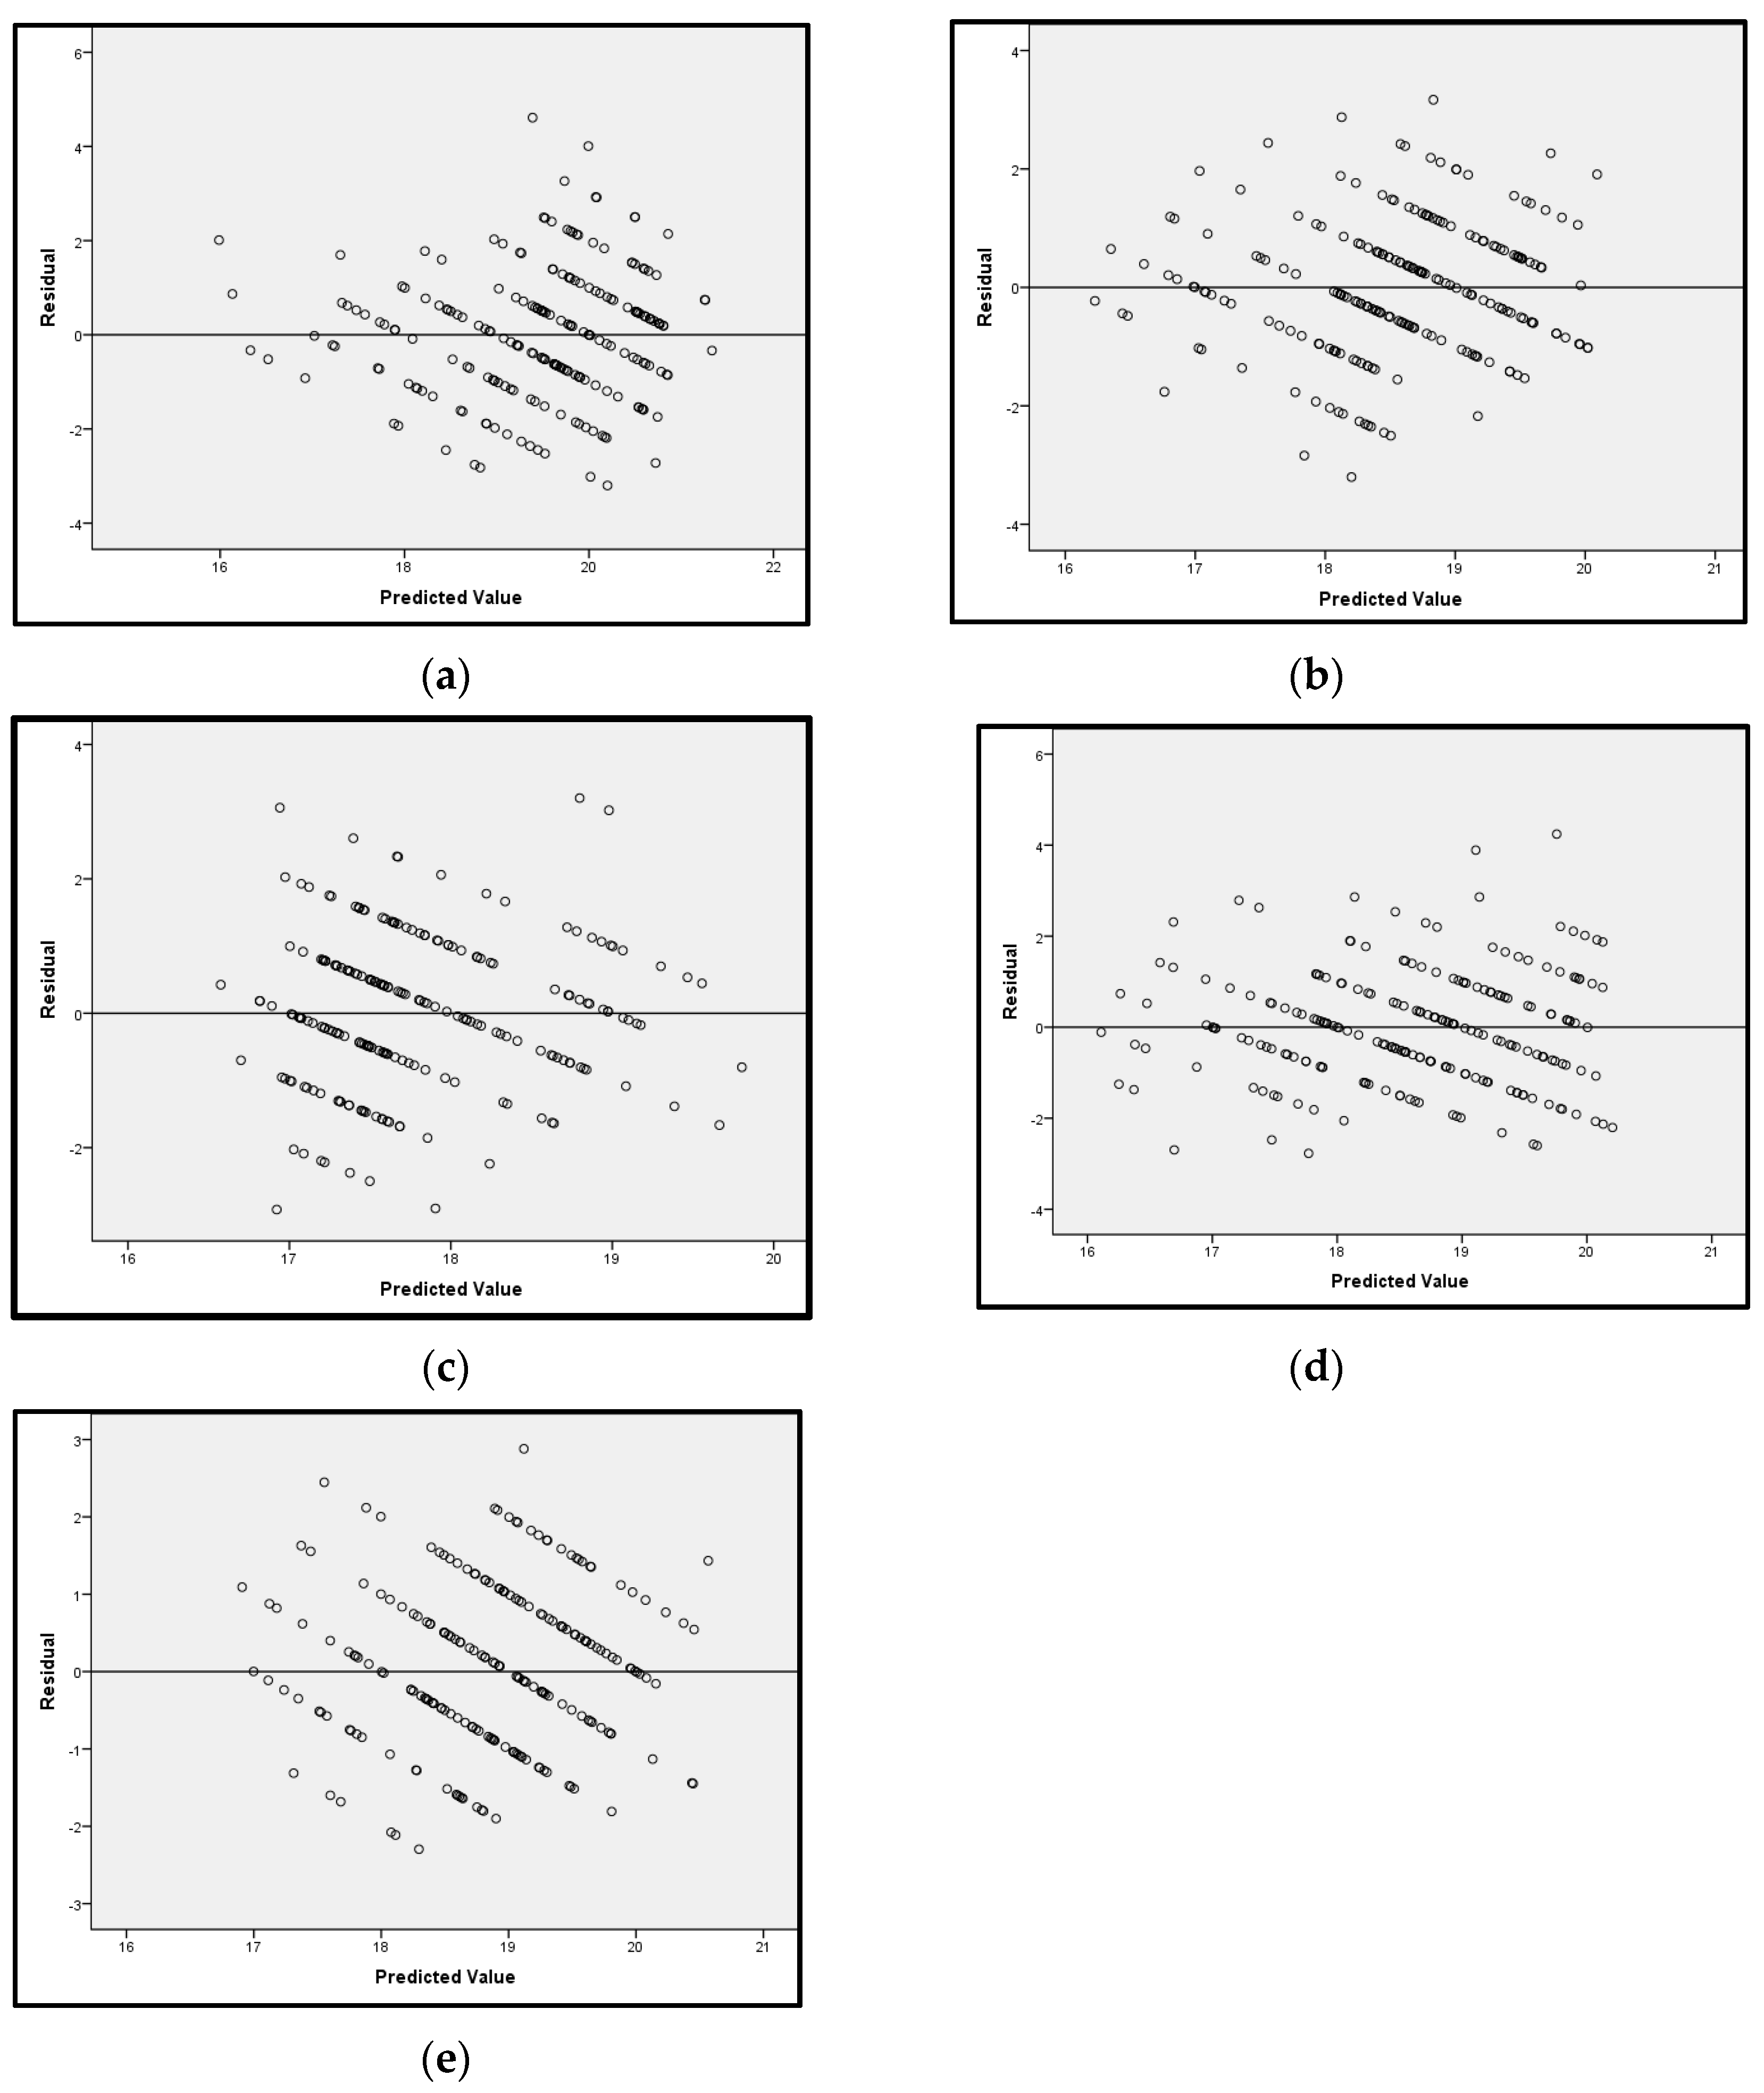
This study applied a Radial Basis Function (RBF) network to analyze data from 223 observations. This approach aimed to predict five dependent variables—ABFS, CAE, TSR, CEC, and SPI—using a set of independent variables (ABFS1 to ABFS5, CAE1 to CAE5, CEC1 to CEC5, TSR1 to TSR5, SPI1 to SPI5). The model involved the standardized rescaling of dependent variables and was split into training (74.5%) and testing (25.5%) subsets to ensure the effective evaluation and validation of its predictive performance.
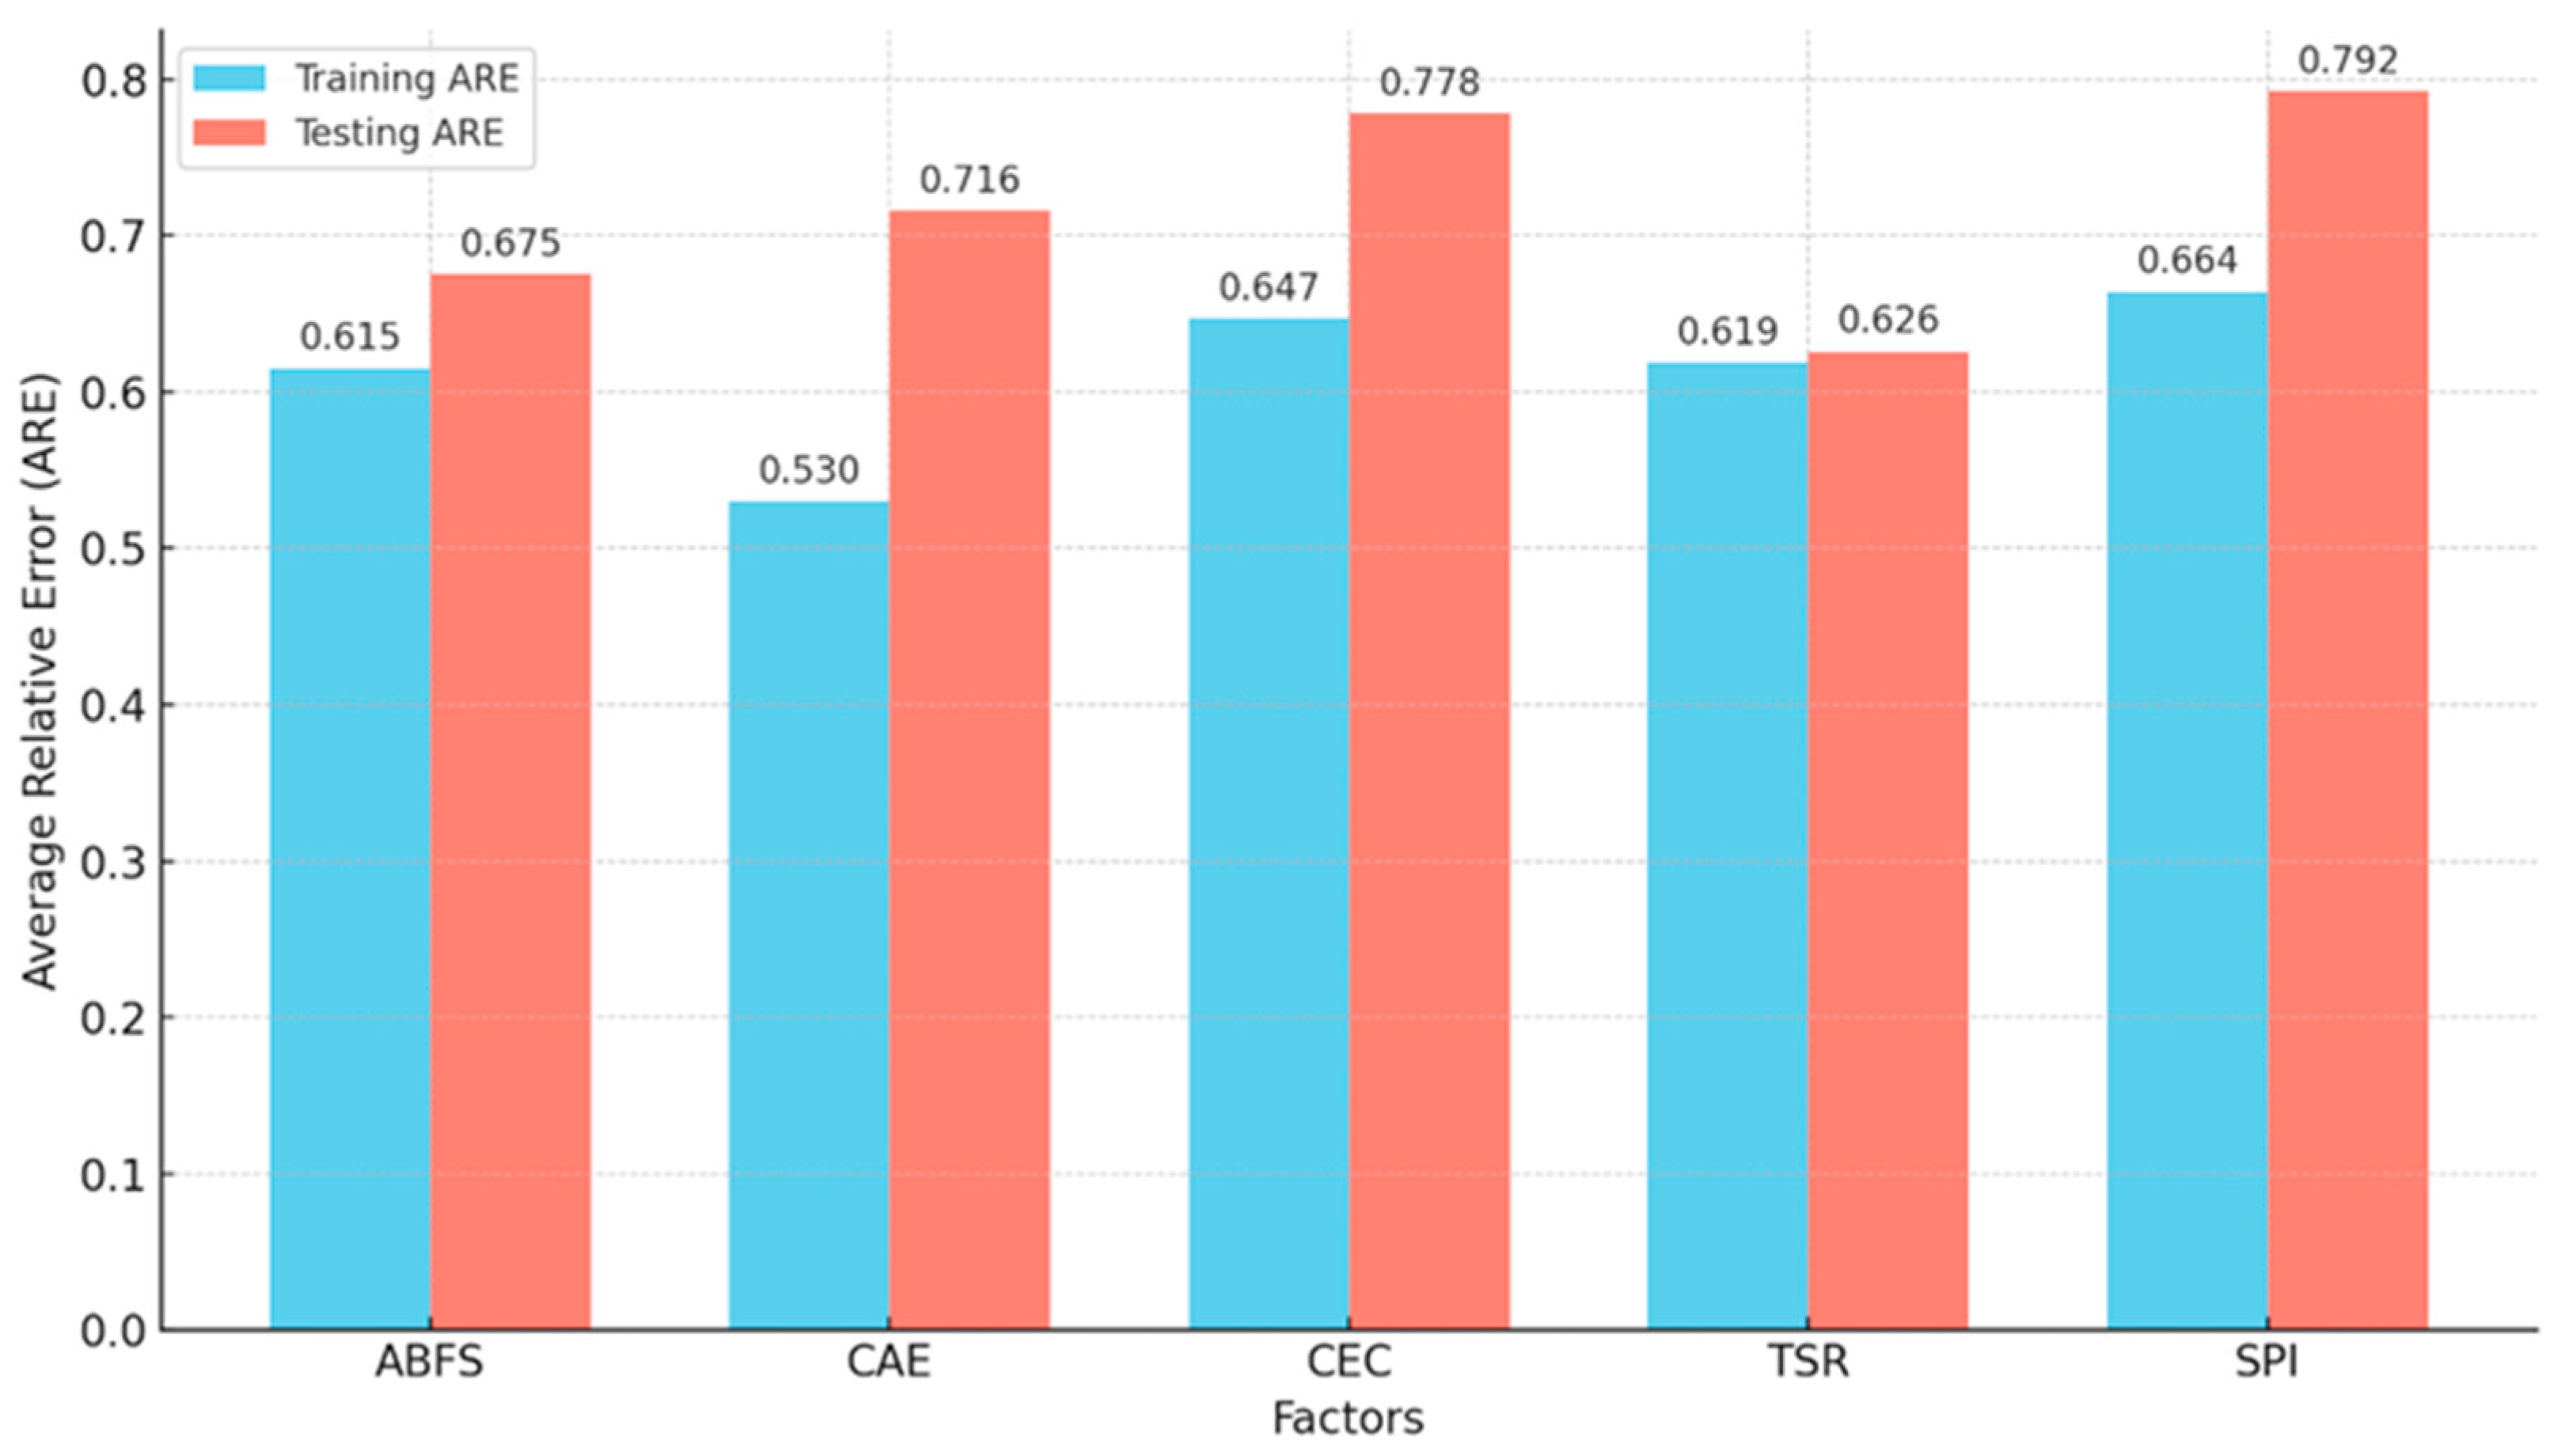
The RBF model shows a moderate fit to the data, effectively capturing relationships for some dependent variables but struggling with others. During training, the model recorded a Sum of Squares Error (SSE) of 250.599 and an Average Relative Error (ARE) of 0.615, reflecting a reasonable ability to identify patterns within the data. Performance varied per variable, with CAE showing the best fit (ARE: 0.530), moderate accuracy for ABFS, TSR, and CEC (AREs: 0.615, 0.619, and 0.647, respectively), and the weakest fit for SPI (ARE: 0.664) in
Figure 2.
In the testing phase, the SSE increased to 97.691 and the ARE to 0.714, reflecting challenges in generalizing to unseen data. TSR achieved the lowest testing error (ARE: 0.626), followed by ABFS and CAE (AREs: 0.675 and 0.716, respectively), while CEC and SPI had the highest errors (AREs: 0.778 and 0.792) (
Figure 3). This discrepancy between the training and testing errors suggests potential overfitting, where the model aligns too closely with training data but struggles with generalization. SPI’s consistently high errors indicate inherent complexity or insufficient feature representation. However, high errors in the variables under CEC and SPI may stem from the subjective and context-dependent nature of these constructs. The respondents may have interpreted terms like “engagement”, “collaboration”, or “policy integration” differently based on personal experience, leading to inconsistent responses. Additionally, these variables often involve multi-stakeholder perspectives and long-term impacts, making them harder to quantify. Limited awareness of policy frameworks or ongoing sustainability initiatives could also affect response accuracy. Ambiguity in survey items, cultural bias, or lack of prior exposure to community projects may further contribute to variance and higher error rates.
Overall, the model captures localized patterns well, indicating RBF’s capability to handle non-linear data. Nevertheless, high testing errors and variability across variables highlight the need for feature refinement, hyperparameter tuning, and larger datasets to improve robustness and enhance the model’s overall applicability.
The study’s findings are exemplified by tangible project outcomes led by YouthMappers chapters. In Batticaloa District, flood risk maps generated using OSM building data enabled local authorities to prioritize infrastructure planning in high-risk zones, thereby contributing to the development of more resilient communities (
Figure 4). These maps, funded by the booster grant, were developed using OSM tools and widely disseminated through local government channels.
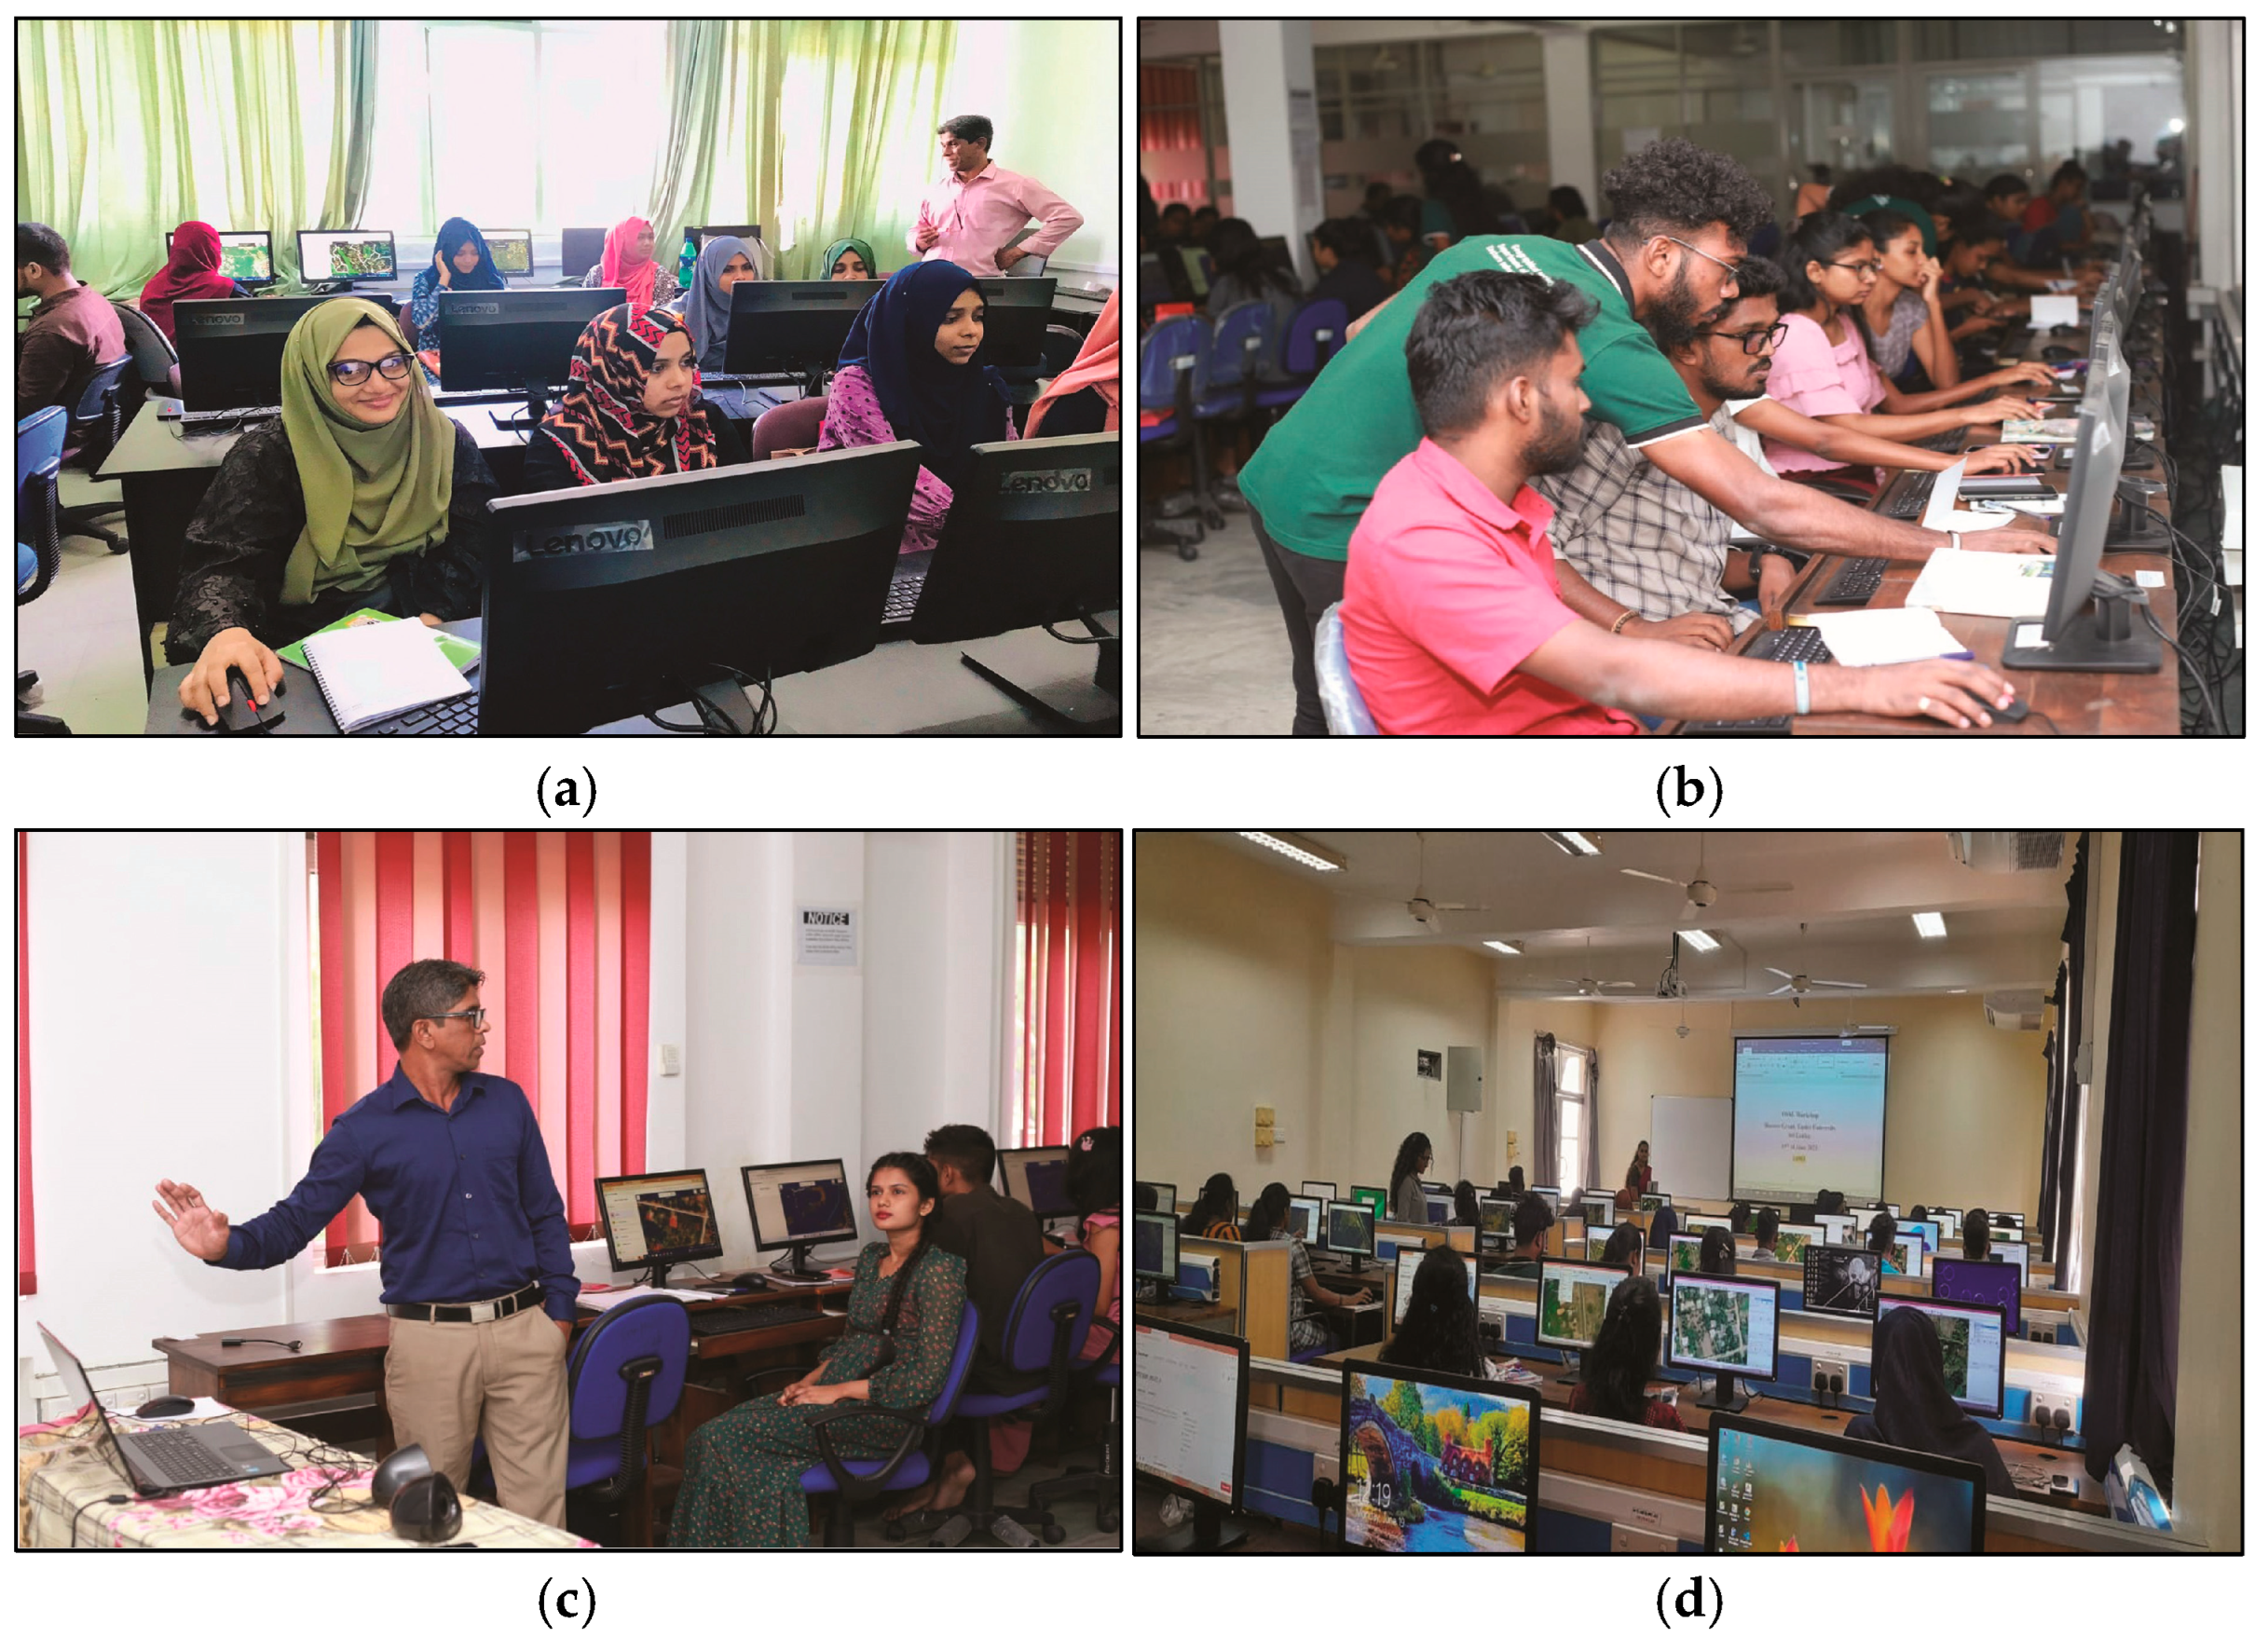
Similarly, the development of climate-focused teaching schemes integrated into University YouthMappers Chapters in Sri Lanka helped embed geospatial technology into climate education at the grassroot level. These schemes, informed by the mapping outputs, included hands-on sessions where students learned to interpret spatial data related to local environmental threats (
Figure 5).
Furthermore, the establishment of community-based open-source mapping training workshops improved technical mapping skills among youth, particularly in underrepresented rural regions. This real-world creation of digital applications for mapping not only validated the technical capacity built through the program but also reinforced the importance of sustained funding and local partnerships in achieving lasting climate resilience.
Finally, through the within-factor correlation analysis (ABFS, CAE, CEC, TSR, SPI), we examined how each set of variables—ABFS1 to ABFS5, CAE1 to CAE5, etc.—relate to one another and across the other groups. This helps identify whether the variables are positively or negatively associated with one another and whether any factors are correlated.
Hence, the following strong positive correlations were found: SPI and TSR (r = 0.70): technical skill development is strongly associated with policy integration; CAE and SPI (r = 0.67): Climate Activism and Education significantly align with sustainability and policy goals; and CEC and TSR (r = 0.66): community engagement is closely linked to technical skill development. On the other hand, moderate positive correlations were found between most other pairs (0.54 to 0.63), suggesting all factors work somewhat together, possibly due to the shared booster grant influence (
Table 1).
4. Discussion
This study offers valuable insights into the booster grant program’s effectiveness across five key factors: CBFS, CAE, CEC, TSR, and SPI. Significant differences were found in participant responses within each category using the Friedman test, providing a deeper understanding of opinions.
In CBFS, the most positively viewed statement was CBFS(3), which highlights the booster grant’s role in accessing vital open mapping equipment. This reflects the grant’s importance in enhancing operational efficiency and resource availability. In contrast, CBFS(4), which pertains to advanced mapping technology training, received the lowest ratings, indicating possible issues with training delivery or access. This emphasizes the need for strong equipment support alongside improved technical training to optimize the grant’s impact.
For CAE, the most favorably viewed statement was CAE(5), which incorporates climate education into mapping efforts, illustrating the chapters’ success in merging educational goals with operational practices. However, CAE(2), regarding public education on climate risks via maps, had the lowest agreement, signaling a need for better outreach. This divergence suggests the well-executed integration of education into operations but highlights challenges in broader community communication.
For CEC, the highest-rated statements, CEC(3) and CEC(4), emphasized the effectiveness of engaging local residents and the utility of maps in community decision-making, respectively. These findings reflect strong collaboration and the impactful applications of mapping projects. However, CEC(5), which points to increased community participation, received the lowest ratings, signaling a potential area for further improvement in fostering active community involvement. These results suggest that while mapping workshops and decision-making applications are impactful, there is room to expand participation.
In the TSR category, TSR(4), highlighting confidence in using mapping tools for climate challenges, was the most highly rated. This reflects the grant’s success in enhancing technical competence. In contrast, TSR(3), addressing the adequacy of resources to sustain future projects, had the weakest support. These findings emphasize the need for continued investment in capacity-building initiatives to ensure long-term project viability.
Finally, the SPI results revealed SPI(3), concerning challenges in sustaining projects without continuous funding, as a critical issue, alongside SPI(1), which noted the use of data in policy integration. While these strengths highlight the value of project outcomes, SPI(4), which focused on securing additional funding or partnerships, was the weakest-rated statement. This highlights an urgent need to enhance funding continuity and partnership-building efforts.
These findings offer valuable insights for shaping policies and guiding global YouthMappers chapters. The strong correlation between TSR and SPI underscores the importance of investing in digital mapping capabilities to influence climate-related decision-making. Similarly, the alignment between CEC and CAE highlights the need for grassroots involvement to amplify awareness and action. These insights suggest that booster grants and similar funding mechanisms should prioritize capacity building, technical training, and collaborative initiatives. For global YouthMappers chapters, these results emphasize scalable strategies that combine education, technology, and community engagement to enhance climate resilience and impact.
The RBF model provided additional insights. The model demonstrated moderate predictive accuracy, excelling in variables like CAE and TSR but struggling with SPI. Training errors were relatively lower, suggesting the model’s ability to capture non-linear patterns in the data. However, elevated testing errors indicated overfitting and challenges in generalizing to unseen data. The variability across dependent variables, particularly SPI, further underscores the complexity of sustainability-related measures.
However, challenges such as high internet costs and language barriers can significantly hinder participation in mapping initiatives. To mitigate these, offline mapping tools and data collection apps should be promoted, allowing contributors to work without constant internet access (
OSM Wiki, 2023). Partnerships with local telecom providers could also offer subsidized data packages for mapping projects. Addressing language barriers requires translating training materials and platforms into local languages and encouraging peer-to-peer learning through local chapters. Additionally, developing visual-based training modules can enhance inclusivity. These measures could empower more diverse contributors, ensuring equitable access and broader participation in YouthMappers programs nationally.
These results pinpoint strengths and areas needing improvement, highlighting that the booster grant successfully supports technical and educational aims but reveals ongoing gaps in training, community engagement, and sustainability. It is recommended to implement strategic measures like enhanced outreach, resource allocation, and capacity-building initiatives to ensure long-term success and impact.
5. Conclusions
This study assessed the booster grant program’s impact across five essential factors/dimensions: CBFS, CAE, CEC, TSR, and SPI. The results showed significant variability among factors in each category, reflecting strengths in technical competence (TSR) and educational integration (CAE). Nonetheless, challenges arose regarding sustaining future efforts without external funding (SPI) and engaging a broader community (CEC).
The RBF model further examined relationships among variables, demonstrating moderate predictive accuracy but difficulties in generalization, particularly concerning sustainability measures. These findings confirm the booster grant’s vital role in advancing mapping projects and highlight areas requiring focused improvements. Enhancing training, increasing community participation, and improving long-term funding strategies are crucial for maximizing the program’s effectiveness and sustainability.
This study demonstrates that the booster grant project has significantly enhanced the capacity, visibility, and impact of YouthMappers chapters in Sri Lanka. By fostering technical proficiency, promoting climate education, and supporting open mapping initiatives, this grant has empowered youth to actively contribute to climate resilience and sustainable development. Statistical and predictive analyses, including the Friedman test and RBF model, confirmed notable strengths in educational integration and technical skills while revealing challenges in sustainability and broader community engagement. These findings highlight the critical need for sustained funding, localized outreach, and inclusive training strategies. Moreover, the integration of OSM into university curricula has amplified geospatial literacy and student participation, enhanced technical mapping skills, and promoted civic engagement among students, making it a model that should be replicated in similar contexts. The booster grant model presents a scalable, data-driven framework that can be adapted across other vulnerable regions nationally, reinforcing the importance of empowering youth with open-source tools to lead locally grounded, globally relevant climate action initiatives.


 ,
, 

