Abstract
The Union of the Comoros, located in the Indian Ocean, faces persistent energy challenges due to its geographic isolation, heavy dependence on imported fossil fuels, and underdeveloped electricity infrastructure. This study investigates the techno-economic optimization of a hybrid microgrid designed to supply electricity to a rural village in Grande Comore. The proposed system integrates photovoltaic (PV) panels, wind turbines, a diesel generator, and battery storage. Detailed modeling and simulation were conducted using HOMER Energy, accompanied by a sensitivity analysis on solar irradiance, wind speed, and diesel price. The results indicate that the optimal configuration consists solely of PV and battery storage, meeting 100% of the annual electricity demand with a competitive levelized cost of energy (LCOE) of 0.563 USD/kWh and zero greenhouse gas emissions. Solar PV contributes over 99% of the total energy production, while wind and diesel components remain unused under optimal conditions. Furthermore, the system generates a substantial energy surplus of 63.7%, which could be leveraged for community applications such as water pumping, public lighting, or future system expansion. This study highlights the technical viability, economic competitiveness, and environmental sustainability of 100% solar microgrids for non-interconnected island territories. The approach provides a practical and replicable decision-support framework for decentralized energy planning in remote and vulnerable regions.
1. Introduction
The Union of the Comoros, since independence on 6 July 1975, has suffered from energy stress due to poor management of the national company of energy production and distribution. Diesel-based energy production is ruining the state’s financial portfolio and ultimately leaving it without electricity. To address this energy problem, energy production through renewable energy sources will be a major asset, given the available renewable energy sources, such as permanent sunshine, an estimated average annual wind speed of 6 m/s, and an active volcano that can be exploited for geothermal energy. In addition, since the Industrial Revolution of the 18th century, the massive exploitation of natural resources has led to a considerable increase in greenhouse gas emissions, exacerbating the effects of climate change across the world [1]. Among the particularly vulnerable regions, the Union of the Comoros, due to its island geographical position and limited energy development, faces major energy challenges [2]. The country’s energy supply depends mainly on fossil fuels—oil, gas, and coal—the importation of which weighs heavily on the national economy and the environment [3]. Global energy demand continues to grow, with an estimated 80% increase in electricity consumption between 2012 and 2040, according to the International Energy Agency (IEA) [4,5]. Faced with the progressive depletion of fossil resources and the expected increase in their price, it is becoming imperative to orient energy policies towards sustainable solutions, in order to avoid irreversible climate consequences. Over time, progress has been made in the field of photovoltaic materials and architecture by pushing the limits of performance, notably with the emergence of multijunction, perovskite, and tandem solar cells [4,5,6,7,8].
From this perspective, many researchers have proposed the integration of renewable energy sources, such as solar, wind, and hydraulic sources, to sustainably meet the growing needs [9,10]. Indeed, Mohamad Shahrizal Mohd Noor et al. [11,12,13,14] validated, through a feasibility study, the continuous power supply of a telecommunications tower thanks to a hybrid solar photovoltaic (PV) and diesel generator system, optimized using HOMER Energy software (HOMER Pro v3.14.2) [11,12,13,14]. The LEOPARD project achieved a 65% reduction in diesel use with a levelized cost of electricity (LCOE) of EUR 0.47/kWh through the optimization of a solar microgrid in Benin, offering a replicable approach for rural areas in Africa [15]. Olatomiwa et al. [16,17,18,19] also highlighted the importance of energy management strategies in hybrid microgrids, both autonomous and connected.
In Comoros, various research studies conducted by Kassim et al. [17,18,19], as well as Fahad et al. [17,18,20,21,22,23], focused on the optimization of hybrid PV/diesel and PV/wind/diesel systems for the electrification of isolated rural areas, showing that hybrid solutions dominated by solar are economically advantageous and more environmentally friendly.
However, despite a strong solar potential estimated at around 6 kWh/m2/day [17,18,19], the exploitation of renewable energies remains marginal, hampered by institutional, economic, and technical obstacles [18,24,25]. Currently, the energy mix remains dominated by biomass and petroleum products, accentuating the country’s energy dependence and climate vulnerability [17,18,19]. To address this, the Comorian government has committed to increasing the share of renewable energies to 50% by 2030, relying mainly on solar, wind, and geothermal energy [4,5,8,17,26].
Recently, the impact of powder-blasted surface modification on the performance of non-imaging solar concentrators and the evaluation of a ray-tracing simulation approach to virtual solar power measurements was analyzed by Nikolaos and Gudrun [27]. Their results show that surface roughening significantly improves light redirection toward the concentrator’s edge, enhancing solar cell performance.
In this context, this study proposes to simulate and optimize a hybrid system combining photovoltaic panels, a wind turbine, a diesel generator, and a storage battery for the electrification of a family house in a rural village located in the commune of Sada Djoulamlima, north of Ngazidja. Through an approach using HOMER Energy software, we aim to evaluate the technical and economic performance of the microgrid. Although the system is initially designed in hybrid form, the results obtained highlight the predominance of solar energy, ensuring more than 99% of the annual energy coverage. This work thus proposes a simple, flexible, and reproducible method for the sizing of microgrids in island environments, promoting energy autonomy while minimizing the environmental impact.
A review of recent literature shows that while many hybrid microgrid studies (e.g., PV–diesel or PV–wind–diesel configurations) address techno-economic aspects, they often lack advanced mathematical modeling, comprehensive sensitivity analysis, or surplus energy evaluation. Table 1 provides an updated comparison, including recent publications, alongside our 100% PV + battery configuration [28,29].

Table 1.
Comparative summary of hybrid microgrid studies.
As demonstrated in Table 1, our 100% PV + battery configuration uniquely combines a competitive LCOE (~0.563 USD/kWh) with fully renewable supply, mathematically validated sizing, multiparameter sensitivity analysis, and surplus energy quantification, within a real island setting. In contrast, earlier studies generally employ hybrid combinations with diesel and/or wind, often lacking one or more analytical dimensions and rarely applied to island scenarios. This multidimensional integration underscores both the scientific novelty and the practical relevance of our work.
This study stands out by simultaneously integrating a detailed mathematical modeling of energy subsystems, a comprehensive economic analysis using the HOMER software (HOMER Pro v3.14.2), and a sensitivity analysis specifically applied to the insular context of the Comoros. While several studies have addressed hybrid PV–wind–diesel systems in isolated areas, few have combined these three dimensions within a real insular framework. This approach helps fill a gap in the existing literature by providing a decision-making tool for local energy planning, taking into account the performance, economic constraints, and technical feasibility of available resources.
What sets this work apart is the 100% solar with storage approach, without recourse to conventional hybrid solutions incorporating diesel or wind power. In contrast to previous studies, which propose complex or theoretical hybrid systems, this study presents a simple, realistic model that can be applied directly in non-interconnected island contexts. The novelty also lies in the in-depth analysis of the energy overproduction capacity for community use or future expansion.
2. Materials and Methods
The evaluation of renewable energy projects is generally based on the application of rigorous criteria linked to site-specific data, in order to analyze the operational behavior of all the scenarios considered [34,35,36,37,38,39,40,41,42]. In this study, we followed a structured methodological approach comprising the following steps.
Site characterization: precise geographic location and description of environmental conditions
- Modeling data collection;
- Average daily electricity demand;
- Daily solar irradiance and daylight index;
- Average wind speed;
- Daily ambient temperature;
- System architecture definition: optimal combination of different renewable and conventional technologies.
The data collected were integrated into the HOMER Energy software for the simulation phase. Different scenarios were simulated based on consumption profiles, local resource availability, and the technology combinations considered [43].
Following the simulation, several technical and economic criteria were analyzed, including payback time, component costs, net present cost (NPC), and net present value for each scenario. These results were used to select the most advantageous investment strategy.
All field data were processed using a multicriteria grid, with particular attention paid to the sizing and optimal selection of renewable components [44]. The HOMER Energy tool, developed by the National Renewable Energy Laboratory (NREL) of the U.S. Department of Energy in 1992, was used for this analysis. This software is widely recognized for its ability to perform complex techno-economic studies in the context of off-grid energy systems [45,46,47,48,49,50,51,52].
To meet the growing needs for modeling photovoltaic projects coupled with storage and other hybrid technologies, the HOMER Grid version was developed [34,35]. Thanks to its advanced features, HOMER allows simultaneous integration of technical and economic parameters, thus offering the possibility to evaluate different configurations, optimize production costs and identify the most cost-effective design based on local constraints. In addition, it facilitates the reproduction of real-life system behavior, thus contributing to better decision-making for energy project designers and developers (see Figure 1).
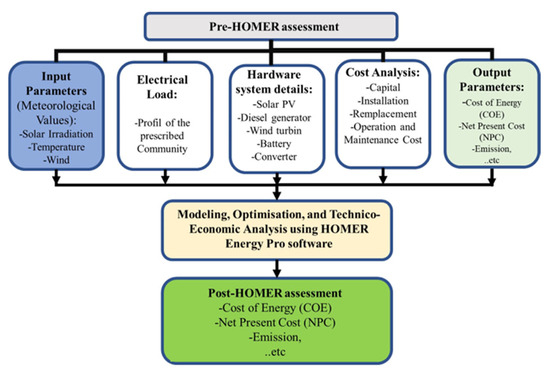
Figure 1.
Solar microgrid optimization process with HOMER Energy.
Simulated demand was validated by field surveys of households in the village of Sada Djoulamlima. These data were compared with standard profiles integrated into HOMER. Suitability was checked by means of cross-consistency tests.
2.1. Site Characterization and Load Profile
Assessing the site’s renewable energy potential and defining the electrical load profile are essential steps in designing an optimal hybrid microgrid. In this study, the chosen site is located at a latitude of 11°24′ S and a longitude of 43°20′ E, corresponding to the village of Sada Djoulamlima on the island of Ngazidja, in the Union of the Comoros. The time zone applied for the simulation is GMT+2 (East Africa Time). Interventionary studies involving animals or humans and other studies that require ethical approval must list the authority that provided approval and the corresponding ethical approval code.
2.1.1. Solar Resources
The solar resource was characterized based on the monthly average clarity index and daily global horizontal irradiation (GHI). The average annual solar irradiation reaches 6.14 kWh/m2/day, with monthly variations ranging from 5.29 kWh/m2/day in July to 6.58 kWh/m2/day in October. The average clarity index is stable at around 0.623, reflecting strong solar potential throughout the year. These conditions favor the integration of photovoltaics as the main source of production.
The solar characterization of the site is illustrated in Figure 2. The first graph (Figure 2a) shows an average global irradiation of 6.14 kWh/m2/d over the year, with an annual clarity index of 0.623. As illustrated, the irradiation varies from 5.84 kWh/m2/d in April to 7 kWh/m2/d in November, while the clarity index gradually increases from 0.54 in January to 0.66 in October, reflecting an improvement in sunshine conditions. The second curve (Figure 2b) shows a relatively low daily variability, with the majority of days recording solar radiation above 0.8 kW/m2, confirming a stable and abundant solar resource throughout the year. These characteristics make solar a strategic energy resource for supplying the microgrid.
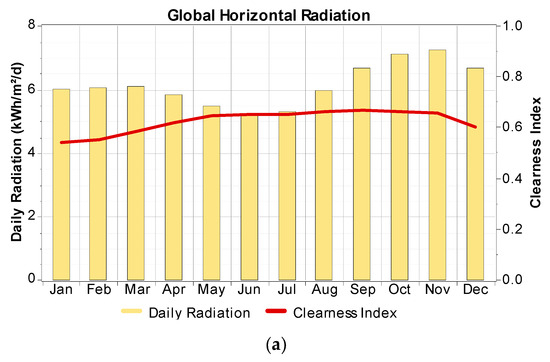
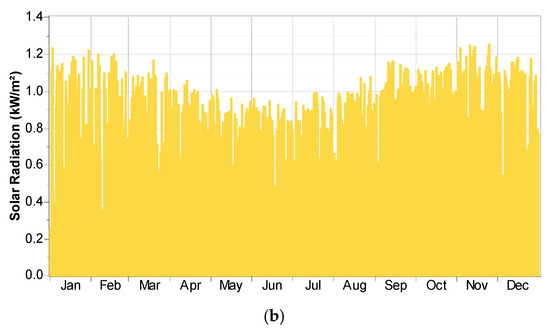
Figure 2.
Evolution of global solar irradiation and daily variability over the year: (a) monthly average daily solar irradiation; (b) daily distribution of solar radiation.
2.1.2. Wind Resource
Wind resources were also analyzed, revealing an annual average wind speed of 5.09 m/s measured at 10 m above ground level. Monthly speeds range from 3.85 m/s in March to 6.13 m/s in June. Although moderate, this wind resource can effectively complement photovoltaic generation, particularly during periods of low sunlight.
Figure 3 presents the statistical analysis of the wind resources at the study site. The top left graph (Figure 3a) shows the monthly average wind speed distribution, ranging from 3.85 m/s (March) to 6.13 m/s (June), indicating a favorable seasonality for wind generation between May and July. The top right graph (Figure 3b) illustrates the daily variation in wind speed, where a wide dispersion is observed around the annual average of 5.09 m/s, reflecting significant but exploitable variability. In the bottom left graph, the wind speed distribution histogram compared to the Weibull distribution in red (Figure 3c) confirms a normal trend with a frequency peak around 4.5 to 5 m/s, corresponding to the dominant regime of the site. Finally, the bottom right curve (Figure 3d) indicates the cumulative distribution, revealing that more than 80% of the time, wind speeds exceed 3 m/s, which is sufficient to guarantee the operation of the small wind turbines installed in the hybrid system.
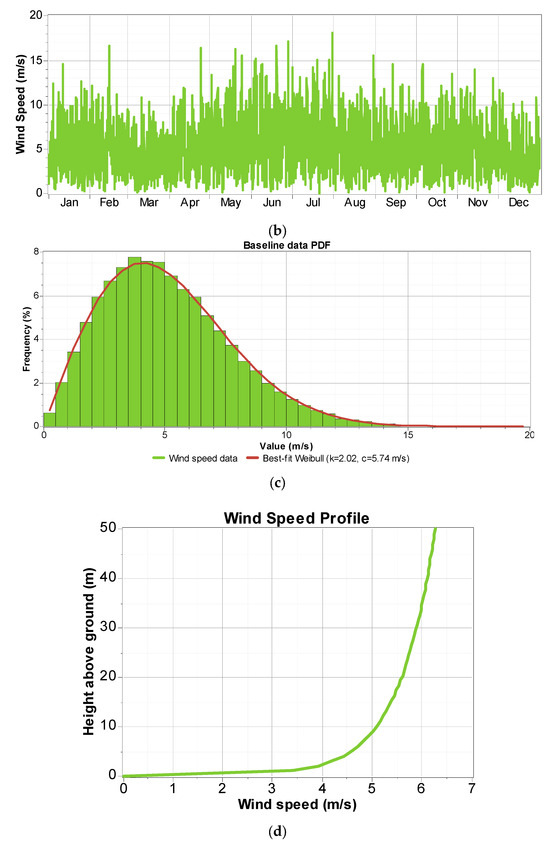
Figure 3.
Statistical analysis of wind resources: (a) monthly average wind speed distribution; (b) daily variation in wind speed; (c) statistical distribution of wind speed; (d) annual cumulative curve at the study site.
2.1.3. Ambient Temperature
Ambient temperatures were also considered, as they influence the performance of photovoltaic panels. The average annual temperature is 26.6 °C, with slight seasonal variations ranging from 24.7 °C in August to 27.9 °C in March. This warm and relatively stable climate is conducive to solar energy production, although thermal management strategies must be considered.
Analysis of the temperature data shows that the study site benefits from a stable climate throughout the year, with average temperatures ranging from 24.7 °C to 27.9 °C. The monthly temperature trend curve (Figure 4a) highlights a slight decrease in temperature during the cool season, but the amplitude remains small, characteristic of a temperate tropical climate. The distribution diagrams (Figure 4b) indicate that the majority of temperatures are concentrated around 26–28 °C, reflecting high thermal constancy. This stability is favorable for the performance of photovoltaic systems, limiting efficiency losses due to overheating and thus contributing to better energy efficiency of the solar microgrid.
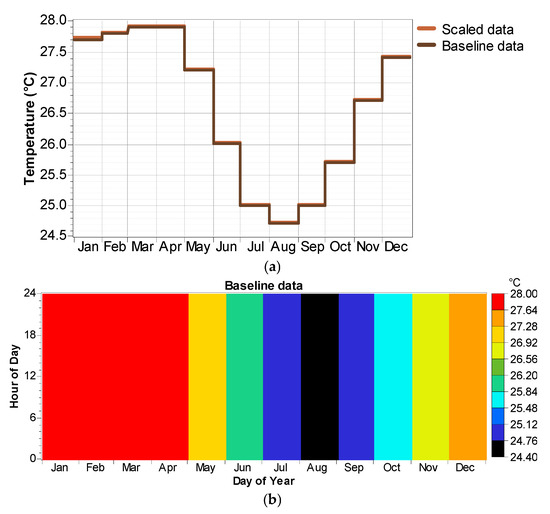
Figure 4.
Annual analysis of ambient temperature at the study site: (a) monthly variation in average temperature; (b) statistical distribution of temperature.
2.1.4. Diesel Fuel Characteristics
The diesel generator used in the hybrid architecture runs on fuel with a lower calorific value of 43.2 MJ/kg, a density of 820 kg/m3, a carbon content of 88%, and a sulfur content of 0.33%. The fuel price was set at 1 USD/L, in line with local market conditions.
2.1.5. Microgrid Architecture and Load Profile
The microgrid studied (Figure 5) consists of several production sources and storage units interconnected via a bidirectional converter. The system includes 9 kW of photovoltaic (PV) panels, a generic 1 kW wind generator, and a 2.5 kW backup diesel generator to ensure power continuity in the event of insufficient renewable production. Energy storage is provided by 24 H3000-type batteries, configured to meet daily energy needs and load variations. The assembly is coupled by a 2 kW AC/DC converter, allowing flexible management of energy flows between the alternating current (AC) and direct current (DC) networks. This microgrid was specifically sized to supply an average residential load of 12 kWh/day, with a peak power of 1.8 kW, corresponding to the typical energy needs of a rural household.
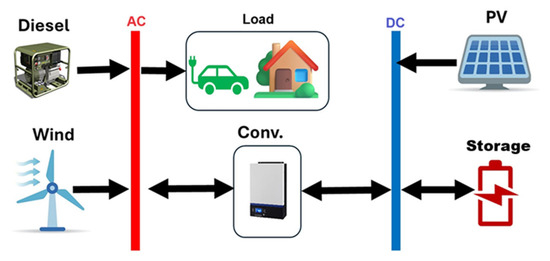
Figure 5.
Microgrid architecture.
The load profiles presented illustrate the site’s energy demand on a daily and annual scale. On a typical day, the electricity consumption (Figure 6a) is low between 0:00 and 6:00 a.m. (approximately 0.2 kW), increases gradually from 7:00 a.m. to reach an initial plateau of 0.6 to 0.8 kW between 12:00 and 15:00, before peaking at approximately 1.0 to 1.1 kW between 17:00 and 19:00, in connection with domestic activities. After 20:00, the load gradually decreases during the night. Annually, consumption (Figure 6b) remains relatively stable at around 1.0 to 1.2 kW, with occasional peaks reaching 1.7–1.8 kW, reflecting a regular energy demand, which is a favorable element for optimizing the design and management of the hybrid solar/wind/diesel microgrid.
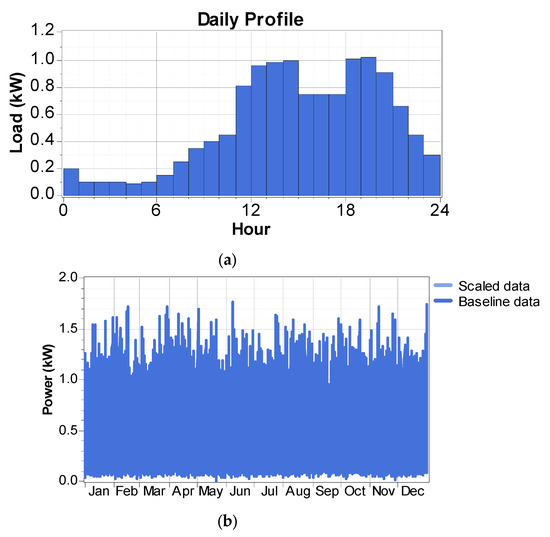
Figure 6.
Daily and annual load profiles of the studied site: (a) daily load profile of the studied; (b) annual load profile of the site studied.
The peak power of 1.8 kWp corresponds to the typical daily needs of a rural household (lighting, refrigeration, small appliances, TV, etc.). This value is validated by the recorded load profile (Figure 6) and locally collected data.
2.2. Simulation Tool and Assumptions
The modeling, optimization, and technical–economic analysis of the hybrid microgrid were performed using HOMER Energy Beta version 3.11.0 software, an advanced version developed by the U.S. Department of Energy’s National Renewable Energy Laboratory (NREL). This tool is particularly suited to the study of standalone hybrid power systems, allowing the integration of technical, economic, and climatic parameters into a comprehensive simulation.
The simulations were run on an Asus laptop equipped with an Intel Core i7 processor, thus ensuring sufficient computing power for processing multiple scenarios and performing sensitivity analysis. The hybrid model studied consists of the following elements, detailed in Table 2.
Table 2.
Components of the hybrid microgrid studied.
The microgrid is designed to supply a residential load with an average daily consumption of 12 kWh with a peak power of 1.8 kW. The main assumptions considered are shown in Table 3.
Table 3.
Main simulation assumptions.
The analysis also includes:
- An economic assessment based on the levelized cost of energy (COE), the net levelized cost (NPC), and the renewable fraction.
- A sensitivity analysis on variations in solar resources, wind speed, and fuel costs.
Although the initial configuration is a hybrid solar/wind/diesel system, the optimization results demonstrate that solar photovoltaic emerges as the predominant source, thanks to the high solar availability of the study site.
2.3. Microgrid Architecture Modeling
2.3.1. Modeling of the Diesel Generator Set and Fuel
In this study, a diesel generator (AC) is integrated to ensure electricity production in the case of insufficient renewable resources. Designed to operate between 75% and 100% of its nominal capacity, the generator can also participate in battery charging [17,18,19]. For a better performance comparison, it was included in the simulation model developed with HOMER Energy [33,40]. The physical characteristics of diesel fuel are summarized in Table 4, as follows.
Table 4.
Physical characteristics of fuel.
A very important element of this study is fuel. From the generator inputs, one can determine the fuel curve, which is described as the amount of fuel that the generator consumes to produce electricity. HOMER Pro assumes that the fuel curve is a straight line. The following equation gives the fuel consumption of the generator in units/h as a function of its electrical power [45,48,49,50,51,52,53]:
where F0 is the fuel curve intercept coefficient [units/h/kW], F1 is the fuel curve slope [units/h/kW], Ygen is the rated capacity of the generator [kW], and Pgen is the electrical output of the generator [kW]. In HOMER Energy, we define the generator’s electrical efficiency as the electrical energy coming out divided by the chemical energy of the fuel going in. The following equation gives this relationship [53]:
where Pgen is the electrical output [kW], is the mass flow rate of the fuel [kg/h], and LHV fuel is the lower heating value (a measure of energy content) of the fuel [MJ/kg]. The factor of 3.6 arises because 1 kWh = 3.6 MJ. The mass flow rate of the fuel is related to F, the generator’s fuel consumption, but the exact relationship depends on the units of the fuel. If the fuel units are kg, then and F are equal; so the equation for is as follows [53]:
If the fuel units are L, the relationship between and F involves the density. The equation for is as follows:
where ρfuel is the fuel density [kg/m3]. If the fuel units are m3, the factor of 1000 is unnecessary, and the equation for is as follows [53]:
If the fuel units are L, the efficiency equation becomes:
If we divide numerator and denominator by Ygen, the capacity of the generator, and define a new symbol pgen for the relative output of the generator (pgen = Pgen/Ygen), then the efficiency equation becomes [53]:
This equation gives the efficiency of the generator as a function of its relative output. HOMER Energy plots this relationship in the efficiency curve in the generator inputs window when the fuel units are L. If the fuel units are m3, the efficiency equation becomes [53]:
Finally, if the fuel units are kg, the efficiency equation becomes [53]:
This curve in Figure 7 shows the evolution of the efficiency of a diesel generator according to its relative output power (P/Pnom). We observe that the efficiency increases rapidly for low loads, reaching around 30% to 50% for a relative power between 0.4 and 0.8, then stabilizes around 55% to 60% at full load. This indicates that the generator operates optimally between 75% and 100% of its nominal capacity, which justifies its integration into a hybrid system coupled with storage.
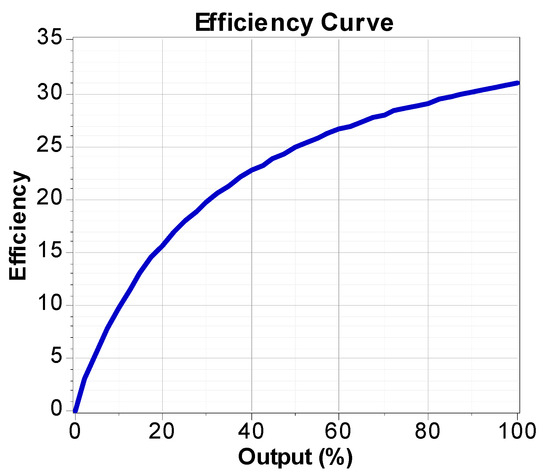
Figure 7.
Generator electrical efficiency curve as a function of relative power.
2.3.2. Photovoltaic Solar Panels Modeling
In a photovoltaic system, a cutting factor, which is a scale factor applied to the production of the PV panel and a cutting factor of 90% for the component, is added to account for losses and those attributable to fouling of the PV panel [18,54,55]. The energy production of the PV generator is determined using the following formula [56]:
where YPV is the rated capacity of the PV array, meaning its power output under standard test conditions [kW], is the PV derating factor [%], is the solar radiation incident on the PV array in the current time step [kW/m2], is the incident radiation at standard test conditions [1 kW/m2], is the temperature coefficient of power [%/°C], is the PV cell temperature in the current time step [°C], and is the PV cell temperature under standard test conditions [25 °C].
If, on the PV page, you choose not to model the effect of temperature on the PV array, HOMER assumes that the temperature coefficient of power is zero; so the equation above is simplified [56]:
The equivalent diagram of a photovoltaic cell includes a current generator that models illuminance and a diode in parallel that models the PN junction, but the real equivalent diagram considers the parasitic resistive effect due to manufacturing, it is represented on the equivalent diagram by two resistors Figure 8.
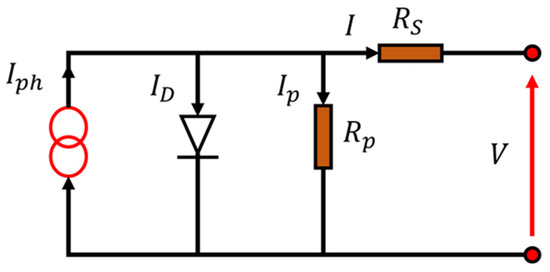
Figure 8.
Electrical diagram equivalent of a solar cell.
The current source generates a current Iph proportional to the illuminance H [w/m2]. The shunt resistor Rp characterizes the leakage current at the junction, and the resistor Rs represents the various contact and connection resistors. The current I supplied by the cell is the difference between the current Iph and the current of the diode ID [17].
where Io is the saturation current of the unlit junction, Ic the current of the cell, e is the charge of the electron (1.6 × 10⁻¹⁹ C), K is the Boltzmann constant (1.38 × 10⁻²³ J/K), Tc is the junction temperature of the photovoltaic cell, m is the ideality factor of the junction, V is the voltage across the cell, Rs is the series resistor, and Rp is the shunt resistor [54].
where VT = k×Tc/e is the thermal tension, and Eg is the bandgap energy for a given semiconductor material. It is almost constant, and I0 is therefore a function of temperature. Ideally, we can neglect Rs and I in front of V, then work with a simplified model [57]:
The influence of temperature is important and has consequences for the design of photovoltaic panels and systems. Temperature is an essential parameter since cells are exposed to solar radiation, which can heat them. In addition, part of the absorbed radiation is not converted into electrical energy [58]: it is dissipated in the form of heat; this is why the cell temperature (Tc) is always higher than the ambient temperature Ta [57].
Ta is an ambient temperature (°C), Hin is the solar irradiation on the inclined plane (w/m2), and NOCT is the operating temperature of the cell, which is defined as the temperature of the cell when the module operates under the following conditions of solar irradiation of 1000 W/m2, spectral distribution of AM1.5, ambient temperature of 25 °C, and wind speed greater than 1 m/s.
2.3.3. Modeling of Wind Production
To estimate the wind speed at the height of the wind turbine hub, two methods are used:
- Logarithm method:
- Power law method:
Figure 9 shows that the power curve of the generic 1 kW wind turbine shows a gradual increase in production from 4 m/s, reaching a maximum power of around 1 kW at 12 m/s. Beyond this speed, the power decreases slightly and then stabilizes around 0.75 kW between 18 m/s and 24 m/s, reflecting the regulation limits of the wind turbine.
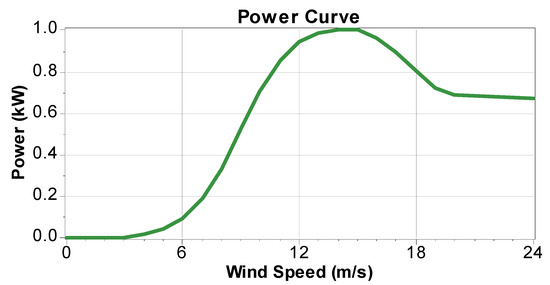
Figure 9.
Power curve of the generic 1 kW wind turbine.
2.3.4. Converter Modeling
The converter provides a bidirectional transformation of electrical energy between direct current (DC) and alternating current (AC), operating as an inverter or rectifier as needed [17]. Its nominal capacity defines the maximum power it can provide in AC mode, while the rectification capacity is expressed as a percentage of this value. In HOMER, these capacities are considered constant and without overload. The converter must also be able to synchronize with the AC network frequency, which is not the case for all models. The inversion and rectification efficiencies are fixed, and the economic aspects include the initial cost, the replacement cost, and the expected lifetime [17].
2.3.5. Modeling of Battery Storage
HOMER models a battery bank as a DC energy storage system with:
- A fixed efficiency;
- Charge/discharge rate limits;
- A maximum energy transfer capacity before replacement.
The battery bank’s lifespan (in years) is calculated by:
where Rbatt is the life of storage bank (year), Nbatt is the storage bank number of the battery, Qlifetime is the single storage lifetime throughput (kWh), Qthrpt is storage throughput annually (kWh/year), and Rbatt, f is storage float life (year). The cyclic energy expenditure through the storage bench is known as the cost of battery wear and tear of the battery. Suppose that storage characteristics show that throughput is a constraint on lifetime. In this case, the program estimates that the storage bench will need to be replaced when its total throughput equals the throughput of its lifetime. Therefore, the storage bench approaches its necessary replacement with each kWh of flow. The software uses the following calculation to calculate the cost of storage wear [37,46,59]:
where Crep,batt is the storage bank replacement cost (USD), Nbatt is the storage bank number of the battery, Qlifetime is single storage lifetime throughput (kWh), and ηrt is storage roundtrip efficiency (fractional).
To ensure the proper operation and durability of the battery bank, a battery management system (BMS) is implicitly considered within the control logic of the microgrid. The BMS is responsible for monitoring and regulating the state of charge (SOC), depth of discharge (DoD), charge/discharge cycles, and temperature of the storage units. Its function is essential to prevent overcharging, deep discharges, and thermal degradation, which are known to accelerate battery aging.
In the proposed architecture, the bidirectional converter works in synergy with the BMS to balance energy flows between generation, storage, and load. During daylight hours, excess PV energy is directed toward charging the battery, while in the evening or during cloudy conditions, the stored energy is dispatched to meet the load demand. The BMS continuously supervises battery health, optimizes charge algorithms, and ensures that all safety limits (voltage, current, temperature) are respected.
Figure 10 shows that the optimal configuration is a 100% solar system (9 kW PV, 24 batteries, 2 kW converter) with no diesel or wind, achieving a COE of 0.563 USD/kWh and zero fossil fuel use. Adding diesel or wind increases the COE (up to 1.180 USD/kWh) and reduces the renewable fraction (down to 0%), indicating poorer performance. Given the site conditions (6.14 kWh/m2/day solar, 5.09 m/s wind), full solar with storage proves to be the most cost-effective and sustainable option.
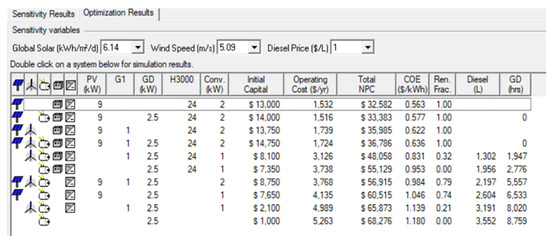
Figure 10.
Technical and economic optimization results for different PV/wind/diesel hybrid configurations.
Figure 11 illustrates the temporal dynamics of PV production with battery storage. Annual generation peaks between September and November, coinciding with maximum solar irradiance, and slightly declines from December to February. Hourly output is concentrated between 6:00 and 18:00, with midday peaks reflecting optimal sun exposure. Seasonal variations are evident, with higher and longer production in summer and reduced output in winter. Daily fluctuations are mainly due to weather conditions, confirming the cyclical and climate-dependent nature of solar energy availability.
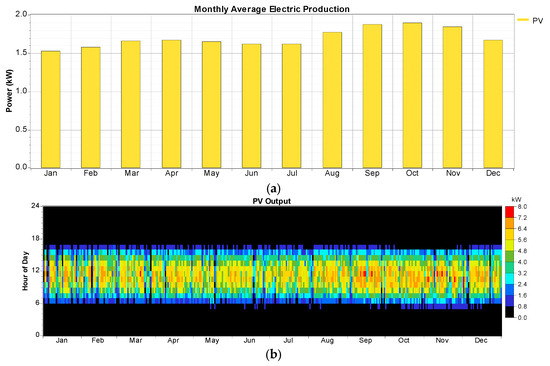
Figure 11.
Electrical production of the PV–storage system: (a) monthly average electrical production; (b) photovoltaic production.
As for the battery characteristics, the system includes 24 storages battery with a nominal voltage of 48 V DC. The total nominal capacity is 144 kWh, with a usable nominal capacity of 101 kWh, offering an autonomy of 195 h. The total energy flow reaches 244,704 kWh over a 20-year lifespan.
Figure 12, provides a comprehensive overview of battery performance. Figure 12a shows that battery capacity declines non-linearly with increasing discharge current: it remains near 3600 Ah below 400 A but drops below 1800 Ah above 1200 A due to internal losses. Figure 12b highlights that increasing the depth of discharge (DoD) from 10–20% to 70–80% reduces cycle life from ~7000 to less than 1000 cycles, though total energy throughput remains stable (~9000–10,000 kWh), indicating a trade-off between lifespan and discharge depth. Figure 12c confirms system robustness, with the state of charge (SoC) staying above 90% most of the year and reaching 100% daily, except for brief drops during some January and March mornings. This reflects the adequacy of both PV generation and battery sizing in covering energy needs with minimal risk of shortfall.
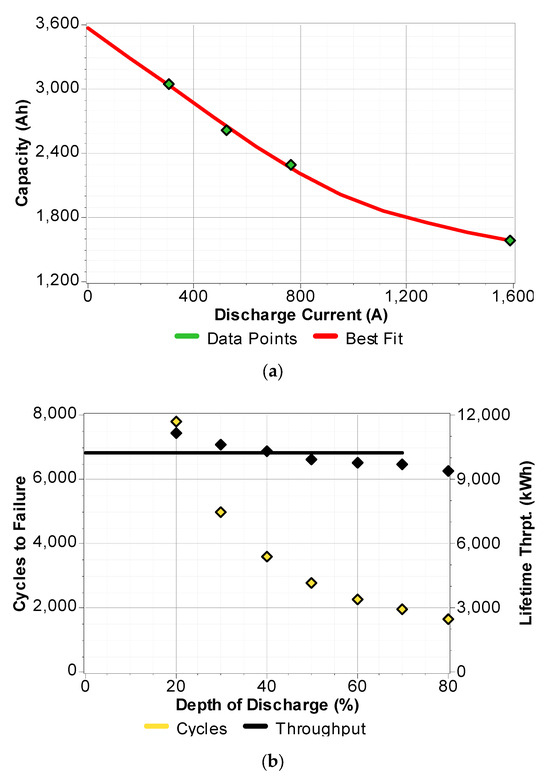
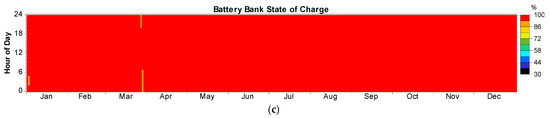
Figure 12.
State of charge of storage battery in the PV–storage microgrid. (a) Effect of discharge current on battery capacity; (b) effect of depth of discharge on battery lifetime and energy throughput; (c) battery bank state of charge.
3. Results
The study’s results are structured around two key approaches: optimization and sensitivity analysis. HOMER simulations identified a PV-only microgrid with H3000 battery storage as the most cost-effective and reliable solution, offering minimal energy cost, high reliability, and zero carbon emissions. A sensitivity analysis confirmed the robustness of this configuration under varying diesel prices (0.78–2.00 USD/L), solar irradiance (0.50–2.00 kWh/m2/day), and wind speeds (1.5–7.5 m/s), demonstrating strong resilience to local resource and market fluctuations.
3.1. Optimization Result
Figure 10 shows that the optimal configuration is a 100% solar system (9 kW PV, 24 battery, 2 kW converter) with no diesel or wind, achieving a COE of 0.563 USD/kWh and zero fossil fuel use. Adding diesel or wind increases the COE (up to 1.180 USD/kWh) and reduces the renewable fraction (down to 0%), indicating poorer performance. Given the site conditions (6.14 kWh/m2/d solar, 5.09 m/s wind), full solar with storage proves to be the most cost-effective and sustainable.
3.1.1. Energy Production
The energy produced and consumed annually for this configuration is shown in Table 5. Indeed, we see that the whole is dominated by photovoltaic PV with a total production of 14,892 kWh/year which represents 100% of the total production. Consumption is also 100% photovoltaic PV with a total energy quantity of 4526 kWh/year. Therefore, diesel and wind turbines do not intervene for this configuration.
Table 5.
Annual production and consumption (kWh/year).
The energy balance of the system is shown in Table 6. In this balance, we can note a total electricity surplus of approximately 63.7%, which is equivalent to an annual energy of 9490 kWh/year. This shows that there will be no electricity shortage. The investment capital is USD 32,582 with an energy cost of 0.563 USD/kWh. The annual operational cost due to maintenance operations for the operation of the system is 1532 USD/year.
Table 6.
Energy balance of the system.
Table 7, which shows the technical performance of the PV system, presents a nominal power of 9 kW with an average power produced of 1.7 kW. The average daily energy is 40.8 kWh/d. The annual operating hours are 4406 h/year with a levelized energy cost of 0.0491 USD/kWh.
Table 7.
Technical performance of the PV system.
Figure 11 illustrates the temporal dynamics of PV production with battery storage. Annual generation peaks between September and November, coinciding with maximum solar irradiance, and slightly declines from December to February. Hourly output is concentrated between 6:00 and 18:00, with midday peaks reflecting optimal sun exposure. Seasonal variations are evident, with higher and longer production in summer and reduced output in winter. Daily fluctuations are mainly due to weather conditions, confirming the cyclical and climate-dependent nature of solar energy availability.
As for the battery characteristics, there are 24 batteries with a nominal voltage of 48 V DC bus. The total nominal capacity is 144 kWh with a useful nominal capacity of 101 kWh for an autonomy of 195 h. The total energy flow is 244,704 kWh for a lifespan of 20 years.
The state of charge of the storage battery in the microgrid is shown in Figure 12 and Table 8. Comparing the annual energy entering the battery, which is 2705 kWh/year, and the outgoing energy, which is 2333 kWh/year, we note a good efficiency of the battery, which is of the order of 0.86 or 86%. The energy losses are not significant, which reassures the efficiency of the battery.
Table 8.
Energy use and efficiency.
Figure 12 provides a comprehensive overview of battery performance. Figure 12a shows that battery capacity declines non-linearly with increasing discharge current: it remains near 3600 Ah below 400 A, but drops below 1800 Ah above 1200 A due to internal losses. Figure 12b highlights that increasing the depth of discharge (DoD) from 10–20% to 70–80% reduces cycle life from ~7000 to < 1000 cycles, though total energy throughput remains stable (~9000–10,000 kWh), indicating a trade-off between lifespan and discharge depth. Figure 12c confirms system robustness, with the state of charge (SoC) staying above 90% most of the year and reaching 100% daily, except for brief drops during some January and March mornings. This reflects the adequacy of both PV generation and battery sizing in covering energy needs with minimal risk of shortfall.
The technical performance of the converter is shown in Table 9 above in terms of inverter and rectifier power. These values demonstrate its proper operation. As for the annual energy usage of the converter, the number of operating hours for the inverter is 8759 h/year. The annual incoming energy is 5029 kWh/year, and the outgoing energy is 4526 kWh/year, which corresponds to an optimal efficiency of 0.89 or 89%.
Table 9.
Technical performance of the converter.
Figure 13a shows the inverter’s hourly output over the year, with power ranging from 0 kW (black) to 1.8 kW (red). Output is concentrated between 6:00 and 18:00, peaking at midday in line with solar irradiance. Seasonal variations are clear: higher and more stable output occurs from May to August, while lower values appear in December–January, reflecting solar resource variability. Figure 13b reveals no rectifier activity throughout the year (uniform 0 kW), indicating that the system operated exclusively on PV and battery discharge, without any grid input or AC-to-DC conversion. This confirms the inverter’s effectiveness and the autonomy of the solar–storage configuration.
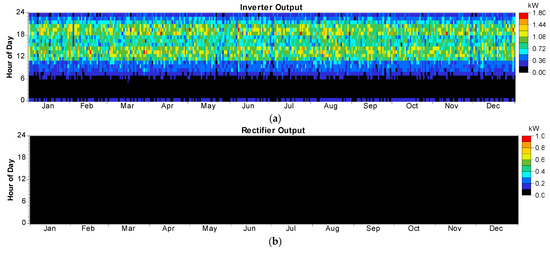
Figure 13.
Converter production of the PV–storage system: (a) inverter output over the year; (b) rectifier output over the year.
Figure 14 analyzes system behavior over two representative two-week periods in January and August. In January (14-a), the PV output peaks daily between 6 and 7 kW from 10:00 to 14:00, while AC load remains relatively constant between 0.5 and 1.5 kW. This mismatch results in excess electricity reaching up to 5.5 kW, with approximately 15 kWh of surplus observed on January 8. Battery state of charge (SOC) fluctuates between 92% and 100%, with daily full recharge but limited overnight discharge, indicating potential overdimensioning or underutilization of storage capacity.
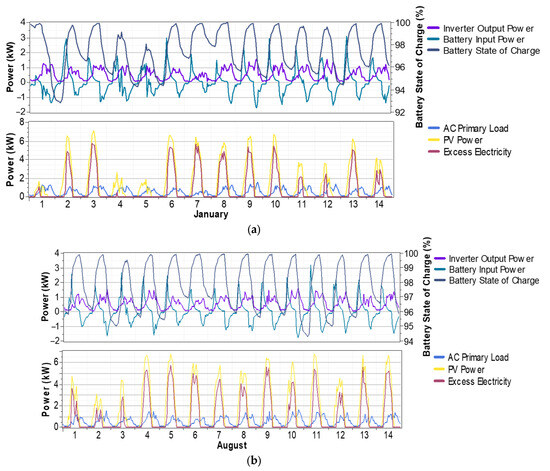
Figure 14.
Daily energy profiles over two weeks in January and August: (a) daily energy profile over two weeks in January; (b) daily energy profile over two weeks in August.
In August (14-b), the PV generation consistently reaches 6.5–6.8 kW around midday, with similar AC load profiles. Excess electricity frequently exceeds 5 kW, peaking at 18–20 kWh/day (e.g., August 8). SOC remains within 94–100%, with shallow discharge cycles. Inverter output ranges from 0.8 to 1.6 kW, aligned with load variations. Despite excellent solar availability and stable operation, the limited battery cycling and consistent surplus suggest overcapacity in storage or a lack of flexible demand integration.
These results confirm the system’s reliability and high solar productivity but underline the need to enhance energy valorization, either by resizing the battery or integrating additional loads to improve self-consumption and reduce energy waste.
Figure 15 presents a set of scatter plots analyzing the impact of solar irradiance on system performance. In Figure 15a, excess electricity shows a strong positive correlation with irradiance: virtually zero below 0.2 kW/m2, it increases beyond 0.3 kW/m2, reaching ~2–3 kW at 0.5 kW/m2, and exceeding 5 kW at 0.8 kW/m2, with a peak around 6.5 kW. A saturation effect appears beyond 0.95 kW/m2, indicating limitations in storage or inverter capacity, and pointing to the need for demand-side flexibility or larger storage systems.
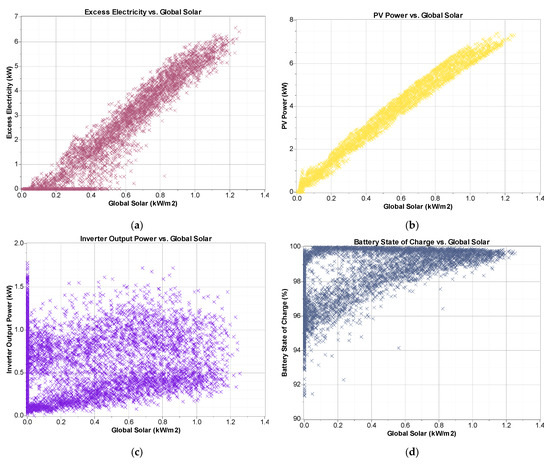
Figure 15.
Performance analysis of a PV–battery hybrid system based on the impact of solar irradiance on energy flows and system saturation: (a) excess electricity vs. global solar; (b) PV power vs. global solar; (c) inverter output vs. global solar; (d) SOC vs. global solar.
Figure 15b confirms the system’s efficiency, with a tight linear relationship between irradiance and PV output. Power rises proportionally from <0.5 kW at low irradiance to 6.5–7 kW at 1.0 kW/m2 without signs of saturation, showing that the PV array operates close to its nominal performance across the full irradiance range.
In Figure 15c, inverter output follows irradiance with partial correlation. While output increases with irradiance, dispersion becomes significant beyond 0.6 kW/m2. At ~0.8 kW/m2, output varies between 0 and 3 kW, reflecting constraints such as battery saturation, limited load demand, or inverter capacity. A ceiling effect is observed at ~2.5–3 kW, suggesting the inverter operates at its limit during peak solar hours.
Figure 15d illustrates the battery state of charge (SOC) as a function of irradiance. Below 0.2 kW/m2, SOC ranges between 90 and 98%; above 0.4 kW/m2, it clusters near 100%, indicating frequent full charge during high irradiance periods. This saturation suggests underutilized storage and insufficient energy sinks, reinforcing the need to resize storage or integrate flexible loads to avoid overcharge and better harness solar potential.
No load interruptions or load shedding were observed during the simulations. The storage capacity of 101 kWh guarantees an autonomy of more than 8 days at constant load. Furthermore, Figure 12c shows that the state of charge remains >90% for most of the year.
3.1.2. Economic Analysis
Figure 16 shows a comparative curve illustrating the simulation results of the different energy configurations. It is clearly observed that the “PV + Battery” system offers both the lowest levelized cost of energy (COE) (0.563 USD/kWh) and the lowest total levelized cost (NPC) (USD 32,582), surpassing all other hybrid or diesel-based options. This is the most economically advantageous system. The diesel-only operating system represents the worst case, where costs are very high and, therefore, to be avoided because we end up with USD 70,000 for the NPC and 1.2 USD/kWh for the COE energy cost.
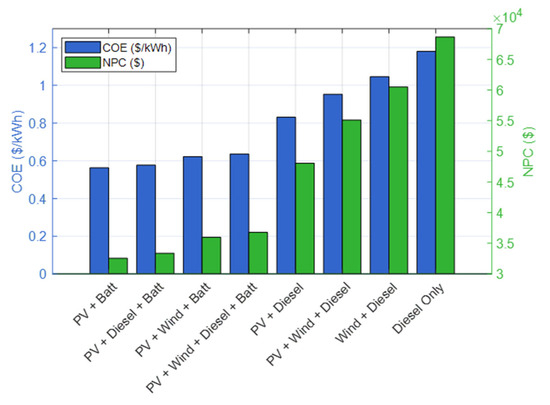
Figure 16.
Comparison of energy configurations—COE and NPC.
The overall investment cost of the project is summarized in Figure 17. Indeed, the red bar pointing downwards represents the estimated investment cost of USD 13,000. The maintenance and upkeep cost is approximately 1200 USD/year. At 20 years, almost all the equipment must be renewed and replaced, including battery, converters, and others, with an overall cost of approximately USD 12,000. At 25 years, we begin to see a return on investment; so there are profits of approximately USD 7000.
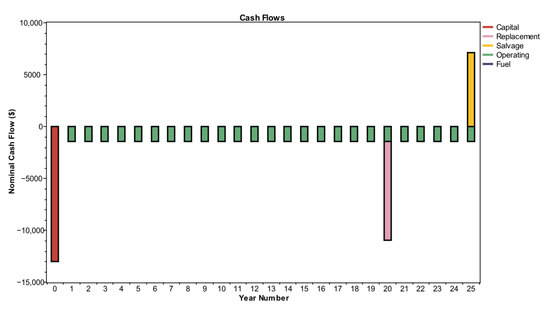
Figure 17.
Cash flow.
3.1.3. Gas Emissions
Since the analyzed energy system is entirely based on renewable resources, such as photovoltaic solar energy and battery storage, it generates no polluting emissions. Since the diesel generator is not used, no fossil fuels are burned, which completely eliminates the emissions of carbon dioxide (CO2), carbon monoxide (CO), nitrogen oxides (NOx), sulfur dioxide (SO2), fine particles, or unburned hydrocarbons. This 100% renewable configuration thus contributes to the clean operation of the microgrid, respecting the environment and perfectly suited to sustainability objectives.
3.2. Microgrid Configuration with Sentience Parameters
Figure 18a–c illustrate how wind speed and diesel price influence system configuration under varying global solar irradiance levels. At high irradiance (6.14 kWh/m2/day, Figure 18a), photovoltaic production dominates entirely across the full wind speed range (0–7.5 m/s) and diesel prices up to 2 USD/L, making PV-only systems the most favorable.
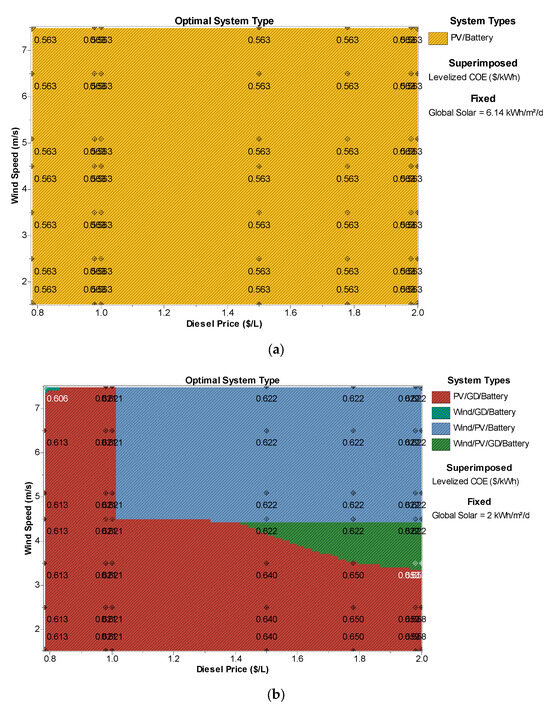
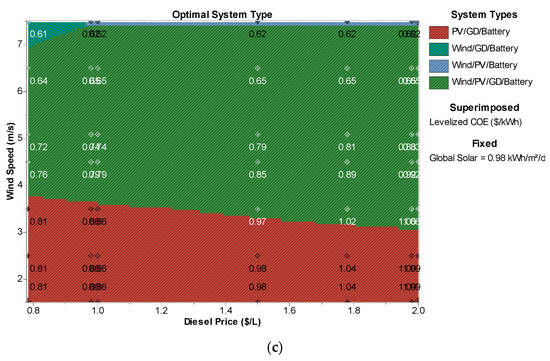
Figure 18.
Evolution of wind speed as a function of fuel price: (a) global solar = 6.14 kWh/m2/d; (b) global solar = 2 kWh/m2/d; (c) global solar = 0.98 kWh/m2/d.
When irradiance decreases to 2 kWh/m2/day (Figure 18b), hybrid configurations emerge: PV/DG/battery, Wind/DG/battery, wind/PV/battery, and wind/PV/DG/battery. For diesel prices > 1 USD/L and wind speeds > 4.5 m/s, a fully renewable wind/PV/battery setup becomes optimal. Mixed architectures involving diesel remain marginal, suggesting partial relevance in resource-limited conditions.
Under very low irradiance (0.98 kWh/m2/day, Figure 18c), four configurations coexist, with a predominance of wind/PV/DG/battery and PV/DG/battery. In all cases of low solar availability, diesel becomes necessary to ensure supply, often complemented by wind, highlighting its compensatory role under weak solar conditions.
Figure 19a–c show the impact of diesel price (0–2 USD/L) on system configuration across different solar irradiance levels, under fixed wind speeds.
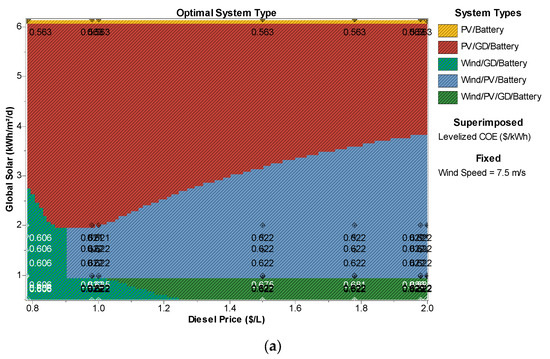
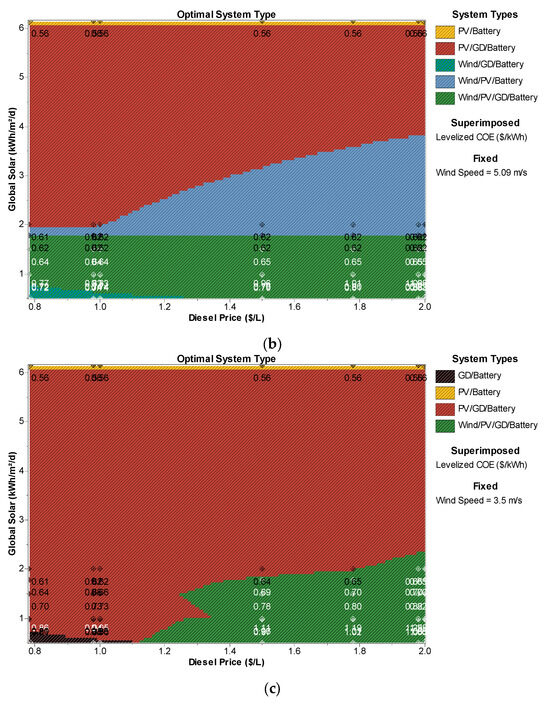
Figure 19.
Evolution of global solar as a function of fuel price: (a) wind speed = 7.5 m/s; (b) wind speed = 5.09 m/s; (c) wind speed = 3.5 m/s.
At 7.5 m/s wind speed (Figure 19a), five configurations emerge: PV/battery, PV/DG/battery, wind/DG/battery, wind/PV/battery, and wind/PV/DG/battery. For irradiance above 6 kWh/m2/day, PV/battery dominates. Between 2 and 6 kWh/m2/day, PV/DG/battery prevails, especially at higher diesel prices, while lower diesel costs favor 100% renewable setups (wind/PV/battery).
At 5.09 m/s (Figure 19b), wind contribution weakens, leading to a dominance of PV/DG/battery across most irradiance levels. Only when solar input is low do full hybrid systems (wind/PV/DG/battery) appear to balance the deficit.
With very low wind (3.5 m/s, Figure 19c), PV/DG/battery becomes the prevailing configuration regardless of solar irradiation or diesel price. In such conditions, solar remains essential, while diesel compensates for the lack of wind input.
In Figure 20a, we note the evolution of solar irradiation as a function of wind speed, and this is for a diesel price fixed at 2 USD/L. The architecture that appears in the four combinations of the system includes photovoltaic panels because the sunshine is favorable in this case. When the wind speed exceeds 4.5 m/s, which is the minimum reference speed for wind turbine production, the system is dominated by an energy mix in renewable energy with energy storage in battery, PV/wind/battery, and this is for a value of solar irradiation that exceeds 6 kWh/m2/d. When the price of diesel is down by 1 USD/L (Figure 20b), the PV/GD/battery combination is favorable to the system regardless of the daily solar irradiation. The combination including PV/GD/battery is favorable to the system with any diesel price. The presence of a PV and wind system in the architecture accompanies the diesel thermal power plant in order to reduce the energy bill at home for citizens for an acceptable energy price.
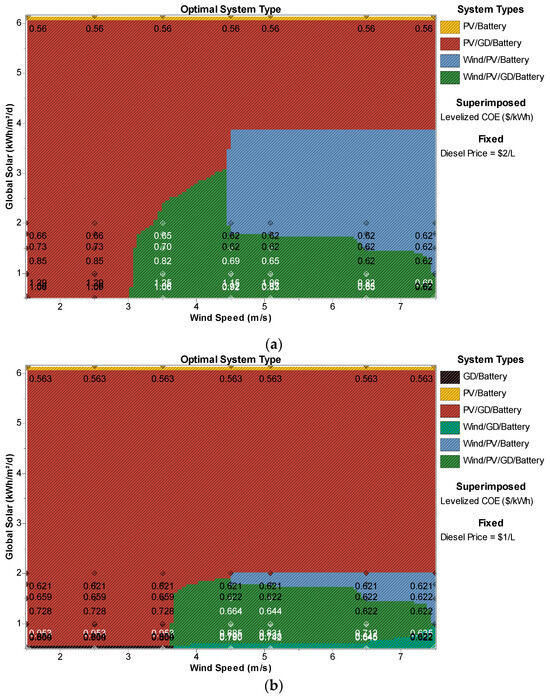
Figure 20.
Evolution of global solar as a function of wind speed: (a) diesel price = 2 USD/L; (b) diesel price = 1 USD/L.
4. Discussion
The simulation results confirm that the optimal configuration for the studied site is a fully renewable microgrid based exclusively on photovoltaic (PV) generation and battery storage. This system ensures complete energy autonomy, with a competitive levelized cost of electricity (LCOE) of 0.563 USD/kWh and eliminates greenhouse gas emissions. Its effectiveness stems from favorable local conditions: high solar irradiance (6.14 kWh/m2/day average), stable ambient temperature (26.6 °C annually), and a regular residential load profile. These factors enable strong alignment between production and consumption, minimizing the need for backup systems.
Alternative configurations integrating a 1 kW wind turbine or a 2.5 kW diesel generator were tested but proved less efficient. They increased energy costs (up to 1.180 USD/kWh), reduced the renewable fraction, and introduced pollutant emissions. Their marginal contribution under typical site conditions makes them economically and environmentally counterproductive.
The solar–storage system also generated a 63.7% annual energy surplus, far exceeding the site’s needs. This surplus of nearly 9500 kWh/year represents a valuable opportunity for local development, such as powering community infrastructure (schools, pumps, health centers), supporting small-scale industries (refrigeration, agro-processing), or even producing hydrogen or feeding secondary storage. In the long term, the system’s scalability opens possibilities for microgrid interconnection or regional energy trading, should infrastructure or policy evolve. To assess system robustness, a detailed sensitivity analysis was performed on three critical parameters, as summarized in Table 10.
Table 10.
Parameters considered in the sensitivity analysis.
Across all scenarios, the PV + battery system remained the most cost-effective and reliable. Only in extreme cases of very low irradiance did hybrid systems with wind or diesel provide short-term support. However, these alternatives remained suboptimal in terms of cost and emissions. This confirms the resilience and adaptability of the PV–storage configuration, which is critical for island environments subject to climatic and market volatility.
The storage system, composed of 24 H3000 batteries (101 kWh usable capacity), was dimensioned to minimize deep discharges and extend lifespan. With a roundtrip efficiency of 86%, daily charge cycles remained shallow, indicating good thermal and operational stability. The inverter (2 kW, 89% efficiency) ensured continuous load coverage without oversizing. A summary of the system’s key performance indicators is provided below, as shown in Table 11.
Table 11.
Summary of quantitative results from the optimized PV–storage microgrid.
This strategic energy surplus reinforces the microgrid’s flexibility and development potential. The system is not only optimized for current needs but is also scalable, supporting long-term resilience and energy sovereignty.
What sets this study apart is its multidimensional approach:
- A quantified evaluation of surplus energy and its potential applications;
- A robust sensitivity analysis of technical and economic variables;
- A contextualized discussion tailored to insular and off-grid environments.
This comprehensive methodology enhances the practical relevance of the findings and offers a concrete decision-support tool for energy planners, particularly in remote and resource-constrained regions.
Although some results may appear expected, the originality of this study lies in the combined integration of three rarely addressed aspects: a detailed sensitivity analysis (including cost variations and battery charge/discharge behavior), a quantified evaluation of surplus energy and its potential valorization, and a contextualized discussion tailored to the constraints of insular regions. This multidimensional approach enhances the practical relevance of the results and supports decision-making for decentralized energy planning in remote areas.
5. Conclusions
This study demonstrated the technical feasibility and economic viability of a fully solar-powered microgrid with battery storage, tailored to the specific needs of an isolated island context. The optimized system provides:
- Full energy autonomy based entirely on renewable resources;
- A competitive levelized cost of electricity at 0.563 USD/kWh;
- Zero emissions of greenhouse gases or other pollutants;
- A 63.7% surplus of generated electricity, representing a strategic reserve for future development or community-scale applications.
Sensitivity analyses confirmed the robustness of this PV–battery architecture across a wide range of conditions, including fluctuating solar resources, varying wind speeds, and diesel price volatility. In all scenarios, solar-based configurations consistently outperformed hybrid alternatives involving diesel or wind, both economically and environmentally.
The originality of this work lies in its integrated and context-specific methodology, which combines detailed system modeling, economic assessment, environmental impact analysis, and explicit consideration of the structural constraints of insular territories. This holistic approach provides clear, actionable recommendations for policy-makers and engineers engaged in the energy transition of isolated or underserved regions.
Unlike many theoretical studies, this work proposes a realistic, scalable, and operational energy model with immediate applicability. It contributes concrete solutions to improve energy security, support local economic development, and enhance climate resilience in small island developing states and similar off-grid environments.
Author Contributions
Conceptualization, methodology, software, validation, formal analysis, investigation, data curation, writing, original draft preparation, writing review and editing, and visualization: F.M.; Supervision, project administration, review and editing: K.M.A.; Scientific review and validation: R.D. and M.E.G. All authors have read and agreed to the published version of the manuscript.
Funding
This research did not receive any specific grant from funding agencies in the public, commercial, or not-for-profit sectors.
Data Availability Statement
The data supporting the findings of this study are available from the corresponding author upon reasonable request. Simulation files and model configurations (HOMER Energy) can also be shared for academic and non-commercial purposes.
Acknowledgments
The authors wish to express their sincere gratitude to all institutions that contributed to the realization of this work. Special thanks go to the LEMA Laboratory at the University of Comoros for local support and scientific collaboration, and to the LERMAB Laboratory at the University of Lorraine for methodological contributions and scientific input. We also extend our heartfelt thanks to F. Maoulida and K.M. Aboudou for their active collaboration, complementary expertise, and involvement throughout all stages of the study, from conceptualization to result analysis.
Conflicts of Interest
The authors declare that they have no conflicts of interest related to this work.
Nomenclature
The following abbreviations are used in this manuscript:
| Abbreviation/Acronym | Meaning | Unit |
| PV | Photovoltaic | kW, kWh |
| SOC | State of Charge (battery charge level) | % |
| COE | Cost of Energy | USD/kWh |
| NPC | Net Present Cost | USD |
| LCOE | Levelized Cost of Energy | USD/kWh |
| HOMER | Hybrid Optimization Model for Electric Renewables | — |
| HRES | Hybrid Renewable Energy System | — |
| AC | Alternating Current | kWh/year |
| DC | Direct Current | — |
| kW | Kilowatt (power) | kW |
| kWh | Kilowatt-hour (energy) | kWh |
| USD | US Dollar | $ |
| CAPEX | Capital Expenditure (initial investment) | USD |
| OPEX | Operating Expenditure (annual operating cost) | USD/year |
| RES | Renewable Energy Sources | — |
| %Ren | Renewable fraction in total electricity production | % |
References
- Ma, W.W.; Rasul, M.G.; Liu, G.; Li, M.; Tan, X.H. Climate Change Impacts on Techno-Economic Performance of Roof PV Solar System in Australia. Renew. Energy 2016, 88, 430–438. [Google Scholar] [CrossRef]
- Vidal, Y.; Acho, L.; Luo, N.; Zapateiro, M.; Pozo, F. Power Control Design for Variable-Speed Wind Turbines. Energies 2012, 5, 3033–3050. [Google Scholar] [CrossRef]
- Touili, S.; Alami Merrouni, A.; El Hassouani, Y.; Amrani, A.; Rachidi, S. Analysis of the Yield and Production Cost of Large-Scale Electrolytic Hydrogen from Different Solar Technologies and under Several Moroccan Climate Zones. Int. J. Hydrogen Energy 2020, 45, 26785–26799. [Google Scholar] [CrossRef]
- Perspectives Énergétiques mondiales 2019. World Energy Outlook–Topics. Available online: https://www.iea.org/topics/world-energy-outlook (accessed on 1 April 2022).
- Perspectives Énergétiques mondiales 2020. World Energy Outlook–Topics. Available online: https://www.iea.org/topics/world-energy-outlook (accessed on 1 April 2022).
- Norouzi, N.; Bozorgian, A.; Dehghani, M.A. Best Option of Investment in Renewable Energy: A Multicriteria Decision-Making Analysis for Iranian Energy Industry. J. Environ. Assmt. Pol. Mgmt. 2020, 22, 2250001. [Google Scholar] [CrossRef]
- Norouzi, N. The Pahlev Reliability Index: A Measurement for the Resilience of Power Generation Technologies versus Climate Change. Nucl. Eng. Technol. 2021, 53, 1658–1663. [Google Scholar] [CrossRef]
- Blanco, M.I. The Economics of Wind Energy. Renew. Sustain. Energy Rev. 2009, 13, 1372–1382. [Google Scholar] [CrossRef]
- Aguilar, M.M. Production de biobutanol à partir de lignocellulose: Un nouveau procédé thermochimique. J. Power Energy Eng. 2024, 12, 5. [Google Scholar]
- Aguilar-Jiménez, J.A.; Hernández-Callejo, L.; Alonso-Gómez, V.; Velázquez, N.; López-Zavala, R.; Acuña, A.; Mariano-Hernández, D. Techno-Economic Analysis of Hybrid PV/T Systems under Different Climate Scenarios and Energy Tariffs. Sol. Energy 2020, 212, 191–202. [Google Scholar] [CrossRef]
- Mohd Noor, M.S.; Adzis, Z.; Arief, Y.Z.; Muhamad, N.A. Feasibility Analysis of Stand-Alone Renewable Energy Supply for Telecommunication Tower Using Homer. Appl. Mech. Mater. 2016, 818, 223–227. [Google Scholar] [CrossRef]
- Gonzalez-Salazar, M.; Poganietz, W.R. Evaluating the Complementarity of Solar, Wind and Hydropower to Mitigate the Impact of El Niño Southern Oscillation in Latin America. Renew. Energy 2021, 174, 453–467. [Google Scholar] [CrossRef]
- Yao, Y.; Xu, J.-H.; Sun, D.-Q. Untangling Global Levelised Cost of Electricity Based on Multi-Factor Learning Curve for Renewable Energy: Wind, Solar, Geothermal, Hydropower and Bioenergy. J. Clean. Prod. 2021, 285, 124827. [Google Scholar] [CrossRef]
- Thirunavukkarasu, M.; Sawle, Y. A Comparative Study of the Optimal Sizing and Management of Off-Grid Solar/Wind/Diesel and Battery Energy Systems for Remote Areas. Front. Energy Res. 2021, 9, 752043. [Google Scholar] [CrossRef]
- Rachid, A.; Korkut, T.B.; Cardot, J.-S.; Kébé, C.M.F.; Ndiaye, A.; Sinsin, L.M.; Fifatin, F.X. Optimizing Solar-Integrated Microgrid Design for Sustainable Rural Electrification: Insights from the LEOPARD Project. Solar 2025, 5, 9. [Google Scholar] [CrossRef]
- Olatomiwa, L.; Mekhilef, S.; Ismail, M.S.; Moghavvemi, M. Energy Management Strategies in Hybrid Renewable Energy Systems: A Review. Renew. Sustain. Energy Rev. 2016, 62, 821–835. [Google Scholar] [CrossRef]
- Maoulida, F.; Rabah, D.; Ganaoui, M.E.; Aboudou, K.M. PV-Wind-Diesel System for Energy Supply on Remote Area Applied for Telecommunication Towers in Comoros. Open J. Energy Effic. 2021, 10, 50–72. [Google Scholar] [CrossRef]
- Fahad, M.; Kassim, M.; Djedjig, R.; Ganaoui, M. Feasibility Study for a Hybrid Power Plant (PV-Wind-Diesel-Storage) Connected to the Electricity Grid. Fluid Dyn. Mater. Process. 2022, 18, 1607–1617. [Google Scholar] [CrossRef]
- Garg, V.K.; Sharma, S. Techno-Economic Analysis of a Microgrid for a Small Community; Springer: Singapore, 2021; Available online: https://link.springer.com/chapter/10.1007/978-981-16-1048-6_40 (accessed on 22 January 2023).
- Kassim, M.; Fahad, M.; El Ganaoui, M. Pv-Wind Hybrid Energy System for Application of Building in Rural Areas in Comorspv-Wind Hybrid Energy System for Application of Building in Rural Areas in Comors. Proceedings of the International Conference on Materials and Energy (ICOME’2018), San Sebastian, Spain, 30 April–4 May 2018, 2020. [Google Scholar]
- Fahad, M.; Kassim, M.; Rakoto, J.; El Ganaoui, M. Dimensionnement d’un Système Hybride Pv/Générateur Diesel Pour l’alimentation Électrique d’un Pylône de Télécommunication Aux Comores. In Proceedings of the CIFEM 2018—Conférence Internationale Francophone en Énergie, Mécanique et Thermique, Antananarivo, Madagascar, 23–24 April 2018. [Google Scholar]
- Aboudou, K.M.; Ganaoui, M.E. Design of a Hybrid System for Rural Area Electricity Supply in Comoros. J. Power Energy Eng. 2019, 7, 59–78. [Google Scholar] [CrossRef]
- Kassim, M.; El Ganaoui, M. Design of Hybrid Power System for a Power Supply in Rural Areas in Comoros. In Proceedings of the 3rd Southern African Solar Energy Conference, SASEC 2015, Skukuza, South Africa, 11–13 May 2015. [Google Scholar]
- World Energy Transitions Outlook: 1.5 °C Pathway; International Renewable Energy Agency: Abu Dhabi, United Arab Emirates, 2021.
- Skandalos, N.; Kocher-Oberlehner, G. Impact of Surface Modification on Performance of Solar Concentrators. Solar 2025, 5, 17. [Google Scholar] [CrossRef]
- Nasir, M.; Iqbal, S.; Khan, H.A.; Vasquez, J.C.; Guerrero, J.M. Sustainable Rural Electrification Through Solar PV DC Microgrids—An Architecture-Based Assessment. Processes 2020, 8, 1417. [Google Scholar] [CrossRef]
- Sanfilippo, S.; Hernández Cabrera, J.J.; Évora, J.; Kébé, C.M.F.; Kremers, E.; Péchiné, B.; Cardot, J.S.; Rachid, A.; Tossa, A.K.; Lekoto, J.; et al. Microgrid Design Optimization in Benin within the LEOPARD Project: Evaluating the Impact of Inaccurate Load Profile Estimation. In Proceedings of the 2023 3rd International Conference on Electrical, Computer, Communications and Mechatronics Engineering (ICECCME), Tenerife, Spain, 19–21 July 2023; pp. 1–6. [Google Scholar]
- Aziz, A.S.; Tajuddin, M.F.N.; Adzman, M.R.; Ramli, M.A.M.; Mekhilef, S. Energy Management and Optimization of a PV/Diesel/Battery Hybrid Energy System Using a Combined Dispatch Strategy. Sustainability 2019, 11, 683. [Google Scholar] [CrossRef]
- Almutairi, K.; Hosseini Dehshiri, S.S.; Hosseini Dehshiri, S.J.; Mostafaeipour, A.; Issakhov, A.; Techato, K. Use of a Hybrid Wind—Solar—Diesel—Battery Energy System to Power Buildings in Remote Areas: A Case Study. Sustainability 2021, 13, 8764. [Google Scholar] [CrossRef]
- Al Garni, H.Z.; Abubakar Mas’ud, A.; Wright, D. Design and Economic Assessment of Alternative Renewable Energy Systems Using Capital Cost Projections: A Case Study for Saudi Arabia. Sustain. Energy Technol. Assess. 2021, 48, 101675. [Google Scholar] [CrossRef]
- Hasan, S.M.N.; Ahmad, S.; Liaf, A.F.; Mustayen, A.G.M.B.; Hasan, M.M.; Ahmed, T.; Howlader, S.; Hassan, M.; Alam, M.R. Techno-Economic Performance and Sensitivity Analysis of an Off-Grid Renewable Energy-Based Hybrid System: A Case Study of Kuakata, Bangladesh. Energies 2024, 17, 1476. [Google Scholar] [CrossRef]
- Gerlici, J.; Shavolkin, O.; Kravchenko, O.; Shvedchykova, I.; Haman, Y. Improvement of the Hybrid Renewable Energy System for a Sustainable Power Supply of Transportation Infrastructure Objects. Future Transp. 2025, 5, 61. [Google Scholar] [CrossRef]
- Jarso, A.K.; Jin, G.; Ahn, J. Hybrid Genetic Algorithm-Based Optimal Sizing of a PV–Wind–Diesel–Battery Microgrid: A Case Study for the ICT Center, Ethiopia. Mathematics 2025, 13, 985. [Google Scholar] [CrossRef]
- Bouchekara, H.R.E.H.; Sha’aban, Y.A.; Shahriar, M.S.; Abdullah, S.M.; Ramli, M.A. Sizing of Hybrid PV/Battery/Wind/Diesel Microgrid System Using an Improved Decomposition Multi-Objective Evolutionary Algorithm Considering Uncertainties and Battery Degradation. Sustainability 2023, 15, 11073. [Google Scholar] [CrossRef]
- Żołądek, M.; Kafetzis, A.; Figaj, R.; Panopoulos, K. Energy-Economic Assessment of Islanded Microgrid with Wind Turbine, Photovoltaic Field, Wood Gasifier, Battery, and Hydrogen Energy Storage. Sustainability 2022, 14, 12470. [Google Scholar] [CrossRef]
- Belboul, Z.; Toual, B.; Kouzou, A.; Mokrani, L.; Bensalem, A.; Kennel, R.; Abdelrahem, M. Multiobjective Optimization of a Hybrid PV/Wind/Battery/Diesel Generator System Integrated in Microgrid: A Case Study in Djelfa, Algeria. Energies 2022, 15, 3579. [Google Scholar] [CrossRef]
- Halabi, L.M.; Mekhilef, S.; Olatomiwa, L.; Hazelton, J. Performance Analysis of Hybrid PV/Diesel/Battery System Using HOMER: A Case Study Sabah, Malaysia. Energy Convers. Manag. 2017, 144, 322–339. [Google Scholar] [CrossRef]
- Riayatsyah, T.M.I.; Geumpana, T.A.; Fattah, I.M.R.; Mahlia, T.M.I. Techno-Economic Analysis of Hybrid Diesel Generators and Renewable Energy for a Remote Island in the Indian Ocean Using HOMER Pro. Sustainability 2022, 14, 9846. [Google Scholar] [CrossRef]
- Mehallou, A.; M’hamdi, B.; Amari, A.; Teguar, M.; Rabehi, A.; Guermoui, M.; Alharbi, A.H.; El-kenawy, E.-S.M.; Khafaga, D.S. Optimal Multiobjective Design of an Autonomous Hybrid Renewable Energy System in the Adrar Region, Algeria. Sci. Rep. 2025, 15, 4173. [Google Scholar] [CrossRef] [PubMed]
- Murtza Qamar, H.G.; Guo, X.; Seif Ghith, E.; Tlija, M.; Siddique, A. Assessment of Energy Management and Power Quality Improvement of Hydrogen Based Microgrid System through Novel PSO-MWWO Technique. Sci. Rep. 2025, 15, 863. [Google Scholar] [CrossRef] [PubMed]
- Yamegueu, D.; Nelson, H.T.; Boly, A.S. Improving the Performance of PV/Diesel Microgrids via Integration of a Battery Energy Storage System: The Case of Bilgo Village in Burkina Faso. Energy Sustain. Soc. 2024, 14, 48. [Google Scholar] [CrossRef]
- Putri, S.A.; Ge, X.; Khazaei, J. Economic Dispatch and Power Flow Analysis for Microgrids. arXiv 2024, arXiv:2411.19279. [Google Scholar]
- Toms, A.M.; Li, X.; Rajashekara, K. Optimal Microgrid Sizing of Offshore Renewable Energy Sources for Offshore Platforms and Coastal Communities. arXiv 2025, arXiv:2505.053052025. [Google Scholar]
- Dufo-López, R.; Bernal-Agustín, J.L. Design and Control Strategies of PV-Diesel Systems Using Genetic Algorithms. Sol. Energy 2005, 79, 33–46. [Google Scholar] [CrossRef]
- Chao, J. Experts’ Predictions for Future Wind Energy Costs Drop Significantly. Available online: https://newscenter.lbl.gov/2021/04/15/experts-predictions-for-future-wind-energy-costs-drop-significantly/ (accessed on 22 January 2023).
- Homer Energy HOMER-Logiciel de Conception de Systèmes de Génération Hybrides Renouvelables et Distribués. Available online: https://www.homerenergy.com/ (accessed on 28 June 2021).
- Belboul, Z.; Toual, B.; Bensalem, A.; Ghenai, C.; Khan, B.; Kamel, S. Techno-Economic Optimization for Isolated Hybrid PV/Wind/Battery/Diesel Generator Microgrid Using Improved Salp Swarm Algorithm. Sci. Rep. 2024, 14, 2920. [Google Scholar] [CrossRef]
- Manmadharao, S.; Chaitanya, S.N.V.S.K.; Venkateswara rao, B.; Srinivasarao, G. Design and Optimization of Grid Integrated Solar Energy System Using HOMER GRID Software. In Proceedings of the 2019 Innovations in Power and Advanced Computing Technologies (i-PACT), Vellore, India, 22–23 March 2019; Volume 1, pp. 1–5. [Google Scholar]
- Ghatak, A.; Alfred, R.B.; Singh, R.R. Optimization for Electric Vehicle Charging Station Using Homer Grid. In Proceedings of the 2021 Innovations in Power and Advanced Computing Technologies (i-PACT), Kuala Lumpur, Malaysia, 27–29 November 2021; pp. 1–7. [Google Scholar]
- Sen, R.; Bhattacharyya, S.C. Off-Grid Electricity Generation with Renewable Energy Technologies in India: An Application of HOMER. Renew. Energy 2014, 62, 388–398. [Google Scholar] [CrossRef]
- Shahzad, M.K.; Zahid, A.; ur Rashid, T.; Rehan, M.A.; Ali, M.; Ahmad, M. Techno-Economic Feasibility Analysis of a Solar-Biomass off Grid System for the Electrification of Remote Rural Areas in Pakistan Using HOMER Software. Renew. Energy 2017, 106, 264–273. [Google Scholar] [CrossRef]
- Bahramara, S.; Moghaddam, M.P.; Haghifam, M.R. Optimal Planning of Hybrid Renewable Energy Systems Using HOMER: A Review. Renew. Sustain. Energy Rev. 2016, 62, 609–620. [Google Scholar] [CrossRef]
- Ahmad, J.; Imran, M.; Khalid, A.; Iqbal, W.; Ashraf, S.R.; Adnan, M.; Ali, S.F.; Khokhar, K.S. Techno Economic Analysis of a Wind-Photovoltaic-Biomass Hybrid Renewable Energy System for Rural Electrification: A Case Study of Kallar Kahar. Energy 2018, 148, 208–234. [Google Scholar] [CrossRef]
- Homer energy pro How HOMER Creates the Generator Efficiency Curve. Available online: https://www.homerenergy.com/products/pro/docs/latest/how_homer_creates_the_generator_efficiency_curve.html (accessed on 22 January 2023).
- Maoulida, F. Développement D’Un Système Hybride de Génération D’éNergie en Site Isolé Pour la Télécommunication ET Réalisation D’Un Régulateur de Charge Solaire. Master’s Thesis, d’Ingénierie en Énergies Renouvelables, Université d’Antananarivo, Antananarivo, Madagascar, 2020. [Google Scholar]
- Homer Energy pro How HOMER Calculates the PV Array Power Output. Available online: https://www.homerenergy.com/products/pro/docs/3.14/how_homer_calculates_the_pv_array_power_output.html (accessed on 21 January 2023).
- Brihmat, F.; Mekhtoub, S. PV Cell Temperature/PV Power Output Relationships Homer Methodology Calculation. Int. J. Sci. Res. Eng. Technol. 2014, 1, 33–45. [Google Scholar]
- Haffaf, A.; Lakdja, F.; Meziane, R.; Abdeslam, D.O. Study of Economic and Sustainable Energy Supply for Water Irrigation System (WIS). Sustain. Energy Grids Netw. 2021, 25, 100412. [Google Scholar] [CrossRef]
- Homer Energy Pro How HOMER Calculates Wind Turbine Power Output. Available online: https://www.homerenergy.com/products/pro/docs/3.10/how_homer_calculates_wind_turbine_power_output.html (accessed on 11 April 2023).
- Delannoy, L.; Puri, S.; Perera, A.T.D.; Coccolo, S.; Mauree, D.; Scartezzini, J.-L. Climate Impact and Energy Sustainability of Future European Neighborhoods. In Proceedings of the 2018 5th International Symposium on Environment-Friendly Energies and Applications (EFEA), Rome, Italy, 24–26 September 2018; pp. 1–6. [Google Scholar]


Disclaimer/Publisher’s Note: The statements, opinions and data contained in all publications are solely those of the individual author(s) and contributor(s) and not of MDPI and/or the editor(s). MDPI and/or the editor(s) disclaim responsibility for any injury to people or property resulting from any ideas, methods, instructions or products referred to in the content. |
© 2025 by the authors. Licensee MDPI, Basel, Switzerland. This article is an open access article distributed under the terms and conditions of the Creative Commons Attribution (CC BY) license (https://creativecommons.org/licenses/by/4.0/).