1. Introduction
The transition to renewable energy sources is a key component of Italy’s strategy to meet climate and energy targets set by the European Union, including the European Green Deal and the “Fit for 55” package [
1,
2,
3]. Among the various renewable sources, photovoltaic (PV) solar energy plays a critical role due to Italy’s favorable solar irradiation conditions and falling technology costs [
4,
5]. However, deploying utility-scale PV power plants requires significant land availability, and this is where spatial planning and regulatory frameworks become crucial [
6].
Solar PV energy has become one of the fastest-growing renewable energy technologies worldwide [
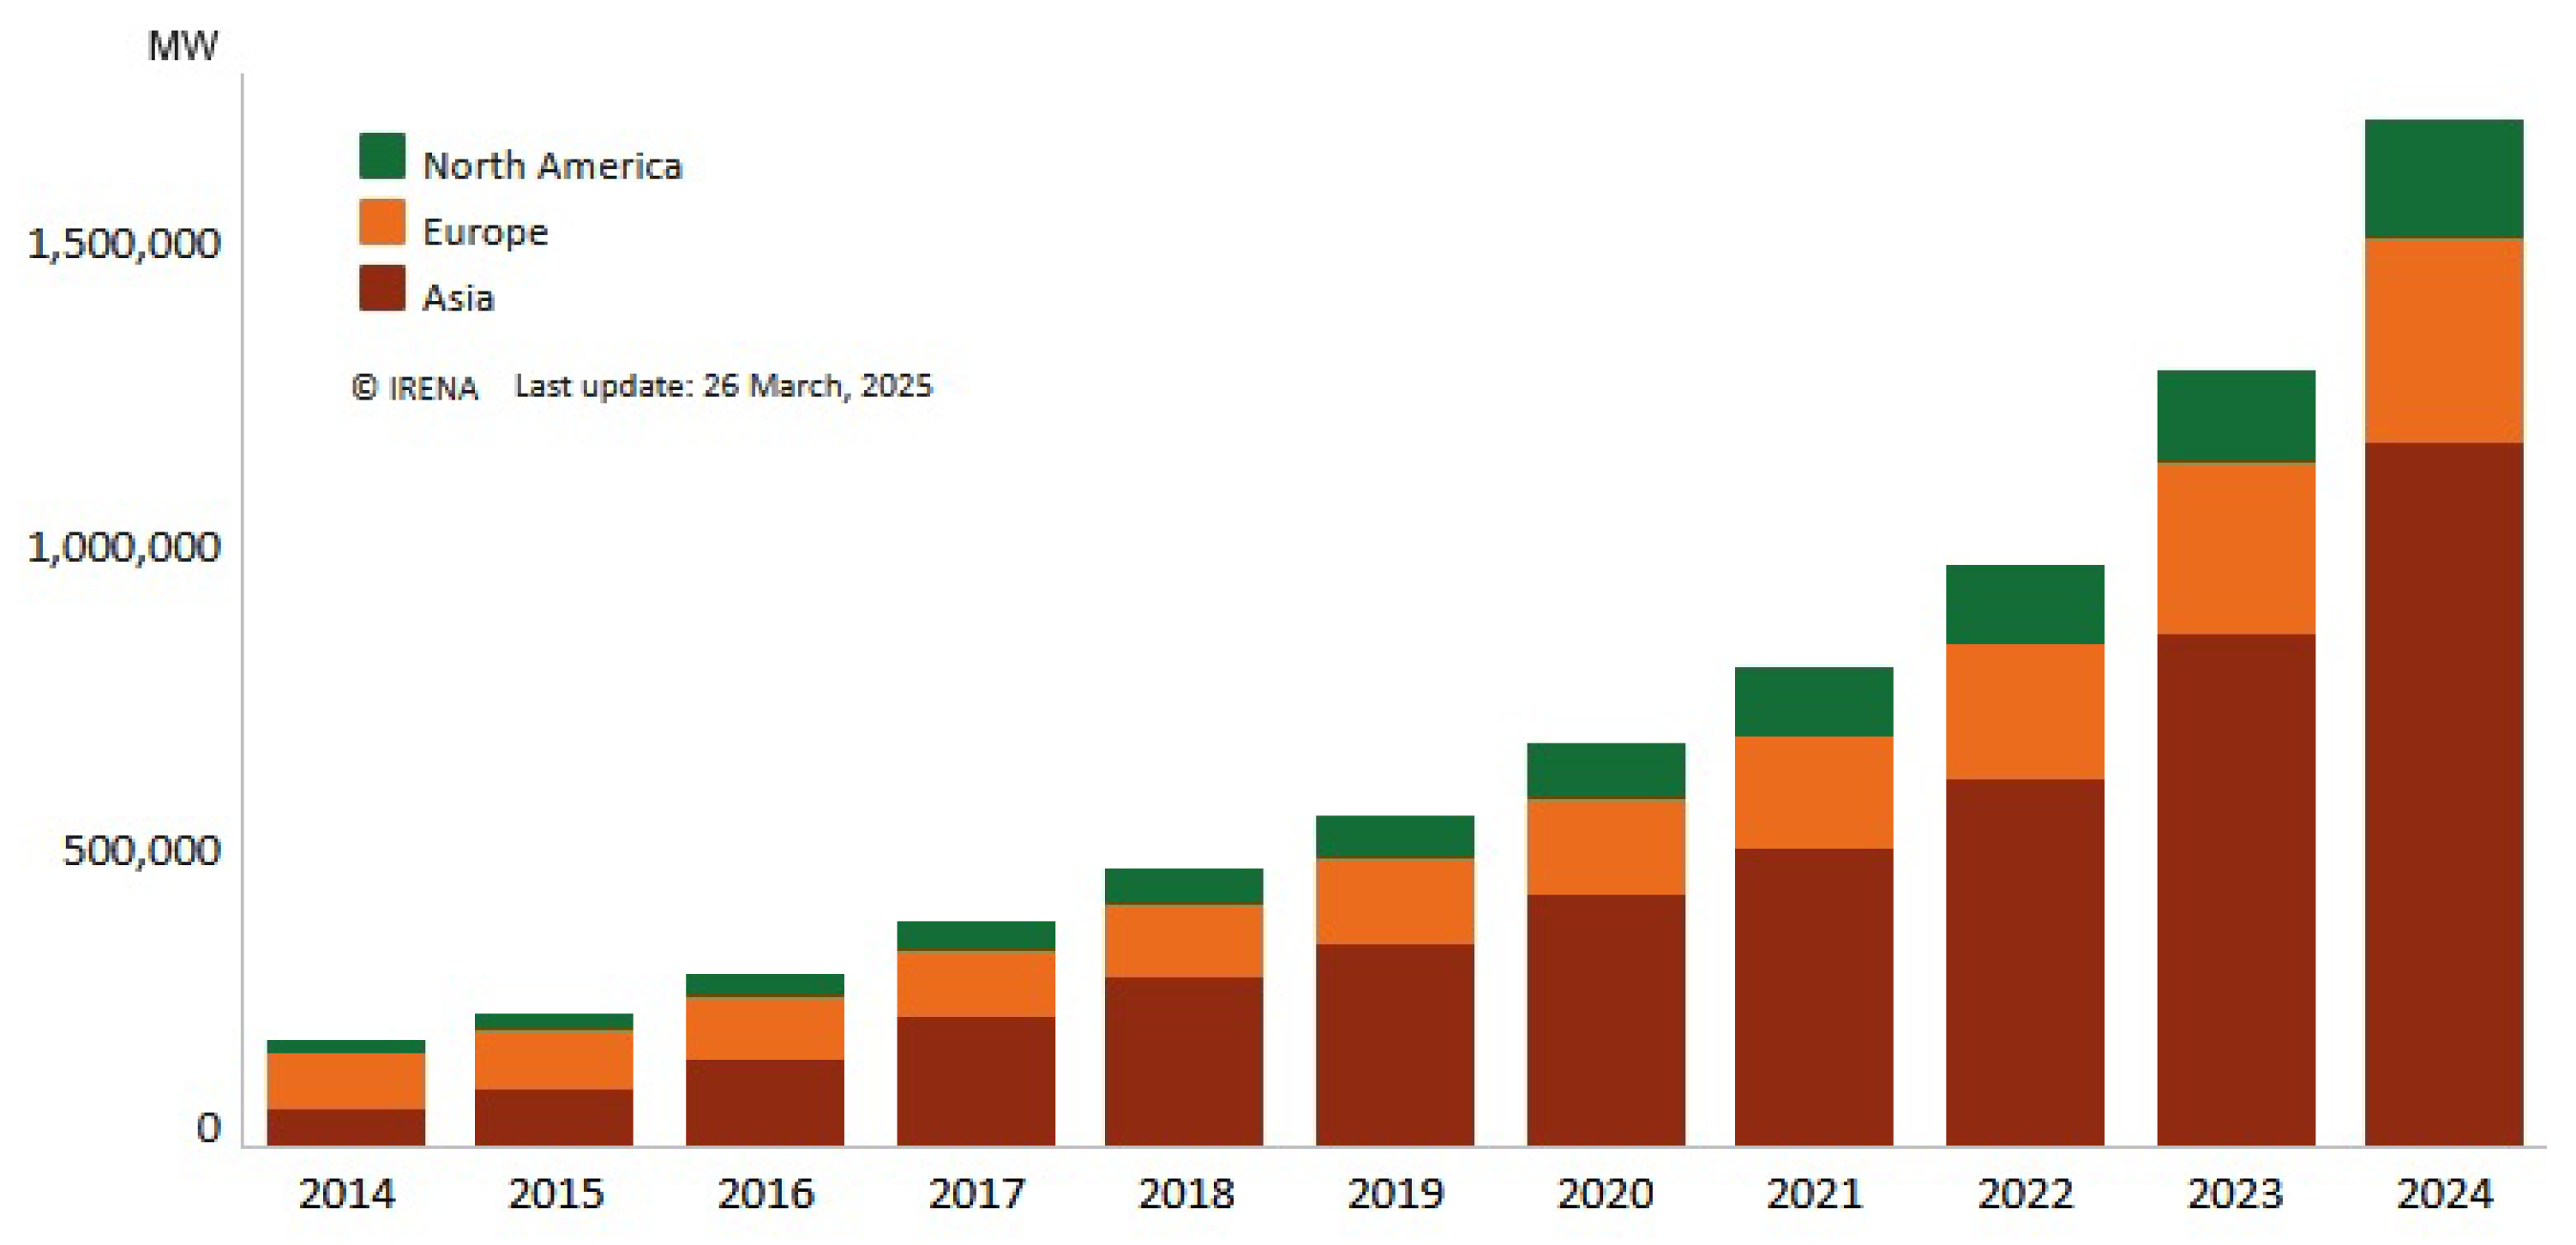
7]. As shown in
Figure 1, global installed solar capacity has grown nearly tenfold over the past decade, with particularly sharp increases since 2020. Asia dominates the capacity expansion, while Europe has made steady but comparatively slower progress. Although Europe has favorable policies and technical capacity, countries like Italy face land-related and regulatory bottlenecks that may hinder their ability to keep pace with the energy transition. This challenge is particularly urgent given Italy’s ambitious 2030 renewable targets and the need to accelerate utility-scale PV deployment, which requires significant amounts of legally buildable land.
Italy, like many European countries, is under increasing pressure to scale up its renewable energy capacity in line with ambitious climate targets [
8,
9]. Solar photovoltaic (PV) energy, in particular, is expected to play a leading role given the country’s strong solar potential and declining installation costs [
10,
11]. Yet, turning this potential into real-world energy production is proving more difficult than expected—not because of a lack of sunlight or technology, but because of land [
12].
Italy’s National Energy and Climate Plan (NECP) aims for approximately 80 GW of installed PV capacity by 2030 [
13]. The National Survey Report of PV Power Applications in Italy for 2023 shows that the cumulative installed capacity is approximately 30 GW [
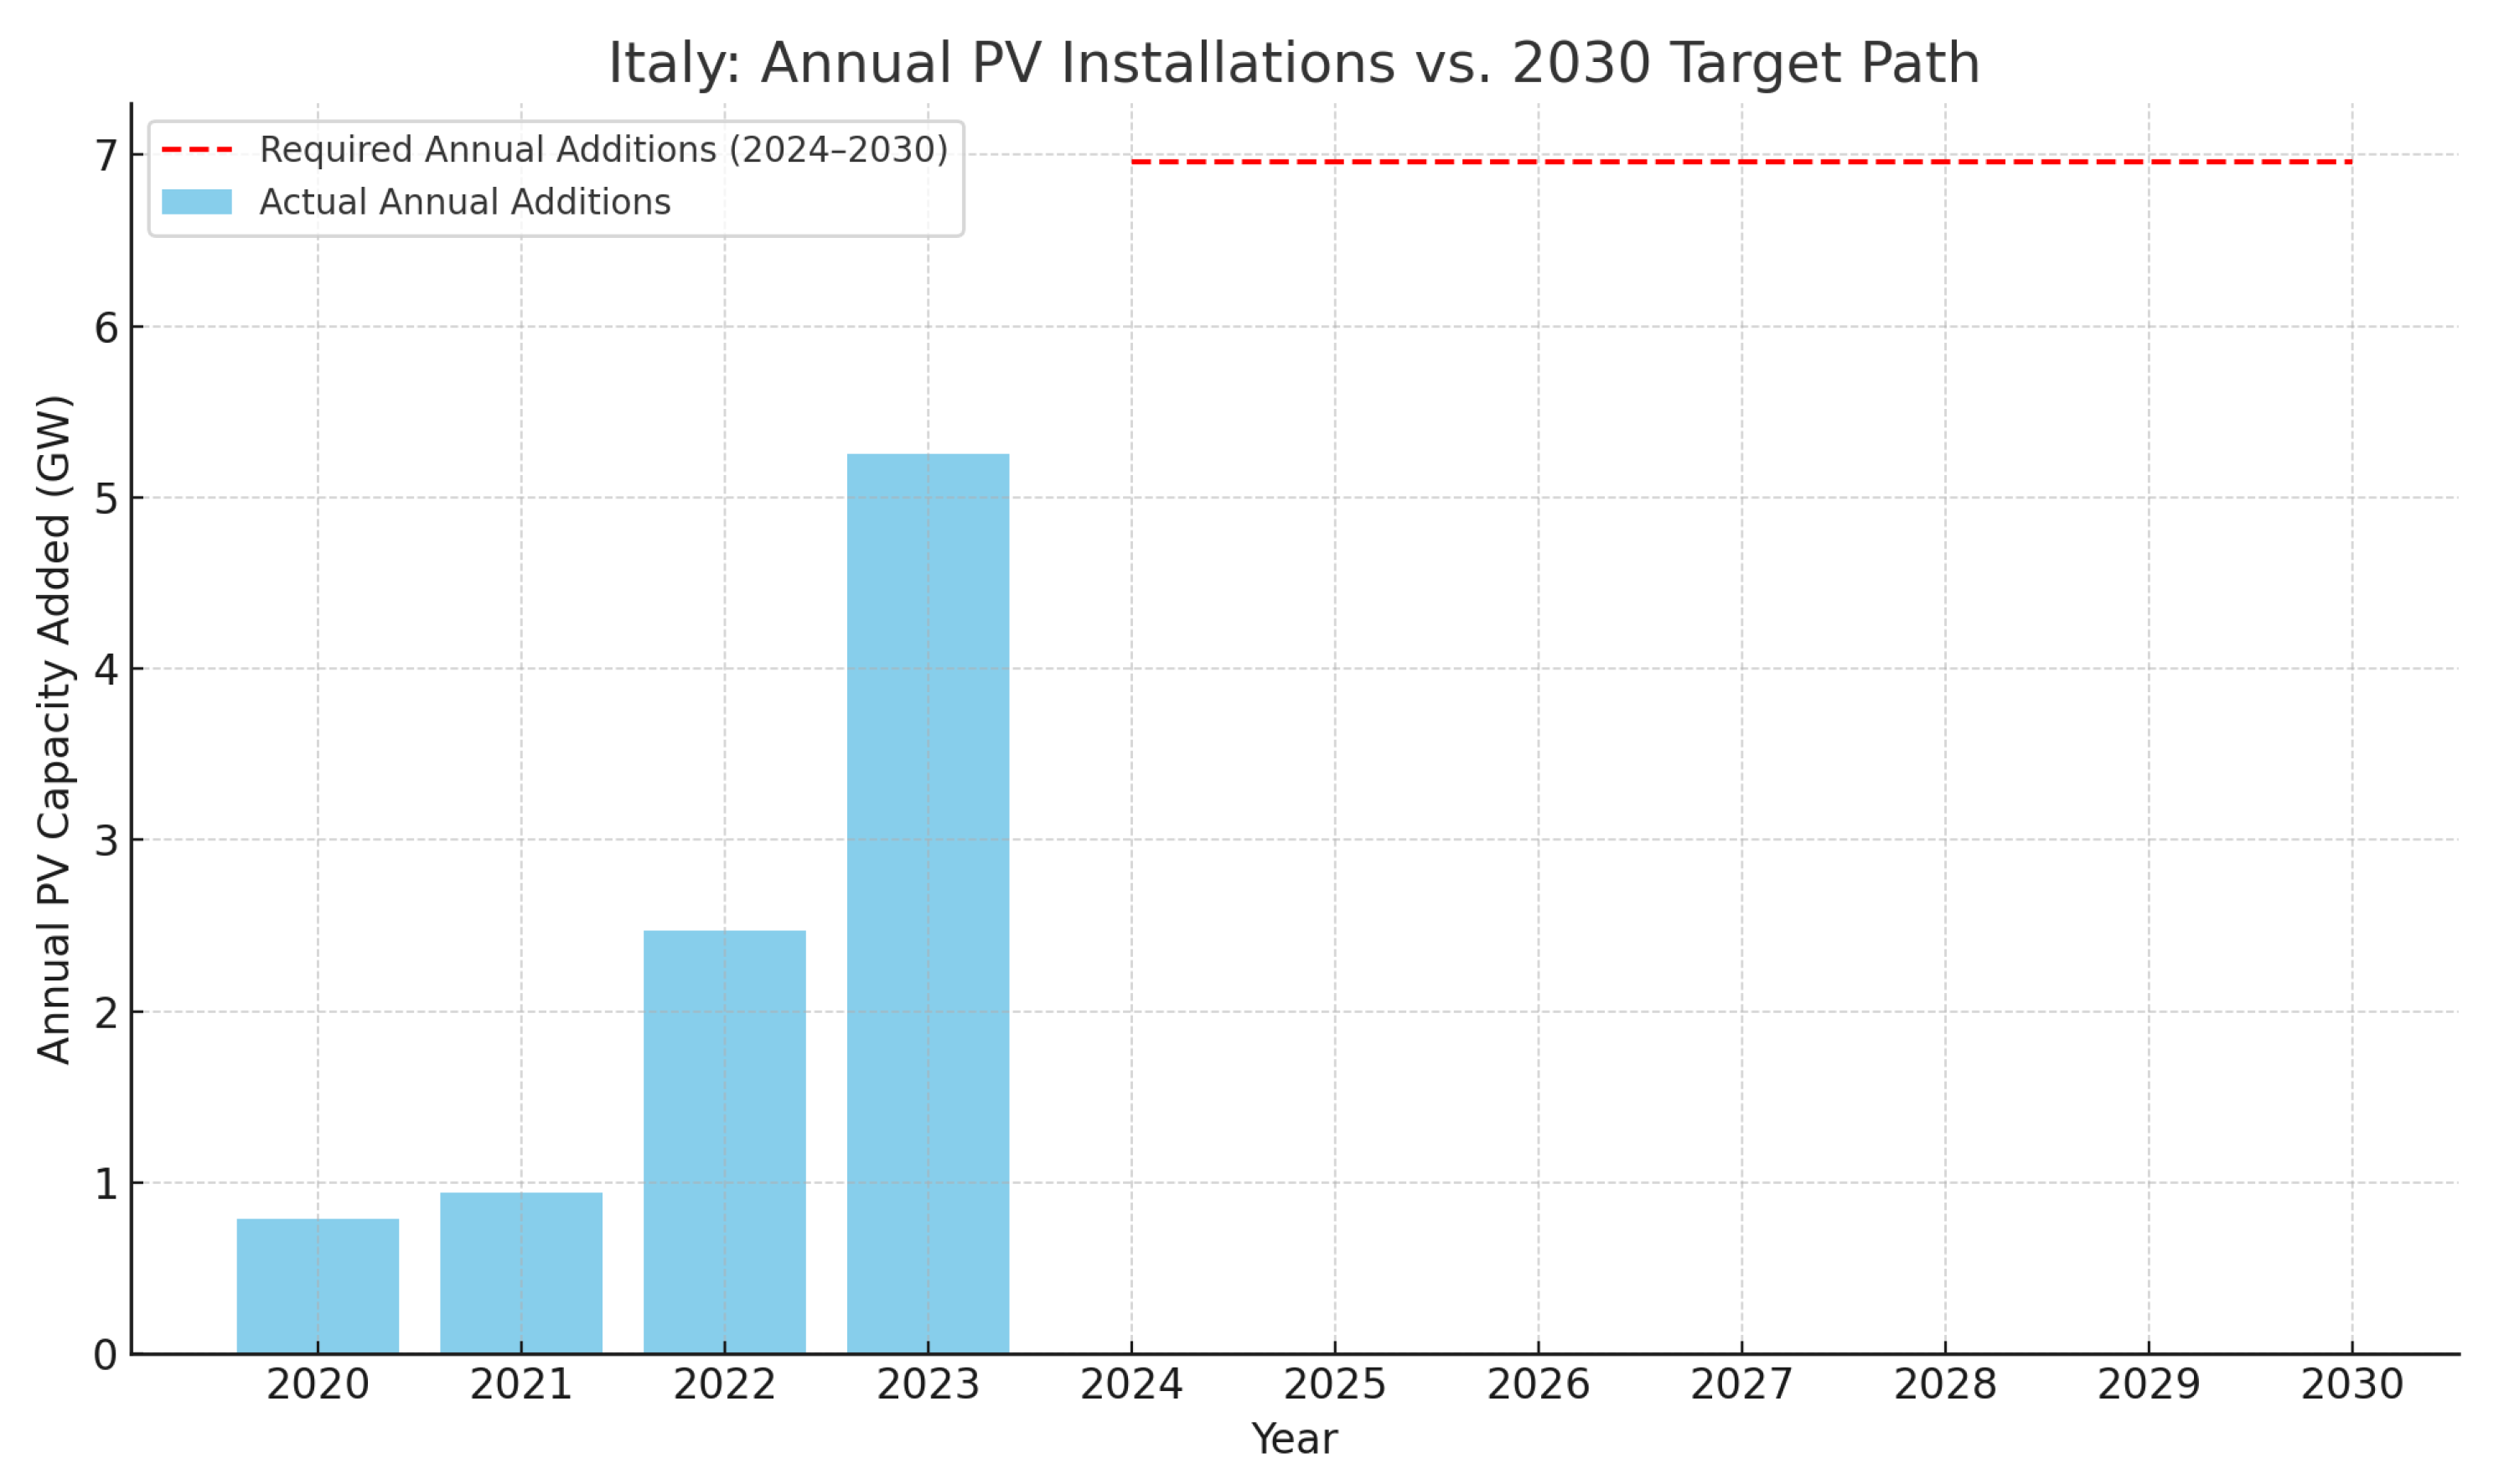
14]. This implies that to stay on track, Italy needs to install approximately 7 GW of PV capacity annually from 2024 onward.
Figure 2 shows the trend of PV installation in Italy from 2020. Although the pace of installations has increased in 2023, it is far from the pace required to meet the 2030 target.
Despite the growing urgency to decarbonize, the development of PV installations in Europe and Italy often faces delays and cancellations, frequently attributed to complex permitting procedures and restrictive land-use regulations [
15,
16,
17]. While these barriers are commonly acknowledged in policy and industry discourse, few studies have quantitatively assessed the extent to which regulations and planning constraints limit the actual land available for PV deployment.
One of the biggest challenges facing utility-scale PV development in Italy is finding suitable land that meets all the necessary conditions: technical, environmental, and above all, regulatory [
12,
18]. Developers frequently encounter a set of planning restrictions, protected areas, landscape constraints, and cultural preservation rules that significantly narrow the space where solar plants can be legally and practically built. While these issues are often discussed anecdotally in the energy sector and media, there has been little comprehensive, spatially explicit research showing how much land is actually off-limits due to regulatory exclusions.
Recent studies across Europe have highlighted the spatial and regulatory challenges hindering the expansion of solar energy. For example, in Italy, Sacchelli et al. [
19] and Ronchetti et al. [
12] investigated the spatial trade-offs between agricultural land and PV development, identifying land-use pressure as a growing concern. Similarly, Delatin Rodrigues and Grasso [
18] emphasized the systemic resistance to solar expansion due to fragmented permitting and inconsistent local planning practices. Outside Italy, GIS-based exclusion studies in Spain [
20], France [
21], and Germany [
22] have confirmed that the overlay of environmental, landscape, and cultural protections can significantly shrink the feasible space for PV installations—even in regions with high solar potential.
Despite this growing body of regional and thematic research, a national-scale, regulation-informed geospatial analysis is lacking for Italy. This study addresses this gap by presenting a comprehensive geospatial analysis of exclusion zones for PV power plant siting across Italy. Using authoritative spatial data from governmental portals, open data sources such as OpenStreetMap (OSM), and the existing literature, we have compiled and standardized exclusion criteria into six thematic categories: Natural Assets, Landscape Assets, Cultural Assets, Natural Hazards, Environmental Constraints, and Infrastructural Constraints. Each category represents a distinct type of regulatory or physical limitation that restricts PV development.
By integrating these exclusion layers in a Geographic Information System (GIS), we delineate the remaining land area where PV installations are potentially feasible. Our analysis quantitatively supports the claim that land availability is a critical issue in the progress of PV plants. This highlights a substantial spatial limitation and raises important questions about the alignment between national climate ambitions and current land-use policies.
The aim of this paper is to offer a spatially explicit, evidence-based perspective on the impact of regulatory constraints on solar energy expansion in Italy. Our goal is not only to support planning efforts with more grounded spatial evidence, but also to open a conversation about the balance between environmental protection, cultural heritage, and the urgent need to decarbonize. The results provide a foundation for policymakers, planners, and researchers to re-evaluate current frameworks and explore pathways to balance environmental protection with renewable energy development.
In doing so, this study makes three key contributions. First, it presents the first national-scale, regulation-informed exclusion mapping for ground-mounted PV in Italy, integrating six categories of spatial constraints into a unified GIS framework. Second, it quantifies the impact of regulatory exclusions on land availability at both national and regional levels, revealing substantial spatial disparities. Third, it introduces a scenario-based estimation matrix that links technically available land to potential PV capacity under varying assumptions, offering a more realistic perspective on the feasibility of meeting Italy’s 2030 solar targets.
The structure of the paper is organized as follows:
Section 2 discusses the related work on land-use-related hurdles for PV development. Then,
Section 3 describes the data collection procedure and the methods employed for the spatial analysis of land availability for PV power plant installations.
Section 4 depicts and discusses the findings. Lastly,
Section 5 provides the conclusion of the study.
2. Related Work
The challenge of identifying land suitable for utility-scale PV development has drawn growing attention in both academic research and policy planning. Globally, there is increasing tension between expanding renewable energy capacity and preserving land for ecological, cultural, and landscape purposes. Spatial planning, exclusion mapping, and regulatory analysis have emerged as critical tools to navigate these tensions, particularly in regions with dense legal protections or competing land uses.
In Germany, Süsser et al. [
23] investigated the institutional friction between national energy goals and local land-use decision-making, concluding that regulatory misalignment frequently hinders PV deployment. Fakharizadehshiraz and Rösch [
22] used geospatial techniques to assess PV siting under various regulatory scenarios, highlighting the restrictive role of protected areas and planning zones.
Spain has also been a focal point for PV exclusion research. Hernández-Moro and Martínez-Duart [
24] combined economic modeling with spatial constraints to analyze PV investment feasibility. Guaita-Pradas et al. [
20] developed GIS-based suitability maps that accounted for both technical conditions and regulatory exclusions, revealing substantial spatial limitations.
In Portugal, Spyridonidou et al. [
25] performed a spatial multi-criteria analysis to locate optimal sites for PV farms, considering environmental and technical factors. Their study emphasized the role of exclusion zones in significantly shrinking the available base land. Silva and Sareen [
26] explored the spatial and social dimensions of solar energy expansion, highlighting how large-scale PV developments often trigger conflicts with land-use priorities and local perceptions of landscape value. Their study emphasizes the importance of integrating spatial planning with public engagement to ensure more balanced and accepted renewable energy transitions.
Recent work in France has focused on balancing solar expansion with agricultural and ecological priorities. Carrausse and de Sartre [
21] demonstrated that solar siting in southern France must account for land-use competition, especially in rural regions where agriculture and landscape protection intersect.
Outside Europe, large-scale PV suitability studies have been conducted in Asia and North America, where land-use conflicts are also prominent. For instance, in the United States, Majumdar and Pasqualetti [
27] analyzed land availability for utility-scale PV power plants in Arizona, emphasizing the importance of excluding environmentally sensitive areas and urban growth zones. The study highlights how GIS-based exclusion mapping can help reconcile energy development goals with environmental and spatial planning constraints in high-potential solar regions. In Canada, Calvert and Mabee [
28] examined potential land-use conflicts between solar PV and bioenergy crops in eastern Ontario using spatial analysis. Their findings show that competition among renewable technologies themselves—particularly for high-quality agricultural land—must be considered alongside environmental and policy constraints when planning energy transitions. In Taiwan, Wang et al. [
29] developed a GIS-based and participatory least-conflict siting framework for solar development, aiming to balance ecological protection with renewable energy goals. Their work demonstrates how integrating spatial analysis with stakeholder engagement can help reduce social and environmental resistance in densely regulated and ecologically sensitive regions.
In the case of Italy, Sacchelli et al. [
19] investigated the trade-offs between installing ground-mounted photovoltaic systems and preserving agricultural practices on arable land. Their study highlights that while PV development supports decarbonization goals, it may also generate significant socio-economic and environmental impacts—especially in regions where farmland is under pressure from multiple land-use demands. Yet, despite growing international attention and its ambitious energy targets and complex land regulation system, Italy lacks a national-scale spatial exclusion study with an explicit regulatory framing. Therefore, a comprehensive and regulation-informed geospatial approach remains underdeveloped in the Italian context.
This paper fills that gap by systematically integrating six categories of regulatory and environmental constraints to map legally available land for PV deployment in Italy. It contributes to the growing literature on renewable energy spatial planning by offering a reproducible, exclusion-based GIS methodology and highlighting the scale of constraints embedded in current policy frameworks.
3. Materials and Methods
This study uses a vector-based spatial exclusion approach to identify areas across Italy where the installation of ground-mounted PV power plants is restricted or prohibited due to regulatory, environmental, or infrastructural constraints.
The analysis was structured to realistically represent the influence of actual policies and land-use regulations on the physical availability of land suitable for solar energy development, performing a national-scale analysis with an explicit analysis of the regulatory framework.
The method was specifically designed to manage and integrate data coming from different sources, which may vary in format, resolution, and temporal update. This flexibility is essential for ensuring that the analysis remains robust and adaptable as new data become available over time.
Although the methodology is described using specific datasets, the techniques described can be applied to any data of the same format coming from other sources. This adaptability makes the approach suitable for broader applications, as long as the alternative datasets maintain comparable structure and spatial resolution.
3.1. Exclusion Criteria
To ensure a comprehensive view, we gathered exclusion factors from a variety of authoritative and open sources. These include national and regional regulations, spatial data services provided by government agencies (primarily through WMS—Web Map Services), and openly available datasets such as OSM. Informed by regulatory documents and the previous literature, we grouped the exclusion criteria into six broad thematic categories:
- 1.
Natural Assets: Protected natural areas such as national parks, regional reserves, forests, and biodiversity hotspots. The Ministry of the Environment and Energy Security (MASE) of Italy within the project nature (
https://gn.mase.gov.it/portale/en/web/geoportale-mase/nature, accessed on 28 May 2025) has identified all the protected natural assets within the country.
- 2.
Landscape Assets: Areas with visual or scenic protection, such as panoramic viewpoints and designated landscape zones. These are indicated in the Environmental and Landscape Territorial Information System (SITAP) (
https://sitap.cultura.gov.it/, accessed on 28 May 2025), a web-GIS system of the Ministry of Culture (MiC) of Italy.
- 3.
Cultural Assets: Historical and archaeological sites, UNESCO World Heritage areas, and zones under cultural heritage protection. The geographic data representing these cultural assets are available on the website managed by the Ministry of Culture (MiC) (
http://vincoliinrete.beniculturali.it, accessed on 28 May 2025).
- 4.
Natural Hazards: Areas exposed to risks like landslides, floods, or volcanic activity, where development is often restricted. The related data are obtained from the Italian Institute for Environmental Protection and Research (ISPRA) and the IdroGEO (
https://idrogeo.isprambiente.it/app/page/open-data, accessed on 28 May 2025) open data platform.
- 5.
Water Bodies: Lakes and water courses must be considered and excluded from the PV available area. Also, a safety buffer is applied around water bodies.
- 6.
Infrastructural Constraints: Areas where PV installations are either prohibited or impractical due to the presence of roads, railways, power lines, or urban infrastructure. In some cases, these are applied as buffer zones (e.g., within 100 m of highways).
Each category represents a set of layers that is processed individually before being combined to identify overall exclusion zones.
3.2. Data Acquisition
For the first three constraint groups—Natural Assets, Landscape Assets, and Cultural Assets—the relevant spatial data were not directly downloadable but instead provided as Web Map Services (WMS) by various Italian government agencies.
To extract geospatial data from these WMS layers, based on
Figure 3, the following steps were taken:
Layer Identification: Each relevant WMS endpoint was examined to identify and select the appropriate thematic layers (e.g., protected landscapes, heritage zones).
Tile-Based Downloading: Since WMS services only serve rendered map images, a custom tile-based approach was used to generate image requests over Italy’s extent. This was done at a sufficiently high resolution to preserve spatial detail.
Vectorization: The downloaded WMS images were georeferenced and processed, followed by manual correction where needed. This allowed the reconstruction of usable vector layers from visual-only WMS maps.
3.3. Spatial Processing Workflow
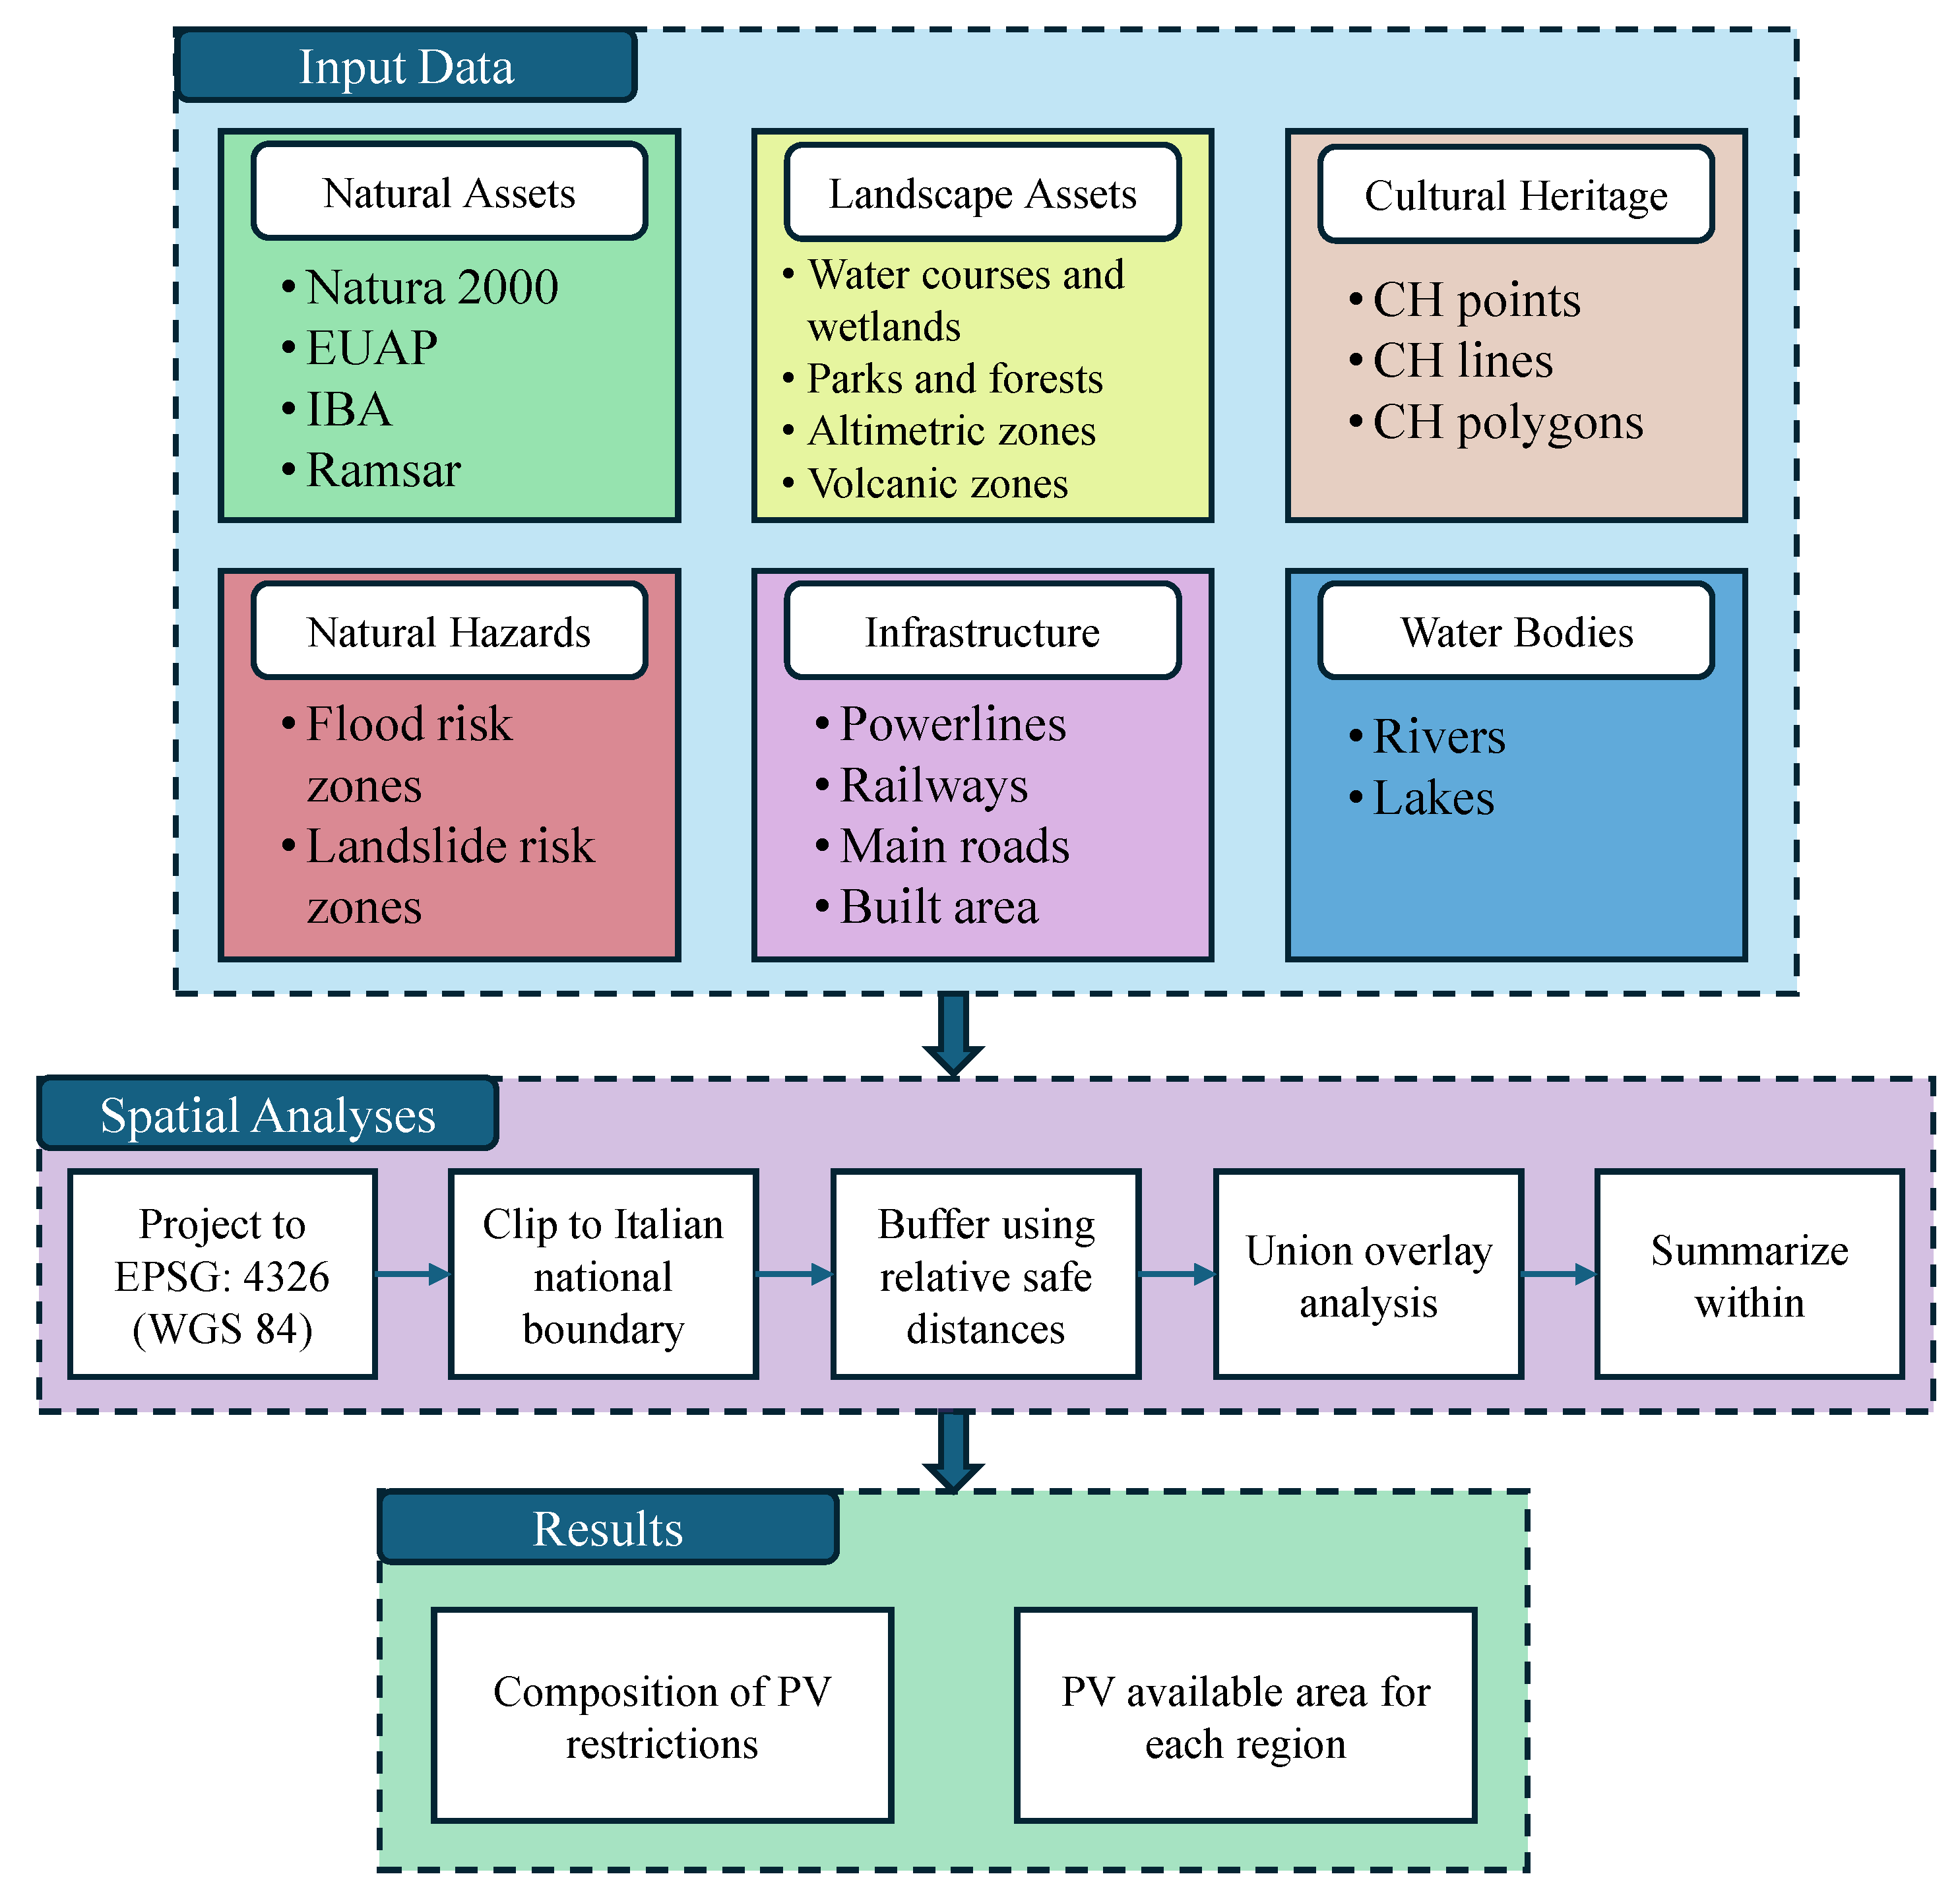
All spatial layers were processed using a vector-based GIS workflow, designed to retain the legal and thematic integrity of each constraint type. The overall process, after data acquisition, included harmonization, overlay analysis, and regional summarization, as described below and shown in
Figure 4.
Once collected, all datasets—whether extracted from WMS or obtained from open vector sources—were harmonized into a common projection system (EPSG: 4326, WGS84), cleaned, and clipped to the national boundaries of Italy. Buffers were applied where regulations specified minimum distances from infrastructure or settlements.
The layers were then merged using a union overlay, allowing the identification of overlapping constraints while preserving the category associated with each exclusion. Each feature in the output layer retained information about which of the six constraint categories applied to it.
To quantify how constraints vary across Italy, we applied a summarize within operation using regional boundaries. This allowed us to calculate the remaining land that is potentially available for PV installations for each region.
4. Results and Discussion
The method described above has been applied to the entire Italian territory; in the following section, the main results are presented and discussed. The data used for defining the exclusion criteria were downloaded from official sources, vectorized, harmonized, and then grouped into six thematic classes to ensure a consistent and structured analysis.
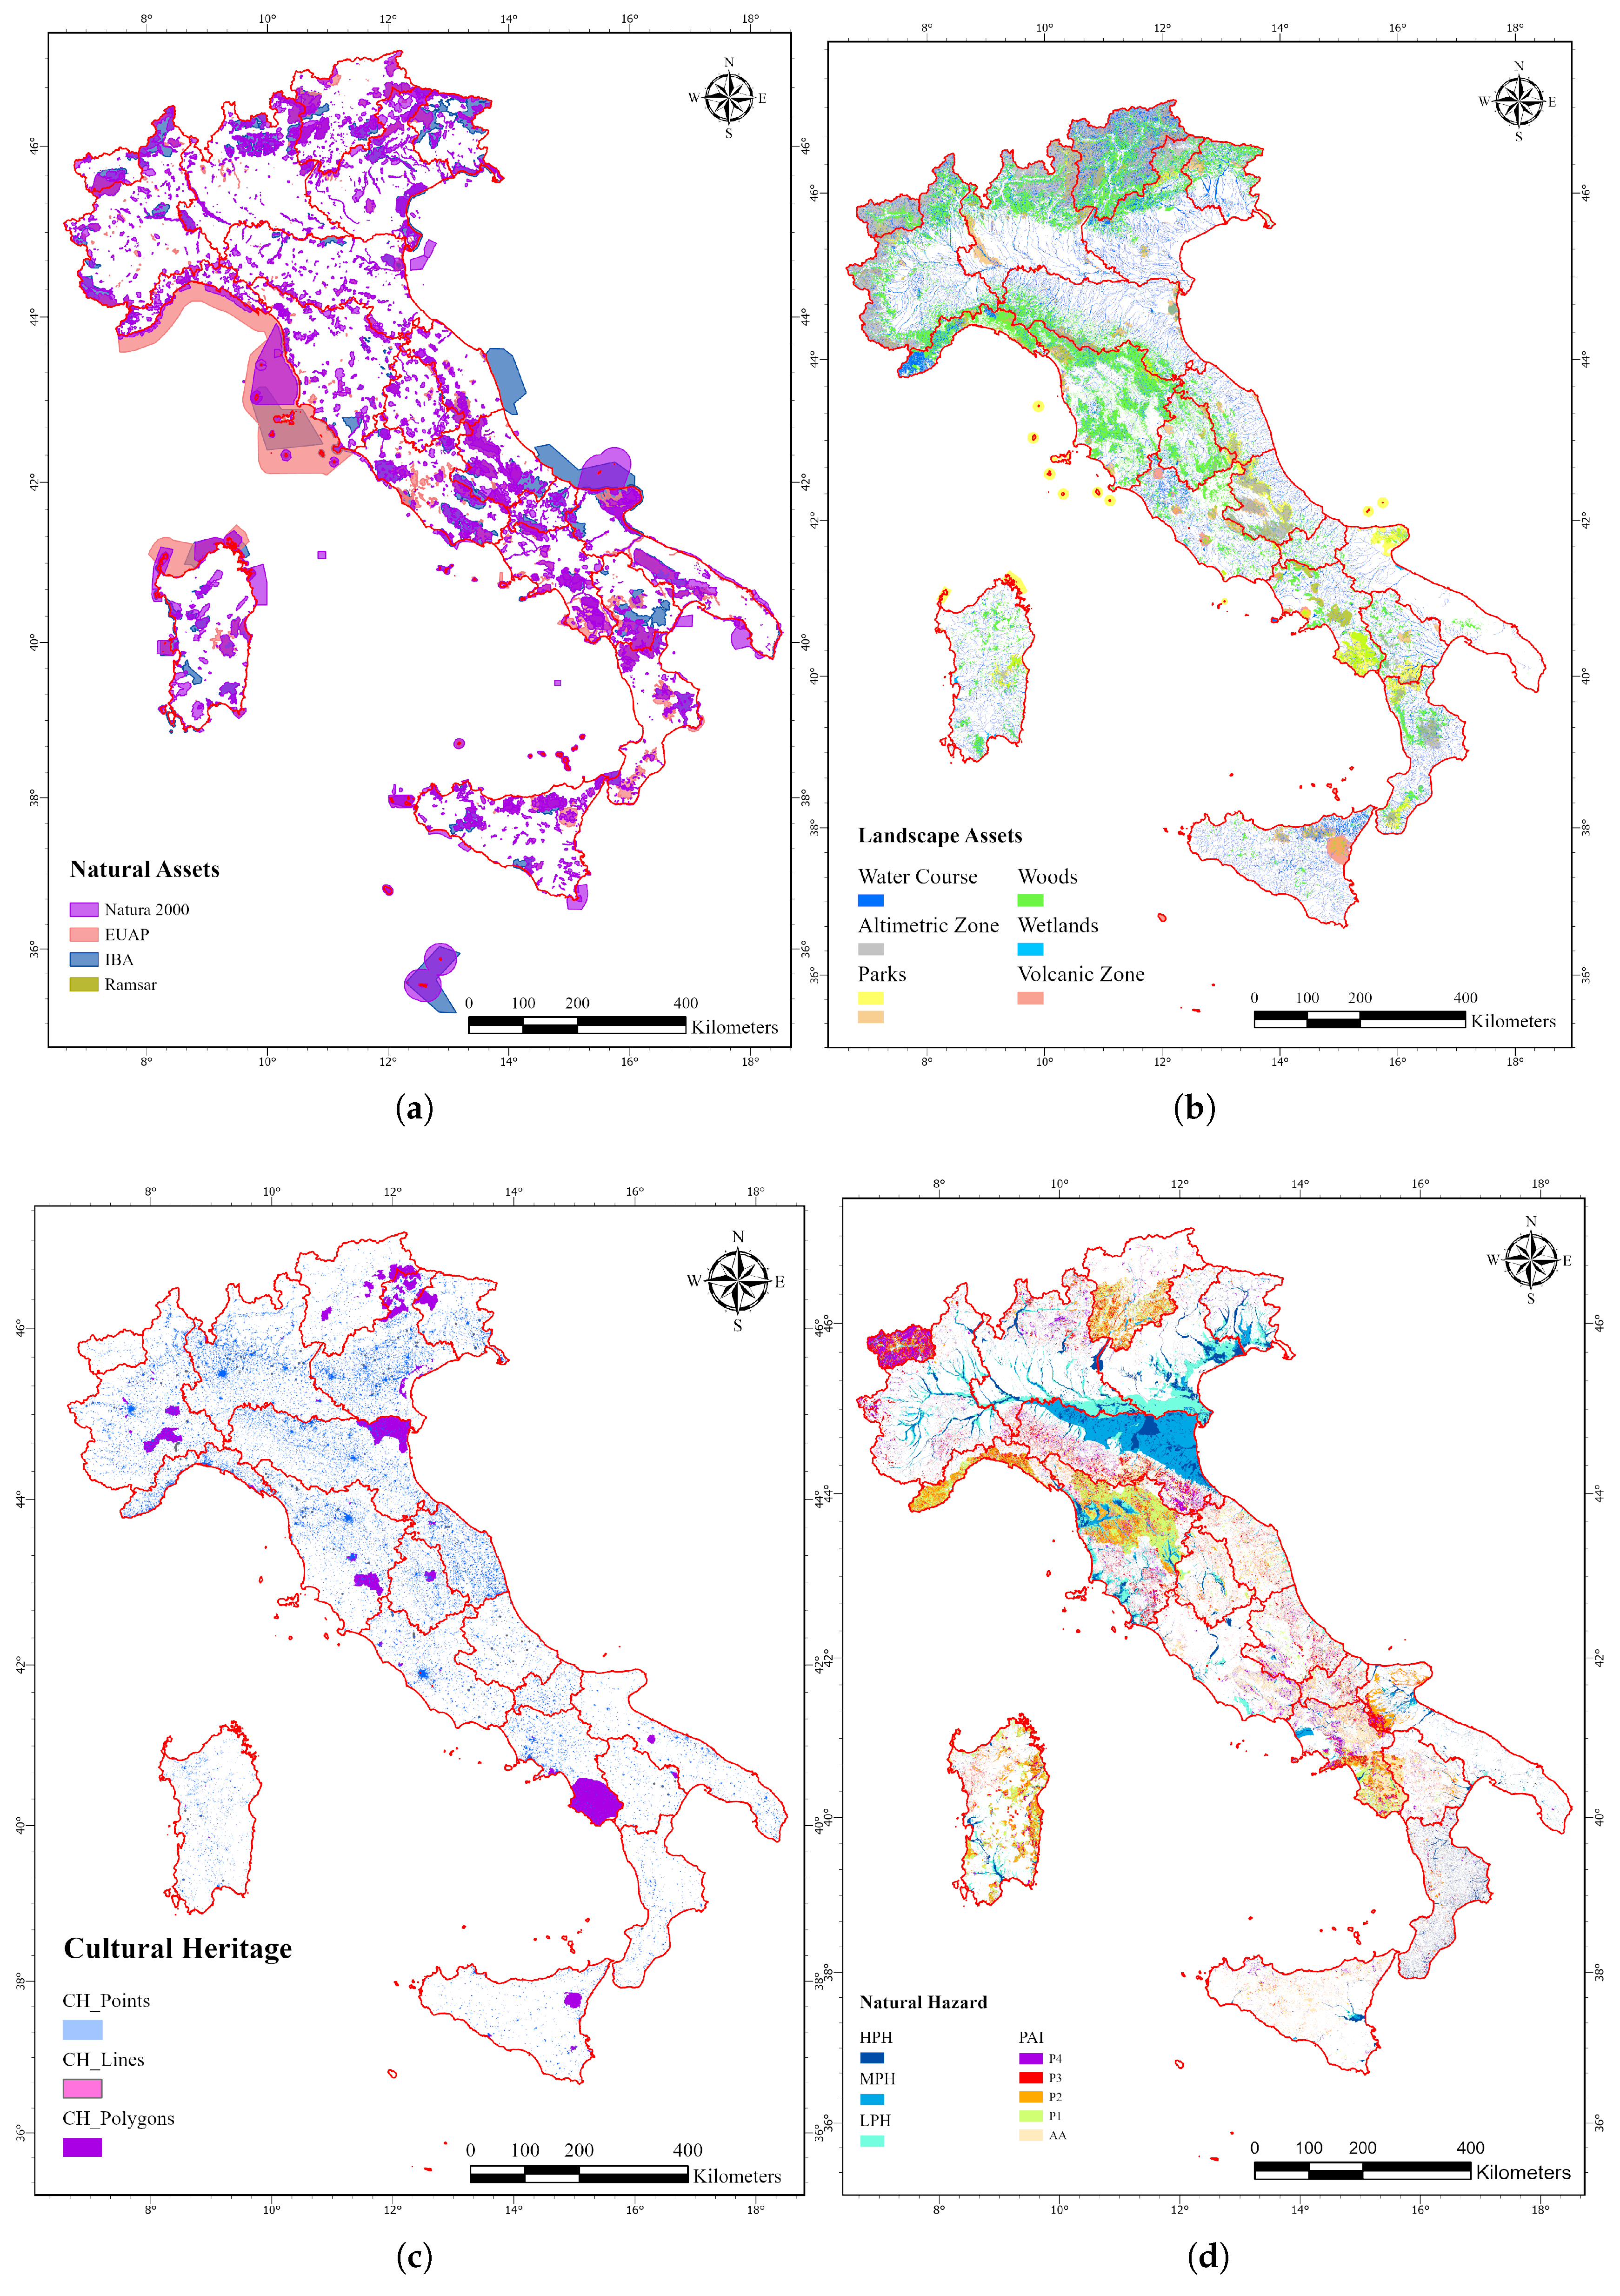
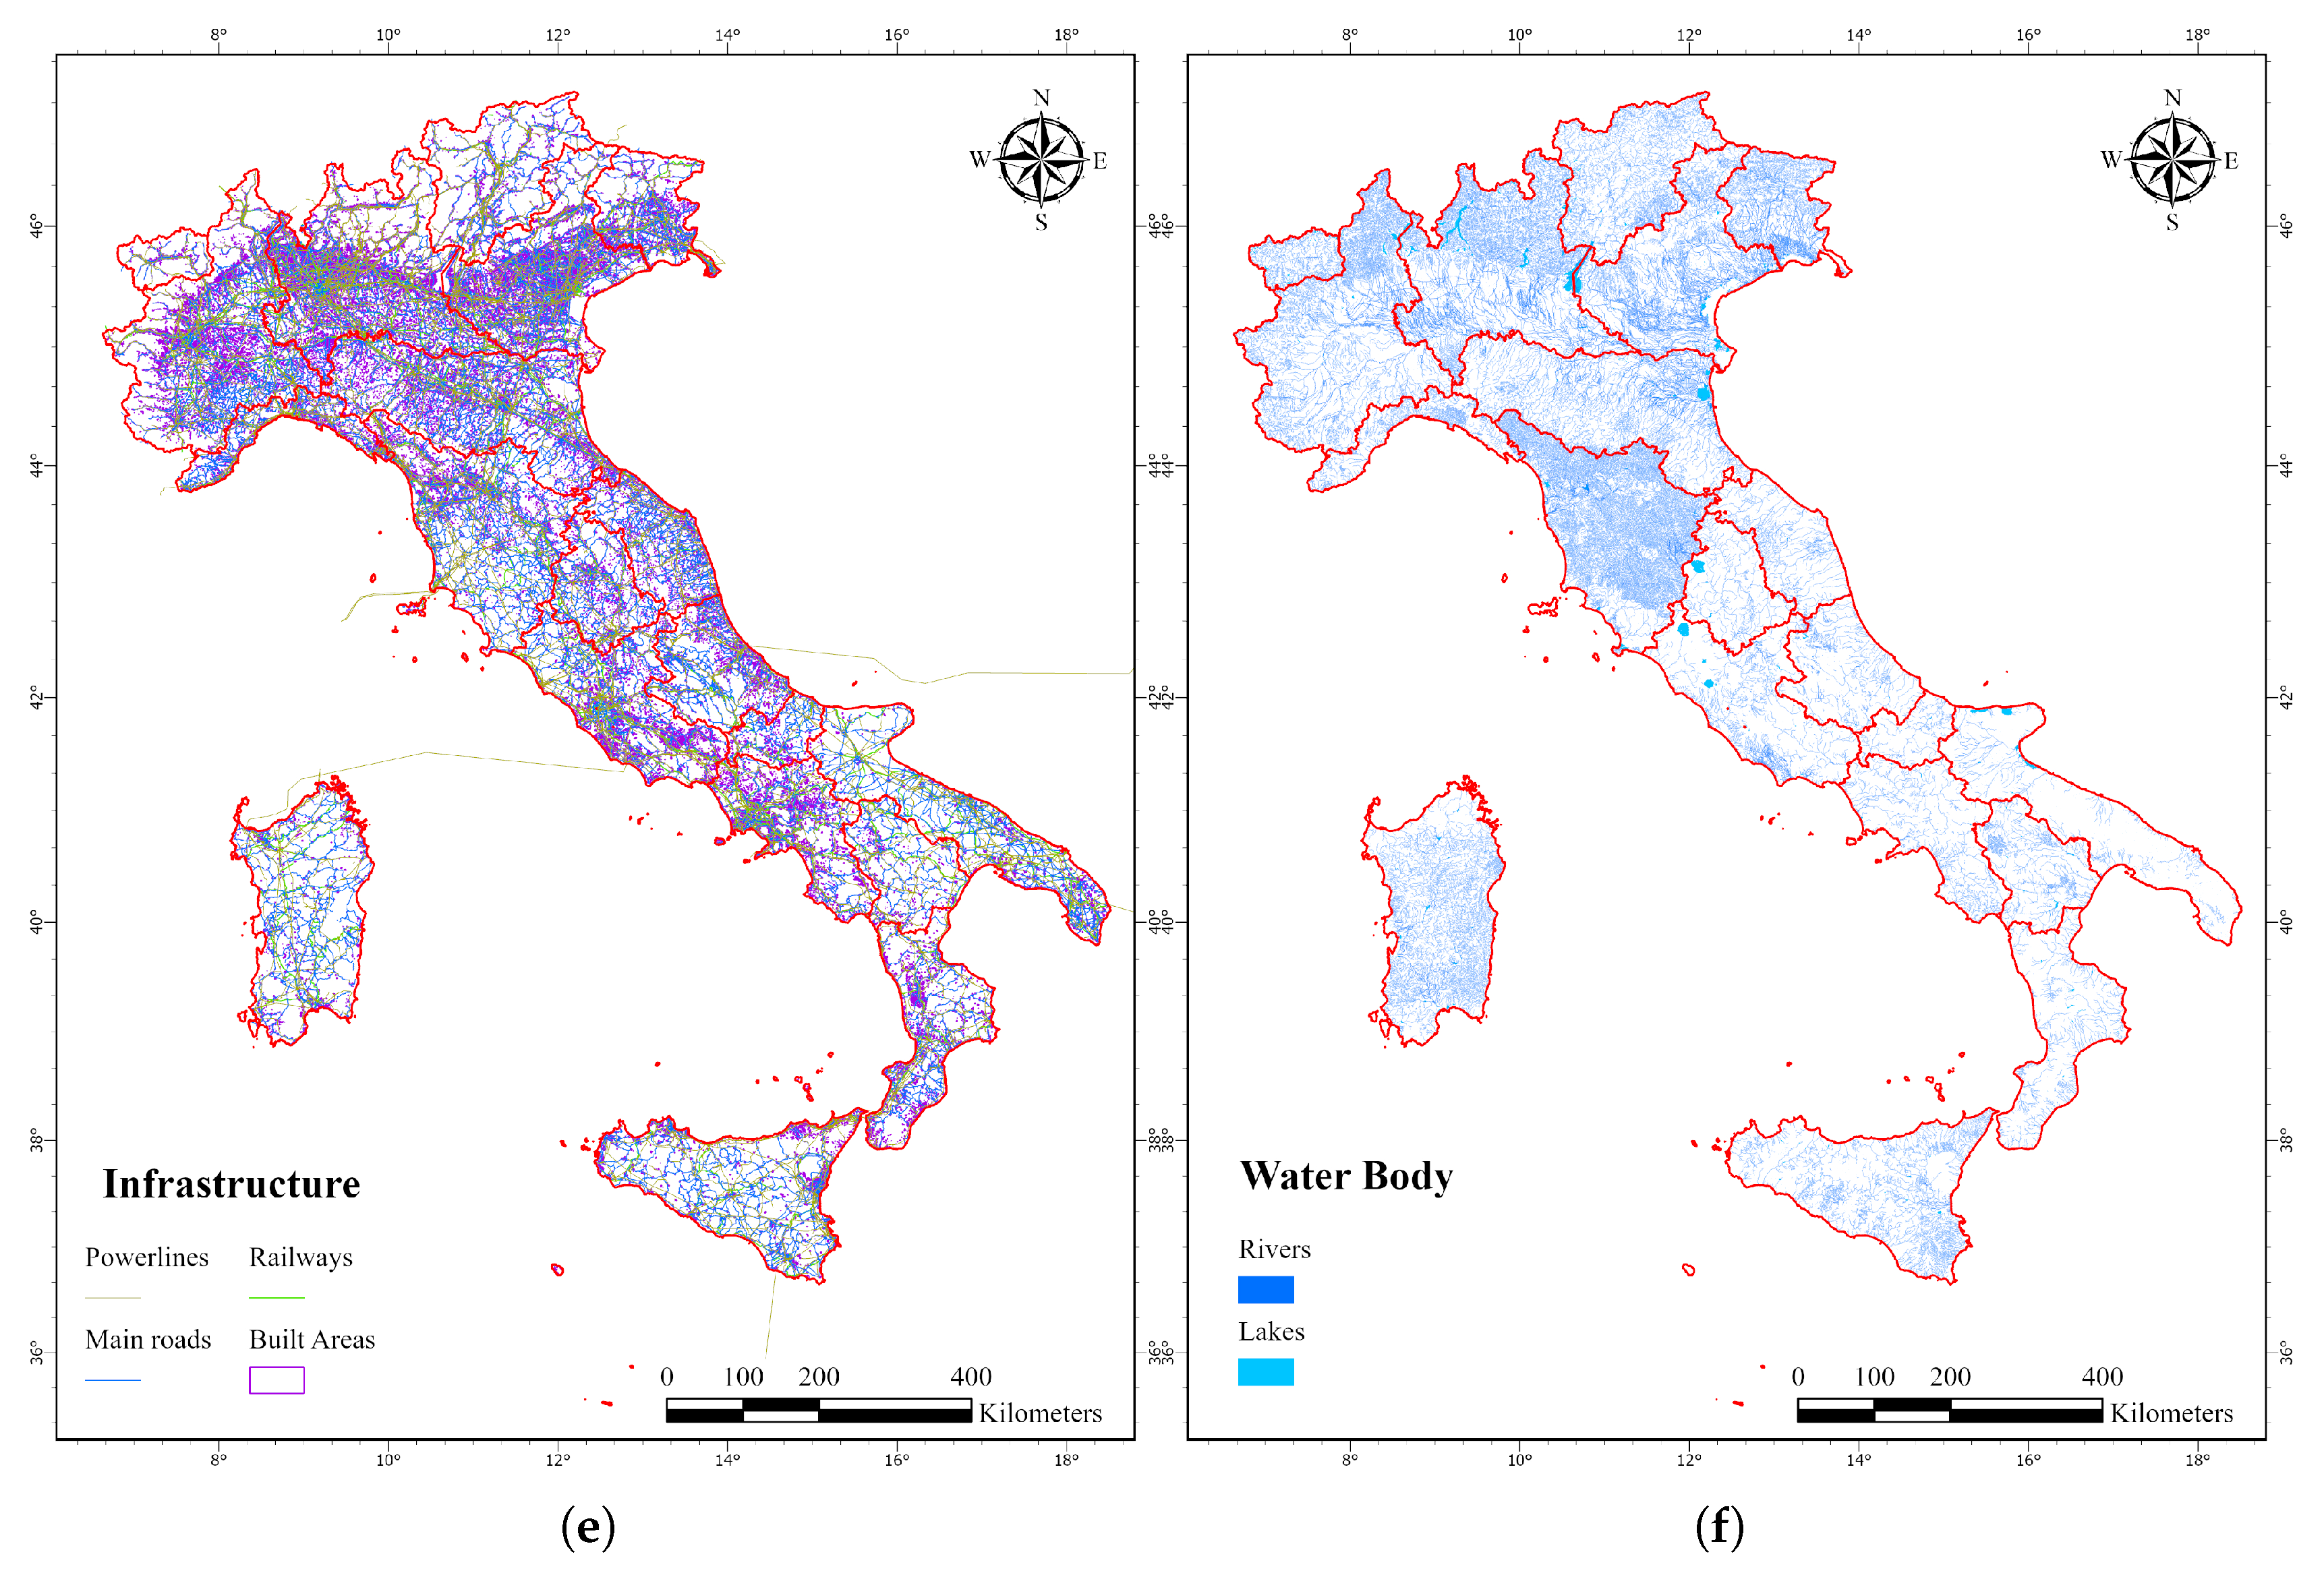
To better understand the geographic distribution of the constraints, six thematic maps were produced—one for each exclusion category (
Figure 5).
These maps highlight spatial patterns specific to each theme. The following are some examples:
Natural and Landscape Assets tend to be more prevalent in the alpine areas and along the central Apennine ridge, mainly due to the high concentration of national parks, Natura 2000 sites, and extensive protected forests and wetlands. In addition, several coastal zones are subject to environmental protection. Southern regions also show a significant presence of natural constraints, reflecting the widespread distribution of protected areas and environmentally sensitive zones across the national territory.
Due to its long and rich historical heritage, Italy is characterized by numerous cultural constraints, with particularly prominent concentrations in the Lazio region—especially around the city of Rome—as well as in Tuscany and Campania, where many cultural landmarks from ancient times are located. Additionally, the regions of the Pianura Padana also present a significant number of cultural constraints, mainly distributed around urban centers and in the areas just below the Alpine foothills.
The Natural Hazards map clearly highlights the regional characteristics of the input data, with most hazards concentrated in the Alpine and Apennine regions, as well as in areas with volcanic activity. Moreover, the southern portion of the Pianura Padana is notably characterized by a high risk of flooding.
Infrastructural Constraints are widespread across the country, especially near major urban centers and transportation corridors, with a higher concentration in the northern regions where the majority of the population is located.
After describing the spatial distribution of the exclusion criteria, the analysis now focuses on how these constraints interact and overlap, providing a more comprehensive understanding of their combined impact on land availability.
The spatial overlay of the six main exclusion criteria—Landscape (LA), Cultural Heritage (CH), Natural Assets (NA), Water Bodies (WB), Infrastructure (IS), and Natural Hazards (NH)—generates a highly intricate pattern of land-use restrictions across the country. This union of layers resulted in 63 unique combinations of overlapping constraints throughout Italy.
In an effort to improve interpretability, we carefully grouped the results into the most dominant individual and combined categories, while aggregating the less frequent combinations into an “Other” category, as shown in the pie chart in
Figure 6.
The results indicate that no single exclusion category dominates the restricted space. Instead, the constraints appear relatively well distributed, with Landscape Assets and Natural Assets representing the most significant contributors (18.34% and 6.85% of the excluded areas, respectively). Natural Hazards also play an important role, contributing 9.14%, followed by Infrastructure (7.21%). Although Cultural Heritage alone covers only 4.21% of the land, it frequently overlaps with other exclusion layers, increasing its overall relevance in the spatial pattern.
This breakdown illustrates how overlapping regulatory zones dominate the spatial pattern of exclusion (more than 55% of the exclusion). The most extensive combination is between Natural Assets and Landscape (12.99%), reflecting the spatial concentration of environmentally and culturally sensitive areas—especially in central and northern Italy. Other significant overlaps include Landscape combined with Natural Hazards (7.99%) and Natural Assets with Natural Hazards (5.40%).
Finally, 22.75% of the excluded areas fall into the “Other” category, which includes more complex combinations of multiple constraints. This distribution confirms the highly composite nature of land-use limitations across the Italian territory, shaped by the interplay of diverse regulatory and environmental factors.
By combining all exclusion categories into a single composite map, we determined the total land area currently restricted from photovoltaic development under existing regulations. The remaining land, i.e., areas not affected by any exclusion criteria, is quantified at both the national and regional levels.
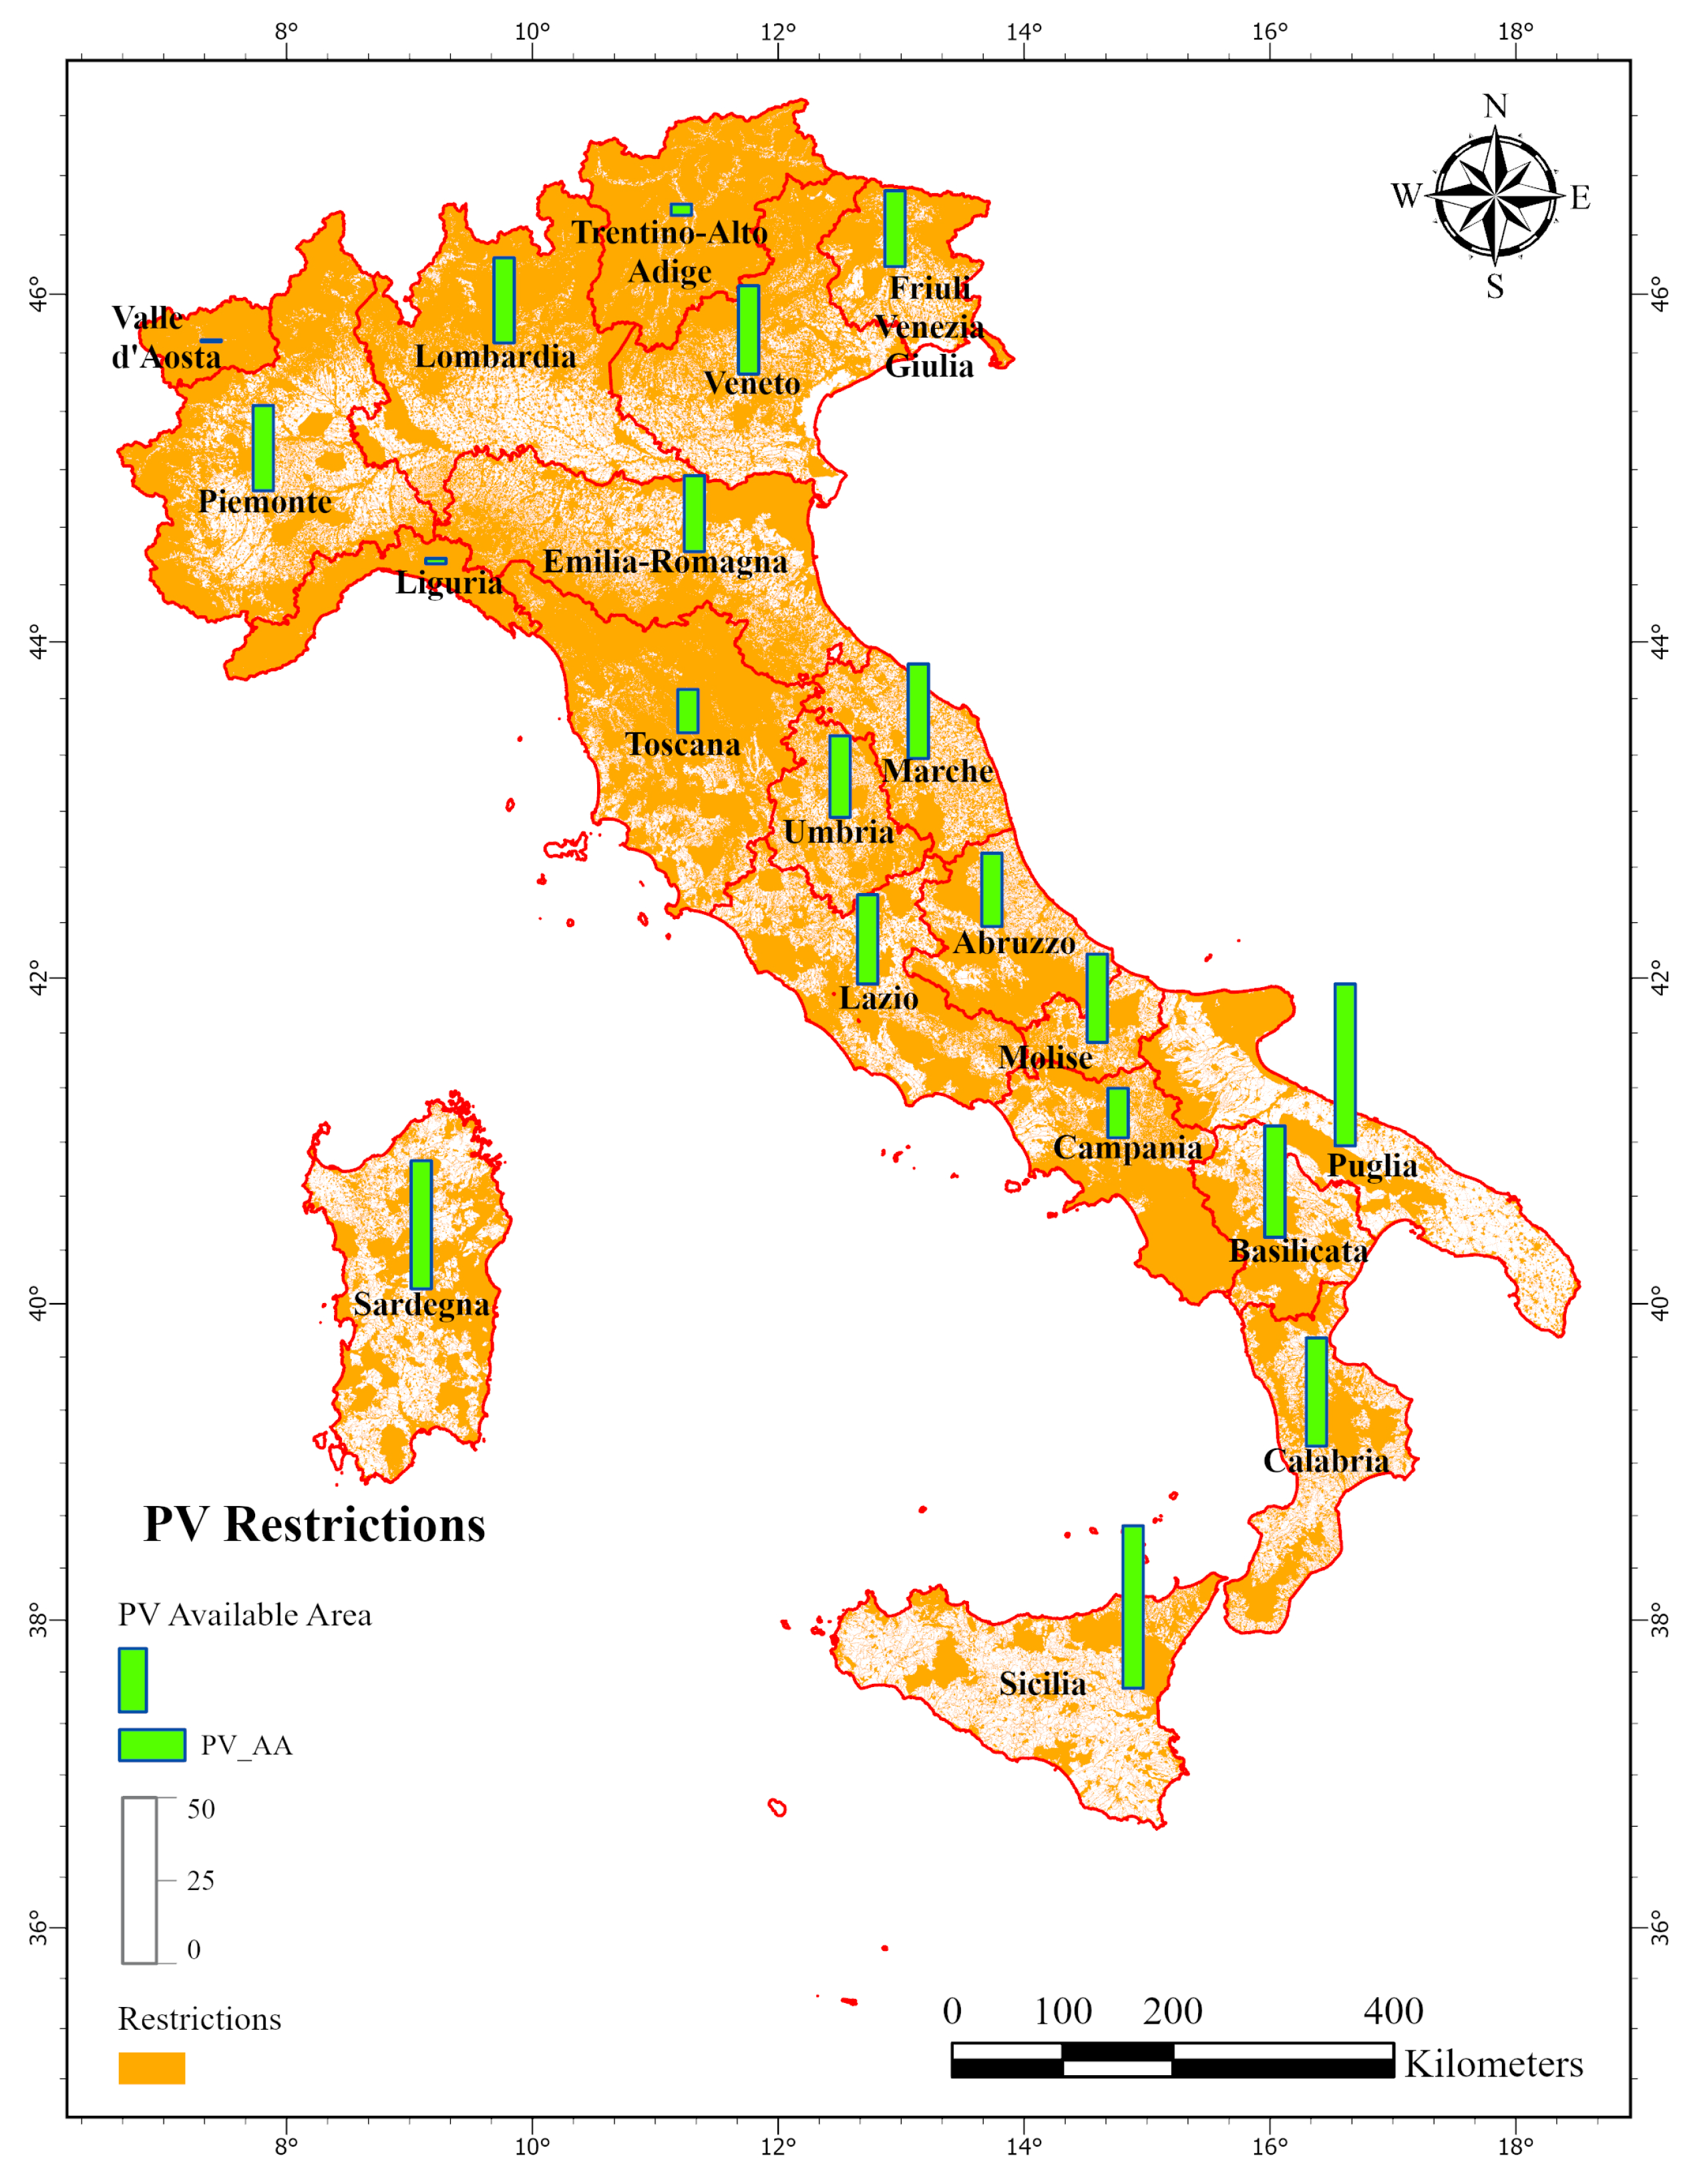
To effectively communicate these findings, a bar chart map (
Figure 7) was developed to illustrate the percentage of available land across all regions. This visual representation clearly highlights the spatial variability in regulatory constraints and serves as a valuable tool for supporting future policy refinements and region-specific planning strategies.
At the national level, only about 26% (≈80,000 km2) of Italy’s land remains available for potential ground-mounted PV installations.
At the regional scale, land availability exhibits considerable variation. Sicilia (48.93%; ≈12,585 km2) and Puglia (48.79%; ≈9443 km2) emerge as the most favorable regions, with nearly half of their territories free from exclusion zones, thus presenting optimal conditions for utility-scale photovoltaic deployment. The significance of land availability in these regions is further underscored by their substantially higher total annual solar radiation compared to northern regions, a result influenced by both their lower latitude and prevailing local climatic conditions. The greater land availability in these regions can be attributed to lower population density and reduced levels of industrialization, as well as the limited presence of forests, which is a consequence of the arid climatic conditions.
Sardegna (38.61%; ≈9313 km2) and Basilicata (33.59%; ≈3356 km2) also offer substantial open land, primarily due to their low population density.
Regions such as Calabria (32.60%; ≈4917 km2), Marche (28.52%; ≈2660 km2), Lazio (26.90%; ≈4628 km2), and Molise (26.62%; ≈1182 km2) exhibit moderate levels of available land, reflecting a balance between development potential and existing land-use constraints.
Northern mountainous regions, such as Liguria (1.66%; ≈90 km2), Valle d’Aosta (0.53%; ≈17 km2), and Trentino-Alto Adige face severe constraints due to a combination of topographic issues, natural protection, and landscape assets.
Piemonte (25.72%; ≈6534 km2), Lombardia (25.68%; ≈6133 km2), Veneto (26.6%; ≈4787 km2), and Emilia Romagna (22.9%; ≈5153 km2) also exhibit a relatively high percentage of land availability, which is advantageous given that much of their territory is flat and suitable for photovoltaic installation. These regions are densely populated and highly industrialized, leading to a substantial energy demand. Although their solar potential is moderate, it remains acceptable from both technical and economic perspectives.
Toscana (13.09%; ≈3010 km2) and Campania (14.93%; ≈2031 km2) are also notably constrained by cultural and landscape designations.
To bridge the gap between technical land availability and realistic deployment potential, we present a scenario matrix (
Table 1) that estimates the installable PV capacity under varying assumptions. The matrix explores three levels of practical land deployment—1%, 3%, and 5% of the total available 80,000 km
2 (i.e., 800, 2400, and 4000 km
2)—combined with three land-use efficiency rates: 35 MWp/km
2 (conservative, low-density layouts), 50 MWp/km
2 (typical), and 65 MWp/km
2 (high-density tracker-based systems). The land efficiency and deployable land portions are derived from previous studies considering different policies, such as traditional ground-mounted PV power plants to agrivoltaics, and are based on existing practices and future projections of further development [
30,
31].
This results in a capacity range from 28 GWp to 260 GWp, highlighting how both physical and techno-economic constraints affect real-world feasibility despite the large theoretical land base. Notably, even in the most conservative scenario (1% of available land at 35 MWp/km2), the estimated capacity (28 GWp) represents more than one-third of Italy’s 2030 PV target of 80 GWp, while moderate assumptions (3% at 50 MWp/km2) are sufficient to fully meet the national goal.
5. Conclusions
This study systematically mapped and quantified the exclusion zones for PV development across Italy, synthesizing constraints from environmental, cultural, landscape, infrastructural, and hazard-related sources. By harmonizing and overlaying geospatial data from authoritative national services and open sources, we revealed the extensive regulatory footprint on land availability.
The findings demonstrate that only approximately 26% of Italy’s territory, approximately 80,000 km2, remains technically eligible for PV installation after accounting for these constraints. This limited availability is not evenly distributed—while southern regions such as Sicilia and Puglia retain relatively high potential, much of the central and northern territory is heavily restricted, particularly by overlapping protections related to landscape and natural heritage.
The analysis presented in this study can support regulatory bodies in better understanding the territorial impact of each exclusion policy, offering a basis for more informed and balanced decision-making. At the same time, it provides valuable insights for companies interested in large-scale photovoltaic deployment, helping to identify the regions with greater land availability and development potential.
However, it remains difficult to provide a general evaluation of the proposed policies, as the analysis reveals significant variability in their effects across different regions. In addition, all the policies should take into consideration several aspects: the energy production, the impact on agricultural production, the impact on local economies and society, and the overall optimization of the electrical grid.
While our exclusion mapping reveals that approximately 26% of Italy’s land area remains technically available for ground-mounted PV development under current regulatory conditions, it is important to emphasize that this figure does not account for dynamic and context-dependent constraints that influence real-world feasibility.
To better capture the range of plausible outcomes under these real-world limitations, we introduced a scenario matrix combining different assumptions about deployable land and land-use efficiency. The resulting PV capacity estimates (from 28 GWp to 260 GWp) help contextualize the extent to which Italy’s 80 GW solar target can be realistically met within the available land envelope.
Future work could expand this analysis by incorporating dynamic constraints (e.g., terrain characteristics, grid proximity, land ownership, and economic feasibility), modeling potential conflict zones, or simulating optimized solar siting under policy reform scenarios. The spatial evidence provided here aims to inform policy discussions and planning decisions by clarifying the actual, mappable limits of the energy transition in Italy.
A key challenge in this type of analysis is the availability and consistency of spatial data, which can vary significantly across regions and sources. To address this limitation, future work could explore the use of Machine Learning models capable of interacting with geospatial data, offering a promising direction to automate and refine land suitability assessments. The integration of such approaches would represent a valuable and natural continuation of the present study.
