
Integration of Solar Photovoltaic Distributed Generators in Distribution Networks Based on Site’s Condition

 , , , ,
  and
and
Abstract
:1. Introduction
2. Review of Relevant Concepts on Optimal Integration of Distributed Generators
3. Models and Methods
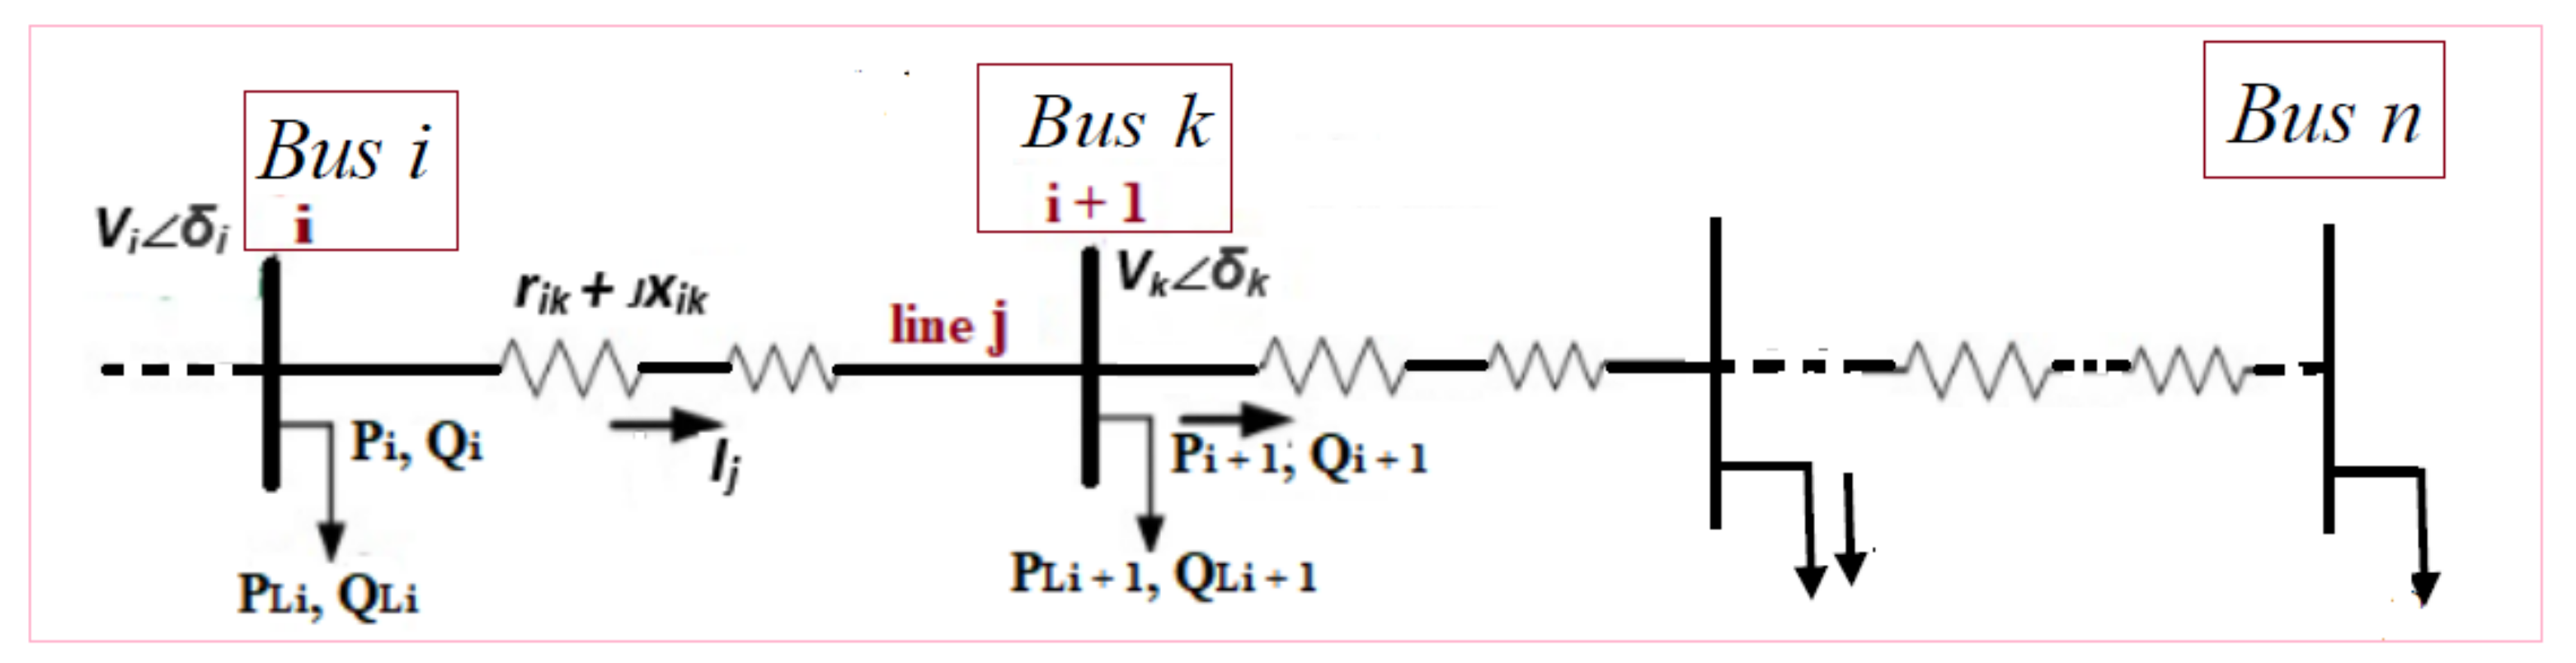
3.1. Backward/Forward Sweep Load Flow for a Radial Distribution System
3.2. Solar PV Modelling and DG Injection Approach
3.3. Problem Formulation and DG Modelling
- Power balance constraint:
- Voltage magnitude limit:
- Current limit constraint:
- DG Capacity Limit:
3.4. Evolutionary Optimization Algorithm
4. Simulation Results and Discussion
5. Conclusions
Author Contributions
Funding
Institutional Review Board Statement
Informed Consent Statement
Data Availability Statement
Acknowledgments
Conflicts of Interest
References
- Ali, E.S.; El-Sehiemy, R.A.; El-Ela, A.; Adel, A.; Mahmoud, K.; Lehtonen, M.; Darwish, M.M. An Effective Bi-Stage Method for Renewable Energy Sources Integration into Unbalanced Distribution Systems Considering Uncertainty. Processes 2021, 9, 471. [Google Scholar] [CrossRef]
- Moradi, M.H.; Abedini, M. A combination of genetic algorithm and particle swarm optimization for optimal DG location and sizing in distribution systems. Int. J. Electr. Power Energy Syst. 2012, 34, 66–74. [Google Scholar] [CrossRef]
- Zsiborács, H.; Pintér, G.; Vincze, A.; Birkner, Z.; Baranyai, N.H. Grid balancing challenges illustrated by two European examples: Interactions of electric grids, photovoltaic power generation, energy storage and power generation forecasting. Energy Rep. 2021, 7, 3805–3818. [Google Scholar] [CrossRef]
- Essallah, S.; Khedher, A. Optimal multi-Type DG integration and distribution system reconfiguration for active power loss minimization using CPSO algorithm. In Proceedings of the 2019 International Conference on Control, Automation and Diagnosis (ICCAD), Grenoble, France, 2–4 July 2019; pp. 1–6. [Google Scholar]
- Ahmadi, M.; Adewuyi, O.B.; Danish, M.S.S.; Mandal, P.; Yona, A.; Senjyu, T. Optimum coordination of centralized and distributed renewable power generation incorporating battery storage system into the electric distribution network. Int. J. Electr. Power Energy Syst. 2021, 125, 106458. [Google Scholar] [CrossRef]
- Reddy, A.S.; Reddy, D.M.D. Application of whale optimization algorithm for distribution feeder reconfiguration. Imanager’s J. Electr. Eng. 2018, 11, 17–24. [Google Scholar]
- Jahromi, M.H.M.; Dehghanian, P.; Khademi, M.R.M.; Jahromi, M.Z. Reactive power compensation and power loss reduction using optimal capacitor placement. In Proceedings of the 2021 IEEE Texas Power and Energy Conference (TPEC), College Station, TX, USA, 2–5 February 2021; pp. 1–6. [Google Scholar]
- Ogunjuyigbe, A.; Ayodele, T.; Akinola, O. Impact of distributed generators on the power loss and voltage profile of sub-transmission network. J. Electr. Syst. Inf. Technol. 2016, 3, 94–107. [Google Scholar] [CrossRef] [Green Version]
- Emara, D.; Ezzat, M.; Abdelaziz, A.Y.; Mahmoud, K.; Lehtonen, M.; Darwish, M.M. Novel Control Strategy for Enhancing Microgrid Operation Connected to Photovoltaic Generation and Energy Storage Systems. Electronics 2021, 10, 1261. [Google Scholar] [CrossRef]
- Ahmadi, M.; Lotfy, M.E.; Shigenobu, R.; Howlader, A.M.; Senjyu, T. Optimal Sizing of Multiple Renewable Energy Resources and PV Inverter Reactive Power Control Encompassing Environmental, Technical, and Economic Issues. IEEE Syst. J. 2019, 13, 3026–3037. [Google Scholar] [CrossRef]
- Wei, Y.M.; Kang, J.N.; Yu, B.Y.; Liao, H.; Du, Y.F. A dynamic forward-citation full path model for technology monitoring: An empirical study from shale gas industry. Appl. Energy 2017, 205, 769–780. [Google Scholar] [CrossRef]
- Adeagbo, A.; Olaniyi, E.; Ofoegbu, E.; Abolarin, A. Solar photo-voltaic system efficiency improvement using unitary-axis active tracking system. Int. J. Sci. Eng. Res. 2020, 11, 502–508. [Google Scholar]
- Adewuyi, O.B.; Ahmadi, M.; Olaniyi, I.O.; Senjyu, T.; Olowu, T.O.; Mandal, P. Voltage security-constrained optimal generation rescheduling for available transfer capacity enhancement in deregulated electricity markets. Energies 2019, 12, 4371. [Google Scholar] [CrossRef] [Green Version]
- Ochoa, L.F.; Keane, A.; Harrison, G.P. Minimizing the reactive support for distributed generation: Enhanced passive operation and smart distribution networks. IEEE Trans. Power Syst. 2011, 26, 2134–2142. [Google Scholar] [CrossRef] [Green Version]
- Ali, Z.M.; Diaaeldin, I.M.; HE Abdel Aleem, S.; El-Rafei, A.; Abdelaziz, A.Y.; Jurado, F. Scenario-based network reconfiguration and renewable energy resources integration in large-scale distribution systems considering parameters uncertainty. Mathematics 2021, 9, 26. [Google Scholar] [CrossRef]
- Nawaz, S.; Bansal, A.K.; Sharma, M.P. A novel DG allocation method for power loss reduction in radial distribution system. In Proceedings of the 2016 IEEE 7th Power India International Conference (PIICON), Bikaner, India, 25–27 November 2016; pp. 1–4. [Google Scholar]
- Suvarchala, K.; Yuvaraj, T.; Balamurugan, P. A brief review on optimal allocation of Distributed Generation in distribution network. In Proceedings of the 2018 4th International Conference on Electrical Energy Systems (ICEES), Chennai, India, 7–9 February 2018; pp. 391–396. [Google Scholar]
- Karunarathne, E.; Pasupuleti, J.; Ekanayake, J.; Almeida, D. Optimal Placement and Sizing of DGs in Distribution Networks Using MLPSO Algorithm. Energies 2020, 13, 6185. [Google Scholar] [CrossRef]
- Adewuyi, O.B.; Adeagbo, A.P.; Adebayo, I.G.; Howlader, H.O.R.; Sun, Y. Modified Analytical Approach for PV-DGs Integration into a Radial Distribution Network Considering Loss Sensitivity and Voltage Stability. Energies 2021, 14, 7775. [Google Scholar] [CrossRef]
- Ouali, S.; Cherkaoui, A. An improved backward/forward sweep power flow method based on a new network information organization for radial distribution systems. J. Electr. Comput. Eng. 2020, 2020, 5643410. [Google Scholar] [CrossRef] [Green Version]
- Rupa, J.A.M.; Ganesh, S. Power Flow Analysis for Radial Distribution System Using Backward/Forward Sweep Method. Int. J. Electr. Comput. Eng. 2014, 8, 1628–1632. [Google Scholar]
- Chang, G.W.; Chu, S.Y.; Wang, H.L. An Improved Backward/Forward Sweep Load Flow Algorithm for Radial Distribution Systems. IEEE Trans. Power Syst. 2007, 22, 882–884. [Google Scholar] [CrossRef]
- Salimon, S.A.; Adepoju, G.A.; Adebayo, I.G.; Adewuyi, O.B.; Amuda, S.O. Simultaneous Placement and Sizing of Distributed Generation Units and Shunt Capacitors on Radial Distribution Systems Using Cuckoo Search Algorithm. Curr. J. Appl. Sci. Technol. 2021, 40, 43–58. [Google Scholar] [CrossRef]
- Bompard, E.; Carpaneto, E.; Chicco, G.; Napoli, R. Convergence of the backward/forward sweep method for the load-flow analysis of radial distribution systems. Int. J. Electr. Power Energy Syst. 2000, 22, 521–530. [Google Scholar] [CrossRef]
- Amara, T.; Asefi, S.; Adewuyi, O.B.; Ahmadi, M.; Yona, A.; Senjyu, T. Technical and economic performance evaluation for efficient capacitors sizing and placement in a real distribution network. In Proceedings of the 2019 IEEE Student Conference on Research and Development (SCOReD), Bandar Seri Iskandar, Malaysia, 15–17 October 2019; pp. 100–105. [Google Scholar] [CrossRef]
- Adewuyi, O.B.; Shigenobu, R.; Senjyu, T.; Lotfy, M.E.; Howlader, A.M. Multiobjective mix generation planning considering utility-scale solar PV system and voltage stability: Nigerian case study. Electr. Power Syst. Res. 2019, 168, 269–282. [Google Scholar] [CrossRef]
- Adewuyi, O.B.; Lotfy, M.E.; Akinloye, B.O.; Howlader, H.O.R.; Senjyu, T.; Narayanan, K. Security-constrained optimal utility-scale solar PV investment planning for weak grids: Short reviews and techno-economic analysis. Appl. Energy 2019, 245, 16–30. [Google Scholar] [CrossRef]
- Moraes, L., Jr.; Bussar, C.; Stoecker, P.; Jacqué, K.; Chang, M.; Sauer, D. Comparison of long-term wind and photovoltaic power capacity factor datasets with open-license. Appl. Energy 2018, 225, 209–220. [Google Scholar] [CrossRef]
- Salimon, S.A.; Aderinko, H.A.; Fajuke, F.I.; Suuti, K.A. Load flow analysis of Nigerian radial distribution network using backward/forward sweep technique. J. VLSI Des. Adv. 2019, 2, 1–11. [Google Scholar]
- Valle, Y.D.; Venayagamoorthy, G.K.; Mohagheghi, S.; Hernandez, J.C.; Harley, R.G. Particle swarm optimization: Basic concepts, variants and applications in power systems. IEEE Trans. Evol. Comput. 2008, 12, 171–195. [Google Scholar] [CrossRef]
- Adewuyi, O.B.; Howlader, H.O.R.; Olaniyi, I.O.; Konneh, D.A.; Senjyu, T. Comparative analysis of a new VSC-optimal power flow formulation for power system security planning. Int. Trans. Electr. Energy Syst. 2020, 30, e12250. [Google Scholar] [CrossRef]
- Talukder, S. Mathematical Modelling and Applications of Particle Swarm Optimization. Ph.D. Thesis, School of Engineering Blekinge Institute of Technology, Karlskrona, Sweden, 2011. [Google Scholar]
- Rathore, A.; Sharma, H. Review on inertia weight strategies for particle swarm optimization. In Proceedings of the Sixth International Conference on Soft Computing for Problem Solving, School of Mathematics, Thapar University, Patiala, India, 13 April 2017; Springer: Singapore, 2017; pp. 76–86. [Google Scholar]
- Vita, V. Development of a decision-making algorithm for the optimum size and placement of distributed generation units in distribution networks. Energies 2017, 10, 1433. [Google Scholar] [CrossRef] [Green Version]
- Nguyen, T.P.; Vo, D.N. Optimal number, location, and size of distributed generators in distribution systems by symbiotic organism search based method. Adv. Electr. Electron. Eng. 2018, 15, 724–735. [Google Scholar] [CrossRef]
- Sultana, S.; Roy, P.K. Multi-objective quasi-oppositional teaching learning based optimization for optimal location of distributed generator in radial distribution systems. Int. J. Electr. Power Energy Syst. 2014, 63, 534–545. [Google Scholar] [CrossRef]
- Dolatabadi, S.H.; Ghorbanian, M.; Siano, P.; Hatziargyriou, N.D. An Enhanced IEEE 33 Bus Benchmark Test System for Distribution System Studies. IEEE Trans. Power Syst. 2020, 36, 2565–2572. [Google Scholar] [CrossRef]


| Case | Base Case | 1 DG | 2 DGs | 3 DGs |
|---|---|---|---|---|
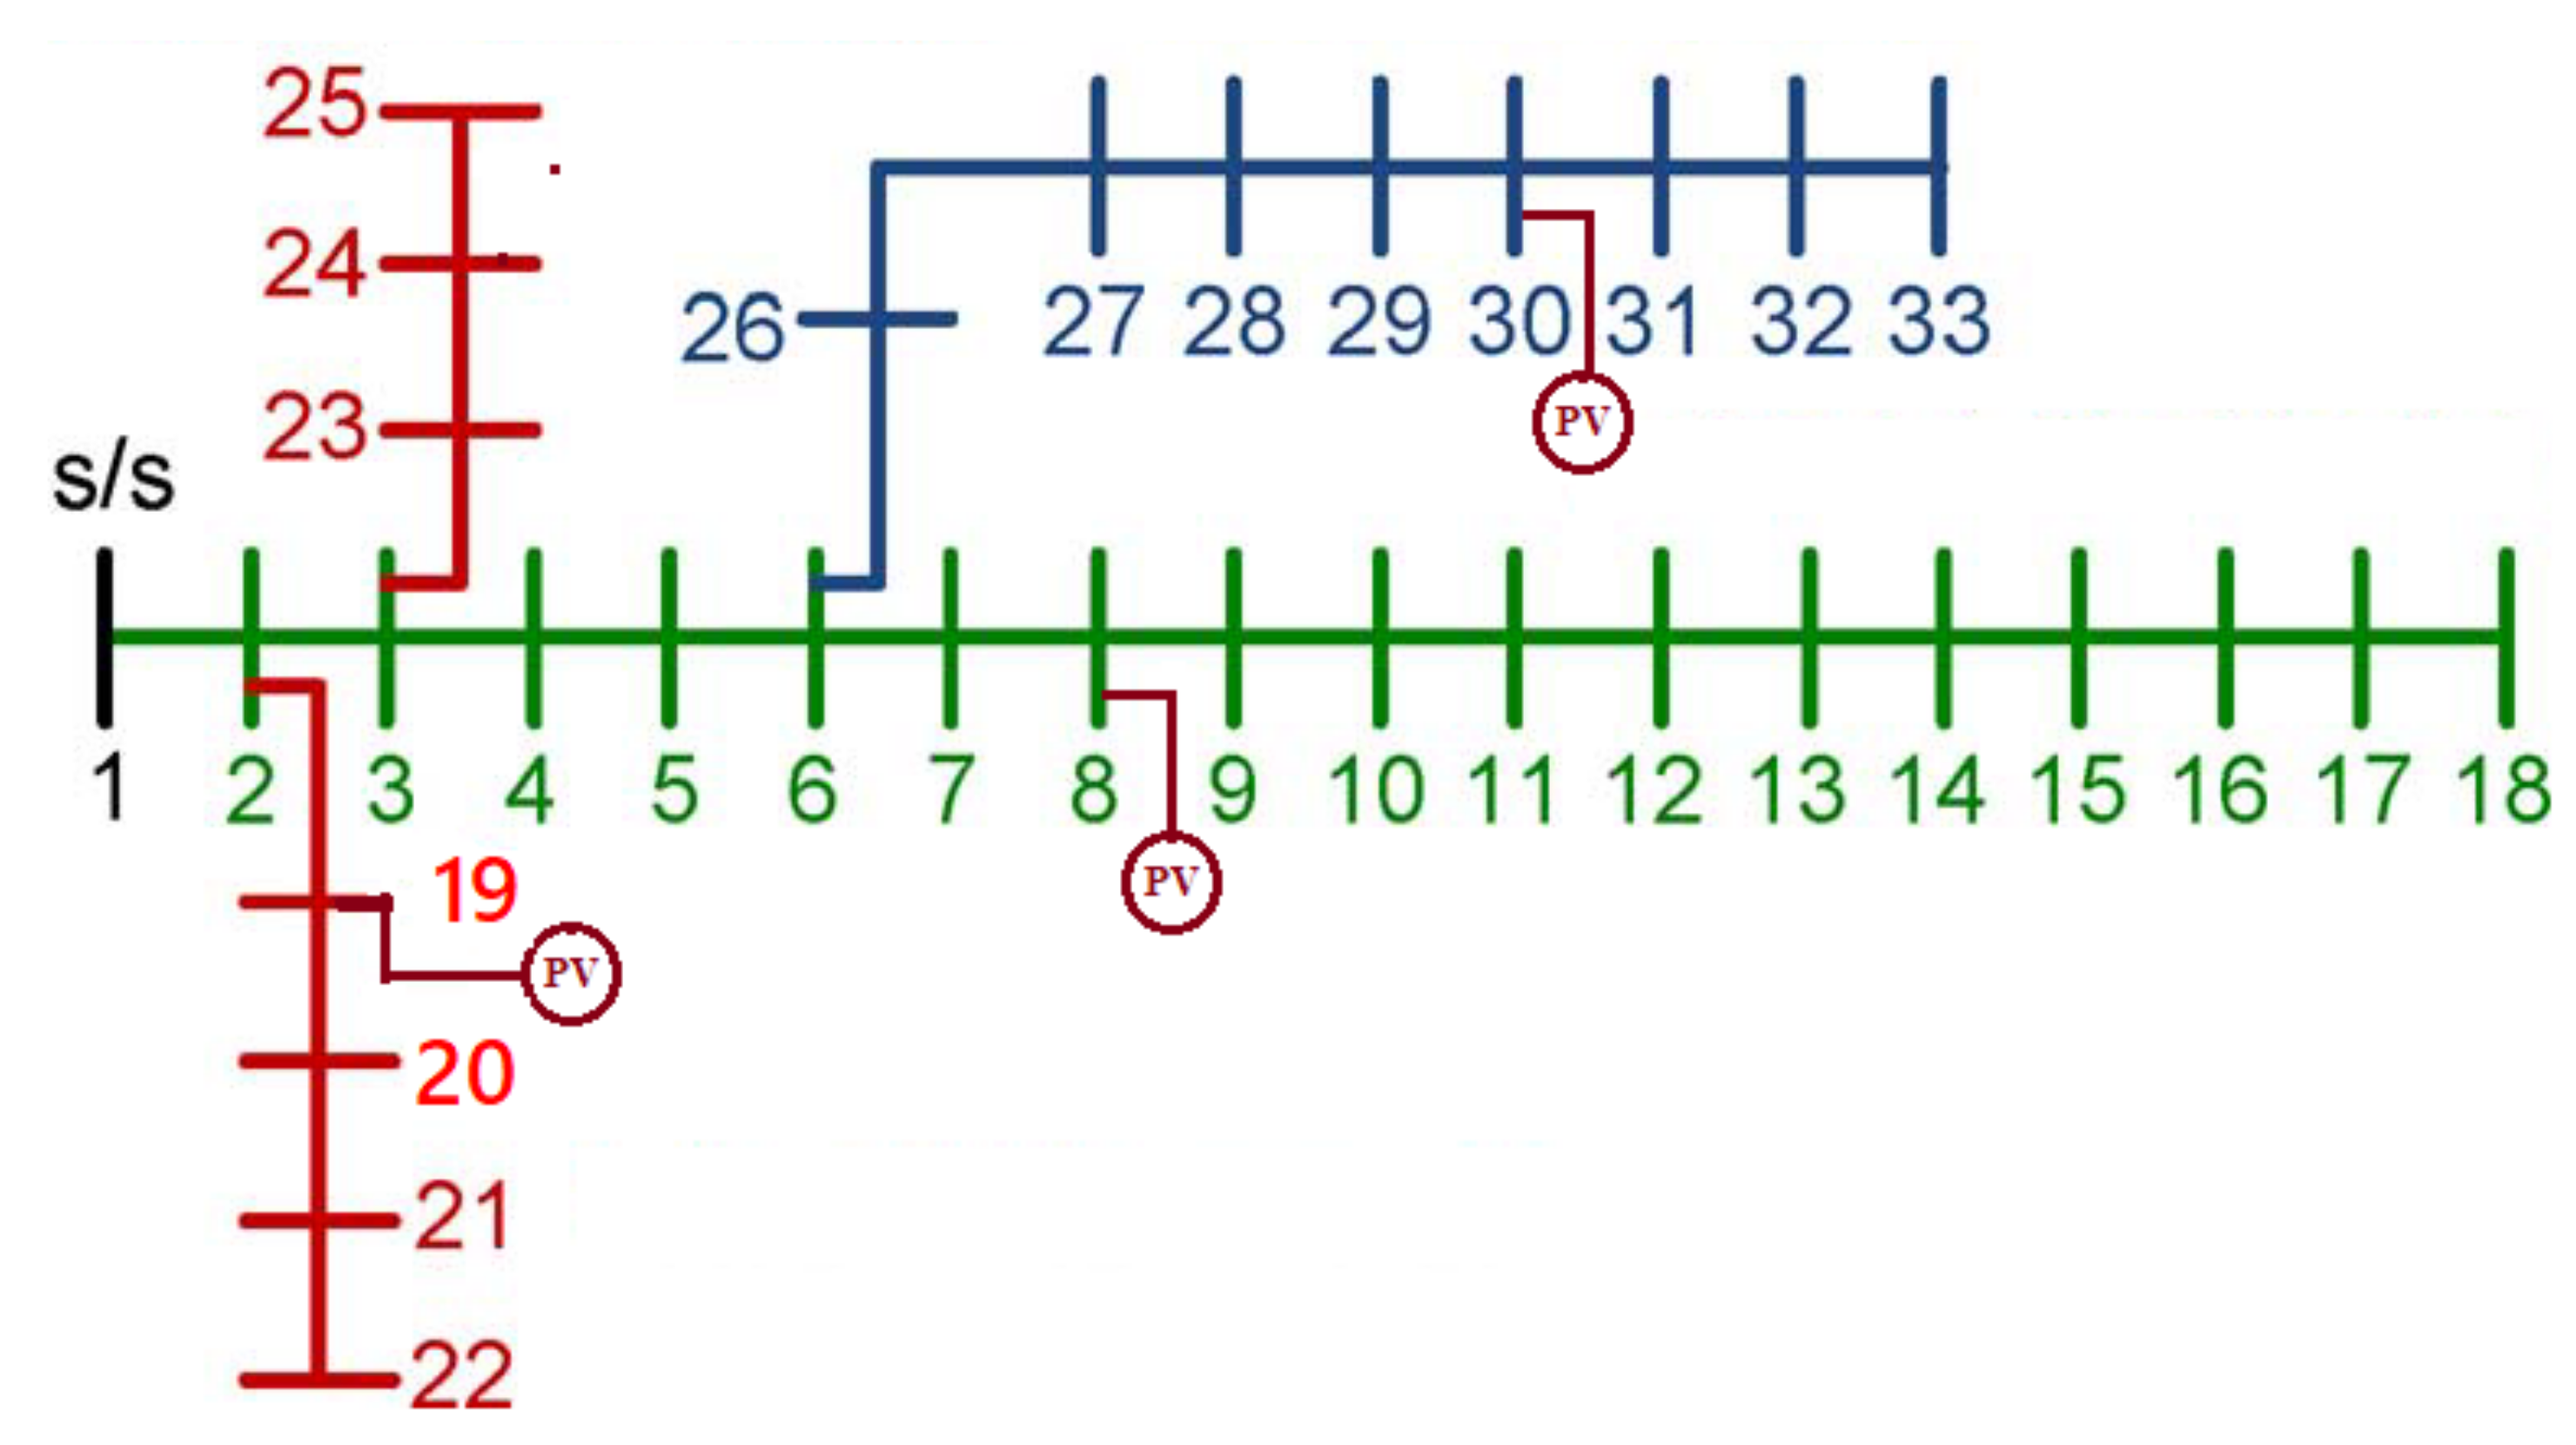
| Optimal Location | - | [8] | [8; 30] | [8; 19; 30] |
| Installed DG (kW) | - | [1725] | [1129; 721] | [1245; 950; 655] |
| Total DG Size (kW) | - | 1725 | 1850 | 2850 |
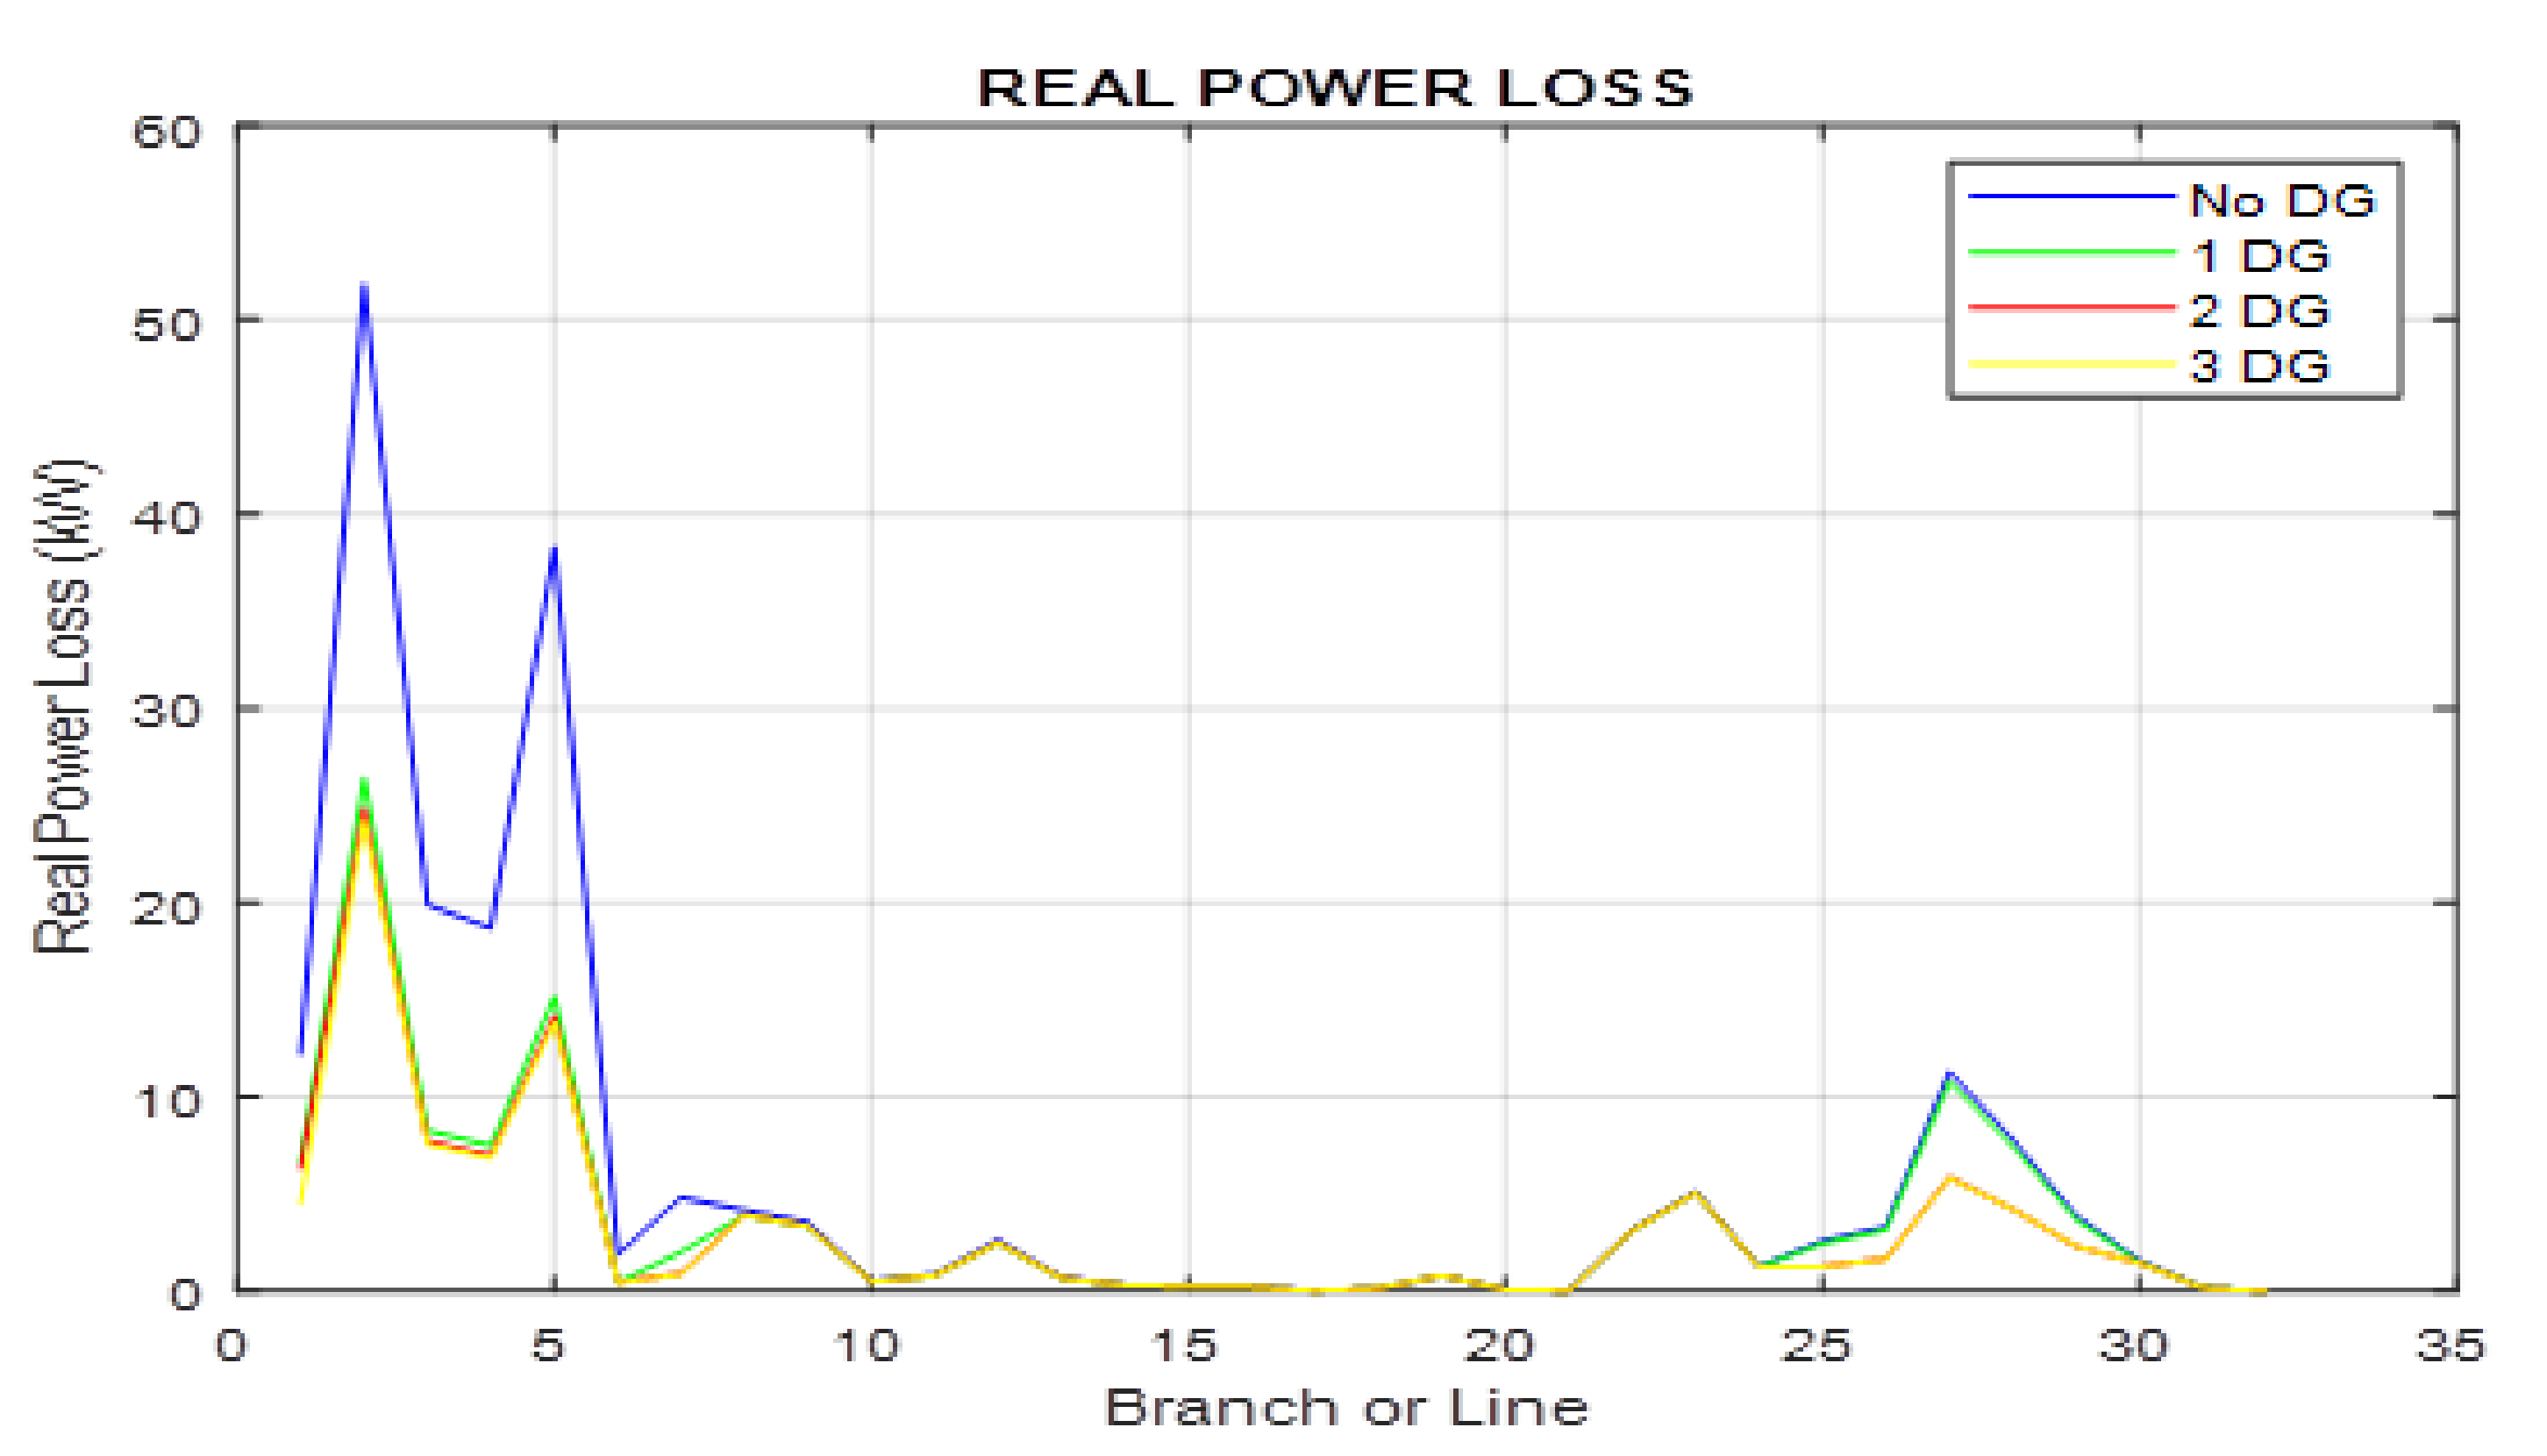
| Total Real Power Loss | 202.66 | 119.26 | 101.94 | 98.94 |
| Total Real Power Loss Reduction | - | 83.39 | 100.72 | 103.72 |
| Real Power Loss Reduction | - | 41.2% | 49.7 | 51.2% |
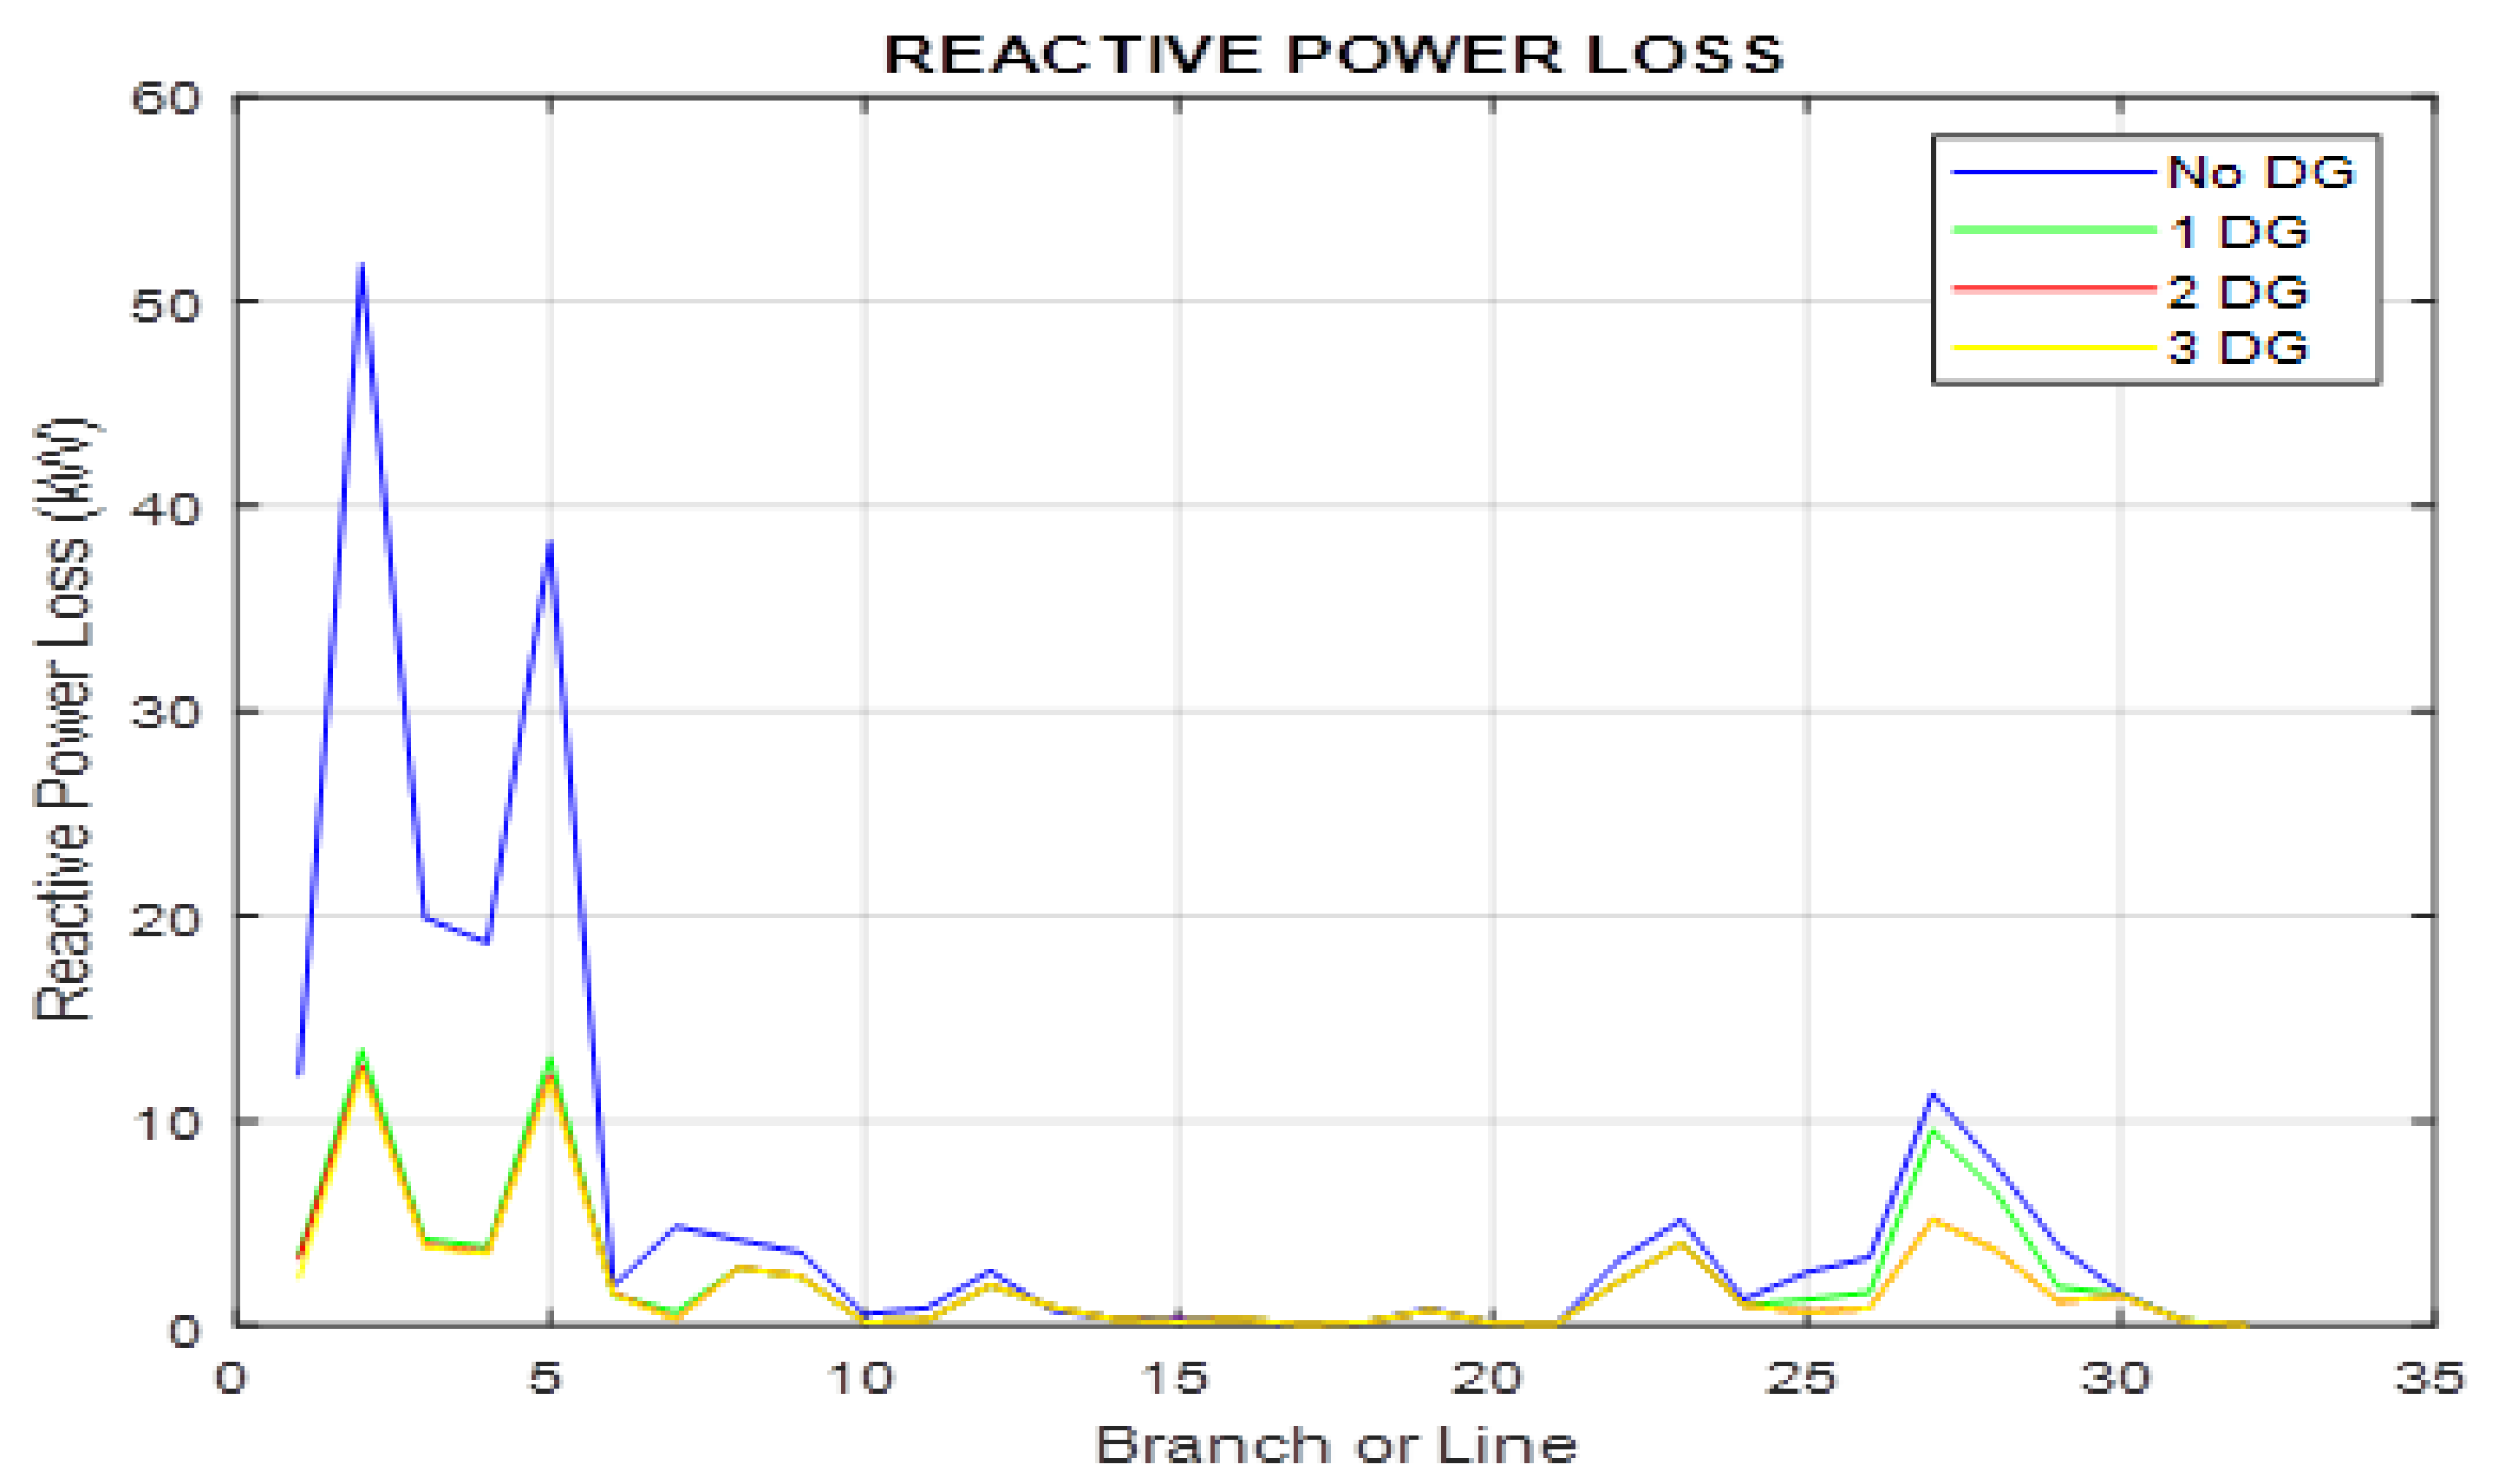
| Total Reactive Power Loss | 135.22 | 80.38 | 68.45 | 66.75 |
| Total Reactive Power Loss Reduction | - | 54.84 | 66.78 | 68.48 |
| Reactive Power Loss Reduction | - | 40.6% | 49.4 | 50.6% |
| Min. Bus Voltage | 0.9131 | 0.9376 | 0.9405 | 0.9416 |
Publisher’s Note: MDPI stays neutral with regard to jurisdictional claims in published maps and institutional affiliations. |
© 2022 by the authors. Licensee MDPI, Basel, Switzerland. This article is an open access article distributed under the terms and conditions of the Creative Commons Attribution (CC BY) license (https://creativecommons.org/licenses/by/4.0/).
Share and Cite
Adeagbo, A.P.; Ariyo, F.K.; Makinde, K.A.; Salimon, S.A.; Adewuyi, O.B.; Akinde, O.K. Integration of Solar Photovoltaic Distributed Generators in Distribution Networks Based on Site’s Condition. Solar 2022, 2, 52-63. https://doi.org/10.3390/solar2010004
Adeagbo AP, Ariyo FK, Makinde KA, Salimon SA, Adewuyi OB, Akinde OK. Integration of Solar Photovoltaic Distributed Generators in Distribution Networks Based on Site’s Condition. Solar. 2022; 2(1):52-63. https://doi.org/10.3390/solar2010004
Chicago/Turabian StyleAdeagbo, Ayooluwa Peter, Funso Kehinde Ariyo, Kehinde Adeleye Makinde, Sunday Adeleke Salimon, Oludamilare Bode Adewuyi, and Olusola Kunle Akinde. 2022. "Integration of Solar Photovoltaic Distributed Generators in Distribution Networks Based on Site’s Condition" Solar 2, no. 1: 52-63. https://doi.org/10.3390/solar2010004
APA StyleAdeagbo, A. P., Ariyo, F. K., Makinde, K. A., Salimon, S. A., Adewuyi, O. B., & Akinde, O. K. (2022). Integration of Solar Photovoltaic Distributed Generators in Distribution Networks Based on Site’s Condition. Solar, 2(1), 52-63. https://doi.org/10.3390/solar2010004