Article

Effects of Tree Leaves, Tannins, and Water Color on Chlorophyll Concentrations in Ponds

1
School of Biological Sciences, Louisiana Tech University, Ruston, LA 71272, USA
2
Edwards Aquifer Research & Data Center, Texas State University, San Marcos, TX 78666, USA
*
Author to whom correspondence should be addressed.
Hydrobiology 2024, 3(3), 263-278; https://doi.org/10.3390/hydrobiology3030017
Submission received: 26 July 2024 / Revised: 30 August 2024 / Accepted: 3 September 2024 / Published: 8 September 2024

Abstract

:
Leaf litter is an important input to freshwater systems. Leaves provide carbon, nutrients, and secondary compounds. We examined the effects of tree leaf species on chlorophyll a concentration—a proxy for phytoplankton biomass. We found that an input of Chinese tallow (Triadica sebiferum, invasive in the southeastern USA) and red maple (Acer rubrum) leaves resulted in lower chlorophyll concentrations than controls and other native species. These leaf species also leached tannins, resulting in a darker water color, and either may have caused the patterns observed. To separate these potential mechanisms (darker water leading to light limitation and tannin toxicity), we conducted a second experiment with a fully factorial design manipulating tannins and water color. We found that darker water resulted in the lowest chlorophyll concentration, suggesting light limitation. In the clear-water treatment, the addition of tannic acid lowered chlorophyll concentrations but also resulted in moderately darker water by the end of the experiment. The tannic acid may have been toxic to the algae, or there may have been some light limitation. Our results suggest that tannins that darken water color may substantially suppress phytoplankton and that tree species composition may influence both phytoplankton and the brownification of freshwater.

1. Introduction

Leaf litter is an important input to many freshwater ecosystems and serves as a source of carbon, nutrients, and secondary compounds [1,2,3]. Leaf input can alter ecosystem processes by changing the balance of primary production and ecosystem respiration. It also shifts community structure to different dominant functional feeding groups by forming the base of the food web [1,4]. The physical and chemical properties of water change when compounds leach from leaves, and these changes affect aquatic organisms. The leaching of nutrients fuels primary and secondary production, but other changes in water chemistry can also affect these processes. Some compounds like tannins [5,6,7,8] and terpenes [9] can be toxic to a variety of animals, but also to algae [10,11].
Phytoplankton is another important carbon source that provides energy and nutrients to higher trophic levels. Phytoplankton production is necessary to support pelagic food webs and many fish species [12]. However, excessive quantities of algae can degrade ecosystem health through eutrophication [13,14,15]. Toxic algal blooms in particular pose severe health risks [16] and have been steadily increasing through time in the United States [17]. Toxins from algae can jeopardize the use of surface waters for drinking, contaminate fisheries, and restrict recreation.
While we tend to think about aquatic systems as having either brown or green food webs, there are many systems where these food webs are connected and rely on both decomposing leaves and algae for secondary production [18,19]. Many freshwater systems are large enough that their margins are surrounded by forest and receive substantial leaf input, while their center has a canopy gap that allows in light that supports photosynthesis [20,21]. In closed-canopy systems in deciduous forests, there is substantial light availability for algae during winter and early spring when trees have no leaves, especially in warmer areas that are ice-free during much of the winter.
Different decomposing leaf species have different effects on freshwater organisms [22,23,24]. There is evidence that certain species of leaves suppress phytoplankton [23,25] and that at least some of these effects may be due to the leaching of tannins [22] or phenolics that include tannins [26]. Tannins are the most common secondary metabolite in plants and are present in different concentrations in tree leaves depending on the species [27]. Tannins are known to affect decomposition rates [28] and the assimilation of leaf material by detritivores [29], but they also leach into the water and can affect many aquatic organisms that do not directly consume leaves. Tannins can be toxic to organisms through oxidation and by binding to proteins or metals [27]. Toxicity to algae has been documented and includes damaging cell membranes, binding to metals needed to synthesize enzymes, and reducing chlorophyll content [7,11].
Beyond toxicity, tannins can also be colored molecules that result in water browning [30] (Edwards and Earl, unpublished data), which may result in light limitation for photosynthesis [31,32]. Water browning or brownification is a topic of growing interest [33,34] as changes in land use and increased precipitation from climate change result in the greater leaching of organic compounds from terrestrial to aquatic ecosystems [35,36]. Darker water can block photosynthetically active radiation, particularly the blue light [12] used by green algae and diatoms [32]. More information is needed on how different species of tree leaves affect phytoplankton and whether light limitation and/or tannin toxicity is responsible.
To better understand the impacts of leaf litter on phytoplankton, we examined the effects of senescent leaves from five tree species that vary in leaf tannin content on chlorophyll a concentration, which is a proxy for algal biomass. We conducted this experiment without the addition of consumers to isolate effects on phytoplankton. We included four species of leaves that were native to Louisiana: American beech (Fagus grandifolia), loblolly pine (Pinus taeda), sweetgum (Liquidambar styraciflua), and red maple (Acer rubrum), and one non-native, invasive species: Chinese tallow (Triadica sebifera), which is now the fifth-most-common tree in Louisiana [37,38]. Leaf-litter species can have large effects on aqueous tannin concentrations and water color, so we performed a second experiment to examine and isolate these as possible mechanisms at realistic levels found in ponds. We used tannic acid as a model tannin, because it has minimal color when dissolved in water. Finally, we used a handheld fluorometer to measure chlorophyll a. Because these meters rely on optical readings, water color can interfere and inflate estimates, so we also present a method we developed to correct for water-color interference using spectrophotometer-based water-color measurements.

2. Materials and Methods

2.1. Effects of Leaf Litter on Chlorophyll Concentrations

To examine the effects of tree leaf species on phytoplankton, we established 24 mesocosms in buckets (Figure S1) with six treatments: a control with no leaves added and five separate treatments each with a different species of tree leaves, including sweetgum (Liquidambar styraciflua), American beech (Fagus grandifolia), red maple (Acer rubrum), loblolly pine (Pinus taeda), and Chinese tallow (Triadica sebifera). Each of these treatments was replicated four times. Sweetgum, American beech, red maple, and loblolly pine are all common, native species of trees frequently found adjacent to ponds and streams in Louisiana. Chinese tallow is an invasive species that is now the fifth-most-common tree in Louisiana and is also found frequently around freshwater [37]. We chose these species because they represent a realistic input to freshwater ecosystems in northern Louisiana and due to their differences in tannin concentration. Chinese tallow has high concentrations of tannins and thin leaves that decompose rapidly [39]. Loblolly pine and American beech leaves have low concentrations of tannins, while sweetgum and red maple have intermediate concentrations [40]. Loblolly pine also has a thick outer cuticle and high C:N, causing slow decomposition rates. American beech leaves also decompose relatively slowly, red maple leaves decompose much more quickly, and sweetgum leaves decompose at an intermediate rate [41]. These differences likely cause temporal differences in nutrient availability for phytoplankton growth.
We collected freshly senescent leaves in fall 2022 at the Louisiana Tech University Arboretum (32.509309°, −92.649911°) by placing a tarp under trees and gently shaking them to loosen leaves that had already senesced but not yet completely abscised. This method allowed us to collect leaves that had not yet begun to decompose or leach chemical compounds. Leaves were then rinsed to remove any dirt, placed into aluminum pans, and dried at 35–40 °C for 48–72 h in a drying oven. Samples from these leaves were taken to determine the chemical composition of the leaves used in the experiment. The tannin concentrations within the leaves were estimated by first grinding up the leaves. We then placed 0.3 g of ground leaves in 600 mL of water and allowed the chemical compounds to leach out into the water for 72 h. We sampled this water, filtering samples through 0.7 µm pore-size (AP40 filters, Millipore Sigma, Burlington, MA, USA) glass-fiber filters, and then measured the tannin concentration with the Tyrosine (Tannin–Lignin) method [42] using the Tanniver reagent (Hach, Ames, IA, USA) and a portable spectrophotometer (Hach DR 3900, Ames, IA, USA). These reagents will also bind to phenol and other hydroxylated aromatic compounds, so while typically expressed as mg/L tannins, the values may be inflated due to other phenolic or aromatic compounds. We additionally sent 5 g dried leaf samples to Louisiana State University’s Agriculture Center’s Soil Testing and Plant Analysis Lab. Samples were analyzed for nitrogen and carbon using a CN Analyzer (LECO, St. Joseph, MI, USA) following the Dumas dry-combustion procedure. Phosphorus and potassium were analyzed using inductively coupled plasma mass spectrometry [43].
On 26 June 2023, we added 12 L of water to each bucket and covered each mesocosm with mesh (2 mm openings) to keep out plant material and insects (Figure S1). Each bucket was randomly assigned a treatment. The water was then left for 24 h to dechlorinate, and on 27 June, 12 g of leaves (except controls) and 200 mL of pond water were added to each bucket. The concentration of leaves in the water (1 g/L) is similar to that of ponds in the area and previous experiments (e.g., [4,22]). The pond water served to inoculate the buckets with phytoplankton to quickly initiate realistic communities. Pond water was collected from an open-canopy pond on Louisiana Tech University’s South Campus and run through a krill net to remove animals.
The experiment ran for 5 weeks, during which we added dechlorinated water as necessary to maintain the initial water levels and removed any matter on the mesh to avoid the accidental introduction of additional nutrients. Every seven days, starting from 30 June at 9 a.m., the pH (EcoSense pH10A, YSI, Yellow Springs, OH, USA), dissolved oxygen (to 0.1 mg/L; ODO200, YSI), and conductivity (to 0.1 µS/cm; Pocket Pro CondLR Tester, Hach, Loveland, CO, USA) were measured. We also measured water depth and temperature (ODO200). We measured chlorophyll a with a handheld fluorometer (to 1 µg/L up to 199 µg/L; FluoroSense, Turner Designs, San Jose, CA, USA) that was shown to be accurate and unaffected by light conditions in an independent assessment [44]. We also took 60 mL water samples filtered through 0.7 µm pore-size glass-fiber filters to estimate aqueous tannin concentrations (as above) and water color. Water color was measured by placing a filtered water sample in the spectrophotometer (Hach DR3900), measuring the absorbance at 436, 525, and 620 nm, and summing these values (ISO 7887; GB 11903).
We adjusted chlorophyll a estimates using data on water color. Both colored dissolved organic matter (CDOM) and turbidity can interfere with the chlorophyll a concentration estimates of fluorometers [45,46], but turbidity was not a primary concern in our studies because we did not add sediment to our experimental units. To estimate the interference from CDOM, we measured the fluorescence of filtered water (0.7 µm pore-size glass-fiber filters) that would have removed all algal cells [47,48] on 21 July using the FluoroSense meter. We measured the water color of the same samples as above and fit a quadratic regression predicting CDOM interference from water color. The estimate of CDOM interference was then subtracted from the FluoroSense measurements on unfiltered water in the experimental units for weeks two through five. We did not measure water color in week one of the experiment, and therefore, we were not able to use chlorophyll estimates from that sampling date.

2.2. Effects of Water Color and Tannins on Chlorophyll Concentration

To separate the possible impacts of tannins and water color on chlorophyll concentration in ponds, we performed a second experiment in buckets at the same location. We established a fully factorial experiment with two treatments: tannins (0 mg/L or 10 mg/L) and water color (clear/no dye or brown dye added). We chose 10 mg/L tannins because it represented a moderately high but realistic concentration of tannins in freshwater [49,50]. We had five replicates of each treatment combination, and we randomly assigned treatments to each bucket. We added 12 L of water to each bucket on 18 September 2023 and allowed water to dechlorinate for approximately 3 d. We collected pond water from a pond on Louisiana Tech University’s South Campus and added 200 mL to each bucket on 21 September to establish a natural community of pond phytoplankton. Water was filtered with a krill net to remove any invertebrates and debris but to retain pond phytoplankton. We also added 12 g of alfalfa pellets to each bucket to provide nutrients to sustain phytoplankton populations. Treatments were established on 22 September by adding the appropriate volume of concentrated tannic acid (Alfa Aesar, Ward Hill, MA, USA) dissolved in water to buckets receiving the 10 mg/L tannic acid treatment, and 1 mL of brown food dye (Buckeye Brown liqua-gel® food color, Chefmaster, Byrnes and Kiefer, Fullerton, CA, USA) was added to the pools receiving the brown water-color treatment. We used a food dye because they are generally nontoxic, particularly at the low concentration of food color used (1 mL in 12 L of water, of which only a small portion of the food color was the dye; for a list of ingredients, see Supplementary Material, Table S1). Tannic acid was chosen because it is a commercially available tannin that minimally changes water color (Earl, pers. obs.). The amount of brown dye added resulted in approximately 1.00 absorbance units (AU) using the above method. We have measured similar color values in a forested pond in Kisatchie National Forest, Louisiana, USA (Earl and Medlock, unpubl. data).
Once a week for 5 weeks, we measured the water depth, temperature, and chlorophyll concentration (using the FluoroSense meter, as above). Preliminary data suggested that the water-color corrections used above did not apply when using the food dye as a treatment (Figure 1), so we also took 120 mL filtered (0.7 µm pore size, as above) water samples and measured the chlorophyll a concentration of these samples. The filtered chlorophyll a measurements were subtracted from the unfiltered estimates to correct for chlorophyll meter absorbance due to water color—a commonly used method to correct optical chlorophyll a estimates [45,47,48]. Tannin concentrations were also estimated from these samples using the Tyrosine method, as above.
To maintain the tannin treatment through time and compensate for tannin degradation, we added additional concentrated tannic acid to buckets receiving the tannic acid treatment based on the measurements that week. In week one, we discovered that our brown food dye likely had some organic compounds present that bound to our reagents, as shown from our water samples, though at the time, we thought they were tannins. We did test for spectrophotometer interference from the brown color, ferrous iron, and sulfites, but none of these accounted for the supposed tannins measured in the samples. An investigation of the ingredients (Table S1) in the food color revealed that some of the dyes were hydroxylated aromatic compounds that could bind to our reagents. Because we did not realize that this interference was likely not from tannins and from other compounds in the dye, we added concentrated tannic acid in different amounts to the clear water + tannic acid and the brown water + tannic acid treatment combinations to reach target concentrations. This may have resulted in slightly higher tannin concentrations in the brown water + tannic acid treatment than the clear water + tannic acid treatment, because the Tyrosine method is not specific to tannins. Finally, we measured the water color in weeks one and five of the experiment using the same method as above.

2.3. Statistical Analyses

ANOVAs were used to examine differences in leaf chemistry by species. Repeated-measures ANOVAs were used to examine changes in chlorophyll concentrations, water color, water tannin concentrations, temperature, and depth through time for each experiment. In the leaf species experiment, we also performed repeated-measures ANOVAs on dissolved oxygen, pH, and conductivity and examined the correlations between water chemical and physical variables. When the sphericity assumption was violated, we report the adjusted degrees of freedom and p-values based on the Huynh–Feldt correction [51], which corrects for the sphericity violation, is more efficient, and has greater power than the Greenhouse–Geiser correction [52]. All statistics were performed in SPSS version 28 (IBM, Armonk, NY, USA).

3. Results

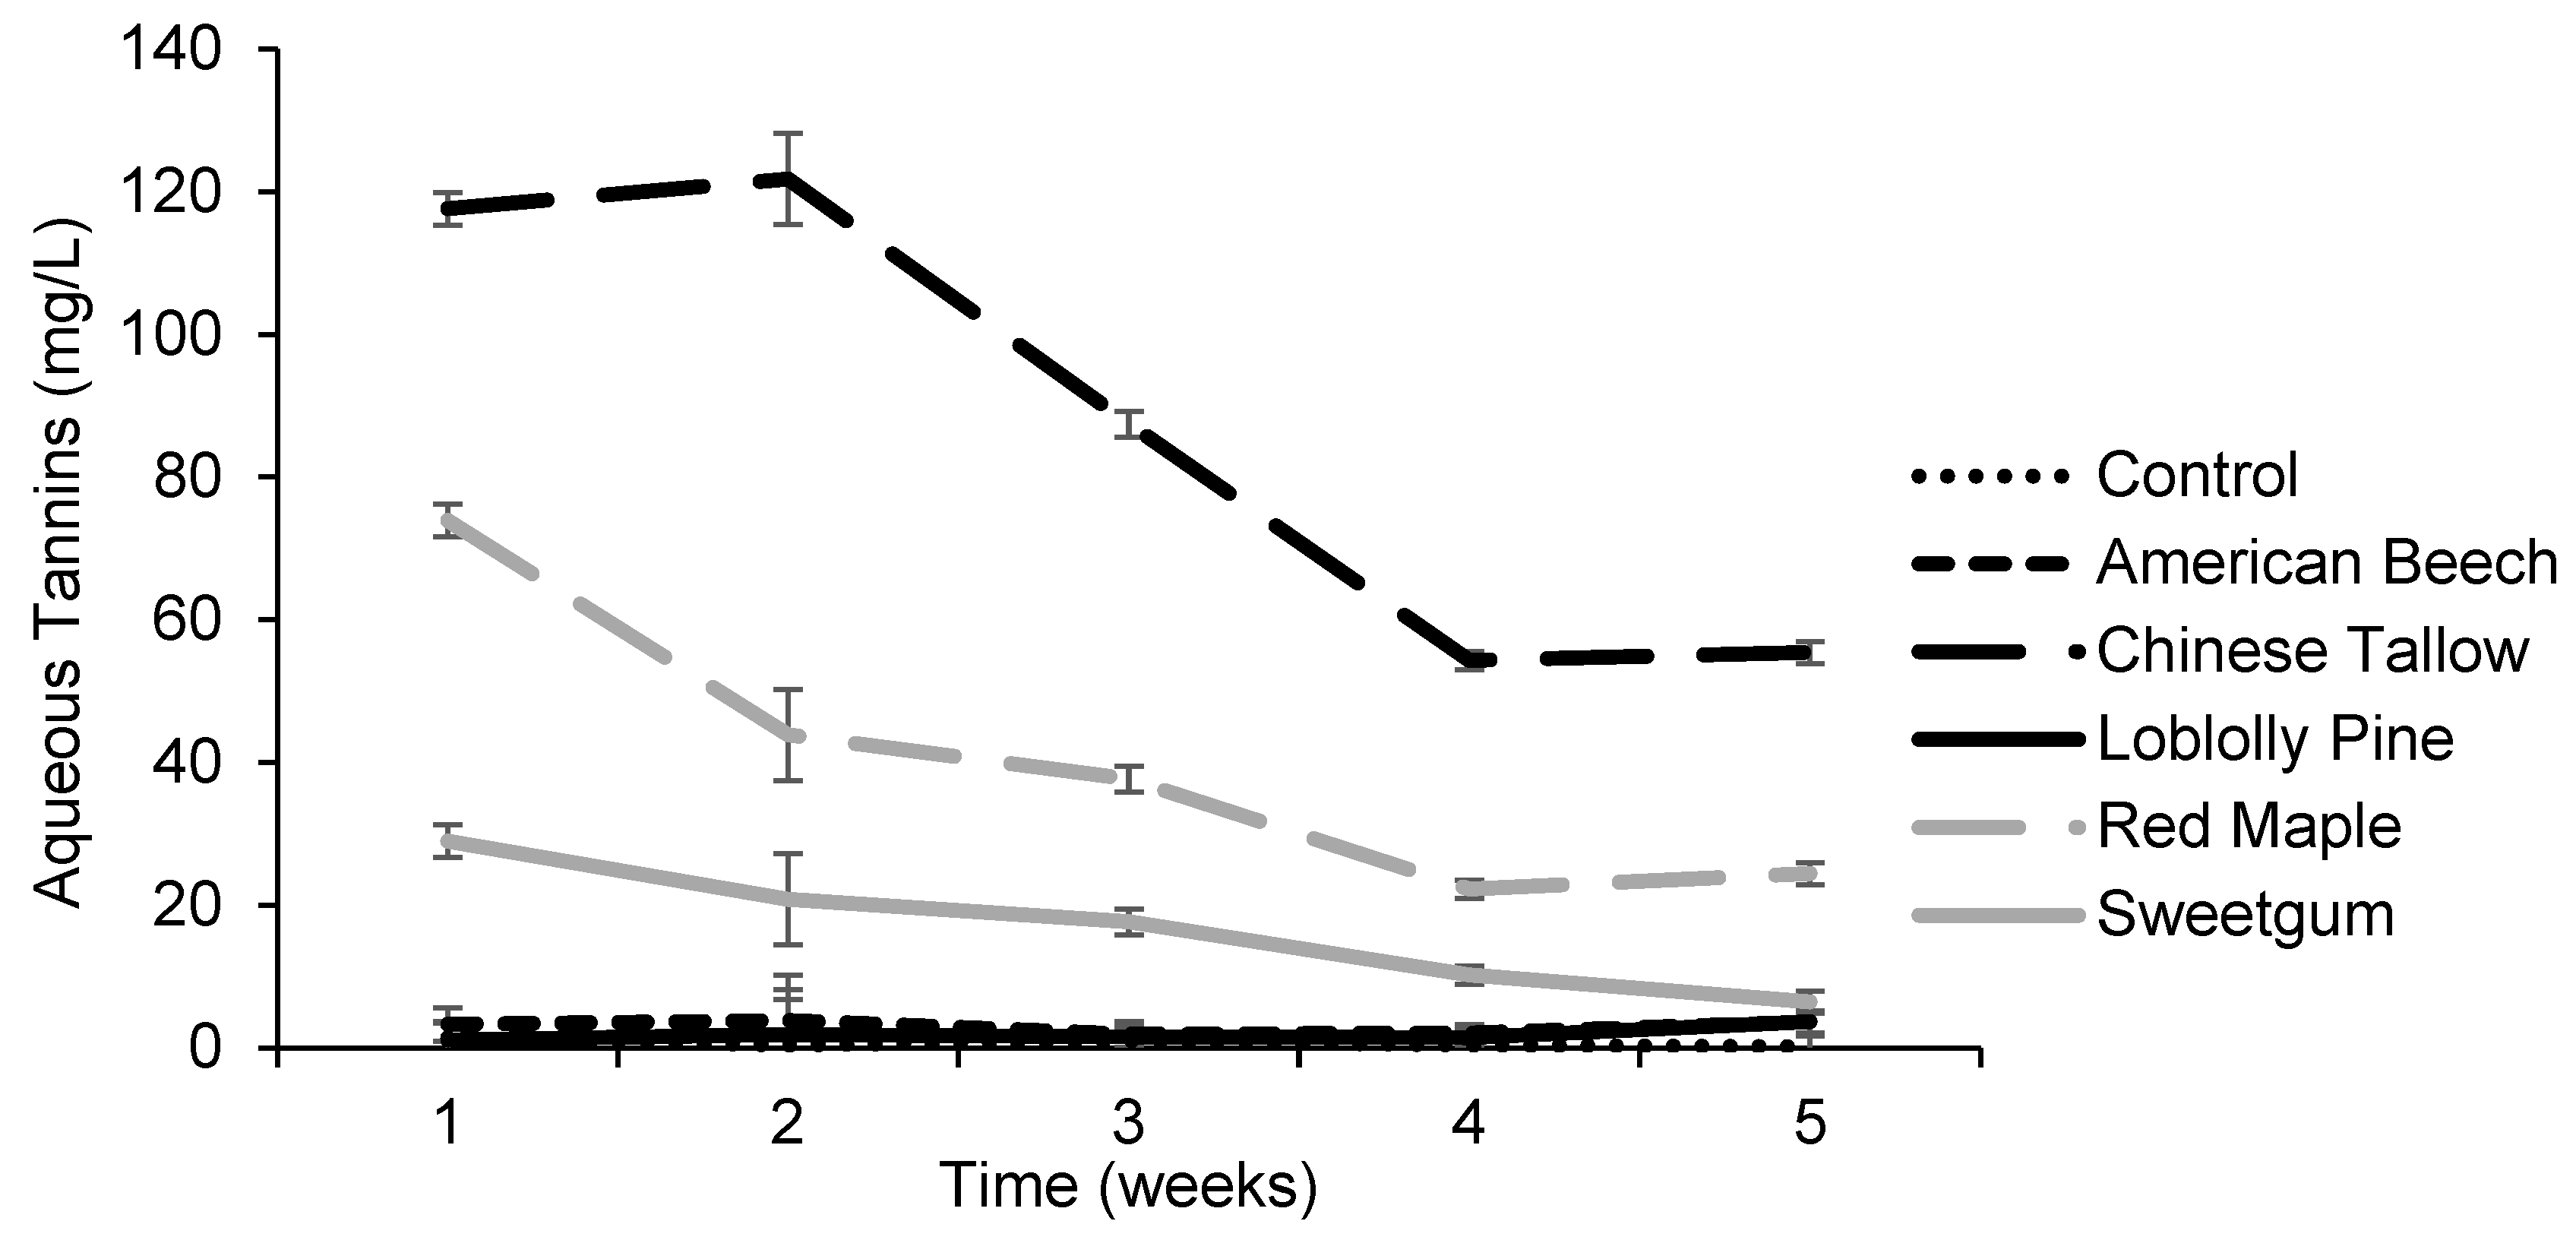
3.1. Effects of Tree Leaves on Chlorophyll Concentration

Senesced leaf chemistry differed by tree species in all variables measured (Table 1). Percent carbon was higher in loblolly pine needles than all other tree leaves (F4,10 = 9.85, p = 0.002), while nitrogen and potassium were lower in loblolly pine needles than all other species (all p < 0.001). Phosphorus was higher in red maple leaves than all other species (F4,10 = 9.60, p = 0.002). Phosphorus was also higher in American Beech leaves than loblolly pine, but neither were significantly different from Chinese tallow or sweetgum leaves (Table 1). Leaf tannin concentrations were highest in Chinese tallow leaves by far, and red maple had the second-highest tannin concentrations (F4,10 = 9.85, p < 0.001). All other species were lower in tannin concentration and not different from each other (Table 1).
Leaf-litter species affected aqueous tannin concentrations and water color, which were highly correlated (r = 0.96, Table S2) and both negatively correlated with chlorophyll a concentrations. Chinese tallow and red maple treatments consistently had the highest aqueous tannin concentrations and darkest water color. Aqueous tannins were significantly affected by an interaction between treatment and time (F10.6,38.0 = 19.51, p < 0.001), though it is important to note that our estimates of tannins may also include some other phenolics. By one week into the experiment, aqueous tannin concentrations were at their highest in the Chinese tallow, red maple, and sweetgum treatments, all of which were higher than the control, loblolly pine, and American beech treatments (Figure 2). In the following weeks, aqueous tannin concentrations declined in the Chinese tallow, red maple and sweetgum treatments but stayed relatively stable and low in the other treatments. By the end of the experiment, aqueous tannins in the sweetgum treatment were not significantly different from the control, loblolly pine, or American beech treatments, but tannins were still higher in the Chinese tallow and red maple treatments. Water color was affected by an interaction between treatment and time (F10.4,35.3 = 6.84, p < 0.001). Water color was lowest and did not change through time for the control, loblolly pine, and American beech treatments. In the other treatments, water color was initially high in week two and then declined through time, presumably as colored organic carbon, possibly tannins, degraded. Water color was highest by far in the Chinese tallow treatment, with red maple and sweetgum having intermediate levels (F5,17 = 427.13, p < 0.001; Figure 3).
Our measure of CDOM interference with fluorometer measurements (chlorophyll a measurements on filtered water) had a strong relationship with water color [measured with three wavelengths (436, 525, 620 nm) and summed] from leaves (r2 = 0.95, Figure 1). This relationship was stronger than a linear model or using water color estimated with any one wavelength of light. We found that a water-color absorbance greater than 2 AU leveled off with CDOM interference at around 9 µg/L. We used this relationship to correct all chlorophyll a measurements of unfiltered water in this experiment. Corrected chlorophyll a concentrations increased through time (F2.3,40.9 = 8.57, p < 0.001) and were affected by leaf species treatment (F5,18 =10.65, p < 0.001) but not the interaction between the two (F11.4,40.9 = 1.84, p = 0.08). Chlorophyll concentrations increased through time as phytoplankton communities developed. Chlorophyll a concentrations were significantly lower in the red maple and Chinese tallow treatments than in the American beech and loblolly treatments. The other treatments, including the control, were intermediate (Figure 4).
During the experiment, water depth was low in the first week at 20 cm and increased to 24–26 cm in weeks four and five (F2.8,50.5 =151.34, p < 0.001). Depths appeared to correspond with summer temperatures, with the hottest temperatures in the first week averaging 30.3 °C and dropping to averages of 25–27 °C for weeks 2–5 (F2.2,40.2 = 70.82, p < 0.001). There was no effect of leaf species treatment on water depth or temperature (all p > 0.47). When averaged across the experiment, there was no correlation between water temperature and depth (Table S2).
Dissolved oxygen, pH, and conductivity were all correlated (Table S2) and affected by treatment and time. Dissolved oxygen was affected by an interaction between leaf-litter species treatment and time (F20,72 = 71.28, p < 0.001). In week one, dissolved oxygen concentrations were all similar and around 4 mg/L across all treatments. Oxygen concentrations rose in the control to 8–9 mg/L in weeks two through five, while concentrations in the loblolly pine and American beech treatments remained relatively stable, at around 4–6 mg/L. Oxygen dropped rapidly in the Chinese tallow, red maple, and sweetgum treatments by week two to around 0.5 mg/L and then gradually rose to 1–3 mg/L by week five. pH was affected by time (F2.8,50.7 = 73.65, p < 0.001) and treatment (F5,18 = 135.13, p < 0.001) but not the interaction between the two (F14.1,50.7 = 1.44, p = 0.17). pH increased through time in all treatments. pH was lowest in the Chinese tallow, red maple, and sweetgum treatments around 7.2–7.5, intermediate in the loblolly pine and American beech treatments around 8, and highest in the control at 9, likely because Ruston, LA utilizes well water from the Sparta aquifer. Conductivity was affected by an interaction between treatment and time (F20,72 = 2.73, p < 0.001). Conductivity was relatively low during week one, at around 340–370 µS/cm, and increased during the experiment with some fluctuations. By the end of the experiment, conductivity was lowest in the control, loblolly pine, and American beech treatments, at around 360–380 µS/cm, and higher in the Chinese tallow, red maple, and sweetgum treatments, at around 410–440 µS/cm, likely due to the higher leaching of compounds from leaves in these treatments. Conductivity was highly correlated with tannin concentrations (r = 0.97, Table S1.)

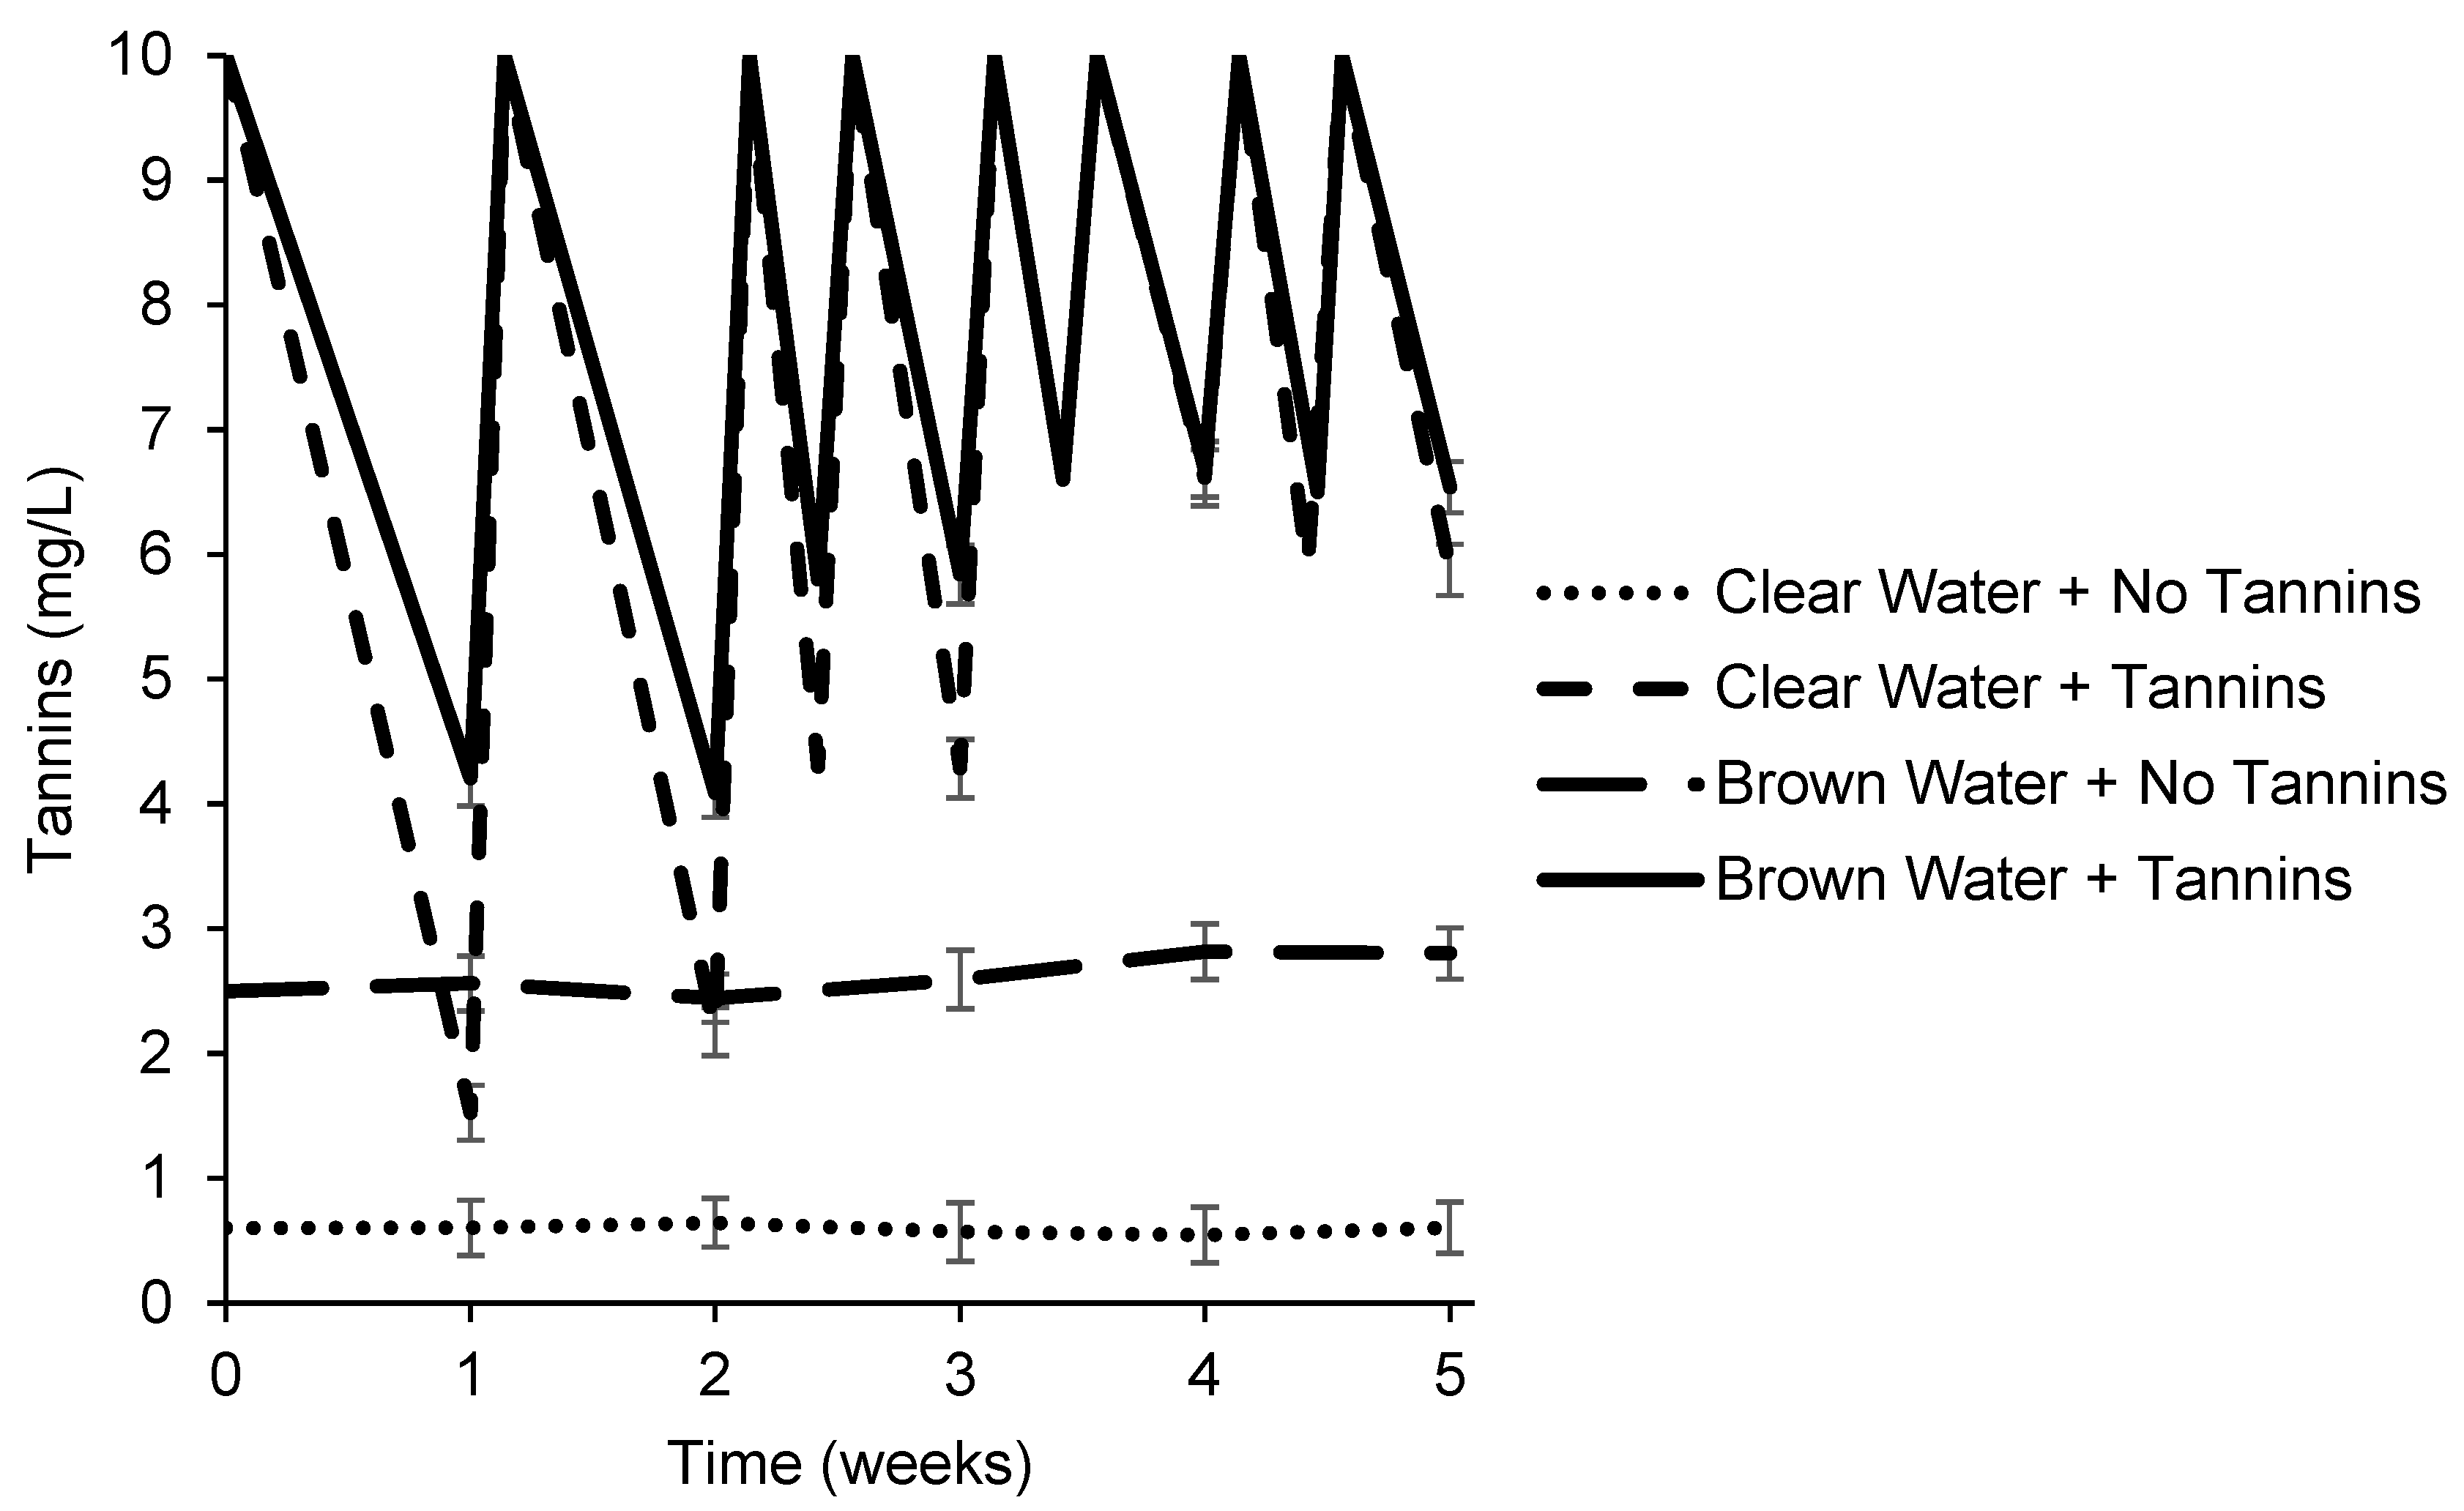
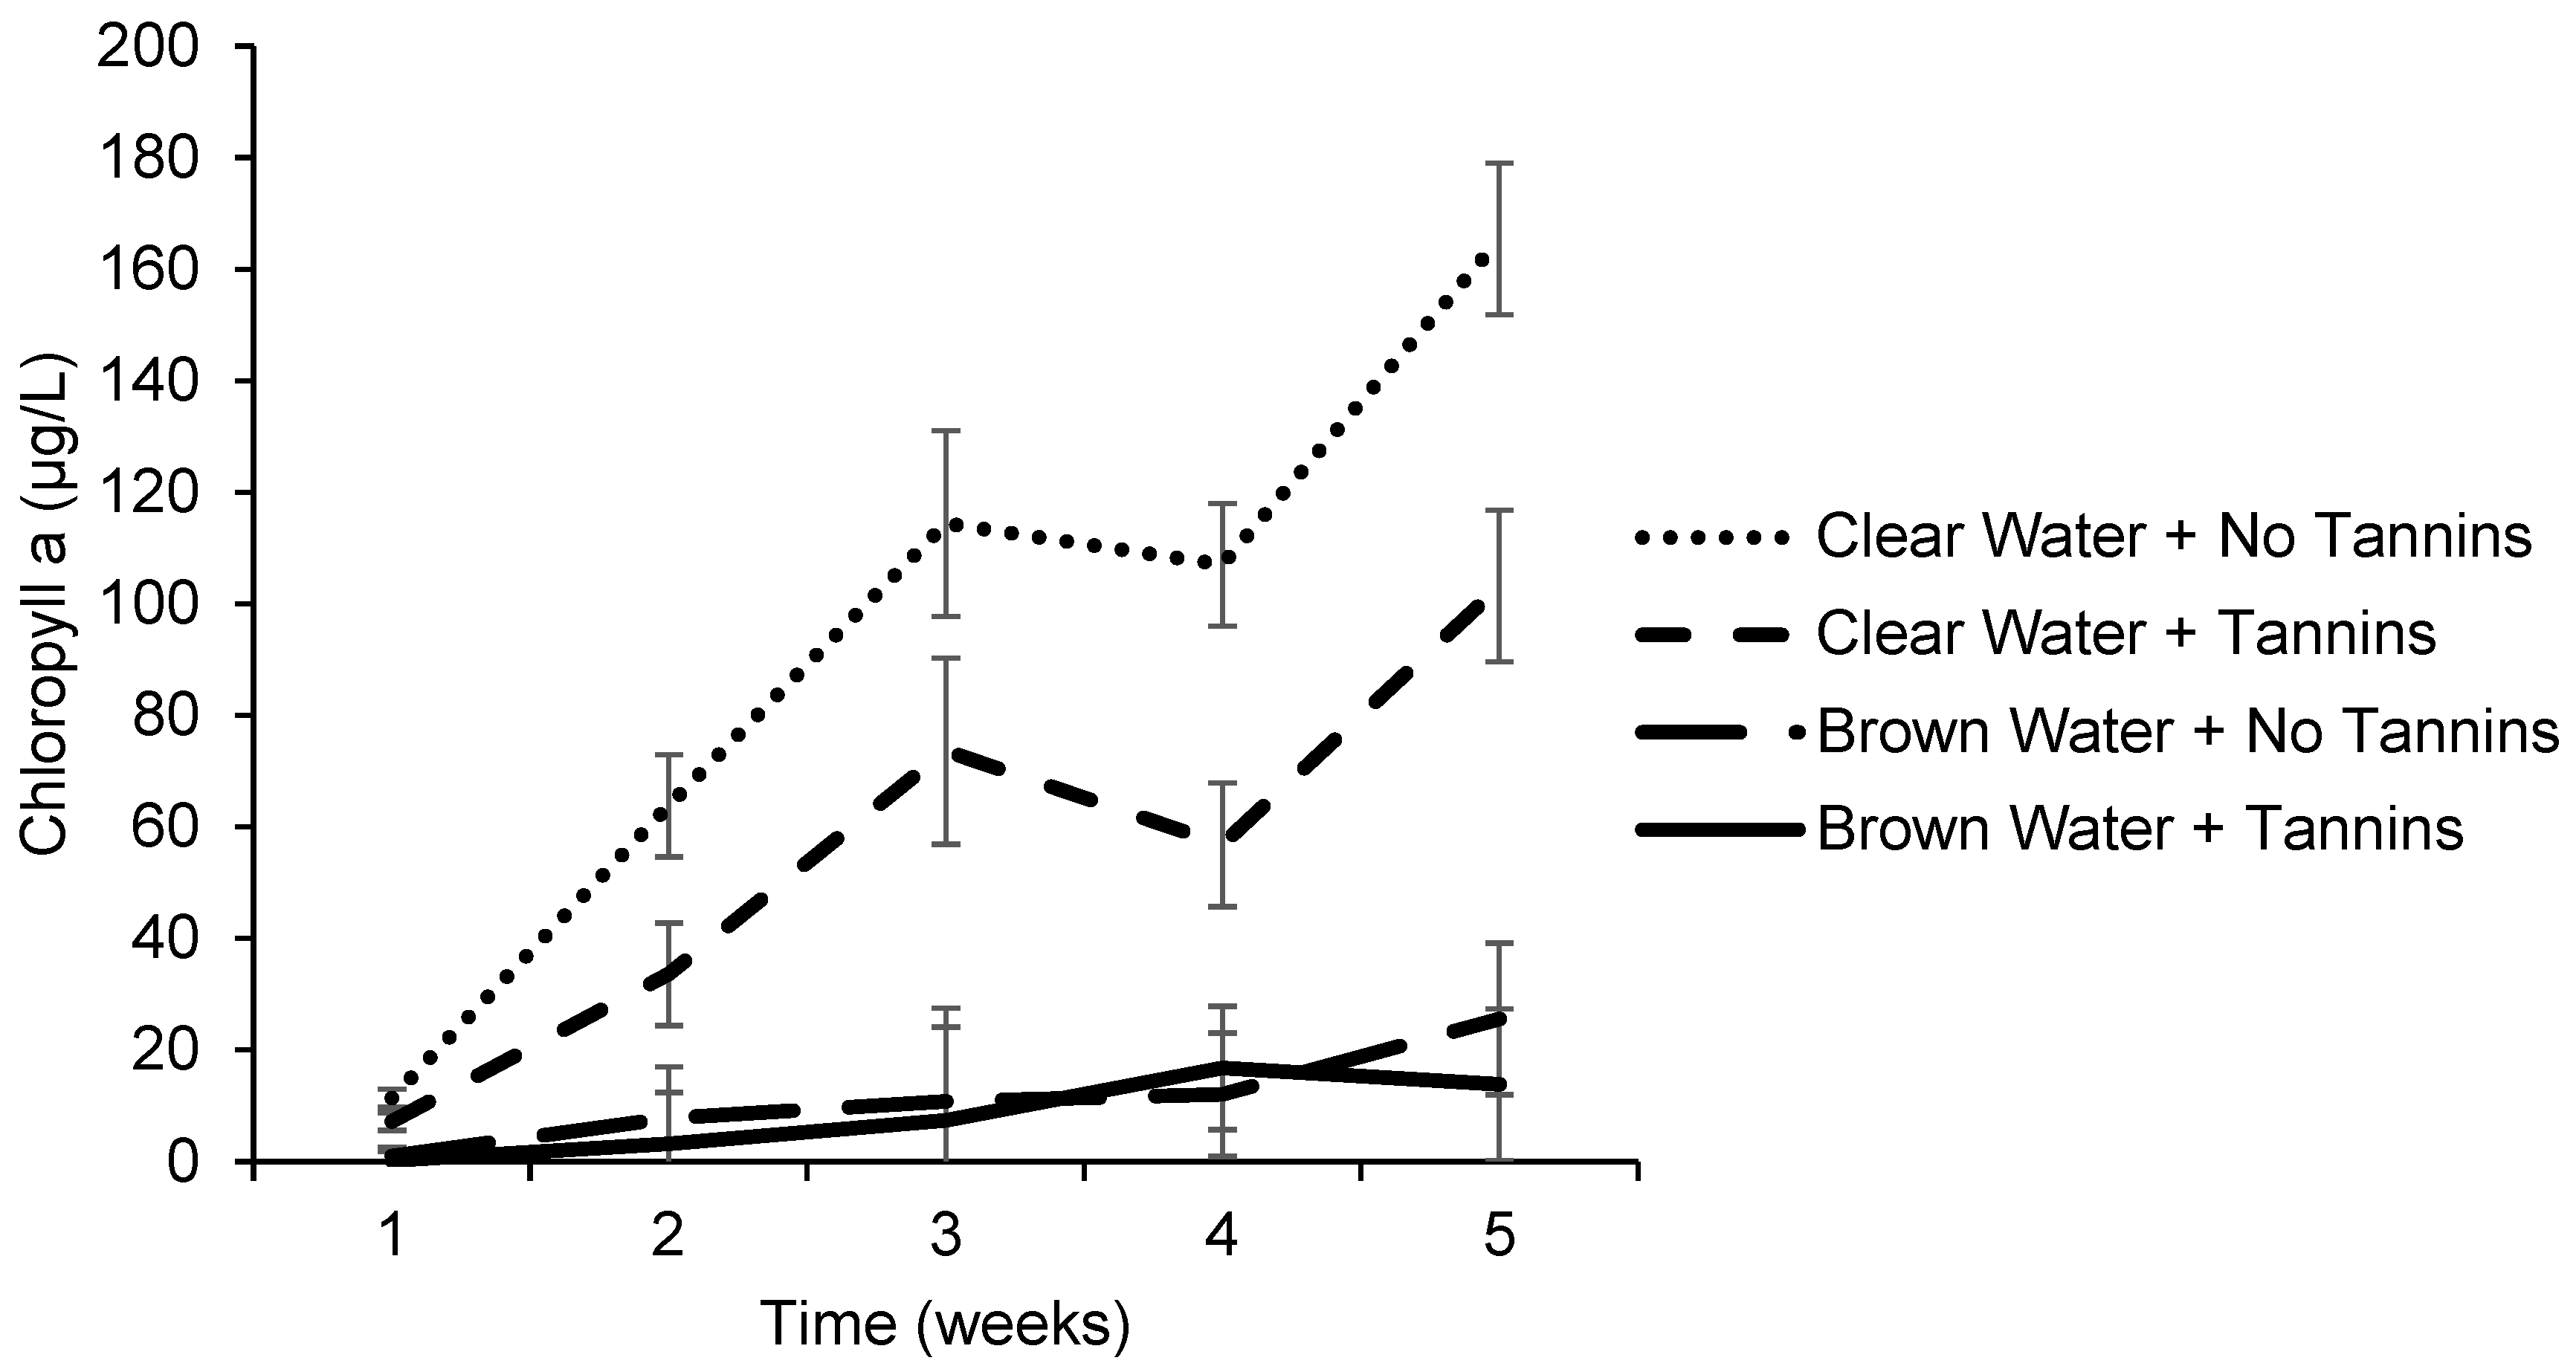
3.2. Effects of Tannic Acid and Water Color on Chlorophyll Concentrations

The food dye was effective at increasing the water color (Figure 5). In the first week of the experiment, water color was higher in the dye-added treatment than in the no-dye treatment (F1,16 = 147.95, p < 0.001), but there was no effect of tannins (F1,16 = 0.82, p = 0.38) or the interaction (F1,16 = 0.09, p = 0.76). In the last week of the experiment, both the dye (F1,16 = 118.53, p <0.001) and tannin treatments (F1,16 = 15.75, p = 0.001) significantly affected water color but not the interaction (F1,16 = 0.47, p = 0.50). However, the increase in water color due to tannic acid added was slight in comparison to the dye. When measuring tannin concentrations, we found that the brown dye bound to our reagents, likely because some of the dyes were hydroxylated aromatic compounds. Thus, the tannin level estimated in the brown water + no tannins treatment is likely a false signal from non-tannin compounds (Figure 6). The tannic acid degraded rapidly each week in between additions of tannic acid. The control (clear water with no tannins added) had very low tannin concentrations throughout the experiment.
Chlorophyll concentrations were affected by an interaction between time and the water-color treatment (F3.07,49.08 = 17.31, p < 0.001), and there was also an interaction between the water-color and tannin treatment regardless of time (F1,16 = 4.97, p = 0.04). In the clear-water treatment, chlorophyll increased rapidly through time, while in the brown-water treatment, chlorophyll concentrations increased much more slowly, indicating light limitation from water color (Figure 7). In brown water, chlorophyll concentrations were not affected by tannins, but in clear water, chlorophyll concentrations were lower when tannins were added, indicating possible tannin toxicity.
Water depths declined through time during the experiment (F4,64 = 339.49, p < 0.001)—by about 3.5 cm over the 5 weeks. There was also an interaction between the tannin treatment and time (F,64 = 2.65, p = 0.04). While replicates with tannins added had slightly higher water depths, there were no significant differences between the treatments on any date. There was a significant effect of time on water temperature (F2.12,33.97 = 1736.87, p < 0.001) but no effects of either treatment or their interaction. Water temperature during the experiment ranged from 17.6 to 33.5 °C, with the warmest temperatures recorded in the first week on 28 September and the coolest temperatures recorded in the third week on 12 October.

4. Discussion

Chlorophyll a concentration, an estimate of phytoplankton biomass, was greatly affected by leaf-litter species, similar to the findings of other studies [2]. The addition of senesced Chinese tallow and red maple leaves resulted in the lowest chlorophyll a concentration in comparison to the control and other species. Chinese tallow and red maple leaves had the highest tannin content, resulting in high aqueous tannin concentrations and the darkest water color—two variables that were highly correlated (r = 0.96). We performed a second experiment to separate the effects of tannins and water color (using a brown food dye). We found that dark water color was likely responsible for the majority of the differences due to light limitation. The addition of tannic acid alone also lowered the chlorophyll a concentration compared to the control. This could be from the moderately darker water by the end of the experiment or from a toxic effect of tannins.
Tree leaves are important inputs to various freshwater systems, particularly small ponds imbedded in forests [2]. The input of leaf litter can alter primary productivity, with consequences for higher trophic levels, including zooplankton [53,54], tadpoles [26,55,56], and fish [57]. Previous work shows that leaf-litter species affects phytoplankton and primary productivity when trophic interactions are included [22,23], and our work shows that these effects occur independent of effects on consumers. The input of loblolly pine needles resulted in the highest chlorophyll a concentration—higher than the control. While pine needles are typically low in nutrients with slow decomposition, the needle sheath likely released more nutrients than the control (with no plant input), stimulating phytoplankton growth with no light limitation. We found that leaves from species with the highest tannin concentration (Chinese tallow and red maple) resulted in the lowest chlorophyll a concentrations. Other studies have found lower chlorophyll a with red maple leaf input in comparison to other tree species [23,25,54] and negative relationships between concentrations of phenolics and algae [22,26]. However, leaves are complex mixtures of nutrients, structural compounds, and secondary compounds, making it difficult to understand the mechanisms behind effects of different leaf species. Further, tannins and water color are often related [30], as found in our experiment, making it necessary to separate these variables to better understand underlying mechanisms.
Water with Chinese tallow and red maple leaf-litter input both had higher aqueous tannin concentrations, darker water color, and lower chlorophyll a concentrations. We performed an additional experiment to separate the effects of tannins and water color and found that darker water color was likely responsible for most or all of the effect of leaf litter on chlorophyll concentrations. Darker water reduces light availability [31], decreasing the ability for algae to perform photosynthesis [57,58]. Darker water from colored dissolved organic compounds blocks blue light more than other colors [12], which can shift the competitive advantage away from green algae and diatoms that primarily use chlorophyll a towards cyanobacteria that use phycobilisomes to harvest red light [32]. These community-level changes may also result in a relatively lower detection of chlorophyll a, as seen in our experiment. We did not measure cyanobacteria, though this would be a useful avenue of future research. Lower light availability can also promote a shift to mixotrophic species that can also consume bacteria to supplement their metabolic activity when photosynthesis is limited [59,60].
Increases in water color, known as brownification, are the result of increases in colored dissolved organic carbon (DOC) and/or iron over time [33,34]. Brownification has multiple different underlying causes, but changes in land use and increases in precipitation that increase the watershed-scale mobilization of DOC are thought to be the primary factors [33,34,35]. Land use changes resulting in brownification include increases in wetland area [17] and reforestation [36,61]. This increases the mobilization of humic and fulvic acids that are the result of decomposition and are colored organic molecules. Humic and fulvic acids are the primary types of DOC discussed in reviews on brownification [33,34], though Pagano, Bida and Kenny [35] have called for greater attention to phenolics, which include tannins. Previous work shows that DOC can be correlated to phenolics [62,63]. Tannin concentrations can contribute to water color, especially in small ponds. Previous work shows that Chinese tallow leaves increase light attenuation in water when compared to other native species in Louisiana [64] and that leaves with high concentrations of tannins greatly increase water color [30] (Edwards and Earl, unpublished data). Thus, tannin concentrations in water may be an important factor in brownification in areas with high leaf-litter input. Our research shows that leaf input from certain species of trees result in darker water, suggesting that changes in tree species composition could result in brownification of freshwaters. Particularly, darker water is likely to occur in areas of the northeast, where red maple is increasing [65,66], and on the gulf coast, due to increases in the invasive Chinese tallow [37,67], though the further study of the effects of riparian tree species on water color is warranted.
Tannins also resulted in decreased chlorophyll a concentration in the clear-water treatment. While tannins did moderately increase water color by the end of the experiment, these results could also have resulted from toxicity [68]. Tannic acid has previously been shown to reduce the chlorophyll a content of algal cells [10], though at higher concentrations than used in this study. Tannins primarily act on organisms through oxidation, protein precipitation, and binding to metals. Oxidation occurs more readily at higher pH levels, which were the conditions found in this experiment [27]. Tannins can also block protein synthesis and fragment cell membranes [10]. Tannins further limit phytoplankton growth by decreasing the availability of certain metals like zinc and cobalt that are needed for the synthesis of some enzymes [11,69]. However, metal toxicity can also be reduced by metals binding to tannins [70]. It is important to note that tannins are a complex group of molecules [27] that may vary in their effects—alone and in mixtures—on phytoplankton and other aquatic organisms [5]. Further work on different types of tannins and mixtures of tannins will be necessary to fully understand these effects.
There were some limitations to these experiments. We were unable to totally control and measure tannin concentrations because the reagents used in the Tyrosine method were able to bind to the organic molecules in the dyes [71]. It would be best to use a more precise method (i.e., HPLC) to measures tannin concentration, as the method we used was not specific to tannins but served as a proxy for them. Also, we used a nontoxic food dye to darken the water, but some dyes do have moderate toxic effects on aquatic organisms [72], so we cannot entirely rule out this possibility. Future work should investigate these possibilities and identify a nontoxic, brown dye to use in subsequent experiments. However, researchers have cautioned against the use of certain types of browning agents derived from leonardite like HuminFeed [73]. For the tannin we examined, we chose tannic acid, because it is a commercially available mixture of gallotannins with very little color dissolved in water at concentrations typically found in ponds and wetlands. However, the water color did increase through time, likely as the tannic acid was oxidized or broken down [74]. This also limited our ability to completely separate the effects of water color and tannins. Further, tannins are a complex group of molecules, and different tannins may have different effects on phytoplankton. It will likely be challenging to separate the effects of different tannins that have a stronger effect on water color, but it may be possible to equalize light availability in the laboratory by lowering light levels in controls or increasing them in tannin treatments to compensate. The two experiments were also performed during different seasons, which resulted in different temperatures and rainfall patterns. Seasonal changes are important for most organisms and could affect our results. Adding seasons into future studies would clarify whether these results vary by season. Finally, leaves also differ in nutrient concentrations and decomposition rates, which likely also affect phytoplankton. Further investigating these effects will give a more holistic view of the effects of different leaf species on phytoplankton.
Overall, we found that leaf litter can substantially affect phytoplankton. Previous work highlights the importance of leaves to many aquatic ecosystems by forming the base of food webs in sites with low light availability. Differences in leaf decomposition rates can alter the flow of nutrients to algae and consumers. Leaf species that leach dark compounds, like Chinese tallow and red maple, lower chlorophyll a concentrations in ponds through decreases in light availability for photosynthesis. This suggests that tree species composition around freshwater likely impacts water color and phytoplankton production with potential effects on higher trophic levels [22,53,57]. These effects may mean that waters with high input of leaves that leach dark compounds will decrease the likelihood of algal blooms. Invasive species, fire suppression, and climate change are known to influence tree species composition [37,75,76,77]. If these changes result in a greater proportion of trees with high leaf tannin content or other phenolics, this may cause brownification in freshwater systems imbedded in forests like vernal pools and headwater streams. Brownification is a topic of increased interest [33,34], and our work suggests that investigations of tannins should be included in the research of this topic. Further, forestry management for certain tree species in riparian areas may be a tool to limit eutrophication through intentional water browning.

Supplementary Materials

The following supporting information can be downloaded at: https://www.mdpi.com/article/10.3390/hydrobiology3030017/s1, Table S1: Ingredients and their chemical names in brown dye used in experiment (Buckeye Brown liqua-gel food color, Chefmaster, Byrnes & Keifer, Fullerton, CA, USA) in order on the manufacturer’s label; Table S2: Correlations between water chemical and physical variables in the leaf litter experiment using values averaged across the entire experiment; Figure S1: Photograph of the mesocosms used for both experiments.

Author Contributions

Conceptualization: J.E.E.; resources: J.E.E.; methodology: J.E.E.; investigation: A.O., C.M.D., S.A.M., J.F.A. and J.E.E.; formal analysis: J.E.E.; initial draft writing: A.O. and J.E.E.; editing A.O., C.M.D. and J.E.E. All authors have read and agreed to the published version of the manuscript.

Funding

This work was funded by the NSF DEB [2230887] and the Louisiana Board of Regents RCS [LEQSF(2021-24)-RD-A-08]. AO was supported by the Army Educational Outreach Program facilitated by C. Campbell.

Institutional Review Board Statement

Not applicable.

Informed Consent Statement

Not applicable.

Data Availability Statement

The data presented in this study are openly available in the Knowledge Network for Biodiversity at https://knb.ecoinformatics.org/view/urn%3Auuid%3A5e054c63-f5ac-4d5f-865c-c6d448555b76 (accessed on 22 August 2024), reference number urn:uuid: 5e054c63-f5ac-4d5f-865c-c6d448555b76.

Acknowledgments

We would like to thank the NSF, Louisiana Board of Regents, and the Army Educational Outreach Program for funding; K. Craddock, G. Handley, and E. McBride for assistance with data collection; D.J. Edwards and J.D Flores for help with leaf litter collection; and T.L. Anderson for helpful discussion about use of optical chlorophyll meters. The graphical abstract was created in BioRender (https://www.biorender.com/, accessed on 2 September 2024).

Conflicts of Interest

The authors declare no conflicts of interest.

References

  1. Vannote, R.L.; Minshall, G.W.; Cummins, K.W.; Sedell, J.R.; Cushing, C.E. The river continuum concept. Can. J. Fish. Aquat. Sci. 1980, 37, 130–137. [Google Scholar] [CrossRef]
  2. Stoler, A.B.; Relyea, R.A. Reviewing the role of plant litter inputs to forested wetland ecosystems: Leafing through the literature. Ecol. Monogr. 2020, 90, e01400. [Google Scholar] [CrossRef]
  3. Marks, J.C. Revisiting the fates of dead leaves that fall into streams. Annu. Rev. Ecol. Evol. Syst. 2019, 50, 547–568. [Google Scholar] [CrossRef]
  4. Earl, J.E.; Semlitsch, R.D. Spatial subsidies, trophic state, and community structure: Examining effects of leaf litter on ponds. Ecosystems 2013, 16, 639–651. [Google Scholar] [CrossRef]
  5. Earl, J.E.; Semlitsch, R.D. Effect of tannin source and concentration from tree leaves on two species of tadpoles. Environ. Toxicol. Chem. 2015, 34, 120–126. [Google Scholar] [CrossRef]
  6. Temmink, J.H.M.; Field, J.A.; Van Haastrecht, J.C.; Merkelbach, R.C.M. Acute and sub-acute toxicity of bark tannins in carp (Cyprinus carpio L.). Water Res. 1989, 23, 341–344. [Google Scholar] [CrossRef]
  7. Xie, Z.; Wang, M.; Deng, Y.; Li, J.; Li, J.; Pang, W.; Xie, L.; Jiang, D.; Huang, Z.; He, T.; et al. Acute toxicity of eucalyptus leachate tannins to zebrafish and the mitigation effect of Fe3+ on tannin toxicity. Ecotoxicol. Environ. Saf. 2022, 229, 113077. [Google Scholar] [CrossRef]
  8. Battacharya, P.; Swarnakar, S.; Mukhopadhyay, A.; Ghosh, S. Exposure of composite tannery effluent on snail, Pila globosa: A comparative assessment of toxic impacts of the untreated and membrane treated effluents. Ecotoxicol. Environ. Saf. 2016, 126, 45–55. [Google Scholar] [CrossRef]
  9. Tremolieres, M. Deoxygenating effect and toxicity of ground-up dried coniferous needles and leaves of Canadian trees in water: A preliminary study in comparison with litter of European trees. Water Res. 1988, 22, 21–28. [Google Scholar] [CrossRef]
  10. Xie, L.; Ma, Z.; Yang, G.; Huang, Y.; Wen, T.; Deng, Y.; Sun, J.; Zheng, S.; Wu, F.; Huang, K.; et al. Study on the inhibition mechanism of eucalyptus tannins against Microcystis aeruginosa. Ecotoxicol. Environ. Saf. 2023, 249, 114452. [Google Scholar] [CrossRef]
  11. Serrano, L.; Guisande, C. Effects of polyphenolic compounds on phytoplankton. Verhandlungen Int. Ver. Theor. Angew. 1990, 24, 282–288. [Google Scholar] [CrossRef]
  12. Dodds, W.K.; Whiles, M.R. Freshwater Ecology: Concepts and Environmental Application of Limnology, 3rd ed.; Academic Press: Cambridge, MA, USA, 2020. [Google Scholar]
  13. Wurtsbaugh, W.A.; Paerl, H.W.; Dodds, W.K. Nutrients, eutrophication and harmful algal blooms along the freshwater to marine continuum. WIREs Water 2019, 6, e373. [Google Scholar] [CrossRef]
  14. Griffith, A.W.; Gobler, C.J. Harmful algal blooms: A climate change co-stressor in marine and freshwater ecosystems. Harmful Algae 2020, 91, 101590. [Google Scholar] [CrossRef] [PubMed]
  15. Patiño, R.; Christensen, V.G.; Graham, J.L.; Rogosch, J.S.; Rosen, B.H. Toxic algae in inland waters of the conterminous United States—A review and synthesis. Water 2023, 15, 2808. [Google Scholar] [CrossRef]
  16. Backer, L.C.; Manassaram-Baptiste, D.; LePrell, R.; Bolton, B. Cyanobacteria and Algae Blooms: Review of Health and Environmental Data from the Harmful Algal Bloom-Related Illness Surveillance System (HABISS) 2007–2011. Toxins 2015, 7, 1048–1064. [Google Scholar] [CrossRef] [PubMed]
  17. Leech, D.M.; Pollard, A.I.; Labou, S.G.; Hampton, S.E. Fewer blue lakes and more murky lakes across the continental U.S.: Implications for planktonic food webs. Limnol. Oceanogr. 2018, 63, 2661–2680. [Google Scholar] [CrossRef] [PubMed]
  18. Matveev, V.; Robson, B.J. Aquatic food web structure and the flow of carbon. Freshw. Rev. 2014, 7, 1–24. [Google Scholar] [CrossRef]
  19. Tittel, J.; Bissinger, V.; Zippel, B.; Gaedke, U.; Bell, E.; Lorke, A.; Kamjunke, N. Mixotrophs combine resource use to outcompete specialists: Implications for aquatic food webs. Proc. Natl. Acad. Sci. USA 2003, 100, 12776–12781. [Google Scholar] [CrossRef]
  20. Doi, H. Spatial patterns of autochthonous and allochthonous resources in aquatic food webs. Popul. Ecol. 2009, 51, 57–64. [Google Scholar] [CrossRef]
  21. Carpenter, S.R.; Cole, J.J.; Pace, M.L.; Van de Bogert, M.C.; Bade, D.L.; Bastviken, D.; Gille, C.M.; Hodgson, J.R.; Kitchell, J.F.; Kritzberg, E.S. Ecosystem subsidies: Terrestrial support of aquatic food webs from 13C addition to contrasting lakes. Ecology 2005, 86, 2737–2750. [Google Scholar] [CrossRef]
  22. Earl, J.E.; Castello, P.O.; Cohagen, K.E.; Semlitsch, R.D. Effects of subsidy quality on reciprocal subsidies: How leaf litter species changes frog biomass export. Oecologia 2014, 175, 209–218. [Google Scholar] [CrossRef] [PubMed]
  23. Stoler, A.B.; Relyea, R.A. Living in the litter: The influence of tree leaf litter on wetland communities. Oikos 2011, 120, 862–872. [Google Scholar] [CrossRef]
  24. Siders, A.C.; Compson, Z.G.; Hungate, B.A.; Dijkstra, P.; Koch, G.W.; Wymore, A.S.; Grandy, A.S.; Marks, J.C. Litter identity affects assimilation of carbon and nitrogen by a shredding caddisfly. Ecosphere 2018, 9, e02340. [Google Scholar] [CrossRef]
  25. Stephens, J.P.; Berven, K.A.; Tiegs, S.D. Anthropogenic changes to leaf litter input affect the fitness of a larval amphibian. Freshw. Biol. 2013, 58, 1631–1646. [Google Scholar] [CrossRef]
  26. Stephens, J.P.; Berven, K.A.; Tiegs, S.D.; Raffel, T.R. Ecological stoichiometry quantitatively predicts responses of tadpoles to a food quality gradient. Ecology 2015, 96, 2070–2076. [Google Scholar] [CrossRef]
  27. Salminen, J.-P.; Karonen, M. Chemical ecology of tannins and other phenolics: We need a change in approach. Funct. Ecol. 2011, 25, 325–338. [Google Scholar] [CrossRef]
  28. Ostrofsky, M.L. Effect of tannins on leaf processing and conditioning rates in aquatic ecosystems: An empirical approach. Can. J. Fish. Aquat. Sci. 1993, 50, 1176–1180. [Google Scholar] [CrossRef]
  29. Compson, Z.G.; Hungate, B.A.; Whitham, T.G.; Koch, G.W.; Dijkstra, P.; Siders, A.C.; Wojtowicz, T.; Jacobs, R.; Rakestraw, D.N.; Allred, K.E.; et al. Linking tree genetics and stream consumers: Isotopic tracers elucidate controls on carbon and nitrogen assimiliation. Ecology 2018, 99, 1759–1770. [Google Scholar] [CrossRef]
  30. Oliveira, R.; Martinez, A.; Gonçalves, A.L.; Canhoto, C. Intra-specific leaf trait variability controls leaf decomposition of Vitis vinifera L. cultivars in streams. Aquat. Ecol. 2022, 56, 47–57. [Google Scholar] [CrossRef]
  31. Phlips, E.J.; Cichra, M.; Aldridge, F.J.; Jembeck, J. Light availability and variations in phytoplankton standing crops in a nutrient-rich blackwater river. Limnol. Oceanogr. 2000, 45, 916–929. [Google Scholar] [CrossRef]
  32. Luimstra, V.M.; Verspagen, J.M.H.; Xu, T.; Schuurmans, J.M.; Huisman, J. Changes in water color shift competition between phytoplankton species with contrasting light-harvesting strategies. Ecology 2020, 101, e02951. [Google Scholar] [CrossRef]
  33. Blanchet, C.C.; Arzel, C.; Davranche, A.; Kahilainen, K.K.; Secondi, J.; Taipale, S.; Lindberg, H.; Loehr, J.; Manninen-Johansen, S.; Sundell, J.; et al. Ecology and the extent of freshwater browning—What we know and what should be studied next in the context of global change. Sci. Total Environ. 2022, 812, 152420. [Google Scholar] [CrossRef] [PubMed]
  34. Kritzberg, E.S.; Hasselquist, E.M.; Škerlep, M.; Löfgren, S.; Olsson, O.; Stadmark, J.; Valinia, S.; Hansson, L.-A.; Laudon, H. Browning of freshwaters: Consequences to ecosystem services, underlying drivers, and potential mitigation measures. Ambio 2020, 49, 375–390. [Google Scholar] [CrossRef]
  35. Pagano, T.; Bida, M.; Kenny, J.E. Trends in levels of allochthonous dissolved organic carbon in natural water: A review of potential mechanisms under a changing climate. Water 2014, 6, 2862–2897. [Google Scholar] [CrossRef]
  36. Mattsson, T.; Kortelainen, P.; Laubel, A.; Evans, D.; Pujo-Pay, M.; Räike, A.; Conan, P. Export of dissolved organic matter in relation to land use along a European climatic gradient. Sci. Total Environ. 2009, 407, 1967–1976. [Google Scholar] [CrossRef]
  37. Pile, L.S.; Wang, G.G.; Stovall, J.P.; Siemann, E.; Wheeler, G.S.; Gabler, C.A. Mechanisms of Chinese Tallow (Triadica sebifera) invasion and their management implications—A review. For. Ecol. Manag. 2017, 404, 1–13. [Google Scholar] [CrossRef]
  38. Cameron, G.N.; LaPoint, T.W. Effects of tannins on the decomposition of Chinese tallow leaves by terrestrial and aquatic invertebrates. Oecologia 1978, 32, 349–366. [Google Scholar] [CrossRef]
  39. Cameron, G.N.; Spencer, S.R. Rapid leaf decay and nutrient release in a Chinese tallow forest. Oecologia 1989, 80, 222–228. [Google Scholar] [CrossRef]
  40. Edwards, D.J. The Impact of Leaf Litter Diversity on the Colonization of Aquatic Insects; Louisiana Tech Universtiy: Ruston, LA, USA, 2023. [Google Scholar]
  41. Petersen, R.C.; Cummins, K.W. Leaf processing in a woodland stream. Freshw. Biol. 1974, 4, 343–368. [Google Scholar] [CrossRef]
  42. Clesceri, L.S.; Greenberg, A.E.; Trussell, R.R. (Eds.) Standard Methods for the Examination of Water and Wastewater, 17th ed.; American Public Health Association: Washington, DC, USA, 1989; p. 1624. [Google Scholar]
  43. Jones, J.B., Jr. Plant tissue analysis in micronutrients. In Micronutrients in Agriculture, 2nd ed.; Mordvedt, J.J., Ed.; Soil Science Society of America: Madison, WI, USA, 1991; Volume 4, pp. 447–522. [Google Scholar]
  44. Hamdhani, H.; Eppenhimer, D.E.; Walker, D.; Bogan, M.T. Performance of a handheld chlorophyll-a fluorometer: Potential use for rapid algae monitoring. Water 2021, 13, 1409. [Google Scholar] [CrossRef]
  45. Cremella, B.; Huot, Y.; Bonilla, S. Interpretation of total phytoplankton and cyanobacteria fluorescence from cross-calibrated flourometers, including sensitivity to turbidity and colored dissolved organic matter. Limnol. Oceanogr. Methods 2018, 16, 881–894. [Google Scholar] [CrossRef]
  46. Kuha, J.; Jarvinen, M.; Salmi, P.; Karjalainen, J. Calibration of in situ chlorophyll flourometers for organic matter. Hydrobiologia 2020, 847, 4377–4387. [Google Scholar] [CrossRef]
  47. Carlson, R.E.; Shapiro, J. Dissolved humic substances: A major source of error in flourometric analyses involving lake waters. Limnol. Oceanogr. 1981, 26, 785–790. [Google Scholar] [CrossRef]
  48. Leppa, M.; Karjalainen, J.; Holopainen, A. In vivo-fluorescence and chlorophyll a determination in Finnish humic lakes. Aqua Fenn. 1995, 25, 33–38. [Google Scholar]
  49. Maerz, J.C.; Brown, C.J.; Chapin, C.T.; Blossey, B. Can secondary compounds of an invasive plant affect larval amphibians? Funct. Ecol. 2005, 19, 970–975. [Google Scholar] [CrossRef]
  50. Serrano, L. Leaching from vegetation of soluble polyphenolic compounds, and their abuandance in temporary ponds in the Doñana National Park (SW Spain). Hydrobiologia 1992, 229, 43–50. [Google Scholar] [CrossRef]
  51. Haverkamp, N.; Beauducel, A. Violation of the sphericity assumption and its effect on type-I error rates in repeated measures ANOVA and multi-level linear models (MLM). Front. Psychol. 2017, 8, 1841. [Google Scholar] [CrossRef]
  52. Abdi, H. The Greenhouse-Geisser Correction. In Encyclopedia of Research Design; Salkind, N., Ed.; Sage: Thousand Oaks, CA, USA, 2010; pp. 1–10. [Google Scholar]
  53. Fey, S.B.; Mertens, A.N.; Beversdorf, L.J.; McMahon, K.D.; Cottingham, K.L. Recognizing cross-ecosystem responses to changing temperatures: Soil warming impacts pelagic food webs. Oikos 2015, 124, 1473–1481. [Google Scholar] [CrossRef]
  54. Rubbo, M.J.; Kiesecker, J.M. Leaf litter composition and community structure: Translating regional species changes into local dynamics. Ecology 2004, 85, 2519–2525. [Google Scholar] [CrossRef]
  55. Earl, J.E.; Semlitsch, R.D. Reciprocal subsidies in ponds: Does leaf input increase frog biomass export? Oecologia 2012, 170, 1077–1087. [Google Scholar] [CrossRef]
  56. Cohen, J.S.; Maerz, J.C.; Blossey, B. Traits, not origin, explain impacts of plants on larval amphibians. Ecol. Appl. 2012, 22, 218–228. [Google Scholar] [CrossRef]
  57. Karlsson, J.; Byström, P.; Ask, J.; Ask, P.; Persson, L.; Jansson, M. Light limitation of nutrient-poor lake ecosystems. Nature 2009, 460, 506–509. [Google Scholar] [CrossRef] [PubMed]
  58. Jones, R.I. The influence of humic substances on lacustrine planktonic food chains. Hydrobiologia 1992, 229, 73–91. [Google Scholar] [CrossRef]
  59. Wilken, S.; Soares, M.; Urritia-Cordero, P.; Ratcovich, J.; Ekvall, M.K.; Van Donk, E.; Hansson, L.-A. Primary producers or consumers? Increasing phytoplankton bacterivory along a gradient of lake warming and browning. Limnol. Oceanogr. 2018, 63, S142–S155. [Google Scholar] [CrossRef]
  60. Senar, O.E.; Creed, I.F.; Trick, C.G. Lake browning may fuel phytoplankton biomass and trigger shifts in phytoplanktion communitiies in temperate lakes. Aquat. Sci. 2021, 83, 21. [Google Scholar] [CrossRef]
  61. Finstad, A.G.; Andersen, T.; Larsen, S.; Tominaga, K.; Blumentrath, S.; de Wit, H.A.; Tømmervik, H.; Hessen, D.O. From greening to browning: Catchment vegetation development and reduced S-deposition promote organic carbon load on decadal time scales in Nordic lakes. Sci. Rep. 2016, 6, 31944. [Google Scholar] [CrossRef]
  62. Peacock, M.; Burden, A.; Cooper, M.; Dunn, C.; Evans, C.D.; Fenner, N.; Freeman, C.; Gough, R.; Hughes, D.; Hughes, S.; et al. Quantifying dissolved organic carbon concentrations in upland catchments using phenolic proxy measurements. J. Hydrol. 2013, 477, 251–260. [Google Scholar] [CrossRef]
  63. Kang, H.; Freeman, C.; Kim, S.-Y. Variations of DOC and phenolics in pore-water of peatlands. Korean J. Limnol. 2002, 35, 306–311. [Google Scholar]
  64. Leonard, N.E. The Effects of the Invasive Exotic Chinese Tallow Tree (Triadica sebifera) on Amphibians and Aquatic Invertebrates. Ph.D. Thesis, University of New Orleans, New Oleans, LA, USA, 2008. [Google Scholar]
  65. Abrams, M.D. The red maple paradox: What explains the widespread expansion of red maple in eastern forests? Bioscience 1998, 48, 355–364. [Google Scholar] [CrossRef]
  66. Fei, S.; Steiner, K.C. Evidence for increasing red maple abundance in the eastern United States. For. Sci. 2007, 53, 473–477. [Google Scholar] [CrossRef]
  67. Wang, H.-H.; Grant, W.E.; Swannack, T.M.; Gan, J.; Rogers, W.E.; Koralewski, T.E.; Miller, J.H.; Taylor, J.W., Jr. Predicted range expansion of Chinese tallow tree (Triadica sebifera) in forestlands fo the southern United States. Divers. Distrib. 2011, 17, 552–565. [Google Scholar] [CrossRef]
  68. Libralato, G.; Avezzù, F.; Ghirardini, A.V. Lignin and tannin toxicity to Phaeodactylum tricornutum (Bohlin). J. Hazard. Mater. 2011, 194, 435–439. [Google Scholar] [CrossRef] [PubMed]
  69. Zhu, Y.; Li, Y.; Wei, Y.; Norgbey, E.; Chen, Y.; Li, R.; Wang, C.; Cheng, Y.; Bofah-Buoh, R. Impact of Eucalyptus residue leaching on iron distribution in reservoir sediments assessed by high-resolution DGT technique. Environ. Sci. Pollut. Res. 2023, 30, 125718–125730. [Google Scholar] [CrossRef]
  70. Kinraide, T.B.; Hagerman, A.E. Interactive intoxicating and ameliorating effects of tannic acid, aluminum (Al3+), copper (Cu2+), and selenate (SeO42−) in wheat roots: A descriptive and mathematical assessment. Physiol. Plant 2010, 139, 68–79. [Google Scholar] [CrossRef]
  71. Karrasch, B.; Parra, O.; Cid, H.; Mehrens, M.; Pacheco, P.; Urrutia, R.; Valdovinos, C.; Zaror, C. Effects of pulp and paper mill effluents on the microplankton and microbial self-purification capabilities of the Biobio River, Chile. Sci. Total Environ. 2006, 359, 194–208. [Google Scholar] [CrossRef]
  72. Motta, C.M.; Simoniello, P.; Arena, C.; Capriello, T.; Panzuto, R.; Vitale, E.; Agnisola, C.; Tizzano, M.; Avallone, B.; Ferrandino, I. Effects of four food dyes on development of three model species, Cucumis sativus, Artemia salina and Danio rerio: Assessment of potential risk for the environment. Environ. Pollut. 2019, 253, 1126–1135. [Google Scholar] [CrossRef] [PubMed]
  73. Scharnweber, K.; Peura, S.; Attermeyer, K.; Bertilsson, S.; Bolender, L.; Buck, M.; Einarsdóttir, K.; Garcia, S.L.; Gollnisch, R.; Grasset, C.; et al. Comprehensive analysis of chemical and biological problems associated with browning agents used in aquatic studies. Limnol. Oceanogr. Methods 2021, 19, 818–835. [Google Scholar] [CrossRef]
  74. Rodríguez, H.; de las Rivas, B.; Gómez-Cordovés, C.; Muñoz, R. Degradation of tannic acid by cell-free extracts of Lactobacillus plantarum. Food Chem. 2008, 107, 664–670. [Google Scholar] [CrossRef]
  75. Pallardy, S.G.; Nigh, T.A.; Garrett, H.E. Changes in forest composition in central Missouri: 1968–1982. Am. Midl. Nat. 1988, 120, 380–390. [Google Scholar] [CrossRef]
  76. Abrams, M.D. Fire and the development of oak forests. Bioscience 1992, 42, 346–353. [Google Scholar] [CrossRef]
  77. Zhu, K.; Woodall, C.W.; Clark, J.S. Failure to migrate: Lack of tree range expansion in response to climate change. Glob. Chang. Biol. 2012, 18, 1042–1052. [Google Scholar] [CrossRef]
Figure 1. Relationship between CDOM interference in FluoroSense handheld fluorometer and water color [measured with three wavelengths (436, 525, 620) and summed]. CDOM from dye was not used to fit the relationship.
Hydrobiology 03 00017 g001
Figure 2. Changes in aqueous tannin concentration by leaf species treatment from weeks one through five. Error bars represent standard error. Note that the estimate of tannin concentration could include some other phenolics.
Hydrobiology 03 00017 g002
Figure 3. Changes in water color (in absorbance units, AU) by leaf species treatment from weeks two through five. Error bars represent standard error.
Hydrobiology 03 00017 g003
Figure 4. Effect of leaf-litter species treatment on chlorophyll a concentrations averaged across weeks two through five. Letters indicate treatments that are significantly different from each other, and error bars represent standard error.
Hydrobiology 03 00017 g004
Figure 5. Change in water color from the first to fifth week of the experiment for each combination of water color and tannin treatments. Error bars represent standard error.
Hydrobiology 03 00017 g005
Figure 6. Change in tannin concentration for each week of the experiment for each combination of water color and tannin treatments. Dates with error bars are when tannins were measured in each replicate, while dates without error bars are when concentrated tannic acid was added or estimates based on data from other dates. Tannic acid was added to the tannin treatment once per week for the first two weeks and twice per week after that. Tannins estimated from the brown water + no tannins are likely false signals from the dyes being hydroxylated aromatic compounds that bound to our reagents used in the Tyrosine method. Error bars represent standard error.
Hydrobiology 03 00017 g006
Figure 7. Effects of water color and tannins on chlorophyll a concentration through time. Error bars are standard error.
Hydrobiology 03 00017 g007
Table 1. Differences in senesced leaf chemistry among the five tree species used in the experiment; different letters indicate significant differences. Tannin values may include some other phenolics, as they were measured using the Tyrosine method.
Common NameScientific NameC
(%)
N
(%)
P
(%)
K
(%)
Tannins (mg/g)
Chinese tallow
American beech
Loblolly pine
Triadica sebiferum47.9 a0.78 a0.10 ab0.49 a166.6 a
Fagus grandifolia47.2 a0.79 a0.11 b0.54 a27.6 c
Pinus taeda51.1 b0.49 b0.05 a0.18 b32.4 c
Red maple
Sweetgum
Acer rubrum46.9 a0.95 a0.18 c0.73 a71.8 b
Liquidambar styraciflua45.5 a0.89 a0.10 ab0.52 a35.3 c
Disclaimer/Publisher’s Note: The statements, opinions and data contained in all publications are solely those of the individual author(s) and contributor(s) and not of MDPI and/or the editor(s). MDPI and/or the editor(s) disclaim responsibility for any injury to people or property resulting from any ideas, methods, instructions or products referred to in the content.

