
Feature Selection Based on Three-Dimensional Correlation Graphs


Abstract
1. Introduction
2. Correlation Analysis and Three-Dimensional Structure Visualization
- points to the strong correlation of values of the attributes A and B;
- is non-correlation of the values of A and B;
- denotes the strong anticorrelation of the values of the studied attributes.
Three-Dimensional Visualization of Correlation Graphs
- A set of vertices V, where each vertex represents one of the attributes of the analyzed dataset.
- A set of edges E denoting the existence of an interesting correlation between a pair of attributes (vertices) interconnected by any of the edges.
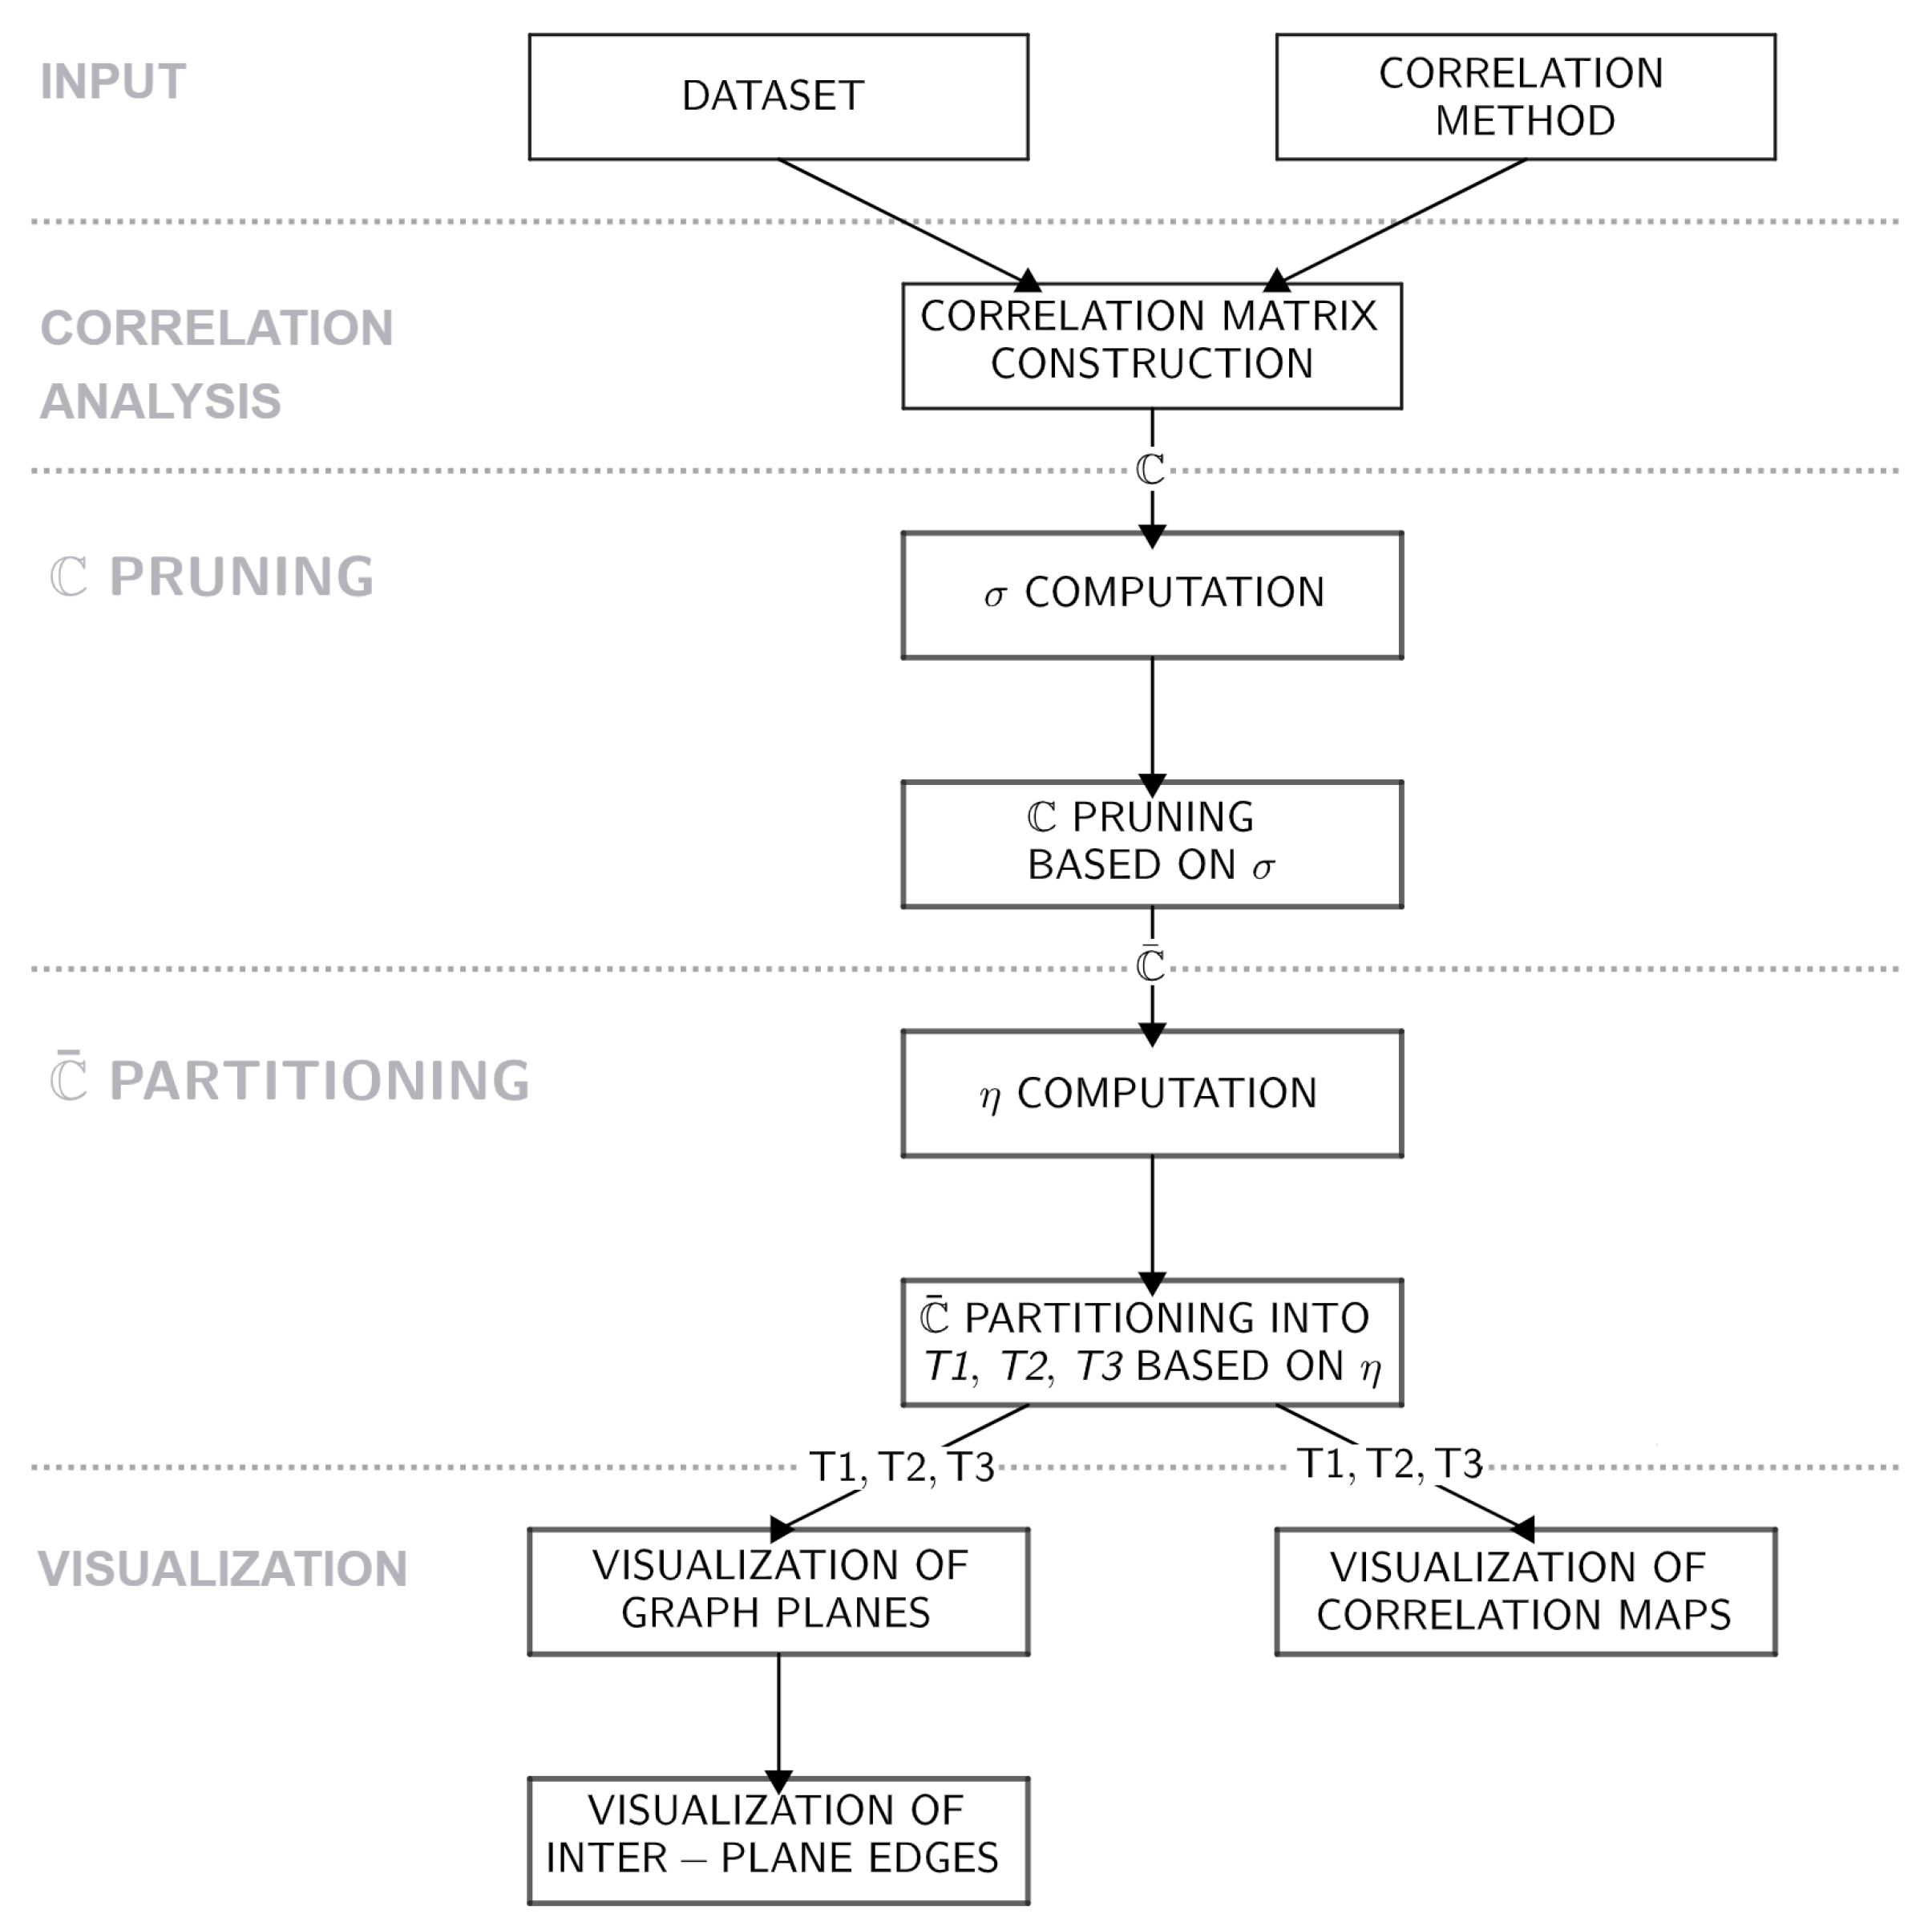
- Construction of correlation matrix . The first step of the proposed method consists of the construction of a correlation matrix based on the user-defined correlation coefficient type—Pearson, Spearman, or Kendall correlation.
- Pruning of . After its construction, the correlation matrix is pruned using the -masking approach specified in Equations (7) and (8). As a part of this step, some of the attributes, which do not share any correlation coefficient values, where , are dropped from the ; hence, the pruning produces so-called pruned correlation matrix , which represents the first step of the feature selection process performed in the proposed model.
- Partitioning of into tertiles. The constructed is then examined row-wise, while for each of its rows a (attributes of the dataset remaining in the ), the overall correlation strength is computed asBased on this aggregation metric, the attributes of the dataset are ranked and sorted into three partitions—tertiles. The first tertile () consists of the attributes which reached the value in the bottom third of the interval, the second tertile () contains attributes in the middle third of these values, and the third tertile () denotes the portion of attributes which reach values in the highest third of the interval. Subsequently, each of the tertiles is described by its own partial correlation matrix where .
- Visualization of three-dimensional correlation graph. The partial correlation matrices constructed in the previous step of the method are used as the adjacency matrices for the graph visualization. The correlation graph for each of the tertiles is visualized in a separate plane of the considered three-dimensional space, and these graph components are interconnected via the strongest correlations between and and and identified in . The schema of this visualization is presented in the upper portion of Figure 2.
- Visualization of additional elements. As the last step of the proposed visualization, the partial heatmaps of the dataset are visualized in the bottom part of the resulting model (see Figure 2). Even though the edges of the correlation graph could be weighted using correlation coefficient values, such a presentation of information would clutter the visualization itself and make it less effective. Therefore, the partial heatmaps for tertiles were added as an element for additional examination of relationships between the data.
| Algorithm 1 Pseudocode for the proposed visualization approach |
Require: Dataset D with n attributes, correlation method
|
3. Evaluation of the Proposed Feature Selection Approach
- Dataset: As noted, the evaluation of the feature selection strategy is conducted on the case study of a selected multidimensional dataset. For these purposes, the Appliance Energy dataset [16], focused on energy use of appliances in a low-energy building, is utilized. This dataset consists of 28 attributes describing the temperature, humidity, and usage of lights in individual rooms of the studied building and relevant environmental attributes such as the wind speed, visibility, or the dew point measured outside the building. The values of these attributes are recorded over a set of 19,735 measurements.
- Evaluated criteria: The behavior of the proposed visualization model in the feature selection process is evaluated from two distinct points of view—firstly, the quality of visualization itself is examined utilizing the Qualitative Result Inspection and Visual Data Analysis and Reasoning approaches [17] for the evaluation of visual models; secondly, the influence of the feature selection based on the proposed approach on the quality of regression models is evaluated using three standard regression model quality metrics—Root Mean-Squared Error (RMSE) [18], Mean Absolute Error (MAE) [18], and Symmetric Mean Absolute Percentage Error (SMAPE) [19]. For an attribute A, these metrics are computed as follows:where denotes the i-th value of the attribute A predicted by the selected regression algorithm, while is the actual i-th value of the attribute, and n denotes the number of measured entities for the attribute A.
- Regressor: Hence, for the regression analysis and its subsequent evaluation, a regression model is needed. In the study, the Support Vector Regressor (SVR), which constructs a hyperplane in a high-dimensional feature space to estimate continuous attribute values while focusing on keeping the most training data within a specified margin of tolerance (marked as ) and penalizing predictions that fall outside this margin is used [20]. This model is utilized for its computational advantages, mainly its efficiency and low training times, its ability to work with outliers, and its flexibility. In this work, the hyperparameters of the regressor are set up as follows [20]:
- –
- . In the case of the system utilized in this study, the Radial Basis Function (RBF)-type kernel was used for its ability to model non-linear relationships between the input and the output attributes.
- –
- . The penalty value C is used in order to control the equilibrium between achieving a low training error and a low testing error, therefore achieving the balance between underfitting and overfitting of the model.
- –
- . The width of the margin defines a margin of tolerance where no penalty is given for incorrectly estimated values.
3.1. Three-Dimensional Correlation Graph Visualization
- for the Pearson correlation coefficient.
- for the Spearman rank correlation coefficient due to added ranking of values in all studied attributes.
- for the Kendall rank correlation due to added combinatorics behind the computation of concordance and discordance for the coefficient.
3.2. Feature Selection with the Use of Three-Dimensional Correlation Graphs
- All attributes of the dataset for the base comparison of regression quality.
- All attributes present in the correlation graph where (Figure 3).
- All attributes of the dataset except the attributes of the third tertile ().
- All attributes of the dataset except the attributes of the second tertile ().
- All attributes of the dataset except the attributes of the first tertile ().
3.3. Comparative Analysis of the Feature Selection Approaches
- Variance threshold selection—the filter, which prunes out the features with low variability of the data. Such attributes are hard to use effectively in the context of predictive analysis and therefore cause noise or are rarely relevant for the decision-making process itself [22].
- Correlation filter selection—this method computes the pairwise correlation matrix for all attributes of a dataset and then drops one attribute from each highly correlated pair. By eliminating this redundancy, the method focuses on the retention of one representative of each tightly linked subgroup of attributes [22].
- Feature agglomeration selection—a clustering-based technique that treats each feature as an object and performs hierarchical agglomerative clustering on them. Each cluster is then aggregated to form a new aggregated attribute [23].
4. Conclusions
- Dynamic data partitioning—in the presented version of the feature selection visualization, the considered space described via correlation matrix is partitioned into three parts—tertiles. Since this approach is somewhat restricting, a dynamic approach based on cluster analysis or other data partitioning methods is of high interest.
- Utilization of virtual reality tools in visualization—since the process of visualization of any type of analytical model involving three-dimensional space is challenging on the standard computing means, the use of virtual reality tools in the problem is highly needed. The future work in this area can focus on such utilization of virtual reality environments for the design and implementation of three-dimensional correlation graph visualization complemented by various interactive features available in virtual reality tools.
- Visualization of correlation graphs with embedded regressors—as shown in the evaluation of the proposed model, the feature selection based on correlation analysis is conducted in the context of regression analysis. This motivates the need for regressors embedded in the visualized graphs themselves, which would be used for the initial evaluation of feature selection quality and offer additional information about the model.
- Integration with feature embedding methods—while the proposed method is based on correlation analysis for interpretable and visually guided feature selection, its integration with a feature embedding techniques such as autoencoders, , or can be examined. Combining these methods may enhance the ability to capture non-linear relationships and high-dimensional structures, potentially leading to more robust and informative feature selection processes.
Author Contributions
Funding
Data Availability Statement
Conflicts of Interest
Abbreviations
| G | Graph |
| E | Set of edges |
| V | Set of vertices |
| r | Pearson correlation coefficient |
| Spearman rank correlation coefficient | |
| Kendall rank correlation coefficient | |
| Correlation matrix | |
| Pruning border (or mask) | |
| Pruning mask strictness parameter | |
| Pruned | |
| Overall correlation strength of an attribute | |
| RMSE | Root Mean-Squared Error |
| MAE | Mean Absolute Error |
| SMAPE | Symmetric Mean Absolute Percentage Error |
| SVR | Support Vector Regression |
| RBF | Radial Basis Function |
| T1 | First tertile |
| T2 | Second tertile |
| T3 | Third tertile |
References
- Lamsaf, A.; Carrilho, R.; Neves, J.C.; Proença, H. Causality, Machine Learning, and Feature Selection: A Survey. Sensors 2025, 25, 2373. [Google Scholar] [CrossRef] [PubMed]
- Theng, D.; Bhoyar, K.K. Feature selection techniques for machine learning: A survey of more than two decades of research. Knowl. Inf. Syst. 2024, 66, 1575–1637. [Google Scholar] [CrossRef]
- Qiang, Q.; Zhang, B.; Zhang, C.J.; Nie, F. Adaptive bigraph-based multi-view unsupervised dimensionality reduction. Neural Netw. 2025, 188, 107424. [Google Scholar] [CrossRef] [PubMed]
- Zhang, J.; Yang, X.; Zhu, W.; Wu, D.; Wan, J.; Xia, N. A Combined Model WAPI Indoor Localization Method Based on UMAP. Int. J. Commun. Syst. 2025, 38, e70034. [Google Scholar] [CrossRef]
- Allaoui, M.; Belhaouari, S.B.; Hedjam, R.; Bouanane, K.; Kherfi, M.L. t-SNE-PSO: Optimizing t-SNE using particle swarm optimization. Expert Syst. Appl. 2025, 269, 126398. [Google Scholar] [CrossRef]
- Duan, Z.; Li, T.; Ling, Z.; Wu, X.; Yang, J.; Jia, Z. Fair streaming feature selection. Neurocomputing 2025, 624, 129394. [Google Scholar] [CrossRef]
- Chen, H.; Zhang, W.; Yan, D.; Huang, L.; Yu, C. Efficient correlation information mixer for visual object tracking. Knowl.-Based Syst. 2024, 285, 111368. [Google Scholar] [CrossRef]
- Jia, W.; Sun, M.; Lian, J.; Hou, S. Feature dimensionality reduction: A review. Complex Intell. Syst. 2022, 8, 2663–2693. [Google Scholar] [CrossRef]
- Dudáš, A. Graphical representation of data prediction potential: Correlation graphs and correlation chains. Vis. Comput. 2024, 40, 6969–6982. [Google Scholar] [CrossRef]
- Cao, H.; Li, Y. Research on Correlation Analysis for Multidimensional Time Series Based on the Evolution Synchronization of Network Topology. Mathematics 2024, 12, 204. [Google Scholar] [CrossRef]
- Iantovics, L.B. Avoiding Mistakes in Bivariate Linear Regression and Correlation Analysis, in Rigorous Research. Acta Polytech. Hung. 2024, 21, 33–52. [Google Scholar] [CrossRef]
- Alessandrini, M.; Falaschetti, L.; Biagetti, G.; Crippa, P.; Luzzi, S.; Turchetti, C. A Deep Learning Model for Correlation Analysis between Electroencephalography Signal and Speech Stimuli. Sensors 2023, 23, 8039. [Google Scholar] [CrossRef] [PubMed]
- Sunil, K.; Chong, I. Correlation Analysis to Identify the Effective Data in Machine Learning: Prediction of Depressive Disorder and Emotion States. Int. J. Environ. Res. Public Health 2018, 15, 2907. [Google Scholar]
- Connor, R.; Dearle, A.; Claydon, B.; Vadicamo, L. Correlations of Cross-Entropy Loss in Machine Learning. Entropy 2024, 26, 491. [Google Scholar] [CrossRef] [PubMed]
- Dudáš, A.; Michalíková, A.; Jašek, R. Fuzzy Masks for Correlation Matrix Pruning. IEEE Access 2025, 13, 35387–35400. [Google Scholar] [CrossRef]
- Candanedo, L.; Feldheim, V.; Deramaix, D. Data driven prediction models of energy use of appliances in a low-energy house. Energy Build. 2017, 140, 81–97. [Google Scholar] [CrossRef]
- Isenberg, T.; Isenberg, P.; Chen, J.; Sedlmair, M.; Möller, T. A Systematic Review on the Practice of Evaluating Visualization. IEEE Trans. Vis. Comput. Graph. 2013, 19, 2818–2827. [Google Scholar] [CrossRef] [PubMed]
- Kenyi, M.G.S.; Yamamoto, K. A hybrid SARIMA-Prophet model for predicting historical streamflow time-series of the Sobat River in South Sudan. Discov. Appl. Sci. 2024, 6, 457. [Google Scholar] [CrossRef]
- Khan, S.; Muhammad, Y.; Jadoon, I.; Awan, S.E.; Raja, M.A.Z. Leveraging LSTM-SMI and ARIMA architecture for robust wind power plant forecasting. Appl. Soft Comput. 2025, 170, 112765. [Google Scholar] [CrossRef]
- Zhang, H.; Sheng, Y.H. v-SVR with Imprecise Observations. Int. J. Uncertain. Fuzziness -Knowl.-Based Syst. 2025, 33, 235–252. [Google Scholar] [CrossRef]
- Velliangiri, S.; Alagumuthukrishnan, S.J.P.C. S A Review of Dimensionality Reduction Techniques for Efficient Computation. Procedia Comput. Sci. 2019, 165, 104–111. [Google Scholar] [CrossRef]
- Kamalov, F.; Sulieman, H.; Alzaatreh, A.; Emarly, M.; Chamlal, H.; Safaraliev, M. Mathematical Methods in Feature Selection: A Review. Mathematics 2024, 13, 996. [Google Scholar] [CrossRef]
- Zhou, P.; Wang, Q.; Zhang, Y.; Ling, Z.; Zhao, S.; Wu, X. Online Stable Streaming Feature Selection via Feature Aggregation. ACM Trans. Knowl. Discov. Data 2025, 19, 65. [Google Scholar] [CrossRef]


| Input | Output | RMSE | MAE | SMAPE | Time |
|---|---|---|---|---|---|
| All attributes | T_out | 0.2271 | 0.1237 | 4.78 | 25.08 |
| RH_8 | 1.1257 | 0.8035 | 1.90 | 25.28 | |
| rv1 | 1.491 | 0.8606 | 9.70 | 26.59 | |
| Appliances | 98.6612 | 42.2961 | 33.85 | 27.32 | |
| Attributes of correlation graph | T_out | 0.1674 | 0.0959 | 3.84 | 10.89 |
| RH8 | 1.2317 | 0.898 | 2.12 | 19.47 | |
| rv1 | 0.8562 | 0.4929 | 6.70 | 15.45 | |
| Appliances | 99.6765 | 43.1084 | 34.83 | 20.90 | |
| All attributes except T3 of correlation graph | T_out | 0.3209 | 0.1487 | 5.64 | 20.08 |
| RH_8 | 1.4834 | 1.0772 | 2.53 | 19.99 | |
| rv1 | 1.4469 | 0.8069 | 8.81 | 21.56 | |
| Appliances | 101.6412 | 44.0997 | 35.57 | 24.03 | |
| All attributes except T2 of correlation graph | T_out | 0.2787 | 0.1315 | 5.21 | 21.77 |
| RH_8 | 1.911 | 1.4282 | 3.36 | 22.68 | |
| rv1 | 1.4232 | 0.7841 | 8.88 | 20.83 | |
| Appliances | 102.1719 | 44.4083 | 35.83 | 19.98 | |
| All attributes except T1 of correlation graph | T_out | 0.6637 | 0.4522 | 12.56 | 23.37 |
| RH_8 | 1.1419 | 0.8075 | 1.90 | 23.64 | |
| rv1 | 14.4836 | 12.5316 | 57.72 | 25.02 | |
| Appliances | 100.874 | 43.001 | 34.14 | 27.07 |
| Method | Output | Number of Attributes | RMSE | MAE | SMAPE | Time |
|---|---|---|---|---|---|---|
| Variance Threshold Selector | T_out | 27 | 1.7406 | 1.3267 | 32.95 | 15.84 |
| RH_8 | 27 | 3.5384 | 2.0406 | 4.79 | 15.95 | |
| rv1 | 27 | 4.1104 | 3.5157 | 26.13 | 16.30 | |
| Appliances | 27 | 104.9489 | 47.8879 | 40.63 | 17.46 | |
| Correlation Filter | T_out | 16 | 2.0564 | 1.3953 | 36.40 | 13.19 |
| RH_8 | 16 | 3.1584 | 2.5387 | 5.93 | 12.83 | |
| rv1 | 16 | 3.7175 | 3.1669 | 24.46 | 13.02 | |
| Appliances | 15 | 104.9681 | 47.9392 | 40.71 | 13.02 | |
| Feature Agglomeration | T_out | 15 | 1.8495 | 1.4322 | 34.33 | 11.64 |
| RH_8 | 15 | 2.9331 | 2.3488 | 5.49 | 11.89 | |
| rv1 | 15 | 3.6498 | 3.1066 | 24.16 | 12.11 | |
| Appliances | 15 | 104.9674 | 47.9149 | 40.67 | 13.04 |
Disclaimer/Publisher’s Note: The statements, opinions and data contained in all publications are solely those of the individual author(s) and contributor(s) and not of MDPI and/or the editor(s). MDPI and/or the editor(s) disclaim responsibility for any injury to people or property resulting from any ideas, methods, instructions or products referred to in the content. |
© 2025 by the authors. Licensee MDPI, Basel, Switzerland. This article is an open access article distributed under the terms and conditions of the Creative Commons Attribution (CC BY) license (https://creativecommons.org/licenses/by/4.0/).
Share and Cite
Dudáš, A.; Szoliková, A. Feature Selection Based on Three-Dimensional Correlation Graphs. AppliedMath 2025, 5, 91. https://doi.org/10.3390/appliedmath5030091
Dudáš A, Szoliková A. Feature Selection Based on Three-Dimensional Correlation Graphs. AppliedMath. 2025; 5(3):91. https://doi.org/10.3390/appliedmath5030091
Chicago/Turabian StyleDudáš, Adam, and Aneta Szoliková. 2025. "Feature Selection Based on Three-Dimensional Correlation Graphs" AppliedMath 5, no. 3: 91. https://doi.org/10.3390/appliedmath5030091
APA StyleDudáš, A., & Szoliková, A. (2025). Feature Selection Based on Three-Dimensional Correlation Graphs. AppliedMath, 5(3), 91. https://doi.org/10.3390/appliedmath5030091