Abstract
Functional segregation in brain networks refers to the division of specialized cognitive functions across distinct regions, enabling efficient and dedicated information processing. This paper explores the significance of functional segregation in shaping brain network architecture, highlighting methodologies such as modularity and local efficiency that quantify the degree of specialization and intra-regional communication. We examine how these metrics reveal the presence of specialized modules underpinning various cognitive processes and behaviors and discuss the implications of disruptions in functional segregation in neurological and psychiatric disorders. Our findings underscore the fact that understanding functional segregation is crucial for elucidating normal brain function, identifying biomarkers, and developing therapeutic interventions. Overall, functional segregation is a fundamental principle governing brain organization, and ongoing research into its mechanisms promises to advance our comprehension of the brain’s complex architecture and its impact on human health.
1. Introduction
Network theory offers an intuitive framework for exploring relationships among interconnected brain mechanisms and their influence on behavior, but the diversity of network models can cause confusion across disciplines [1,2]. The field of network neuroscience is organized around fundamental goals, common model types along three key dimensions (from data to theory, biophysical realism to phenomenology, and elementary to coarse-grained descriptions), and validation principles based on descriptive, explanatory, and predictive validity. Different models serve distinct purposes, and bridging these types can enhance understanding by leveraging their respective strengths. To advance the field, researchers are encouraged to clarify their model definitions, develop methods for assessing validity, and foster integration across diverse model frameworks. The integration of network science and neuroscience has led to significant advances in understanding brain development, function, and disease and has opened up new opportunities for the development of novel network-based methods that can address the unique challenges and priorities of brain research [1,2,3,4].
Network communication models in neuroscience aim to understand how complex brain networks facilitate and constrain neural information transfer, using graph theory and network science to describe and quantify information transfer in structural connectomes. These models, including routing protocols, diffusion processes, and parametric models, offer a flexible and interpretable framework to study brain function and have been applied to investigate a range of fundamental, cognitive, and clinical neuroscience questions [3]. The human brain is organized into functional modules, which are connected by weaker ties that allow for efficient information transfer and minimize wiring costs, providing a solution to the paradox of how modular brain networks can efficiently integrate information. This organization is reminiscent of the “strength of weak ties” concept in sociology, and the brain’s topology can be classified into universality classes under the renormalization group theory, with critical exponents that describe the scaling properties of brain modules [4].
The renormalization group (RG) is a powerful tool in statistical physics that has been applied to various complex systems, including networks, but its application to complex networks has proven challenging due to correlations between intertwined scales. Developing an RG scheme that can effectively capture the scaling properties of complex networks remains an open problem in the field of network science [5]. Applying renormalization techniques to neural networks enables the identification of characteristic scales and effective structures, facilitating the analysis of large, heterogeneous brain systems and bridging the gap between microscopic neuronal activity and macroscopic functional organization [6].
Understanding the organization of complex systems, such as the brain, often requires advanced analytical tools that are capable of detecting structures across multiple scales without bias toward larger or more prominent modules. Developing algorithms that can accurately identify small and subtle features within large, noisy datasets is crucial for making meaningful discoveries in fields ranging from neuroscience to network science and beyond [7]. Investigating how information propagates within complex neural networks across different scales is essential for understanding brain functions like motor control, and advanced methods such as transfer entropy and graph theory can reveal hierarchical and dynamic organization in these networks. Developing analytical tools that capture multiscale and directional interactions in brain networks enables deeper insights into the neural mechanisms underlying behavior, including decision-making and inhibition, moving beyond simple correlation measures toward considerations of functional hierarchy and information flow [8]. Understanding the key nodes that facilitate communication within complex networks is essential across many fields, as it helps identify which elements are most influential for maintaining overall system functionality. Developing methods to predict and target these influential components can lead to more effective interventions in biological, technological, and social systems [9].
Modularity reflects the organization of brain networks into densely interconnected communities of regions, which can be quantified using graph theory to assess their community structure. In neuropsychiatric disorders like childhood-onset schizophrenia, this modular architecture appears disrupted, with reductions in intra-modular connections and overall network segregation, indicating abnormal topological organization that may underlie cognitive deficits [10]. Graph theoretical approaches have shown that the brain’s modular organization often appears limited by the resolution of the methods used, potentially obscuring smaller but functionally important communities. Recent advances, such as Surprise maximization, have overcome this resolution limit, revealing a rich and heterogeneous modular structure in brain networks that better captures the complexity of neural organization and may improve the detection of subtle topological differences across conditions or populations [11]. Recent studies have shown that complex brain networks’ modular structures are often underestimated by traditional methods due to resolution limits, but new approaches like Surprise maximization can reveal richer, more heterogeneous community architecture, which better reflects the brain’s functional organization [12]. Although second-order maximum entropy models effectively predict a large portion of correlated neural activity in cortical networks, their failure to account for observed long sequences of states suggests the need to incorporate temporal dependencies, as pairwise temporal correlations appear to influence the dynamics and extend the complexity beyond that which static models can capture [13]. By constructing models based on the distribution of global network activity, the maximum entropy principle reveals that neural networks—such as retinal circuits—operate near a unique critical point where entropy equals energy, suggesting the presence of an unusual thermodynamic state that is indicative of collective, potentially critical, and neural behavior [14].
The human brain is an extraordinarily intricate network composed of numerous interconnected regions, each playing a vital role in supporting a wide array of cognitive processes and behaviors. These regions work in concert to enable functions such as perception, decision-making, language, and motor control, showcasing the brain’s remarkable capacity for complex information processing. The interconnected nature of these regions allows for seamless communication and coordination, which is essential for adaptive and flexible responses to both internal and external stimuli. This intricate network architecture underpins the brain’s ability to perform diverse tasks efficiently and reliably, highlighting the importance of understanding how different regions collaborate within this complex system [15,16,17,18].
One of the foundational principles governing brain organization is functional segregation, which is a concept that refers to the specialization of specific regions or groups of regions in handling particular types of information or executing dedicated functions. This specialization ensures that each part of the brain can optimize its processing capabilities for specific tasks, such as visual recognition, language comprehension, or motor coordination. By delineating clear functional boundaries, the brain can operate more efficiently, reducing redundancy and enhancing the precision of information processing. Functional segregation is thus crucial for the brain’s capacity to handle complex cognitive demands while maintaining overall coherence across different processes [19].
Functional segregation manifests across multiple levels of brain organization, from the microscopic scale of individual neurons to the macroscopic scale of large-scale networks spanning the entire brain. At the microscopic level, neurons within a given region exhibit unique properties and connectivity patterns that enable them to process specific types of information, such as visual or auditory signals. These localized properties support the segregation of functions at a cellular level, forming the building blocks for specialized processing units. On a broader scale, entire brain regions form interconnected networks that are dedicated to distinct functions, such as sensory perception, motor control, language, and memory. These large-scale networks are characterized by their specialized roles and ability to communicate efficiently with one another, facilitating integrated cognitive functioning [20,21,22].
Quantifying functional segregation within brain networks involves analyzing their topological properties to identify the presence of specialized communities or modules. Network analysis provides a powerful framework for understanding how the brain’s architecture supports its functions. One popular metric is modularity, which measures the degree to which a network can be divided into distinct, non-overlapping modules based on connectivity patterns. High modularity indicates a clear division into specialized communities, each potentially corresponding to a specific cognitive domain or sensory modality. In addition, local efficiency serves as another important measure, assessing how effectively information is transferred within densely interconnected clusters of regions. High local efficiency reflects rapid and efficient communication within these modules, which is essential for executing complex cognitive tasks and maintaining functional integration within specialized areas [23,24,25,26].
Together, these network measures provide critical insights into the organizational principles of brain function, revealing how specialized modules are structured and how they facilitate efficient information processing. Understanding the modular architecture of the brain allows researchers to decipher the neural basis of various cognitive and behavioral functions. The significance of functional segregation extends beyond basic neuroscience, with profound implications for clinical research and practice. Disruptions in the modular organization of brain networks have been linked to numerous neurological and psychiatric conditions, emphasizing the importance of studying these patterns to identify biomarkers and develop targeted interventions [27,28,29]. By characterizing the modular structure and the integrity of functional modules, scientists can better understand the neural substrates underlying different cognitive processes and sensory functions. Moreover, alterations in functional segregation are often associated with disease states, making this a vital area of research for understanding pathophysiology and improving therapeutic strategies [30,31,32].
The tendency of brain regions to form clusters or communities with strong internal connections—while maintaining weaker links with other regions—reflects a fundamental aspect of brain organization known as functional segregation [33,34,35,36]. This clustering indicates that specialized processing predominantly occurs within localized regions, enabling the brain to optimize its functional capacity [37,38,39]. The degree of this segregation influences how efficiently the brain processes information and responds adaptively to complex environmental demands [40,41,42]. Recognizing and analyzing these community structures provides invaluable insights into the neural basis of cognition and behavior, as well as the disruptions that occur in various neurological and psychiatric disorders [43,44,45,46]. Understanding the balance between localized specialization and global integration remains central to unraveling the complexities of brain function in health and disease.
In this paper, we examine the multifaceted aspects of functional segregation by exploring its critical role in shaping the brain’s network architecture. We employ quantitative methodologies to measure the degree of segregation within brain networks, focusing on key metrics such as modularity and local efficiency. These tools allow us to assess how effectively the brain’s network is partitioned into specialized modules and how efficiently information is transferred within these densely connected regions. By analyzing these measures, we aim to uncover the underlying organizational principles that facilitate the brain’s ability to perform diverse cognitive functions. Furthermore, we investigate how disruptions in functional segregation are linked to neurological and psychiatric disorders, providing insights into the neural substrates of health and disease. Our approach offers a comprehensive understanding of the modular structure of brain networks and the importance of functional segregation in supporting complex cognition and behavior.
2. Method
The method used in this study involves generating synthetic correlation matrices to identify communities within regions of interest (ROIs) and overlaying these detected communities on correlation matrix plots. Synthetic correlation matrices are created to simulate the connectivity patterns between brain regions, which are constructed using statistical models or algorithms that mimic the properties of real correlation matrices observed in neuroimaging data. These matrices capture the relationships between different brain regions, representing the strengths of functional connectivity, and are made symmetrical to accurately represent an undirected graph. The generated matrices are then applied to specific ROIs, which are predefined regions in the brain, and within each ROI, community detection algorithms are employed to identify groups of nodes that exhibit strong interconnectivity or functional coherence; in this study, the Louvain method was used for community detection to identify functionally segregated modules within the network. Once these communities were identified, they were overlaid onto the correlation matrix plots, which visually depict the strength of connections between nodes within each ROI. These superimposed communities highlight regions that belong to the same functional modules or networks, facilitating the visualization of the organization and relationships between functional communities within each ROI. This process was repeated across multiple ROIs, each containing a set of nodes representing specific brain regions or functional areas, such as in cases with 10 ROIs, each comprising 20 nodes, allowing for individual analysis and the visualization of functional modules within each region. Figure 1 illustrates the comprehensive process used to analyze functional brain networks from resting-state fMRI (rs-fMRI) data. The process begins with the acquisition of rs-fMRI images, which capture spontaneous brain activity. These images are then subjected to brain parcellation, dividing the brain into predefined regions of interest (ROIs). From these ROIs, we extracted rs-fMRI signals, resulting in time series data representing neural activity within each region. Using these signals, we computed a correlation matrix that quantified the functional connectivity between all pairs of ROIs, serving as a basis for constructing the functional brain network. This correlation matrix was visualized as a connectivity plot, highlighting the strength of relationships among brain regions. To further analyze the network’s organization, we applied graph theory techniques, identifying communities or modules within the network through community detection algorithms such as the Louvain method. These communities were overlaid onto the correlation matrix to visualize the modular structure of the brain’s functional network. The final step involved graph theory analysis, where metrics such as modularity and local efficiency were computed to quantify the degree of functional segregation and integration within the network. This comprehensive approach enabled a detailed understanding of the brain’s functional organization and its underlying network properties.
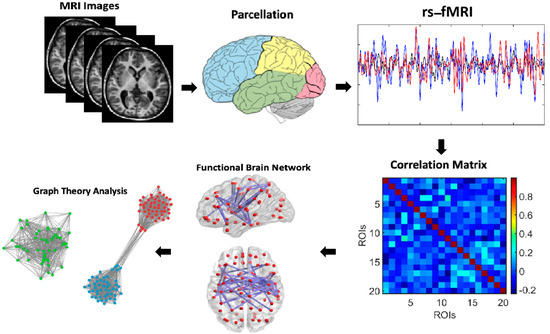
Figure 1.
Schematic representation of brain network analysis. This schematic illustrates the workflow for analyzing functional brain networks from rs-fMRI data. It begins with rs-fMRI images, which are parcellated into predefined ROIs. From these regions, time series are extracted to compute a correlation matrix representing functional connectivity. This matrix is visualized as a connectivity plot and then analyzed using graph theory to identify communities or modules, using techniques such as the Louvain method. These communities are overlaid on the matrix, and metrics like modularity and local efficiency are calculated to assess the brain’s functional segregation and network organization.
2.1. Force-Directed Layout
Force-directed layout is a method used to visualize graphs by simulating the physical forces between nodes. Mathematically, the method can be described as follows. We start by assigning initial positions to each node in the graph. Next, we find the forces between nodes. Repulsive forces are defined when nodes repel each other, and the magnitude of the repulsive force between two nodes is inversely proportional to the square of the distance between them. Mathematically, the repulsive force between two nodes i and j is given by Coulomb’s law:
where is a constant representing the strength of repulsion. and are changes associated with nodes and , respectively (usually set to 1). is the Euclidean distance between nodes and .
Next, we define attractive forces. Connected nodes (nodes with an edge between them) attract each other, and the magnitude of the attractive force between two connected nodes is directly proportional to the distance between them. Mathematically, the attractive force, , between two connected nodes, and , is given by Hook’s law:
where is a constant representing the strength of attraction. is the desired length (equilibrium) of the spring connecting the nodes. Then, we define Net Force Calculation. We compute the net force acting on each node by summing the attractive forces from connected nodes and the repulsive forces from all the other nodes. After that, we calculate velocity. We update the velocity of each node based on the net force acting on it using Newton’s second law (), where is the mass of the node (usually set to 1) and is the acceleration. Afterward, we update the position of each node based on its velocity and the integration time step. We repeat steps 3–5 until the system reaches equilibrium (when the net force on each node approaches zero or within a predefined threshold). Next, we visualize the graph using the final positions of the nodes. By simulating these physical forces iteratively, the force-directed layout algorithm arranges the nodes in a visually pleasing manner, often revealing underlying patterns and structures in the graph.
2.2. Community Matrix
In the context of graph theory and network analysis, a community matrix is a mathematical representation that characterizes the partitioning of nodes in a graph into communities or modules. Mathematically, the community matrix is a square matrix of size , where is the number of nodes in the graph. Each element, , of the community matrix represents the membership of node in community . Specifically, if node belongs to community , and otherwise. The community matrix can be interpreted as an indicator matrix, where each row corresponds to a node in the graph, and each column corresponds to a community. The value of indicates whether node is a member of community . The community matrix is a fundamental tool in community detection algorithms, which aim to identify densely connected groups of nodes (communities) within a network. By analyzing the structure of the community matrix, researchers can gain insight into the modular organization of networks and the relationships between nodes within and across communities.
2.3. Hierarchical Clustering
Hierarchical clustering is a method of cluster analysis that builds a hierarchy of clusters by recursively partitioning the data into smaller and smaller clusters. Mathematically, hierarchical clustering can be described as follows. Hierarchical clustering starts with each data point as a separate cluster. Then, we compute the distance or dissimilarity between each pair of clusters. The choice of distance metric depends on the nature of the data (e.g., the Euclidean distance for continuous data and the Hamming distance for categorical data). Next, Agglomerative Hierarchical Clustering is applied. This algorithm starts with each data point as a separate cluster and iteratively merges the closest pair of clusters based on the chosen distance metric. This process is repeated until all data points are in a single cluster or until the stopping criterion is met. As clusters are merged or split, a dendrogram or tree-like structure is constructed to represent the hierarchy of clusters. Each node in the dendrogram represents a cluster, and the height of each node represents the distance at which the clusters are merged or split. Hierarchical clustering continues until a stopping criterion is met, such as a predetermined number of clusters, a specified threshold distance, or the maximum desired depth of the dendrogram.
2.4. Local Efficiency
In neuroscience, the local efficiency of brain networks provides information about the capacity for specialized information processing within distinct brain regions. Higher local efficiencies within an ROI suggest that the network in that region is more resilient to node removal and may facilitate faster and more robust communication among neighboring nodes. Understanding variations in local efficiency across different brain regions can help with understanding the functional organization of the brain and its role in supporting cognitive functions and behaviors.
Generally speaking, local efficiency is a measure used in network analysis to quantify the efficiency of information transfer within a local neighborhood of a node in a network. Mathematically, local efficiency is defined as the average inverse shortest path length between all pairs of neighbors of a node. Let be an undirected graph representing a network, where represents the set of neighbors of node , and represents the shortest path length between nodes and in . The local efficiency of node , denoted as , is calculated as follows:
where is the number of neighbors of node . is the shortest path length between nodes and in the local neighborhood of node . The sum is taken over all pairs of neighbors, and , of node .
Intuitively, the local efficiency of a node measures how well its neighbors are connected to each other within the local neighborhood. A higher local efficiency indicates that the neighbors of the node are more efficiently connected to each other, facilitating the exchange of information within the local region of the network.
Local efficiency is a useful measure in characterizing the functional segregation and integration of networks, as it provides insights into the local processing capabilities of individual nodes and their neighborhoods. It is particularly relevant in studies of brain networks, where it can help identify regions of the brain that serve as local hubs for efficient information processing within specific functional modules or regions.
3. Results
Nodes are labeled with indices representing the ROIs and their respective nodes. Communities within the network are visually represented by clusters of nodes that are densely interconnected. The layout of the network is determined by a force-directed algorithm, which positions connected nodes such that they are drawn closer together, highlighting community structure. We began by generating the synthetic correlation matrices on 10 different regions of interest (ROIs) to identify the communities within each ROI (see Figure 2). This initial step provided a controlled environment to evaluate the effectiveness of different community detection approaches in a well-defined setting before applying them to empirical data.
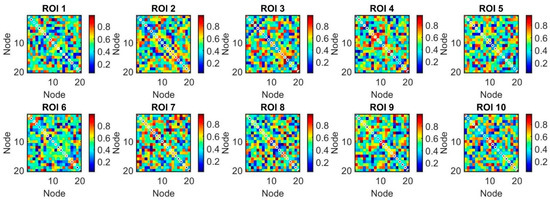
Figure 2.
The application of generated synthetic correlation matrices on regions of interest (ROIs) to identify communities within each ROI, overlaying the detected communities on the correlation matrix plots (10 ROIs, each one with 20 nodes).
We applied a force-directed layout algorithm to the graph, which positions nodes such that those with stronger connections are closer together. This can help visually separate communities (see Figure 3). This algorithm balances attractive forces (proportional to the correlation strength) and repulsive forces to prevent node overlapping. The parameters chosen, such as the optimal number of iterations, the temperature cooling schedule, and force constants, were set based on preliminary tests to ensure stable convergence and a clear visualization of the community structure. These parameters are detailed in the Methods section, allowing other researchers to reproduce the layout precisely.
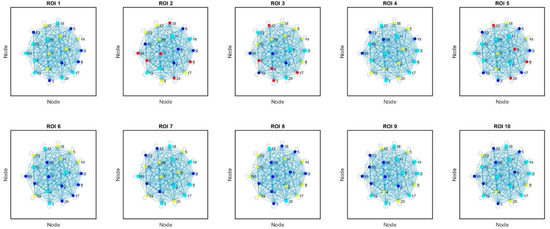
Figure 3.
Force-directed layout visualization of the regions of interest (ROIs) based on their correlation patterns (10 ROIs, each one with 20 nodes). Nodes represent ROIs, and edges represent the correlations between them. The layout is determined by balancing attractive and repulsive forces between nodes, resulting in a spatial arrangement that highlights clusters of highly correlated ROIs.
A critical aspect of our methodology involves selecting the community detection algorithm. We opted for the Louvain method due to its computational efficiency, robustness, and widespread validation in community detection tasks across brain network analyses. Compared to other algorithms, such as Infomap, spectral clustering, or modularity maximization with resolution parameters, the Louvain algorithm offers a good balance between accuracy and scalability, especially for larger networks.
We plot the adjacency matrix where rows and columns are reordered based on community assignment. This can highlight dense blocks along the diagonal, indicating strong intra-community connections (see Figure 4). The community structure derived from the Louvain algorithm was further validated by comparing modularity scores and stability across multiple runs, ensuring that the detected communities are not artifacts of stochasticity.
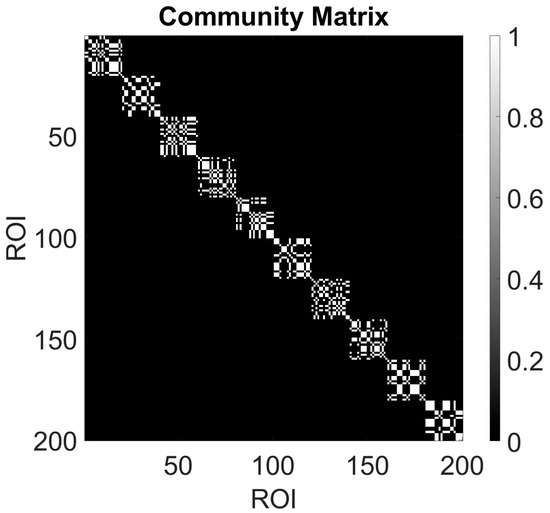
Figure 4.
A community matrix typically represents the assignment of nodes (or ROIs in this case) to communities (10 ROIs, each one with 20 nodes). Each row of the community matrix corresponds to a node/ROI, and the columns represent different communities. The entries indicate whether a node belongs to a particular community (usually denoted by 1) or not (denoted by 0).
We applied hierarchical clustering to the adjacency matrix to group nodes based on their similarity. We plotted the dendrogram to visualize the hierarchical structure of communities (see Figure 5). The dendrogram illustrates the hierarchical clustering of regions of interest (ROIs) based on the similarity of their correlation matrices. Each leaf node in the dendrogram represents a single ROI, and the height of the nodes reflects the distance (e.g., 1—correlation) between them. The choice of linkage method (e.g., average, complete, or ward linkage) was guided by preliminary comparisons, with the average linkage providing a balanced view of cluster relationships consistent with the network topology.
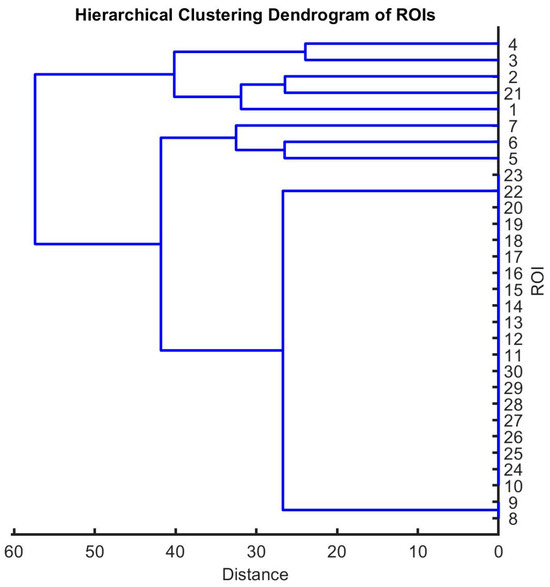
Figure 5.
A hierarchical clustering dendrogram illustrating the hierarchical organization of regions of interest (ROIs) based on their correlation patterns (10 ROIs, each one with 20 nodes). The dendrogram depicts the grouping of ROIs into clusters based on their similarity in correlation profiles, with branches indicating the degree of dissimilarity between clusters.
We visualized the network as a series of interconnected communities, with nodes within each community grouped together and connected by links representing inter-community correlations (see Figure 6). The parameters for the force-directed layout, such as the initial temperature, number of iterations, and force constants, were set based on the prior literature and our preliminary optimization to achieve clear, reproducible community visualization. For instance, the number of iterations was chosen to allow the system to reach equilibrium without over-oscillation, typically set to 1000 cycles, while the attractive and repulsive force coefficients were selected to balance clustering clarity against visual clutter.
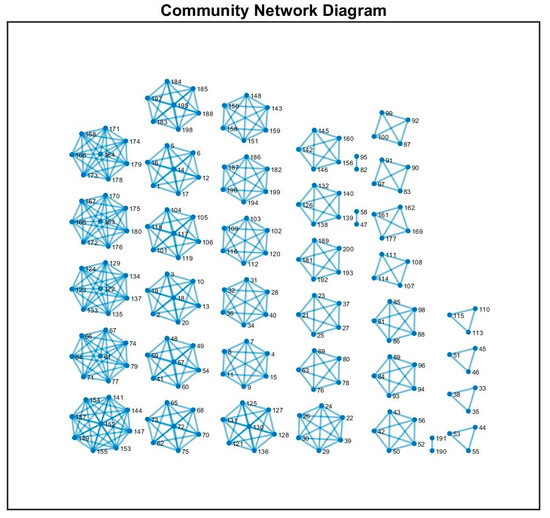
Figure 6.
The figure displays a community network diagram generated from synthetic correlation matrices representing different regions of interest (ROIs) (10 ROIs, each one with 20 nodes). Each node in the network represents a group of nodes within one ROI, and the edges between nodes indicate strong correlations between those groups.
Lastly, to investigate the temporal dynamics of relationships between variables over time, we applied sliding window correlation analysis. Sliding window correlation analysis is a method used to examine the temporal dynamics of relationships between variables over time, commonly applied in the context of time-series data, such as brain imaging (fMRI, rs-fMRI). Sliding window correlation involves dividing a time series into overlapping or non-overlapping windows of fixed length and computing the correlation coefficients for each window. This approach enables an investigation into the strength and direction of relationships between variables and how they change over time (see Figure 7 and Figure 8).
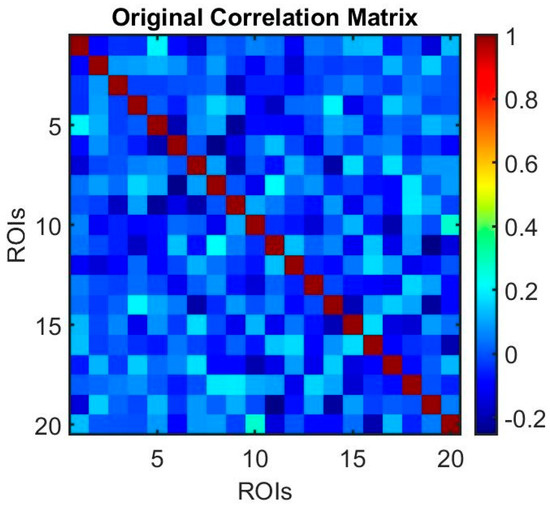
Figure 7.
The correlation matrix (before sliding window analysis) represents the functional connectivity patterns. Each cell in the heatmap represents the correlation coefficient between two regions of interest (ROIs).
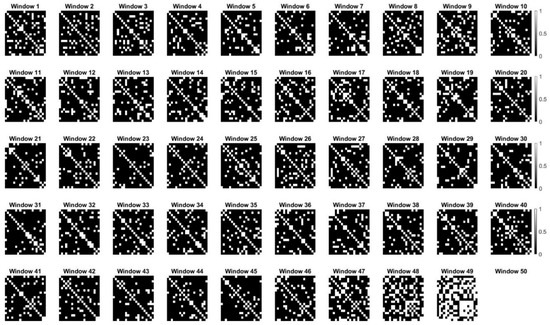
Figure 8.
Dynamic changes in correlation matrices representing brain network connectivity over time (without an optimal window size). Each subplot illustrates the binary correlation matrix for a sliding window of time, with brightness indicating the strength of correlation between regions of interest (ROIs). This analysis reveals the dynamic nature of brain network connectivity and the importance of understanding fluctuating functional interactions within the brain.
The synthetic dynamic changes in correlation matrices depicted in the figure represent the fluctuating connectivity patterns observed in brain networks over time. Each subplot corresponds to a sliding window of time, with brightness indicating the strength of correlations between regions of interest (ROIs). From a brain network perspective, variations in correlation patterns across windows may reflect dynamic functional interactions between brain regions during different cognitive states or tasks. The analysis revealed the dynamic nature of correlation structures within the brain network. This approach allows for the examination of temporal changes in network connectivity while understanding the underlying dynamics of brain function.
4. Discussion
The methodology employed in this study provides a detailed framework for analyzing the modular organization of brain networks derived from rs-fMRI data. Central to our approach was the generation of synthetic correlation matrices that emulate the connectivity patterns observed in neuroimaging studies. These matrices, created using statistical models, capture the strength of functional relationships between brain regions within predefined ROIs, and their symmetrical nature ensures an accurate representation of undirected connectivity. By applying community detection algorithms—specifically the Louvain method—we identified functionally segregated modules within each ROI, which were visually overlaid onto correlation matrix plots to facilitate the interpretation of the organizational structure.
This process was systematically applied across multiple ROIs, each consisting of a set of nodes representing specific brain regions. Starting with the acquisition of rs-fMRI images, we performed parcellation to define ROIs and extracted time-series data to construct correlation matrices, serving as the basis for network analysis. Visualization techniques, such as force-directed layout algorithms, were employed to position nodes; as such, strongly connected regions appeared closer together, revealing community structures visually. Hierarchical clustering further elucidated the relationships among ROIs, with dendrograms illustrating hierarchical organization based on their similarity in connectivity patterns. Reordering adjacency matrices according to community assignments highlighted dense intra-community connections, emphasizing the modular nature of the networks.
The figures generated during the analysis demonstrate each step: synthetic matrices illustrating connectivity within ROIs, force-directed layouts revealing community separation, reordered adjacent matrices displaying dense intra-community blocks, hierarchical dendrograms illustrating nested community structures, and network visualizations depicting interconnected modules. These combined analyses provide a comprehensive view of the brain’s functional segregation, emphasizing the importance of densely interconnected communities within the broader network. Moreover, graph theory metrics such as modularity and local efficiency were employed to quantify the degree of segregation and integration, offering insights into the underlying organizational principles of brain networks. Overall, this approach advances our understanding of the brain’s modular architecture and offers a valuable framework for investigating alterations in network structures associated with neurological and psychiatric disorders.
One limitation of this study is the reliance on synthetic correlation matrices to identify and analyze community structures, which may not fully capture the complexity and variability of real-world neuroimaging data. While these matrices are designed to mimic properties observed in empirical data, they can oversimplify the intricate patterns of functional connectivity present in actual brain networks. Additionally, the use of predefined ROIs and community detection algorithms like the Louvain method may introduce biases, as different parcellation schemes or algorithms could yield varying results. Another limitation is that the analysis primarily focuses on static connectivity patterns, potentially overlooking dynamic changes in network organization that occur over time. These factors suggest that further validation with real, large-scale neuroimaging datasets is necessary to confirm the robustness and generalizability of our findings.
Future research should focus on applying this framework to larger and more diverse real-world datasets, including clinical populations with neurological or psychiatric conditions. This would allow for a better understanding of how functional community structures differ across healthy and diseased brains, potentially leading to the identification of biomarkers for diagnosis or prognosis. Additionally, longitudinal studies utilizing real-world data—such as repeated rs-fMRI scans over time—could provide insights into how brain network organization changes across development, aging, or in response to treatment. Incorporating multimodal data, such as combining rs-fMRI with structural imaging or electrophysiological measures, may further enhance our understanding of the relationship between structural and functional connectivity in real-world scenarios. Ultimately, applying this to large-scale, real-world datasets will improve the translational relevance of our method and contribute to personalized medicine in neuropsychiatry and neurology.
The findings of this study have important implications for advancing our understanding of brain organization and its relevance to health and disease. By identifying and visualizing functional modules within brain networks, this approach provides a framework for exploring how modular architecture supports cognitive function and how disruptions in these communities may underlie neurological and psychiatric disorders. The ability to quantify the degree of functional segregation and integration using graph theory metrics offers potential biomarkers for early diagnosis, monitoring disease progression, or evaluating treatment responses. Moreover, this methodology could inform the development of targeted interventions aimed at restoring or enhancing specific network modules, ultimately contributing to personalized therapeutic strategies and improving clinical outcomes in various brain-related conditions.
5. Conclusions
In conclusion, the application of generated synthetic correlation matrices on regions of interest (ROIs) to identify communities within each ROI and overlaying the detected communities on correlation matrix plots offers a valuable approach to studying functional segregation in the brain. By generating synthetic correlation matrices, we can simulate connectivity patterns between brain regions, allowing for the exploration of functional relationships in a controlled setting. Applying community detection algorithms within ROIs enables the identification of groups of functionally related brain regions, shedding light on the organization of functional networks. Overlaying the detected communities on correlation matrix plots provides visual insights into the spatial distribution of these communities within each ROI and their interconnections. This method facilitates an understanding of how different brain regions interact and contribute to various cognitive processes and behaviors. The proposed approach contributes to advancing our knowledge of brain connectivity and functional organization, with implications for neuroscience research and clinical applications. Understanding functional segregation in brain networks has important implications for understanding the neural mechanisms underlying various cognitive processes and behaviors. It allows us to identify the key brain regions involved in specific functions, such as sensory processing, motor control, language, and memory. Moreover, disruptions in function segregation have been implicated in a wide range of neurological and psychiatric disorders, including Alzheimer’s disease, schizophrenia, and autism spectrum disorders, highlighting the clinical relevance of this research.
Funding
This research received no external funding.
Data Availability Statement
The synthetic data is unavailable due to privacy.
Conflicts of Interest
The author declares no conflict of interest.
References
- Bassett, D.S.; Zurn, P.; Gold, J.I. On the nature and use of models in network neuroscience. Nat. Rev. Neurosci. 2018, 19, 566–578. [Google Scholar] [PubMed]
- Barabási, D.L.; Bianconi, G.; Bullmore, E.; Burgess, M.; Chung, S.; Eliassi-Rad, T.; George, D.; Kovács, I.A.; Makse, H.; Nichols, T.E.; et al. Neuroscience needs network science. J. Neurosci. 2023, 43, 5989–5995. [Google Scholar] [CrossRef]
- Seguin, C.; Sporns, O.; Zalesky, A. Brain network communication: Concepts, models and applications. Nat. Rev. Neurosci. 2023, 24, 557–574. [Google Scholar]
- Gallos, L.K.; Makse, H.A.; Sigman, M. A small world of weak ties provides optimal global integration of self-similar modules in functional brain networks. Proc. Natl. Acad. Sci. USA 2012, 109, 2825–2830. [Google Scholar] [CrossRef] [PubMed]
- Villegas, P.; Gili, T.; Caldarelli, G.; Gabrielli, A. Laplacian renormalization group for heterogeneous networks. Nat. Phys. 2023, 19, 445–450. [Google Scholar] [CrossRef]
- Bardella, G.; Franchini, S.; Pani, P.; Ferraina, S. Lattice physics approaches for neural networks. Iscience 2024, 27, 111390. [Google Scholar]
- Nicolini, C.; Bordier, C.; Bifone, A. Community detection in weighted brain connectivity networks beyond the resolution limit. Neuroimage 2017, 146, 28–39. [Google Scholar] [CrossRef]
- Bardella, G.; Giuffrida, V.; Giarrocco, F.; Brunamonti, E.; Pani, P.; Ferraina, S. Response inhibition in premotor cortex corresponds to a complex reshuffle of the mesoscopic information network. Netw. Neurosci. 2024, 8, 597–622. [Google Scholar] [CrossRef]
- Del Ferraro, G.; Moreno, A.; Min, B.; Morone, F.; Pérez-Ramírez, Ú.; Pérez-Cervera, L.; Parra, L.C.; Holodny, A.; Canals, S.; Makse, H.A. Finding influential nodes for integration in brain networks using optimal percolation theory. Nat. Commun. 2018, 9, 2274. [Google Scholar] [CrossRef]
- Alexander-Bloch, A.F.; Gogtay, N.; Meunier, D.; Birn, R.; Clasen, L.; Lalonde, F.; Lenroot, R.; Giedd, J.; Bullmore, E.T. Disrupted modularity and local connectivity of brain functional networks in childhood-onset schizophrenia. Front. Syst. Neurosci. 2010, 4, 147. [Google Scholar] [CrossRef]
- Nicolini, C.; Bifone, A. Modular structure of brain functional networks: Breaking the resolution limit by Surprise. Sci. Rep. 2016, 6, 19250. [Google Scholar] [CrossRef] [PubMed]
- Watanabe, T.; Hirose, S.; Wada, H.; Imai, Y.; Machida, T.; Shirouzu, I.; Konishi, S.; Miyashita, Y.; Masuda, N. A pairwise maximum entropy model accurately describes resting-state human brain networks. Nat. Commun. 2013, 4, 1370. [Google Scholar] [CrossRef]
- Tang, A.; Jackson, D.; Hobbs, J.; Chen, W.; Smith, J.L.; Patel, H.; Prieto, A.; Petrusca, D.; Grivich, M.I.; Sher, A.; et al. A maximum entropy model applied to spatial and temporal correlations from cortical networks in vitro. J. Neurosci. 2008, 28, 505–518. [Google Scholar] [CrossRef]
- Tkačik, G.; Marre, O.; Mora, T.; Amodei, D.; Berry, M.J., II; Bialek, W. The simplest maximum entropy model for collective behavior in a neural network. J. Stat. Mech. Theory Exp. 2013, 2013, P03011. [Google Scholar] [CrossRef]
- Smith, A.B.; Jones, C.D. The Neuroscience of Human Intelligence and Education: A State of the Art Review. J. Intell. 2019, 7, 10. [Google Scholar]
- Johnson, M.; Smith, P. Brain Mapping: The Methods; Academic Press: Cambridge, MA, USA, 2018. [Google Scholar]
- Gazzaniga, M.S.; Ivry, R.B.; Mangun, G.R. Cognitive Neuroscience: The Biology of the Mind; W. W. Norton & Company: New York, NY, USA, 2018. [Google Scholar]
- Azizi, T. Time varying analysis of dynamic resting-state functional brain network to unfold memory function. Neurosci. Inform. 2024, 4, 100148. [Google Scholar] [CrossRef]
- Sporns, O. The human connectome: A complex network. Ann. N. Y. Acad. Sci. 2011, 1224, 109–125. [Google Scholar] [CrossRef]
- Basser, P.J.; Jones, D.K. Diffusion-tensor MRI: Theory, experimental design and data analysis—A technical review. NMR Biomed. 2002, 15, 456–467. [Google Scholar] [CrossRef] [PubMed]
- Dayan, P.; Abbott, L.F. Theoretical Neuroscience: Computational and Mathematical Modeling of Neural Systems; MIT Press: Cambridge, MA, USA, 2001. [Google Scholar]
- Felleman, D.J.; Van Essen, D.C. Distributed hierarchical processing in the primate cerebral cortex. Cereb. Cortex 1991, 1, 1–47. [Google Scholar] [CrossRef]
- Rubinov, M.; Sporns, O. Complex network measures of brain connectivity: Uses and interpretations. Neuroimage 2010, 52, 1059–1069. [Google Scholar] [CrossRef]
- Newman, M.E. Modularity and community structure in networks. Proc. Natl. Acad. Sci. USA 2006, 103, 8577–8582. [Google Scholar] [CrossRef] [PubMed]
- Watts, D.J.; Strogatz, S.H. Collective dynamics of ‘small-world’networks. Nature 1998, 393, 440–442. [Google Scholar] [CrossRef]
- Latora, V.; Marchiori, M. Efficient behavior of small-world networks. Phys. Rev. Lett. 2001, 87, 198701. [Google Scholar] [CrossRef] [PubMed]
- Bassett, D.S.; Bullmore, E. Small-world brain networks. The Neuroscientist 2006, 12, 512–523. [Google Scholar] [CrossRef] [PubMed]
- Azizi, T. On the fractal geometry of gait dynamics in different neuro-degenerative diseases. Phys. Med. 2022, 14, 100050. [Google Scholar] [CrossRef]
- Azizi, T. Disrupted organization of dynamic functional networks with application in epileptic seizure recognition. Neurosci. Inform. 2024, 4, 100153. [Google Scholar] [CrossRef]
- Buckner, R.L.; Sepulcre, J.; Talukdar, T.; Krienen, F.M.; Liu, H.; Hedden, T.; Andrews-Hanna, J.R.; Sperling, R.A.; Johnson, K.A. Cortical hubs revealed by intrinsic functional connectivity: Mapping, assessment of stability, and relation to Alzheimer’s disease. J. Neurosci. 2009, 29, 1860–1873. [Google Scholar] [CrossRef]
- Bullmore, E.; Sporns, O. The economy of brain network organization. Nat. Rev. Neurosci. 2012, 13, 336–349. [Google Scholar]
- Azizi, T. Impact of mental arithmetic task on the electrical activity of the human brain. Neurosci. Inform. 2024, 4, 100162. [Google Scholar] [CrossRef]
- Chen, C.; Tassou, A.; Morales, V.; Scherrer, G. Graph theory analysis reveals an assortative pain network vulnerable to attacks. Sci. Rep. 2023, 13, 21985. [Google Scholar] [CrossRef]
- Betzel, R.F.; Faskowitz, J.; Sporns, O. Living on the edge: Network neuroscience beyond nodes. Trends Cogn. Sci. 2023, 27, 1068–1084. [Google Scholar] [CrossRef] [PubMed]
- Betzel, R.F. Community detection in network neuroscience. In Connectome Analysis; Academic Press: Cambridge, MA, USA, 2023; pp. 149–171. [Google Scholar]
- Wu, Z.; Xu, J.; Nürnberger, A.; Sabel, B.A. Global brain network modularity dynamics after local optic nerve damage following noninvasive brain stimulation: An EEG-tracking study. Cereb. Cortex 2023, 33, 4729–4739. [Google Scholar] [CrossRef]
- Hassett, J.D.; Craig, B.T.; Hilderley, A.; Kinney-Lang, E.; Yeates, K.O.; MacMaster, F.P.; Miller, J.; Noel, M.; Brooks, B.L.; Barlow, K.; et al. Development of the whole-brain functional connectome explored via graph theory analysis. Aperture Neuro 2024, 4. [Google Scholar] [CrossRef]
- Kamali, S.; Baroni, F.; Varona, P. Mu and beta power effects of fast response trait double dissociate during precue and movement execution in the sensorimotor cortex. bioRxiv 2024. [Google Scholar] [CrossRef]
- Anderson, M.L. Précis of after phrenology: Neural reuse and the interactive brain. Behav. Brain Sci. 2016, 39, e120. [Google Scholar] [CrossRef]
- Wang, R.; Su, X.; Chang, Z.; Lin, P.; Wu, Y. Flexible brain transitions between hierarchical network segregation and integration associated with cognitive performance during a multisource interference task. IEEE J. Biomed. Health Inform. 2021, 26, 1835–1846. [Google Scholar] [CrossRef]
- Balasubramanian, V. Heterogeneity and efficiency in the brain. Proc. IEEE 2015, 103, 1346–1358. [Google Scholar] [CrossRef]
- Alcorn, M.; O’Neill, M. Adaptive affective cognition in literature and its impact on legal reason and social practice. Poet. Today 2019, 40, 499–518. [Google Scholar] [CrossRef]
- Sastry, N.C.; Banerjee, A. Dynamicity of brain network organization & their community architecture as characterizing features for classification of common mental disorders from whole-brain connectome. Transl. Psychiatry 2024, 14, 268. [Google Scholar]
- Kennedy, D.P.; Adolphs, R. The social brain in psychiatric and neurological disorders. Trends Cogn. Sci. 2012, 16, 559–572. [Google Scholar]
- Borsboom, D.; Cramer, A.O.; Kalis, A. Brain disorders? Not really: Why network structures block reductionism in psychopathology research. Behav. Brain Sci. 2019, 42, e2. [Google Scholar] [CrossRef] [PubMed]
- Taslim, S.; Shadmani, S.; Saleem, A.R.; Kumar, A.; Brahma, F.N.U.; Blank, N.; Bashir, M.A.; Ansari, D.; Kumari, K.; Tanveer, M.; et al. Neuropsychiatric disorders: Bridging the gap between Neurology and Psychiatry. Cureus 2024, 16, e51655. [Google Scholar] [CrossRef] [PubMed]
Disclaimer/Publisher’s Note: The statements, opinions and data contained in all publications are solely those of the individual author(s) and contributor(s) and not of MDPI and/or the editor(s). MDPI and/or the editor(s) disclaim responsibility for any injury to people or property resulting from any ideas, methods, instructions or products referred to in the content. |
© 2025 by the author. Licensee MDPI, Basel, Switzerland. This article is an open access article distributed under the terms and conditions of the Creative Commons Attribution (CC BY) license (https://creativecommons.org/licenses/by/4.0/).