Abstract
Artificial intelligence (AI) has found applications across diverse sectors in recent years, significantly enhancing operational efficiencies and user experiences. Educational data mining (EDM) has emerged as a pivotal AI application to transform educational environments by optimizing learning processes and identifying at-risk students. This study leverages EDM within a Moroccan university (Hassan First, University Settat, Morocco) context to augment educational quality and improve learning. We introduce a novel “Hybrid approach” that synthesizes students’ historical academic records and their in-class behavioral data, provided by instructors, to predict student performance in initial coding courses. Utilizing a range of machine learning (ML) algorithms, our research applies multi-classification, data augmentation, and binary classification techniques to evaluate student outcomes effectively. The key performance metrics, accuracy, precision, recall, and F1-score, are calculated to assess the efficacy of classification. Our results highlight the long short-term memory (LSTM) algorithm’s robustness achieving the highest accuracy of 94% and an F1-score of 0.87 along with a support vector machine (SVM), indicating high efficacy in predicting student success at the onset of learning coding. Furthermore, the study proposes a comprehensive framework that can be integrated into learning management systems (LMSs) to accommodate generational shifts in student populations, evolving university pedagogies, and varied teaching methodologies. This framework aims to support educational institutions in adapting to changing educational dynamics while ensuring high-quality, tailored learning experiences for students.
1. Introduction
The digital revolution has fundamentally transformed the educational landscape, establishing coding as an essential skill for the 21st century. As industries become increasingly dependent on technology, understanding and constructing software is not merely advantageous but indispensable. The early phases of coding instruction therefore lay the foundations for future learning and application in technology-driven fields [1]. Consequently, educational institutions must forecast and enhance student performance in coding to ensure that learners are well prepared to meet the demands of the digital economy.
Coding has emerged as a cornerstone skill in today’s competency-based learning environment [2]. Besides enhancing technical proficiencies, coding fosters critical thinking and complex problem-solving abilities [3]. Because early experiences strongly predict long-term success [4], optimizing these formative stages is crucial.
Traditional educational data mining (EDM) studies often lean on a single data source, typically historical grades or clickstream logs, to model outcomes, thereby overlooking the multifaceted nature of learning [5]. To capture that complexity, we augment the raw LMS data, mitigate class imbalance, and evaluate both binary and multi-class formulations. The resulting richer dataset enables finer-grained insights into learning dynamics during introductory coding courses.
The Moodle-based LMS at Hassan First, University of Settat, Morocco, underpins this work by offering a robust environment for recording academic and behavioral traces. Its detailed logs provide an ideal substrate for identifying patterns that drive—or impede—early coding success.
Accordingly, this article proposes a novel predictive pipeline that fuses academic history with in-course behavioral telemetry, enhanced through EDM pre-processing and state-of-the-art augmentation. Our experimental focus on beginner-level C programming classes provides a clear lens through which to examine how behavior modulates performance.
This study aims to develop and evaluate a predictive framework that accurately identifies students at risk of underperforming in coding courses by leveraging behavioral and historical data from learning management systems (LMSs). The central research questions guiding this work are the following: (1) Can a hybrid dataset combining behavioral and academic features improve prediction accuracy compared to using either type alone? (2) Does data augmentation significantly enhance model performance on small, imbalanced datasets in educational contexts? (3) How does binary classification performance compare to multi-class classification when predicting student outcomes in early coding courses?
Based on these questions, we propose the following hypotheses: (H1) Hybrid models that integrate both behavioral and academic data yield better predictive performance than single-source models. (H2) Applying data augmentation to small, imbalanced datasets improves classification accuracy and model robustness. (H3) Multi-class and binary classification strategies provide complementary insights, with augmented data benefiting both.
The main contributions of this work are (1) the creation of a hybrid dataset that combines academic history with weekly behavioral performance; (2) the implementation of data augmentation techniques to improve generalizability and balance; (3) a comparative evaluation of binary and multi-class classification methods using multiple machine learning models; and (4) validation of the model in a real academic setting, providing practical insights for improving educational strategies.
The remainder of this article is organized as follows. Section 2 surveys related research. Section 3 provides a conceptual background. Section 4 details the dataset, pre-processing pipeline, and experimental design. Section 5 reports empirical findings, and Section 6 interprets them in light of the stated hypotheses. Finally, Section 7 summarizes key takeaways and outlines future research directions.
2. Related Works
This section discusses recent papers in three key areas relevant to our study: coding education, small dataset challenges, and data augmentation. These studies provide the foundation for our approach and highlight the methodologies that have been applied to predict student performance in coding courses, especially under limited data conditions. Table 1 summarizes the related studies.
2.1. Coding in Education
The paper [6] compares machine learning models, logistic regression, random forests, support vector machines, and neural networks, for predicting student success in online programming courses using data from Moodle LMS and demographic factors. Analyzing 591 students from Universidad Estatal de Milagro (2022–2023), the study identified logistic regression as the most practical and interpretable model, achieving the highest AUC-ROC (0.9354). Key predictors included early academic grades and engagement metrics, like resource reviews, while demographic factors were less influential. The findings emphasize the value of simple, interpretable models for early interventions to improve student outcomes, though broader studies are needed to validate these results.
The paper [7] reviews methodologies for predicting student performance in introductory programming courses in higher education, emphasizing the use of machine learning (ML). It identifies commonly used algorithms such as naive Bayes, random forests, and SVMs, with SVMs achieving the highest average accuracy (93.97%) across studies. The review highlights the importance of academic records as a key data source and recommends combining multiple data types for improved predictions. While accuracy is the most used metric, the study advocates for a broader evaluation using metrics like F1-score. It suggests future research to focus on integrating diverse data sources and exploring deep learning for enhanced prediction capabilities.
The paper [1] proposes a boosting-based approach using random forest (RF) to predict coding intricacy among software engineering teams, aiming to ensure cooperative learning and sustainable education. Using the SETAP dataset of 74 teams, the study identifies high and low intricacy levels based on coding time, meeting hours, and help hours. The RF model boosted with LogitBoost and AdaBoost achieved the highest accuracy (85.14%) and outperformed other ML algorithms. The results emphasize early prediction to identify struggling teams, fostering cooperative learning through instructor support and peer collaboration. The approach aligns with the Education for Sustainable Development (ESD) goals by enhancing learning environments and encouraging critical thinking. The authors suggest exploring deep learning and recommender systems for further improvements in future work.
Hung et al. [8] investigate students’ learning patterns in a flipped learning environment for coding education through the application of educational data mining techniques. Using data from two universities Python 3.6.0 programming classes in Taiwan, they employ machine learning models, including random forests, logistic regression, and decision trees, to predict high-risk learners and analyze learning behaviors. Random forests achieve the highest predictive accuracy (F1-score of 0.83). Hierarchical clustering and heat maps identify distinct learning behavior groups, such as interactive active learners and learning-negative groups. The study highlights the potential of mid-term forecasting systems to enhance personalized interventions and improve students’ learning performance in blended educational settings.
These papers provide a rich foundation for predicting student performance in coding education using machine learning models. Their methodologies, particularly those involving SVM and random forests, align closely with our use of machine-learning models to predict coding performance. We also adopt early intervention strategies, as discussed in the studies, but focus on the specific challenges posed by small datasets in coding courses.
2.2. Data Augmentation
Data augmentation refers to techniques used to artificially expand the size and diversity of a dataset by generating new, synthetic samples based on the original data distribution. In the context of educational data mining, it is particularly important when dealing with small-scale or imbalanced datasets, common challenges that can negatively affect the performance and generalizability of machine learning (ML) models. Augmentation helps mitigate issues such as overfitting, poor minority-class recall, and biased classification by enriching the training data, especially for under-represented classes [9].
In this study, data augmentation plays a critical role in addressing the imbalanced distribution of student outcomes, where failing or struggling students constitute a minority. Without augmentation, machine learning models tend to favor majority classes, limiting their effectiveness in identifying at-risk learners. By applying synthetic data generation techniques, we aim to increase the model’s sensitivity to rare but important academic patterns, thereby improving both accuracy and fairness in performance prediction.
The authors in this study [10] addressed the challenge of limited data availability in analyzing learning behaviors within Massive Open Online Courses (MOOCs). They proposed the use of generative adversarial networks (GANs) to augment the Learning Behavior Analytics Dataset, which encompasses diverse aspects of learner interaction and engagement. By learning the underlying distribution of the original dataset, the GANs generated synthetic data points that retained the characteristics and patterns of the real data. This augmentation enabled the training of more robust and generalizable deep learning models, facilitating in-depth analysis of learning behaviors and unlocking new possibilities for personalized interventions and adaptive learning systems within MOOC environments
Abuzinadah et al. [9] propose a machine learning framework in their study that integrates convolutional neural network (CNN) features with ensemble models to predict student academic performance using Moodle Learning Management System (LMS) data. Addressing challenges like imbalanced datasets and limited feature engineering in existing methods, the study employs synthetic minority oversampling (SMOTE) and deep convoluted features to enhance model accuracy. Among various machine learning models tested, the Extra Tree Classifier (ETC) combined with CNN features achieved the highest classification accuracy of 99.9%. The findings highlight the potential of this hybrid approach to improve predictive performance and offer actionable insights for timely educational interventions.
In their paper [11], Fahd and Miah investigate the effectiveness of data augmentation techniques combined with deep learning algorithms to predict at-risk students in higher education, aiming to reduce dropout rates. Using a dataset from a learning management system (LMS), they address the challenges of imbalanced and small-scale datasets by applying the Synthetic Minority Oversampling Technique (SMOTE) and a Distribution-Based Algorithm (DBA). The study evaluates multilayer perceptrons (MLPs), long short-term memory (LSTM), and sequential models, finding MLP with DBA augmentation as the most accurate with a classification accuracy of 98.65%. The research highlights the potential of predictive modeling in enabling timely interventions, ultimately aiming to enhance student retention and academic success.
The papers in this section are directly relevant to our study as they all focus on leveraging data augmentation techniques to improve model performance on small datasets. Their findings reinforce the idea that augmenting data through techniques like SMOTE or hybrid models can significantly enhance prediction accuracy, which is central to our approach to predicting student performance in coding courses with limited data.
2.3. Small Dataset
In the context of educational data mining, a small dataset typically contains limited student records (fewer than several hundred to a few thousand entries), often with sparse feature coverage and significant class imbalance. This can hinder the training of robust machine learning models, reduce generalizability, and make it difficult to detect under-represented patterns (such as those associated with at-risk students). Our study falls within this definition, as it involves a dataset comprising less than 1000 student observations, making it representative of real-world educational environments with constrained data availability [12].

Table 1.
Summary of related works.
Table 1.
Summary of related works.
| Study | Methodology | Findings | Limitations |
|---|---|---|---|
| Arevalo et al. [6] | Comparison of machine learning models (logistic regression, random forests, SVMs, neural networks) using data from Moodle LMS and demographic factors. | Logistic regression achieved the highest AUC-ROC (0.9354). Early academic grades and engagement metrics were key predictors. | Limited by the sample size and the focus on a single LMS. Broader studies are needed for validation. |
| Pires et al. [7] | Review of methodologies for predicting student performance in programming courses, focusing on SVMs, naive Bayes, J48, and random forests. | SVMs achieved the highest average accuracy (93.97%). Highlights the importance of combining multiple data sources. | Lacked exploration of deep learning models for better prediction capabilities. |
| Naseer et al. [1] | Boosting-based approach using random forests for predicting coding intricacy among software engineering teams. | RF boosted with LogitBoost and AdaBoost achieved the highest accuracy (85.14%). Emphasized early prediction for identifying struggling teams. | The study focuses on teams rather than individual students, which may limit broader applications in individual coding courses. |
| Hung et al. [8] | Educational data mining techniques to analyze learning patterns in a flipped learning environment for coding education. | Random forests achieved the highest predictive accuracy (F1-score of 0.83). Identified distinct learning behavior groups through hierarchical clustering. | Limited to two Python programming classes; may not generalize to other courses or contexts. |
| Zouleikha et al. [10] | Proposed a GAN-based data augmentation framework to enhance learning behavior analysis using MOOC log data. | GAN-generated synthetic data improved the robustness and generalization of behavior prediction models. Facilitated deeper analysis of engagement patterns. | The approach was evaluated only on specific MOOC datasets; generalizability to other LMS platforms remains to be tested. |
| Abuzinadah et al. [9] | Hybrid model combining CNN features with ensemble models, using Moodle LMS data. | Extra Tree Classifier (ETC) with CNN features achieved the highest classification accuracy of 99.9%. | Focused on data from Moodle LMS, which may not apply to other systems with different data structures. |
| Fahd and Miah [11] | Data augmentation techniques using SMOTE and DBA combined with MLP, LSTM, and sequential models. | MLP with DBA achieved the highest classification accuracy (98.65%). Highlights potential for early interventions to improve retention. | Model accuracy may vary depending on dataset characteristics and requires further validation. |
| Azimi et al. [13] | ML techniques for improving student performance in small-scale online courses hosted on Moodle. | Logistic regression and decision trees were effective for early interventions. Introduced the Online Learning Improvement Tool (OLIT) for at-risk students. | Limited by the small dataset and may not generalize to larger datasets or other LMS systems. |
| Hafdi and El Kafhali [2] | Evaluated machine learning techniques, clustering, and data visualization to predict student performance using small datasets. | KNN and decision trees performed best for course predictions and dissertation grades. | Limited to small datasets, which may impact the model’s scalability and generalizability to larger datasets. |
| Abu Zohair [12] | Machine learning techniques for predicting student performance in graduate programs using small datasets. | SVMs with radial kernel achieved the best accuracy for predicting grades. | Focused on small datasets from smaller universities, limiting generalization to larger institutions. |
Azimi et al. [13] investigate the application of machine learning (ML) techniques to improve student performance in small-scale online courses hosted on Moodle. They address challenges posed by limited data in such courses by utilizing a combination of student activity logs and assignment grades to train interpretable logistic regression and decision tree models. The study demonstrates the effectiveness of early intervention strategies, which can be proposed as early as mid-course, to significantly enhance student outcomes. Additionally, they introduce the Online Learning Improvement Tool (OLIT), an assistive pedagogical tool that integrates into Moodle to identify at-risk students and recommend tailored interventions. This work highlights the potential of leveraging ML for personalized education in resource-constrained online learning environments.
Hafdi and El Kafhali [2] investigate the feasibility of predicting student performance in learning management systems (LMSs) using small datasets. Their study focuses on identifying critical factors affecting course grades and dissertation outcomes through machine learning (ML) methods, clustering, and data visualization. They evaluate algorithms including K-Nearest Neighbors (KNN), decision trees (DTs), support vector machines (SVMs), and random forests (RFs), finding that KNN performed best for course predictions and DT excelled in dissertation grade classification. The research highlights the potential of ML to provide actionable insights for early identification of at-risk students and personalized academic interventions, even with limited data availability.
Abu Zohair [12] explores the feasibility of predicting student performance in graduate programs using small datasets, addressing challenges faced by smaller universities with limited records. The study utilizes clustering and visualization techniques to identify key predictors, such as grades in specific courses, which are then fed into machine learning algorithms, including SVMs, LDA, and MLP-ANN, to evaluate their accuracy. Support vector machines with a radial kernel emerged as the most effective classifier for predicting dissertation and course grades with significant accuracy. This research highlights the potential of leveraging small datasets for the early identification of at-risk students and optimizing resource allocation in educational institutions.
2.4. Imbalanced Classes
Class imbalance occurs when the distribution of target labels in a dataset is skewed, meaning that some classes are under-represented compared to others. This imbalance can severely hinder the performance of machine learning models by biasing the classifier toward the majority class, thereby reducing its ability to accurately detect minority-class instances [10]. In educational datasets, especially those concerning dropout prediction or early performance forecasting, this phenomenon is common since most students typically pass, while fewer fails or dropouts.
Imbalanced classification problems require special handling to ensure fair and reliable results. Methods like resampling (undersampling or oversampling), class-weight adjustment, or specialized algorithms are often employed to address this issue. The Synthetic Minority Oversampling Technique (SMOTE), for example, generates synthetic samples for the minority class by interpolating between existing instances and has proven particularly effective in educational contexts [11].
In our dataset, less than 20% of students belong to the minority “at-risk” class, creating a highly imbalanced scenario. To mitigate this, we integrate SMOTE-based oversampling into our pre-processing pipeline. This enables the model to better learn from minority-class patterns, thus improving recall and F1-score for under-represented outcomes—key metrics in early-intervention use cases.
These studies directly inform our work by addressing the challenges of dataset size. In particular, we adopt similar ML methods to overcome data limitations in coding education. The emphasis on early intervention and personalized predictions using small datasets resonates with our approach to forecasting student performance in coding courses. Also, they address various challenges in predicting student performance using machine learning, particularly in coding courses and under constraints like small datasets and imbalanced classes. However, our research extends beyond the scope of these works by introducing a novel hybrid approach that synthesizes behavioral and historical data while incorporating data augmentation to address dataset limitations. Unlike previous studies, our framework is explicitly designed to integrate seamlessly into a learning management system (LMS), enabling real-time and adaptable predictions for educational institutions. This unique combination of methodologies offers a comprehensive and practical solution to enhance pedagogical strategies in coding education.
3. Background
Early coding education is pivotal in preparing students for a digitally driven world but presents several challenges. One of the primary issues is the diversity of student backgrounds and abilities, which often leads to significant disparities in learning progress. Early learners frequently struggle with abstract concepts inherent in programming, such as logic and algorithmic thinking, which can hinder their engagement and retention. Addressing these challenges requires innovative approaches that adapt educational content to individual learning needs and progress [1].
Educational data mining (EDM), a discipline combining data mining techniques with educational theories, offers significant potential to address these issues. By analyzing educational data, EDM uncovers patterns and insights that can improve learning outcomes, providing educators with tools to make data-driven decisions. In the context of coding education, EDM equips instructors to tackle the broad range of challenges faced by early learners, including identifying at-risk students and tailoring interventions to enhance engagement and retention [14].
Machine learning (ML) further strengthens the potential of EDM by offering powerful tools to analyze large educational datasets, such as those found in coding courses. By applying ML algorithms, educators can predict student outcomes, personalize learning experiences, and identify at-risk students early enough to intervene effectively. ML automates the analysis of student performance data, providing insights not immediately obvious through traditional methods [15]. This automation facilitates real-time decision making, enabling more targeted and adaptive educational strategies.
In this study, several ML algorithms were selected due to their established effectiveness in educational contexts, as supported by prior research [16]. Table 2 provides a summary of these algorithms, highlighting their strengths and common use cases in educational data analysis. K-Nearest Neighbors (KNN) was chosen for its simplicity and effectiveness with small datasets, making it suitable for classifying students into distinct performance categories. Decision trees (DTs) and random forests (RFs) are interpretable and robust algorithms, respectively, and have shown excellent performance in educational datasets where categorical and numerical features coexist. Support vector machines (SVMs) are particularly effective in high-dimensional spaces, which makes them ideal for handling complex datasets with diverse features [12]. Logistic regression (LR), with its probabilistic approach, offers interpretability, which is critical for understanding the underlying factors affecting student performance. Ensemble methods like AdaBoost (AB) and Gradient Boosting (GB) were selected for their ability to combine weak learners into highly accurate models [1], while artificial neural networks (ANNs) and long short-term memory (LSTM) were included for their capacity to capture non-linear and sequential relationships in student behavior and performance data [11]. Naive Bayes (NB) was incorporated for its computational efficiency and effectiveness with small datasets, and Linear Discriminant Analysis (LDA) was chosen for its dimensionality reduction capabilities, which are beneficial in feature-rich datasets [17].
Classification techniques are particularly critical in this context, as they allow for the categorization of students based on their likelihood of excelling, falling behind, or requiring additional support. These methods empower educators to identify at-risk students early and provide them with tailored interventions, ensuring that resources are allocated effectively. In early coding education, this capability is especially important, as it enables instructors to address learning gaps before they become insurmountable [18].
This study is justified by the pressing need to overcome significant barriers in early coding education. Traditional educational approaches often fail to address individual differences effectively, particularly in large class settings. By integrating EDM and ML into the educational process, this research demonstrates how data-driven strategies can enhance personalized learning, improve engagement, and ultimately boost learning outcomes in coding education. Furthermore, the comparative analysis of different ML algorithms provides valuable insights into their practical applications, helping educators make informed decisions about the most suitable tools for their specific challenges. This study bridges the gap between theory and practice, offering actionable insights for improving coding education through advanced analytical techniques [8].
Table 2.
Summary of machine learning algorithms used in educational data mining, including their abbreviations.
Table 2.
Summary of machine learning algorithms used in educational data mining, including their abbreviations.
| Algorithm | Type | Abbreviation | Strengths | Common Use Cases |
|---|---|---|---|---|
| K-Nearest Neighbors [2] | Instance-based | KNN | Simple and effective for small datasets | Classification of similar instances |
| Decision Trees [13] | Tree-based | DT | Easy to interpret and handles categorical data well | Decision making and classification tasks |
| Random Forests [1] | Ensemble | RF | Robust and handles overfitting well | Large datasets, classification, and regression |
| Support Vector Machines [7] | Margin-based | SVM | Effective in high-dimensional spaces | Classification and regression with clear margin separation |
| Logistic Regression [13] | Regression | LR | Probabilistic approach; interpretable | Binary classification |
| AdaBoost [1] | Ensemble | AB | Combines multiple weak learners to improve accuracy | Classification and regression tasks |
| Gradient Boosting [1] | Ensemble | GB | Builds sequentially corrective trees | Ranking, classification, and regression tasks |
| Artificial Neural Networks [11] | Neural-based | ANN | High flexibility; good with complex relationships | Pattern recognition and classification tasks |
| Long Short-Term Memory [11] | Neural-based | LSTM | Excellent with sequential data | Time series analysis and sequential tasks |
| Naive Bayes [7] | Probabilistic | NB | Fast and good with small datasets | Text classification and spam filtering |
| Linear Discriminant Analysis [12] | Discriminant | LDA | Dimensionality reduction; interpretable | Feature extraction and dimension reduction |
4. Research Methodology
In this section, we delve into the systematic approach employed to explore the impact of EDM in enhancing learning outcomes and identifying at-risk students. Our methodology integrates historical academic data with behavioral insights collected from the classroom to develop a predictive model that assesses student performance in coding education. This comprehensive approach leverages a variety of ML algorithms to analyze the data, with a specific focus on multi-classification, data augmentation, and binary classification techniques. The data are meticulously collected, cleaned, and processed to ensure their reliability and relevance for model training and evaluation. Through successive stages of model testing and refinement, we identify the most effective algorithms and strategies for predicting student success, ensuring that the methodologies are robust and adaptable to the dynamic educational environment. This section outlines the steps taken to gather, prepare, and utilize the data, culminating in the selection of the optimal model based on rigorous evaluation criteria. Figure 1 illustrates these steps, providing a visual representation of the workflow from data collection through to model selection, encapsulating the strategic process adopted in this research.
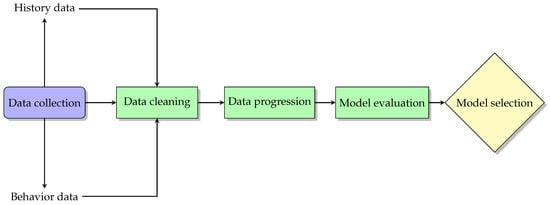
Figure 1.
Workflow for data-driven model development in educational settings.
4.1. Dataset Description
The dataset for this study was collected from Hassan First, University in Settat, Morocco, specifically from the Faculty of Science and Techniques (FST). It includes records from October 2022 to June 2023. The data span 200 student records and focus on second-year students who are introduced to coding as part of their computer science curriculum. The computer science program includes three key modules, “Algorithm and Programming 1,” “Algorithm and Programming 2,” and “Data Structures,” all taught using the C programming language. These modules are essential for building foundational knowledge and practical skills in coding [1]. For the purposes of this study, the modules are referred to as Target 1, Target 2, and Target 3, representing the final grades of “Algorithm and Programming 1,” “Algorithm and Programming 2,” and “Data Structures,” respectively. Practical exams for these modules are abbreviated as PE1, PE2, and PE3, corresponding to the modules’ practical components. All student data were anonymized in accordance with institutional policies before analysis. Personally identifiable information was removed by the university’s IT department to ensure privacy, confidentiality, and non-traceability. The study was conducted under ethical research guidelines, and data usage was strictly limited to educational research purposes aimed at improving academic support and student performance prediction.
The academic semester follows a structured schedule to ensure effective learning. Due to the hierarchical nature of the content, the semester begins with intensive instructions in “Algorithm and Programming 1.” This module is taught at a higher frequency, with two classes per week instead of the typical one, to provide students with the necessary fundamental skills in programming. Once this module is completed, instruction transitions to “Algorithm and Programming 2” and “Data Structures,” which are taught concurrently, also at a frequency of two classes per week. This staggered approach ensures that students have the required background to comprehend the more advanced concepts presented in the later modules. Practical sessions are scheduled in parallel to the theoretical classes but are conducted in smaller groups of 20–25 students to provide individualized attention. Practical sessions for Target 1 span three weeks and are followed by a practical exam (PE1). The same pattern is repeated for Target 2 and Target 3, with three weeks of practical sessions followed by PE2 and PE3, respectively. This arrangement allows professors to assess students’ hands-on coding skills after each module, ensuring a robust evaluation of their understanding and application of the concepts taught.
The history dataset comprises students’ academic records from their first year at university. During this period, students study foundational subjects such as mathematics, physics, and general computer science, but no specific coding modules are included. The data for this dataset were extracted from the university’s LMS, which centralizes all academic records, as shown in Table 3. The history dataset includes grades from 12 first-year courses, as well as the final grades from the second-year modules (Targets 1, 2, and 3). This dataset is critical for analyzing the influence of prior academic performance on students’ ability to grasp coding concepts, providing insights into how foundational knowledge supports success in coding education.
Table 3.
Academic performance in first-year courses and target coding modules.
The behavioral dataset is based on observations recorded by professors during practical classes. In these sessions, limited to 20–25 students per group, professors evaluate students based on several criteria, including attendance, performance during practical exercises, responses to questions, and coding methods. These observations are graded on a scale from D to A+, with D representing the lowest score and A+ the highest. The grades are aggregated to provide an average performance rating for each student in each practical session. This dataset captures nuanced behavioral and performance indicators that may not be reflected in traditional academic assessments in Table 4, offering valuable insights into how students engage with and apply the material in a practical setting. Practical exams (PEs) were included as features because they are conducted during the semester, shortly after laboratory sessions, and are intended to assess students’ basic programming competencies. Unlike the final exams, which occur at the end of the semester and are more theoretical in nature, PEs offer early and actionable indicators of student performance. This distinction justifies their use as predictive features to support timely identification of at-risk students, which is central to our study’s objective.
Table 4.
Weekly performance and assessment scores for second-year coding courses.
By integrating the history and behavioral datasets, this study provides a comprehensive view of students’ academic and practical performance. The history dataset reveals the foundational knowledge students bring into their coding courses, while the behavioral dataset highlights their engagement, practical abilities, and coding methodologies. This dual perspective is essential for understanding the multifaceted nature of coding education and for developing predictive models that can identify at-risk students and tailor interventions to their specific needs. This approach not only enhances the precision of predictions but also provides actionable insights for improving teaching strategies and supporting students more effectively.
4.2. Pre-Processing
The pre-processing phase involved refining the raw data from both the history and behavioral datasets to prepare them for effective analysis. This phase ensured that the data was formatted appropriately and enhanced its ability to support accurate and reliable machine learning applications [19]. The historical dataset, derived from the university’s LMS, contained grades from 12 first-year courses along with the final grades for Targets 1, 2, and 3, which represent second-year coding modules. For this dataset, pre-processing began with data cleaning, where records of students who did not attend practical classes were removed to ensure consistency. Following this, normalization was applied to scale the grades from all courses into a range of [0, 1], making the attributes comparable and ensuring no single feature dominated due to its scale. Additionally, categorical encoding was applied to transform the final grades of Target 1, Target 2, and Target 3 into integer categories for multi-class classification: 0 for grades between 0 and 7, 1 for grades between 7 and 12, and 2 for grades above 12. The selection of the thresholds (7 and 12) is grounded in institutional grading policies at Hassan First, University. Specifically, students with grades below 7 are not eligible to retake the exam, while a score of 12 is the threshold for course validation. This categorization thus ensures meaningful class separation aligned with academic standards. For binary classification, the grades were further encoded into 0 (fail) and 1 (pass) to distinguish general success or failure outcomes.
The behavioral dataset required additional pre-processing steps due to its qualitative nature. This dataset included weekly observations made by professors during practical sessions. To prepare these data for analysis, the letter grades were encoded into numerical values (D: 0, C: 1, B: 2, A: 3, A+: 4) [12]. The practical exam scores (PE1, PE2, PE3) were then normalized to a range of [0, 1] to ensure uniformity across features. Outliers, specifically extremely low weekly grades, were excluded from the dataset because they typically correspond to students who either submitted void exam papers or did not attend practical classes. In such cases, behavioral data necessary for constructing the hybrid and behavioral datasets were missing. Including these incomplete records would introduce inconsistency and bias into the model training process. Therefore, their exclusion was essential to ensure the integrity of the analysis across all datasets and to maintain a fair comparison of prediction results.
The tables provided illustrate the pre-processed datasets. Table 5 shows the historical dataset after normalization, where the grades from all first-year courses and the targets (Target 1, Target 2, Target 3) are scaled for uniform analysis. This table demonstrates the adjustments made to ensure that each feature contributes equally to the analysis. Table 6 depicts the behavioral dataset, where weekly grades, practical exam scores, and targets are represented after normalization and encoding. These transformations enable effective integration into mathematical models by converting qualitative assessments into quantitative values. In this study, the feature engineering strategy focused on preserving and utilizing the maximum amount of informative content from the dataset. Rather than reducing the feature space, we aimed to maintain all available relevant attributes, particularly behavioral and historical features, to enhance predictive accuracy. This approach aligns with our main objective of maximizing performance, rather than optimizing for energy or computational costs, ensuring that the model captures rich learning patterns from student interactions and assessments.
Table 5.
Historical dataset after pre-processing.
Table 6.
Behavioral dataset after pre-processing.
To create a comprehensive dataset for model development, we merged the history and behavioral datasets into a single hybrid dataset. This involved concatenating the two datasets along their common identifiers, ensuring that each record contained both past academic performance and behavioral observations. The resulting dataset thus included a wide array of features, from first-year course grades to weekly observations and practical exam scores. This integration allowed for a holistic analysis of student performance, combining long-term academic trends with real-time behavioral insights. The final hybrid dataset retained the encoded target variables for multi-class classification and binary classification, facilitating the evaluation of different modeling approaches. The detailed choices for feature encoding and their implications for classification will be discussed in the following section.
4.3. Model Evaluation
The dataset after pre-processing includes 177 instances for each target, categorized into three risk levels: high risk (scores less than 7), medium risk (scores between 7 and 12), and low risk (scores greater than 12). These categories allow for multi-class classification to analyze students’ academic performance and provide detailed insights into their learning outcomes. Table 7 shows the distribution of these categories across the three targets. While this categorization enables nuanced understanding, the data are significantly imbalanced, with the low-risk category dominating the dataset. Figure 2 visualizes this imbalance, highlighting the disproportionate representation of classes. This imbalance poses challenges for training machine learning models, as under-represented classes may lead to biased predictions.
Table 7.
Number of instances by category across the targets.

Figure 2.
Risk distribution across the targets for multi-classification.
Working with a small dataset such as ours introduces several limitations and challenges. First, the limited size restricts the model’s ability to generalize, potentially causing overfitting. Second, the imbalance across risk categories further complicates model training, as the majority class (low risk) may dominate predictions, leading to poor performance on minority classes (high risk and medium risk). These challenges necessitate strategies to enhance the dataset’s quality and balance.
To address these challenges, we apply the data augmentation technique by applying the Synthetic Minority Oversampling Technique (SMOTE) [9]. This approach generates additional synthetic data to increase the dataset size, mitigate class imbalance, and introduce variability, thereby enhancing the model’s ability to generalize. After applying data augmentation, the distribution of instances becomes more balanced across all classes within each classification task. Specifically, for Target 1, the dataset was adjusted to contain 97 instances per class; for Target 2, 103 instances per class; and for Target 3, 111 instances per class. Each of these targets corresponds to a distinct multi-class classification problem, and the augmentation was performed individually to ensure class-level balance within each task. Figure 3 illustrates these post-augmentation distributions, showing clearly balanced datasets that ensure fair and consistent representation of all risk categories per target. This adjustment significantly improves the training process by reducing class imbalance and enhancing model robustness for each specific classification objective.
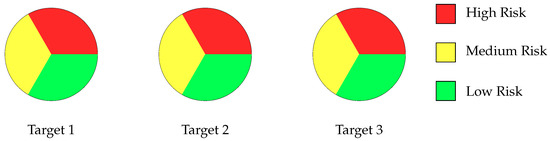
Figure 3.
Risk distribution across the targets for the data augmentation.
While data augmentation addresses several issues, it has some limitations. Synthetic data may not fully capture the complexities of real-world scenarios, and over-reliance on augmented data could lead to models that perform well on synthetic datasets but struggle with actual data. To mitigate these concerns, we complement data augmentation with another approach: binary classification. In this approach, we are focusing on whether a student is likely to fail or succeed (pass or fail). This approach simplifies the classification task, reduces complexity, and increases the number of instances per class, facilitating more effective training. However, binary classification also has limitations, such as the loss of granularity and the inability to differentiate between levels of risk [20].
Neither data augmentation nor binary classification is favored in this study. Instead, we explore both approaches to provide educators and administrators with flexible options depending on their specific needs and objectives. The choice of approach will depend on factors such as the availability of real-world data, the specific goals of the intervention, and the capacity of educational institutions to implement the resulting models.
To evaluate the performance of predictive models, we utilize a comprehensive set of metrics that provide nuanced insights into their effectiveness. Accuracy, precision, recall, and the F1-score are central to our evaluation, offering complementary perspectives on model performance. Accuracy measures the overall correctness of predictions, providing a general assessment of model reliability [21]. Precision evaluates the correctness of positive predictions, which is crucial in identifying students who require intervention with minimal false positives. Recall assesses the model’s ability to capture all relevant instances, emphasizing the importance of identifying all at-risk students to ensure timely support. The F1-score, as the harmonic mean of precision and recall, balances these two metrics, making it particularly valuable in addressing the trade-offs between false positives and false negatives. Table 8 defines key terminologies used in these metrics.
Table 8.
Terminologies for model evaluation metrics.
By employing a combination of metrics, we ensure a holistic evaluation of the predictive models. Accuracy provides a broad measure of correctness, while precision, recall, and F1-score delve into specific aspects of prediction quality [8]. Together, these metrics offer a robust framework for assessing model performance, enabling us to draw reliable conclusions and provide actionable recommendations for improving educational outcomes.
The evaluation metrics adopted in this study provide a comprehensive assessment of predictive models, addressing the complexities of multi-classification, class imbalance, and the challenges of a small dataset. By exploring multi-classification, data augmentation, and binary classification approaches and leveraging diverse evaluation metrics, we present a flexible framework that can adapt to varying educational contexts and objectives.
An important aspect of our approach involves evaluating the performance of predictive models [22]. In this study, we use accuracy, precision, recall, and the F1-score. These metrics provide insights into different facets of model performance, especially in the context of predicting student success on their first coding attempt.
- Accuracy: Accuracy measures the overall correctness of predictions, calculated as the ratio of correctly predicted instances to the total instances. It is represented byWhile accuracy provides a general measure of performance, it may not be sufficient in cases of class imbalance, requiring further analysis through precision, recall, and the F1-score.
- Precision: Precision evaluates the accuracy of positive predictions, crucial when the consequences of false positives are significant:In educational contexts, high precision indicates that predictions of students requiring intervention are likely to be accurate, minimizing unnecessary actions.
- Recall: Recall, or the true positive rate, assesses the model’s ability to identify all relevant instances:This metric is vital when the cost of missing at-risk students (false negatives) is high, emphasizing the importance of capturing all students needing support.
- F1-Score: The F1-score, the harmonic mean of precision and recall, offers a balanced measure of a model’s accuracy, being particularly useful when both types of errors (false positives and negatives) are impactful:
The combination of these metrics ensures a comprehensive evaluation of the predictive models. Accuracy provides an overall measure of correctness, while precision and recall highlight the model’s strengths in specific areas, such as minimizing false positives and capturing all relevant instances. The F1-score balances precision and recall, making it suitable for scenarios where both errors have significant consequences. Finally, by employing these metrics, we can derive meaningful insights and provide reliable recommendations for educational interventions.
To evaluate our models fairly and prevent optimistic bias, we adopted a standard 80/20 train–test split strategy. Importantly, the data augmentation technique (SMOTE) was applied solely to the training set, ensuring that the test set remained composed entirely of original, non-augmented data. This approach prevents data leakage and maintains the integrity of the evaluation by simulating a realistic deployment scenario where the model encounters unseen, real-world data. This methodological decision was aimed at preserving the objectivity of the model performance metrics and enhancing the reproducibility of our experimental results.
5. Results
This section is organized to analyze the machine learning methods used in this study comprehensively. First, we present the results of all the cited methods applied to the original dataset to highlight the limitations posed by the small size and imbalance classes of the data. Next, we analyze the performance of multi-classification approaches after applying a data augmentation technique to address these issues. Finally, we present binary classification results, focusing on distinguishing students who may pass or fail, emphasizing its simplicity and applicability in educational contexts [6]. This structured approach allows us to evaluate and compare the effectiveness of each method under different conditions.
The machine learning algorithms utilized in this study were fine-tuned with specific hyperparameters, as shown in Table 9. For the historical, behavioral, and hybrid datasets, the parameters were chosen based on prior research and experimental optimization. LR and BN were used with their default parameters, providing a baseline for comparison. KNN was configured with 30 neighbors, ensuring that local neighborhood effects were captured. DT was limited to a maximum depth of 3 to prevent overfitting while maintaining interpretability. RF was tuned with 30 estimators and a minimum sample leaf size of 0.1 to balance performance and computational efficiency. SVM utilized the ‘RBF’ kernel with multiple configurations of ‘C’ and ‘gamma’ parameters to capture non-linear relationships effectively. GB and AB were also optimized, with GB using 10 estimators, a learning rate of 0.03, and a maximum depth of 4, and AB was configured with 12 estimators. The deep learning models, ANNs, and LSTM were designed with tailored layer architectures and activation functions to address the complexity and sequential nature of the data. All traditional machine learning algorithms were implemented using the scikit-learn library [23], while deep learning models such as ANNs and LSTM were developed using the Keras Sequential API [24].
Table 9.
Parameters and hyperparameters for machine learning algorithms across datasets.
5.1. Multi-Classification
Figure 4 presents the variation in accuracy, precision, recall, and F1-score for Target 1, which covers the subject of “Algorithm and Programming 1”. For the accuracy metric, the behavior dataset frequently outperforms the other datasets, with its highest point achieved using the LSTM and ANN methods (), barring the BN algorithm where the hybrid dataset prevails. The history dataset consistently shows lower accuracy across all methods. Interestingly, the hybrid dataset’s accuracy falls in the moderate range of to , positioning it between the two other datasets in performance terms.
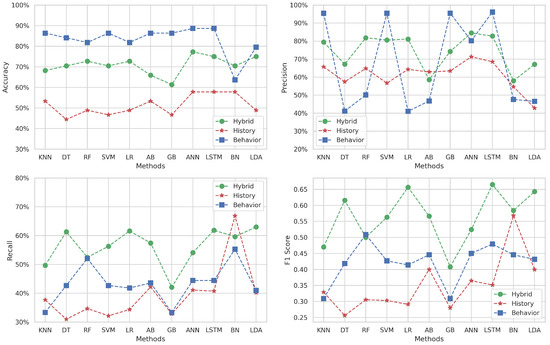
Figure 4.
Multi-classification results for Target 1.
When examining precision, the behavioral dataset scores highly with methods like KNN, SVM, GB, and LSTM, but it drastically underperforms with DT, RF, LR, AB, BN, and LDA. The hybrid approach yields an average precision of around , exhibiting more stability across the board compared to the behavioral dataset. Historical data precision lags behind the hybrid for all methods, averaging at about 60%.
The recall metric is mostly superior for the hybrid dataset, except for the BN method where the historical approach excels. The historical dataset’s recall is otherwise lower across the spectrum, while the recall for the behavioral dataset tends to fall between that of the hybrid and historical datasets, suggesting that it captures a middle ground in sensitivity terms.
Regarding the F1-score, the hybrid dataset generally outshines both behavioral and historical data, peaking with the LSTM method (). This suggests that the hybrid dataset maintains a better equilibrium between correctly identifying true positives and the comprehensive inclusion of relevant instances.
Overall, the behavioral dataset seems adept at capturing accuracy and precision in certain ML methods, highlighting its potential in specific contexts. Conversely, the hybrid dataset provides balanced performance across accuracy, precision, recall, and F1-score, emphasizing its utility as a well-rounded predictive tool. The historical dataset, while not leading in most metrics, still provides valuable insights particularly when combined with the hybrid dataset. In summary, for the objective of identifying at-risk students in “Algorithm and Programming 1”, the LSTM method applied to the hybrid dataset emerges as the most promising approach, boasting high marks in both precision and recall, culminating in an impressive F1-score.
Figure 5 delineates the variation in performance metrics for Target 2 (Algorithm and Programming 2) across different machine learning methods and datasets.
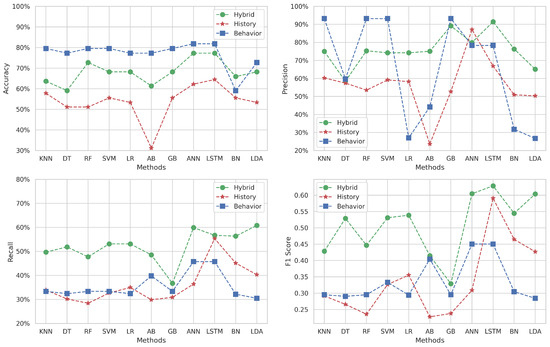
Figure 5.
Multi-classification results for Target 2.
The accuracy obtained on behavioral datasets generally exceeds the others across various methods, except for the BN method where the hybrid prevails. The historical dataset’s accuracy is consistently lower for all methods, indicating its limited predictive power in isolation. In contrast, the hybrid dataset’s accuracy lies between the two datasets for most methods, except the BN method, again, where it excels.
In terms of precision, the behavioral dataset achieves remarkably high scores with KNN, RF, SVM, and GB, yet significantly underperforms with LR, AB, BN, and LDA. Meanwhile, the hybrid dataset mostly outperforms the historical dataset’s precision across all methods, except the ANN, where the historical dataset surprisingly outperforms the hybrid.
When examining recall, the hybrid dataset frequently outshines the other datasets and reaches its peak performance with ANN and LDA methods (). On the other hand, the behavior’s recall is generally better than the history dataset for the majority of methods, except for LR, LSTM, BN, and LDA, where the historical dataset fares better.
The F1-score, which assesses the balance between precision and recall, is mostly superior within the hybrid dataset for all methods, particularly peaking with LSTM (). The F1-score trends for the behavioral and historical datasets mirror the recall patterns, where the behavioral dataset surpasses the historical dataset in some methods and vice versa.
These observations suggest that while the behavioral dataset often leads in accuracy and precision, it does not consistently maintain this advantage across all metrics. The hybrid dataset, with its integration of behavioral and historical data, tends to offer a more balanced and robust performance. Specifically, in methods like LSTM, the hybrid dataset demonstrates its highest efficacy, indicating its potential as a reliable predictive tool in educational settings for identifying students at risk in “Algorithm and Programming 2” coursework.
Figure 6 depicts the performance metrics for Target 3, which covers the topic of “Data Structures in C” using the same ML methods.
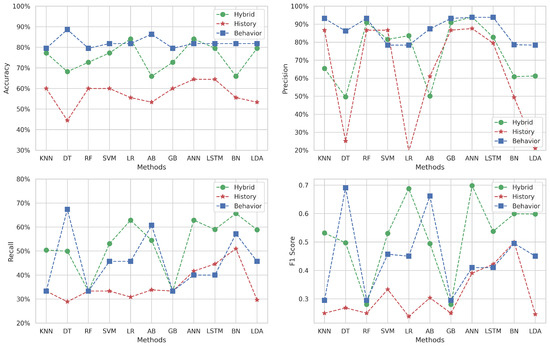
Figure 6.
Multi-classification results for Target 3.
The behavioral dataset shines in terms of accuracy across most methods, reaching its highest level with the DT algorithm (). In comparison, the historical approach’s accuracy scores are consistently lower relative to the other approaches. Meanwhile, the hybrid approach delivers moderate accuracy, positioning itself between the behavioral and historical datasets for all methods (from to ).
Precision is predominantly higher for the behavioral dataset across the majority of methods ( is the peak), with the notable exceptions of SVM and LR where it does not maintain this advantage. On the other hand, the historical data exhibit particularly low precision with DT, LR, and LDA methods (under ).
The hybrid dataset generally outperforms the recall score, except the DT and AB methods, where it does not lead. The highest recall is achieved with the DT method () for the behavioral approach, suggesting that certain behavioral features are highly relevant in correctly identifying all relevant instances within this approach.
The F1-score subfigure indicates varying levels of balance between precision and recall among the different methods. The behavioral data surpasses the hybrid dataset with certain methods. This fluctuation highlights that neither dataset consistently provides the best balance between precision and recall across all methods. The historical approach falls short and is excluded from F1-score comparisons due to poor performance.
In summary, while the behavioral dataset often leads to high accuracy and precision, it is not uniformly superior across all metrics or methods. The hybrid dataset, by incorporating features from both datasets, shows solid performance, particularly in terms of recall, which is crucial for identifying students who might need additional support or intervention. These observations underscore the importance of choosing the right ML method and dataset that best suits the specific characteristics of the educational data and the predictive task at hand.
5.2. Data Augmentation
Figure 7 illustrates the performance of MLs methods across our three datasets for Target 1 (“Algorithmic and Programming 1”) using the metrics of accuracy, precision, recall, and F1-score. In the first subfigure, the accuracy results show that the LR method achieves the best value of 84% for the hybrid dataset, while the LSTM method also achieves 84% for the behavioral dataset. For the history dataset, the LSTM method achieves the highest accuracy at 75%.
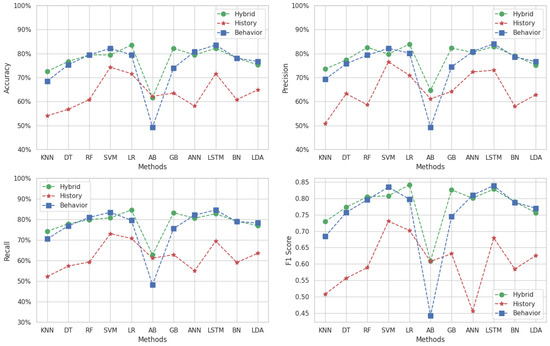
Figure 7.
Results of multi-classification with data augmentation for Target 1.
The second subfigure displays the precision results. The LR method achieves the highest precision value of 85% for the hybrid dataset, and the LSTM method attains the same value for the behavioral dataset. For the history dataset, the SVM method achieves the highest precision at 77%.
The next subfigure presents the recall metric. The highest recall value is 85%, achieved by the LR method for the hybrid dataset and the LSTM method for the behavioral dataset. For the history dataset, the SVM method achieves the highest recall of 73%.
The fourth subfigure illustrates the F1-score results. The LR method achieves the highest F1-score of 0.84 for the hybrid dataset, and the LSTM method also reaches 0.84 for the behavioral dataset. For the history dataset, the SVM method attains the highest F1-score of 0.77.
The behavioral and hybrid datasets exhibit similar metric values across most methods, except for the AB method, where the behavioral dataset shows lower values. The historical dataset consistently shows lower metric values across most methods, except for the AB method, where its values are higher than those of the behavioral dataset.
In Figure 8, we present the results of multi-classification with data augmentation for Target 2, highlighting the performance of various machine learning methods across the hybrid, behavioral, and history datasets. The metrics evaluated include accuracy, precision, recall, and F1-score, providing a comprehensive analysis of model effectiveness.
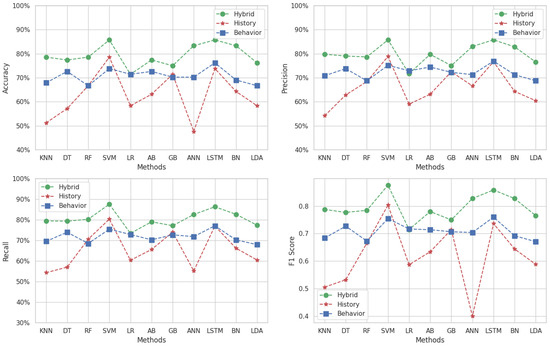
Figure 8.
Results of multi-classification with data augmentation for Target 2.
For accuracy, the hybrid dataset demonstrates superior performance across all methods, achieving the highest value of 85% with both the LSTM and SVM methods. The history dataset achieves its maximum accuracy of 79% with the SVM method; however, its accuracy values are generally lower, except for the SVM method, where it surpasses the behavioral dataset. The behavioral dataset exhibits accuracy values ranging between 67% for the RF method and 77% for the LSTM method.
In terms of precision, the hybrid dataset again performs best, achieving a maximum of 85% in both the SVM and LSTM methods. The history dataset reaches its highest precision of 79% using the SVM method. The behavioral dataset achieves precision values ranging from 69% using the LDA method to 78% using the LSTM method. For most methods, the behavioral dataset surpasses the history dataset in precision, except for the SVM method where the history dataset performs better.
The recall metric also reflects the dominance of the hybrid dataset, which achieves its maximum value of 88% in the SVM method. The history dataset obtains its highest recall of 80% using the SVM method. The behavioral dataset outperforms the history dataset in recall for most methods, with values ranging between 68% using the LDA method and 77% using the LSTM method, except when using the SVM method where the history dataset achieves better recall.
For the F1-score, the hybrid dataset exhibits the highest overall performance, with a maximum value of 0.88 using the SVM method. The history dataset achieves its best F1-score of 0.80 using the SVM method, while the behavioral dataset shows better F1-scores than the history dataset for most methods.
These observations underscore the overall superior performance of all methods applied to the hybrid dataset across all metrics, with the behavioral dataset generally outperforming the history dataset except for specific methods such as SVM. This comparative evaluation highlights the impact of data augmentation and the advantages of integrating multiple data sources.
In Figure 9, we present the results of multi-classification with data augmentation for Target 3, highlighting the performance of various machine learning methods across the hybrid, behavioral, and history datasets for accuracy, precision, recall, and F1-score.
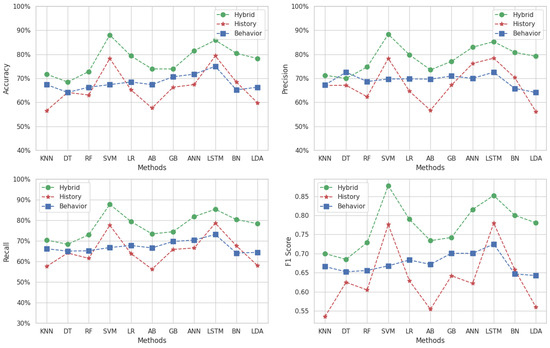
Figure 9.
Results of multi-classification with data augmentation for Target 3.
Methods applied to the hybrid dataset demonstrate the best performance across all metrics. SVM achieves the highest scores, accuracy, and precision of 89%, as well as a recall of 88% and an F1-score of 0.84.
For the history dataset, the highest accuracy is achieved with the LSTM method at 80%, while the maximum precision is 79% with both the SVM and LSTM methods. The highest recall is also observed at 79%, achieved with the same methods. Similarly, the maximum F1-score for the history dataset is 0.78.
The behavioral dataset displays accuracy values ranging from 64% with the BN method to 75% with the LSTM method. Precision values range from 65% with the LDA method to 72% with the DT method. Recall values range from 64% to 72% (with LDA and LSTM, respectively). For the F1-score, the behavioral dataset exhibits values between 0.64 and 0.73.
Overall, while the hybrid dataset consistently outperforms the other datasets using all methods, the behavioral dataset demonstrates better average performance compared to the history dataset. However, the history dataset achieves higher values than the behavioral dataset with certain methods. This variability highlights the nuanced differences between the datasets and the methods applied.
5.3. Binary Classification
In this subsection, we present the results of binary classification as a second solution for our challenging amount of data using the same augmented data used before in multi-classification to ensure a credible comparative analysis. Moreover, because it is already shows better results than the original data, this approach focuses on pass/fail students. By sacrificing the details that can be obtained from multi-classification, we obtain more data to train our models and fewer tasks [25].
Figure 10 presents the results for the binary classification of Target 1. For accuracy, the hybrid dataset outshines both the history and behavior, consistently achieving the highest scores, particularly with the LSTM method (). This suggests that combining behavioral and historical data creates a more accurate predictive model. In contrast, while the behavior approach also performs well, surpassing the history approach, it does not reach the effectiveness of the hybrid.
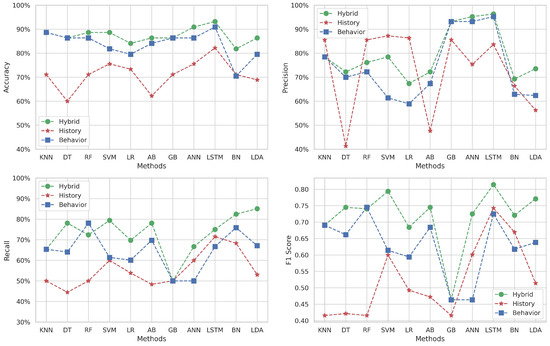
Figure 10.
Binary classification results for Target 1.
In terms of precision, the hybrid dataset stands out again, showing the highest precision using most methods and peaking with LSTM (). This indicates a strong ability to identify students who may fail accurately without many false positives. However, for specific methods, such as KNN, RF, SVM, and LR, the history dataset demonstrates superior precision over the hybrid, suggesting that historical data alone may be more telling for these algorithms.
The hybrid dataset performs best across almost all methods, performing best using the LDA method (). Interestingly, the behavior dataset excels over the hybrid only with the RF algorithm and generally does better than the history dataset, except ANN and LSTM, which demonstrate more effectiveness on the historical data.
Regarding the F1-score, the hybrid dataset maintains superior performance, especially notable with LSTM (), indicating an excellent equilibrium in identifying true positives and avoiding false negatives. The behavior data, while strong, falls behind when used with methods like ANN, LSTM, and BN, where those methods manage trade-offs better between precision and recall when applied on historical data.
These findings indicate that the hybrid dataset, particularly when employing SVM, LSTM, and LDA algorithms, is highly effective for predicting outcomes in the “Algorithm and Programming 1” course. By leveraging both behavioral and historical data, this approach offers a comprehensive and balanced tool, making it particularly suitable for identifying students who may fail in this educational setting.
Figure 11 provides a comprehensive analysis of the binary classification metrics for Target 2. The hybrid dataset demonstrates superior accuracy across most ML methods, notably achieving its highest accuracy with the ANN and LSTM methods (). This indicates the effectiveness of combining both behavioral and historical data for this target. The behavior dataset generally performs better than the history dataset, except in the AB method where the history dataset is superior.
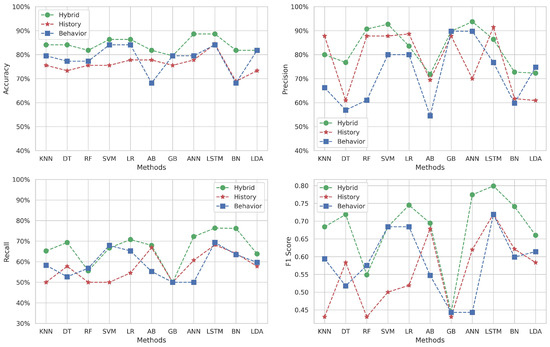
Figure 11.
Binary classification results for Target 2.
In the precision metrics, the hybrid dataset shows the best results, particularly excelling with the ANN method (). However, methods such as KNN, LR, and LSTM achieve higher precision with the historical data, suggesting their specific utility in these contexts. The behavior dataset outshines with methods such as GB, ANN, and LSTM, highlighting its relevance in certain scenarios.
The hybrid data also lead in recall scores, especially excelling with the LSTM and BN methods (). The behavior dataset generally surpasses the history dataset, except with the DT, AB, and ANN methods, where historical insights prove more effective.
For F1-scores, the hybrid data continue to perform optimally, particularly with the LSTM method (). This score is significant for ensuring that the model is both accurate and reliable. DT, AB, ANN, and BN show better scores on historical than behavioral data in comparison to other methods.
Overall, these results reinforce the chance to select the hybrid data in ML applications for educational purposes, especially in the context of the “Algorithm and Programming 2” course. The consistent performance across various metrics suggests that this dataset effectively leverages the strengths of both behavioral and historical data to enhance predictive accuracy and reliability. The ANN and LSTM methods, in particular, stand out as highly effective when applied to the hybrid dataset, demonstrating their capability to handle complex data patterns and dependencies effectively.
Figure 12 offers a detailed examination of the binary classification metrics for Target 3. The analysis of accuracy reveals that the scores obtained with the behavioral data generally surpass those of the hybrid dataset, except for LR, LSTM, and LDA, achieving accuracy greater than with LSTM.
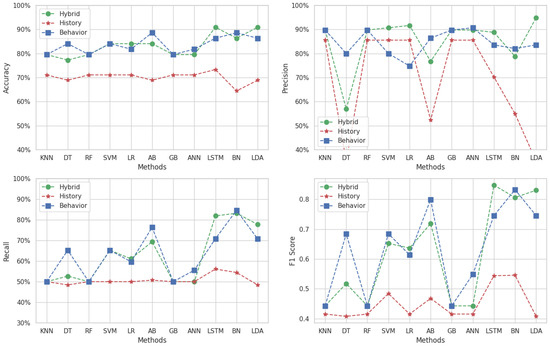
Figure 12.
Binary classification results for Target 3.
In terms of precision, the hybrid reaches its peak performance with the LDA method, approaching . The behavior dataset typically outperforms the hybrid in most methods, but the hybrid is superior in SVM, LR, LSTM, and LDA. Again, the history dataset lags, indicating its relatively lower effectiveness in precisely identifying true positives in this target.
For recall, the behavior dataset leads in most methods, indicating its strength in capturing a high proportion of actual positive cases. However, the hybrid outshines the behavior one with LR, LSTM, and LDA methods. The highest recall rates are noted using the BN method () on the behavior and hybrid datasets. The history dataset continues to perform poorly in recall across all methods.
The F1-score graphs illustrate that the behavior dataset generally offers the best balance between precision and recall with most methods, except LR, LSTM, and LDA, which perform best when applied to the hybrid data. The highest F1-score is achieved with the LSTM method applied in the hybrid dataset (). Like previous metrics, the history data’s F1-scores are consistently lower than those of the other approaches.
These findings indicate that while the behavior approach is generally strong across most metrics and methods, the hybrid approach provides notable advantages in specific contexts, especially in methods that benefit from a combination of data types, like LSTM and LDA. This effectiveness is particularly important in an educational context where accurately predicting student outcomes can influence educational strategies and interventions. The history approach, while lagging in performance, may still hold some contextual or specific methodological relevance that could be explored further.
To complement our analysis, we performed a paired t-test to compare the performance of machine learning models between binary and multi-class classification tasks using the hybrid dataset. This dataset was intentionally constructed to contain both types of labels for each prediction target, enabling a meaningful one-to-one comparison across the two classification settings. We selected accuracy as the primary evaluation metric because it provides a straightforward and interpretable measure of the proportion of correctly classified instances, making it suitable for balanced comparisons across tasks. The paired t-test is used here to assess whether the differences in accuracy between binary and multi-class scenarios are statistically significant or could be attributed to random variation. This statistical test strengthens the validity of our findings by highlighting which performance differences are meaningful, thereby enhancing the reliability of the comparative evaluation.
In Figure 13, the p-values from t-tests highlight significant differences in accuracy between binary and multi-class classification for most models and targets. Models such as decision trees, random forests, AdaBoost, and LSTM consistently show significant p-values (below 0.05) across all targets, indicating that their performance is strongly influenced by the classification type. SVM, Gradient Boosting, and LDA also exhibit significant differences in at least two targets, suggesting moderate sensitivity. On the other hand, KNN and logistic regression show mixed behavior—only some targets present significant differences—while naive Bayes and ANNs show minimal or inconsistent significance, with most p-values exceeding the threshold. These results underline that the impact of classification type varies by model; for some models, adapting the approach depending on the classification context may be necessary.

Figure 13.
p-values from t-test between binary and multi-classification of accuracy.
6. Discussion
The primary limitation of this study lies in the restricted dataset, which comprises only 200 student instances from a single institution and academic context. This limited size affects the generalizability of the findings and increases the risk of overfitting, particularly when applying complex machine learning models. Furthermore, each target variable corresponds to a specific course and grading scheme, which may not reflect broader educational environments. The issue of class imbalance further compounds these challenges by skewing model predictions toward the majority classes, potentially overlooking patterns in under-represented student groups. While data augmentation techniques were employed to mitigate this imbalance, the dataset’s scope remains a constraint.
The emphasis on technical metrics, such as accuracy, precision, recall, and F1-score, while essential for evaluating model performance, must not overshadow their practical implications in educational contexts. These metrics, when applied effectively, translate into actionable insights that can directly impact real-world outcomes. For instance, high recall ensures that the majority of at-risk students are identified early, enabling timely interventions to prevent failures. Precision minimizes false alarms, ensuring that resources are allocated efficiently to those who truly need assistance. Meanwhile, accuracy provides a general assessment of the model’s overall reliability, and the F1-score offers a balanced perspective on both false positives and negatives, guiding decisions for nuanced interventions. By aligning these technical evaluations with educational goals, such as student retention, personalized learning pathways, and optimizing instructional strategies, educators and administrators can bridge the gap between predictive analytics and meaningful improvements in the learning process. This integration ensures that predictive modeling not only remains a robust technical solution but also serves as a transformative tool for fostering equitable and effective education.
The results of applying ML methods for multi-classification revealed modest accuracies but low F1-scores, which highlight a significant limitation. While accuracy values may appear satisfactory, they can be misleading in scenarios involving imbalanced datasets. For instance, models may achieve high accuracy simply by favoring the majority class, failing to effectively capture the nuances of minority classes. This underscores the need for more comprehensive metrics, such as precision, recall, and F1-score, to evaluate model performance in predicting student performance.
To mitigate the challenges posed by small datasets and imbalanced classes, we employed data augmentation as the first solution. This approach allowed us to balance classes, generate more nuanced data, and reduce overfitting. The augmented dataset also provides insights into how the models might perform when more generable data become available in the future. The impact of data augmentation is evident in the results, where recall and F1-scores significantly improved. For Target 1, recall improved from 66% to 85%, and the F1-score increased from 0.67 to 0.85 after augmentation. Although accuracy and precision for Target 1 were slightly reduced (88% to 85% for accuracy and 96% to 85% for precision), the overall improvement in recall and F1-scores indicates a better balance in model performance.
For Target 2, the highest accuracy, precision, recall, and F1-scores achieved in multi-classification were 82%, 93%, 60%, and 0.64, respectively. After data augmentation, these scores improved to 87%, 86%, 88%, and 0.87. A similar trend was observed for Target 3, where the metrics improved from 88%, 95%, 68%, and 0.69 to 89%, 88%, 88%, and 0.88, respectively. These improvements highlight the efficacy of data augmentation in addressing class imbalances and enhancing model reliability.
Binary classification serves as a second solution by focusing on distinguishing pass/fail students, which is a practical choice for educational administration [26]. The strengths of this approach include less complex models and the availability of more training data per class. However, this simplicity comes at the cost of losing detailed information about intermediate categories, which affects the generalizability of the results. The binary classification results are noteworthy, with the highest accuracy, precision, recall, and F1-scores for Target 1 being 94%, 97%, 85%, and 0.82, respectively. For Target 2, these scores were 89%, 94%, 77%, and 0.80, while for Target 3, they were 91%, 96%, 84%, and 0.87. These results demonstrate that binary classification can provide more focused and accurate predictions, albeit at the expense of finer-grained insights. A comparative analysis between multi-classification before and after data augmentation, and then with binary classification with augmented data, revealed complementary strengths. Multi-classification provided higher accuracy and precision but suffered from lower recall and F1-scores, particularly in imbalanced datasets. Data augmentation improved recall and F1-scores significantly while maintaining competitive accuracy and precision. Binary classification offered a practical and straightforward approach for identifying pass/fail students but lacked the granularity of multi-classification. Table 10 summarizes the highest scores achieved.
Table 10.
Classification results across targets, methods, and datasets.
The integration of machine learning methodologies in education offers profound pedagogical benefits by enabling a nuanced understanding of student performance. This study demonstrates how predictive models, through behavioral and historical data analysis, can empower educators to identify at-risk students and implement targeted interventions early. The application of data augmentation and binary classification not only enhances model accuracy but also aligns with practical educational objectives such as student retention and resource optimization. These methodologies provide actionable insights, paving the way for teaching practices that are adaptive and responsive to the diverse needs of learners.
Moreover, predictive analytics serves as a transformative tool for curriculum design and instructional strategies in coding courses, where challenges such as abstract concepts and problem-solving complexities are prevalent. Insights from these models allow educators to tailor resources and create differentiated instructional plans for students across various performance levels. Additionally, embedding these tools into learning management systems fosters systematic improvement in teaching practices and institutional strategies. By leveraging data-driven approaches, this study bridges the gap between predictive analytics and educational improvement, promoting a proactive, student-centered learning environment.
In this discussion, we highlighted the limitations of small datasets, class imbalances, and overfitting, which challenge the effectiveness and generalizability of predictive models. While multi-classification results provided modest accuracies with low F1-scores, data augmentation significantly improved performance by balancing classes and enhancing recall and F1-scores. Binary classification emerged as an alternative solution, offering simplicity and practicality for administrative purposes, albeit with reduced generalizability. These complementary approaches offer valuable insights and tools for predicting student performance in educational settings.
We compared our results with existing research to position our study within the broader context of related work. As shown in Table 11, our methodology using the LSTM model outperforms other studies in terms of precision, recall, and F1-score. For example, Hung et al. [8] achieved balanced performance across metrics using RF, with an F1-score of 0.83. Pires et al. [7] utilized boosting techniques such as LogitBoost and AB to achieve an accuracy of 85.14%. Similarly, Abu Zohair [12] employed SVM and reported an accuracy of 76.3%. In contrast, our study, using LSTM, achieved an accuracy of 87%, precision of 87%, recall of 88%, and an F1-score of 0.88, demonstrating the robustness of our approach, like also demonstrated in [27,28]. These comparisons underline the effectiveness of our hybrid dataset and the proposed methodologies, particularly in addressing challenges such as small dataset size and class imbalance, further validating our contributions to the field.
Table 11.
Summary of studies with their methodologies and scores.
Expanding the dataset to include multiple institutions and larger student populations presents several challenges. Firstly, the process of collecting data across institutions demands significant time and logistical coordination. Secondly, existing datasets from other institutions may not align with the specific features and targets of our study, as many focus on predicting performance in other subjects rather than coding. Furthermore, the inclusion of behavioral observations and data augmentation in our study is tailored to small datasets, making it difficult to find comparable datasets to merge or validate externally. Additionally, exploring socio-cultural factors would require access to sensitive student information, which is often protected by strict privacy policies, limiting the feasibility of such analyses. As a result, our approach prioritizes optimizing smaller datasets through methodological enhancements while respecting these constraints.
To further validate our findings, we conducted a paired t-test between binary and multi-class classification performances across all machine learning models and targets using the hybrid dataset. The t-test revealed statistically significant differences (p-value < 0.05) in the accuracy scores for most models, particularly for decision trees, random forests, AdaBoost, and LSTM, across all three targets. This suggests that classification type has a notable impact on model performance. The results strengthen our conclusions by confirming that binary classification, when applied to balanced data, provides significantly different and, in many cases, superior performance compared to multi-class classification. These findings underscore the robustness of our methodological choices and highlight the importance of evaluating performance with appropriate statistical tools to ensure reliable and generalizable insights.
7. Conclusions and Future Research
In this paper, we explain and demonstrate, by experience, the strengths of a hybrid dataset containing previous students’ records and their behavior in coding courses. Also, we provide two solutions for the data size challenge by applying the data augmentation technique in multi-classification, or by switching to binary classification focusing on pass/fail students. Moreover, when the data size grows each year, we can always find the best approach to forecast performance. This is possible by applying our framework in the learning management system environment.
This work highlights the ability of teachers to examine learners’ behavior during classes, which has not been assessed with intelligence artificial until the present. Because learning coding skills depends on variant factors: geography, generation’s mentality, country policy, university goals, and teacher methodology. Our paper presents an AI-based performance model developed to forecast student behavior during their initial attempt at learning coding. Utilizing a dataset from Hassan First, University Settat, Morocco, involving 200 cases, we explored both multi-classification and binary classification approaches to analyze student risk levels. Our findings indicate that the hybrid approach, especially using the LSTM method, consistently delivers superior results in all classification types. The shift from multi- to binary classification is a strategic choice for teachers and administration, delivering more strategical pedagogy. This study highlights the utility of combining historical data and behavioral observations to enhance predictive accuracy and provide actionable insights. As the dataset grows with the accumulation of annual student data, the potential for refining and achieving more detailed forecasts using multi-classification also increases. Our research underscores the significant role of AI in educational settings, particularly in coding education, which is influenced by diverse factors such as geographical, institutional, and pedagogical variables. The framework proposed can be adaptable to different learning management systems further due to its stable growth over the years, demonstrating its applicability in real-world educational environments, offering a valuable tool for educators to proactively support students based on predicted learning outcomes.
While this study provides significant insights into forecasting student performance in coding courses, it does have some limitations. The small dataset size (200) and inherent class imbalances pose challenges to generalizability and model robustness. Additionally, the reliance on a single institution’s dataset may limit the applicability of the findings to other educational contexts with varying teaching methodologies and student demographics. The behavioral data, while valuable, are subject to subjective assessments by instructors, which may introduce biases. Future efforts to address these limitations include expanding the dataset, incorporating objective behavioral metrics, and validating the model across diverse institutional settings.
In future work, we plan to enhance our AI-based performance model by integrating emotional and cognitive data, exploring advanced machine learning techniques, like natural language processing, and expanding the use of detailed multi-classification approaches as our dataset grows. We also aim to implement and validate our framework using different metrics and across different educational settings to assess its effectiveness and scalability. These efforts will deepen our understanding of student behaviors and improve the targeted interventions we can offer in educational environments. Additionally, we plan to explore the integration of transformer-based models for tabular data, apply Explainable AI techniques, and develop ensemble strategies, as part of the methodological extensions.
Author Contributions
Z.S.H.: conceptualization, methodology, software, formal analysis, writing—original draft, visualization, investigation, and data curation. S.E.K.: conceptualization, methodology, software, supervision, visualization, investigation, project administration, formal analysis, and writing—review and editing. All authors have read and agreed to the published version of the manuscript.
Funding
This research received no funding.
Data Availability Statement
The data collected, analyzed, and utilized in this study can be easily accessed. Upon reasonable request, they will be made available for private use.
Conflicts of Interest
The authors declare no conflicts of interest.
References
- Naseer, M.; Zhang, W.; Zhu, W. Prediction of coding intricacy in a software engineering team through machine learning to ensure cooperative learning and sustainable education. Sustainability 2020, 12, 8986. [Google Scholar] [CrossRef]
- Hafdi, Y.; El Kafhali, S. Student Performance Prediction in Learning Management System Using Small Dataset. In Proceedings of the 3rd International Conference on Artificial Intelligence and Computer Vision (AICV2023), Marrakesh, Morocco, 5–7 March 2023; Volume 18, pp. 4–18. [Google Scholar]
- Hassaoui, M.; Hanini, M.; El Kafhali, S. Domain generated algorithms detection applying a combination of a deep feature selection and traditional machine learning models. J. Comput. Secur. 2023, 31, 85–105. [Google Scholar] [CrossRef]
- Li, W.; Huang, J.Y.; Liu, C.Y.; Tseng, J.C.; Wang, S.P. A study on the relationship between student’learning engagements and higher-order thinking skills in programming learning. Think. Ski. Creat. 2023, 49, 101369. [Google Scholar] [CrossRef]
- Kumari, V.; Meghji, A.F.; Qadir, R.; Gianchand, U. Predicting Student Performance Using Educational Data Mining: A Review. KIET J. Comput. Inf. Sci. 2024, 7, 1–12. [Google Scholar] [CrossRef]
- Arévalo Cordovilla, F.E.; Peña Carrera, M. Comparative analysis of machine learning models for predicting student success in online programming courses: A study based on LMS data and external factors. Mathematics 2024, 12, 3272. [Google Scholar] [CrossRef]
- Pires, J.P.; Brito Correia, F.; Gomes, A.; Borges, A.R.; Bernardino, J. Predicting Student Performance in Introductory Programming Courses. Computers 2024, 13, 219. [Google Scholar] [CrossRef]
- Hung, H.C.; Liu, I.F.; Liang, C.T.; Su, Y.S. Applying educational data mining to explore students’ learning patterns in the flipped learning approach for coding education. Symmetry 2020, 12, 213. [Google Scholar] [CrossRef]
- Abuzinadah, N.; Umer, M.; Ishaq, A.; Al Hejaili, A.; Alsubai, S.; Eshmawi, A.; Mohamed, A.; Ashraf, I. Role of convolutional features and machine learning for predicting student academic performance from MOODLE data. PLoS ONE 2023, 18, e0293061. [Google Scholar] [CrossRef]
- Zouleikha, I.; Lin, X.; Li, J. GAN-Based Data Augmentation for Learning Behavior Analysis in MOOCs. IEEE Access 2024, 12, 48231–48244. [Google Scholar]
- Fahd, K.; Miah, S.J. Effectiveness of data augmentation to predict students at risk using deep learning algorithms. Soc. Netw. Anal. Min. 2023, 13, 113. [Google Scholar] [CrossRef]
- Mahmoud Abu Zohair, L. Prediction of Student’s performance by modeling small dataset size. Int. J. Educ. Technol. High. Educ. 2019, 16, 18. [Google Scholar] [CrossRef]
- Azimi, S.; Popa, C.G.; Cucić, T. Improving Students Performance in Small-Scale Online Courses–A Machine Learning-Based Intervention. arXiv 2020, arXiv:2012.01187. [Google Scholar] [CrossRef]
- Xiong, Z.; Li, H.; Liu, Z.; Chen, Z.; Zhou, H.; Rong, W.; Ouyang, Y. A Review of Data Mining in Personalized Education: Current Trends and Future Prospects. arXiv 2024, arXiv:2402.17236. [Google Scholar] [CrossRef]
- Romero, C.; Ventura, S. Educational data mining and learning analytics: An updated survey. Wiley Interdiscip. Rev. Data Min. Knowl. Discov. 2020, 10, e1355. [Google Scholar] [CrossRef]
- Mduma, N.; Kalegele, K.; Machuve, D. A survey of machine learning approaches and techniques for student dropout prediction. Data Sci. J. 2019, 18, 1–10. [Google Scholar] [CrossRef]
- Alam, A.; Mohanty, A. Predicting Students’ Performance Employing Educational Data Mining Techniques, Machine Learning, and Learning Analytics. In Proceedings of the International Conference on Communication, Networks and Computing, Gwalior, India, 8–10 December 2022; Springer: Cham, Switzerland, 2022; pp. 166–177. [Google Scholar]
- Gnoh, H.; Keoy, K.H.; Iqbal, J.; Anjum, S.; Yeo, S.F.; Lim, A.-F.; Lim, W.; Chaw, L.Y. Enhancing Business Sustainability Through Technology-Enabled AI: Forecasting Student Data and Comparing Prediction Models for Higher Education Institutions (HEIs). PaperASIA 2024, 40, 48–58. [Google Scholar] [CrossRef]
- Buenaño-Fernández, D.; Gil, D.; Luján-Mora, S. Application of machine learning in predicting performance for computer engineering students: A case study. Sustainability 2019, 11, 2833. [Google Scholar] [CrossRef]
- Kotsiantis, S.B. Supervised machine learning: A review of classification techniques. In Proceedings of the 2007 Conference on Emerging Artificial Intelligence Applications in Computer Engineering: Real Word AI Systems with Applications in eHealth, HCI, Information Retrieval and Pervasive Technologies; IOS Press: Amsterdam, The Netherlands, 2007; Volume 160, pp. 3–24. [Google Scholar]
- Hussain, S.; Khan, M.Q. Student-Performulator: Predicting Students’ Academic Performance at Secondary and Intermediate Level Using Machine Learning. Ann. Data Sci. 2021, 10, 637–655. [Google Scholar] [CrossRef]
- Naicker, N.; Adeliyi, T.; Wing, J. Linear Support Vector Machines for Prediction of Student Performance in School-Based Education. Math. Probl. Eng. 2020, 2020, 4761468. [Google Scholar] [CrossRef]
- Pedregosa, F.; Varoquaux, G.; Gramfort, A.; Michel, V.; Thirion, B.; Grisel, O.; Blondel, M.; Prettenhofer, P.; Weiss, R.; Dubourg, V.; et al. Scikit-learn: Machine Learning in Python. J. Mach. Learn. Res. 2011, 12, 2825–2830. [Google Scholar]
- Chollet, F. Keras: The Python Deep Learning Library. 2015. Available online: https://keras.io (accessed on 1 April 2025).
- Mueen, A.; Zafar, B.; Manzoor, U. Modeling and Predicting Students’ Academic Performance Using Data Mining Techniques. Int. J. Mod. Educ. Comput. Sci. 2016, 11, 36–42. [Google Scholar] [CrossRef]
- Villegas, W.; Roman Cañizares, M.; Palacios, X. Improvement of an Online Education Model with the Integration of Machine Learning and Data Analysis in an LMS. Appl. Sci. 2020, 10, 5371. [Google Scholar] [CrossRef]
- Zhao, Y.; Zhang, Y.; Yang, X.; Yu, H. Student Academic Early Warning Prediction based on LSTM Networks. Appl. Sci. 2022, 12, 2871. [Google Scholar]
- Alzahrani, S.; Aldossari, H. Using Long Short-Term Memory Networks (LSTM) to Predict Student Academic Achievement: Dynamic Learning Path Adjustment. Computers 2023, 12, 86. [Google Scholar]
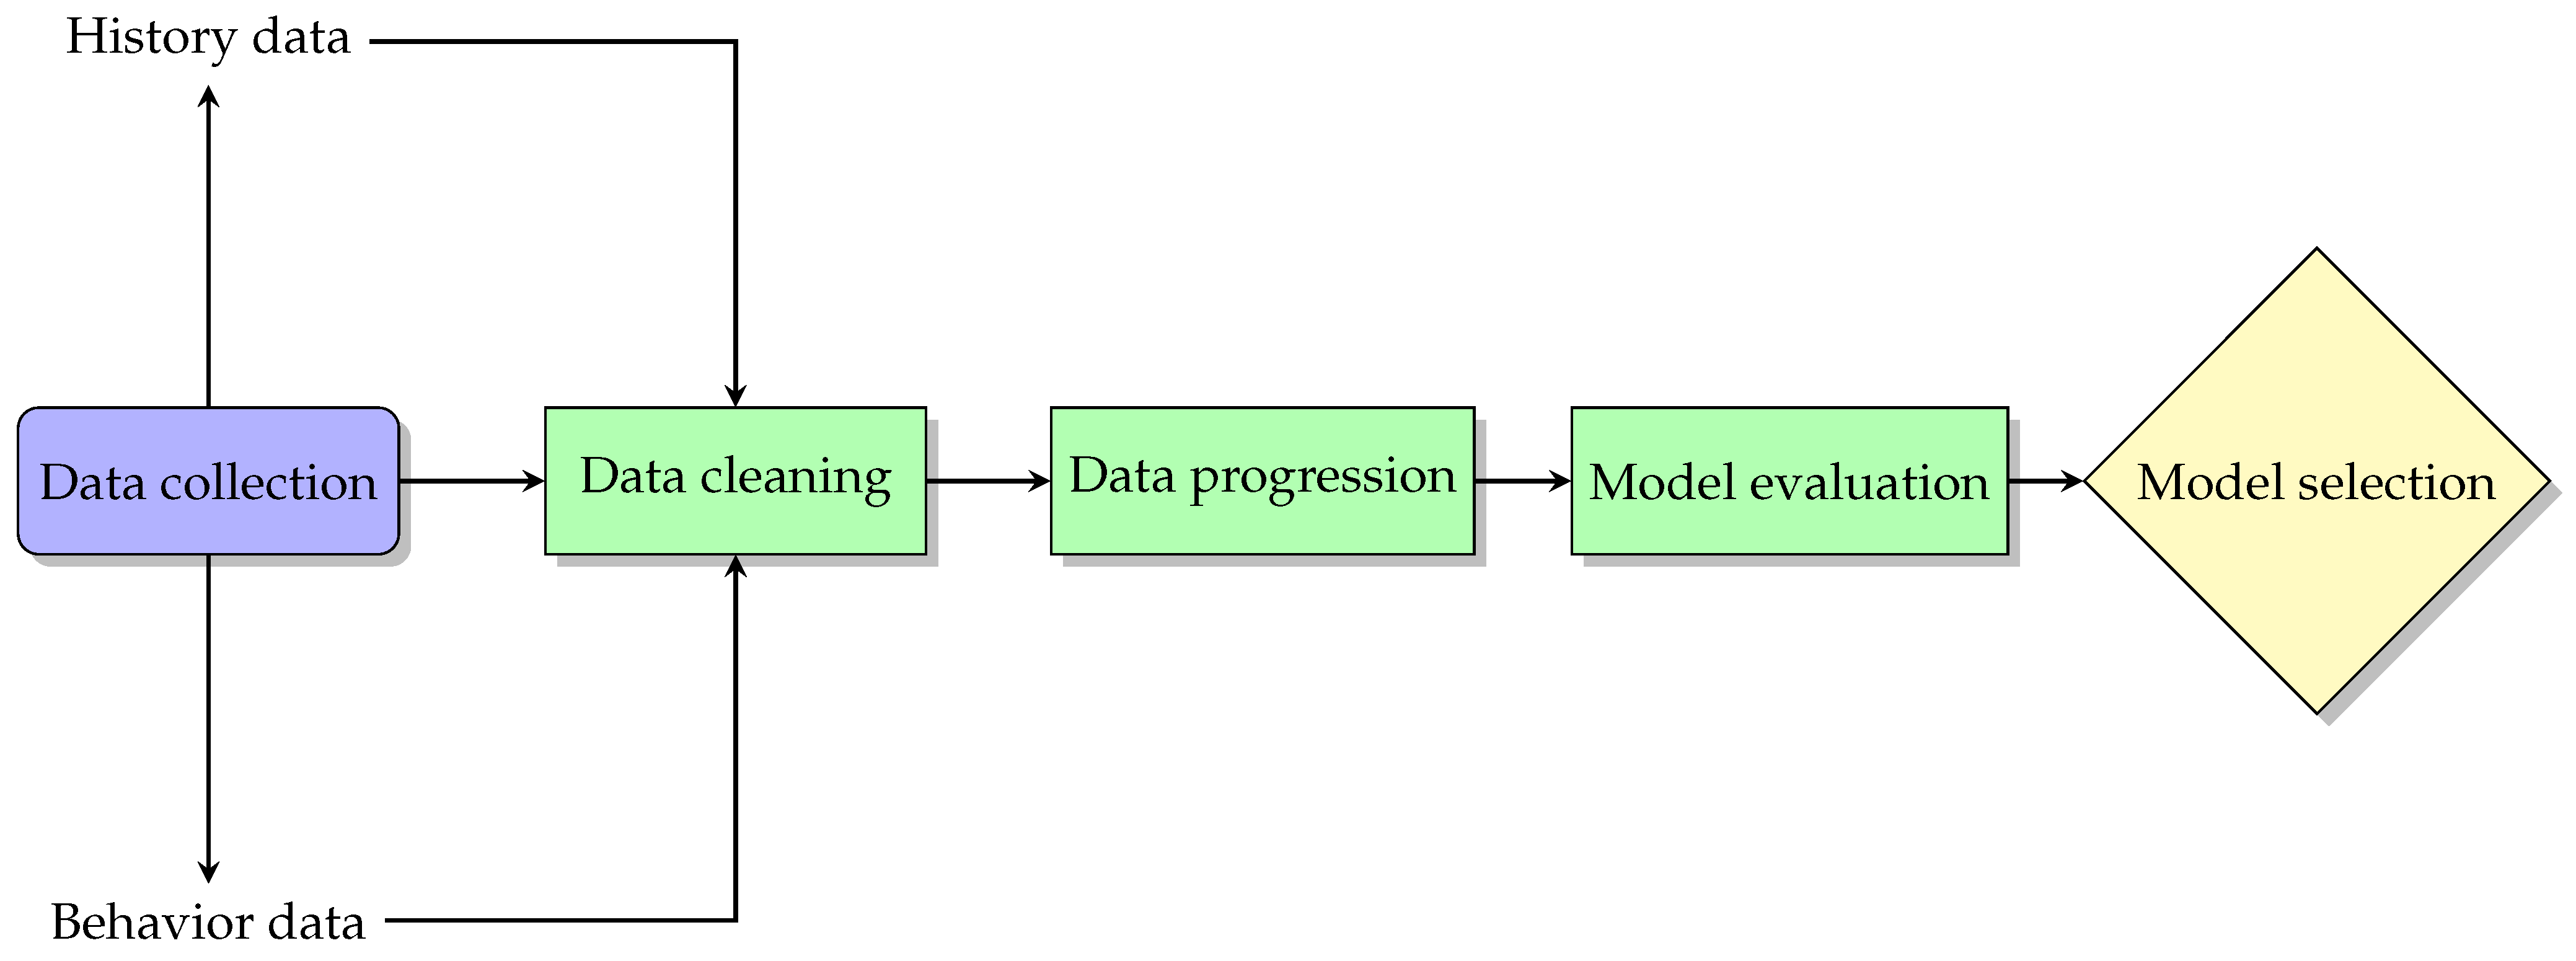
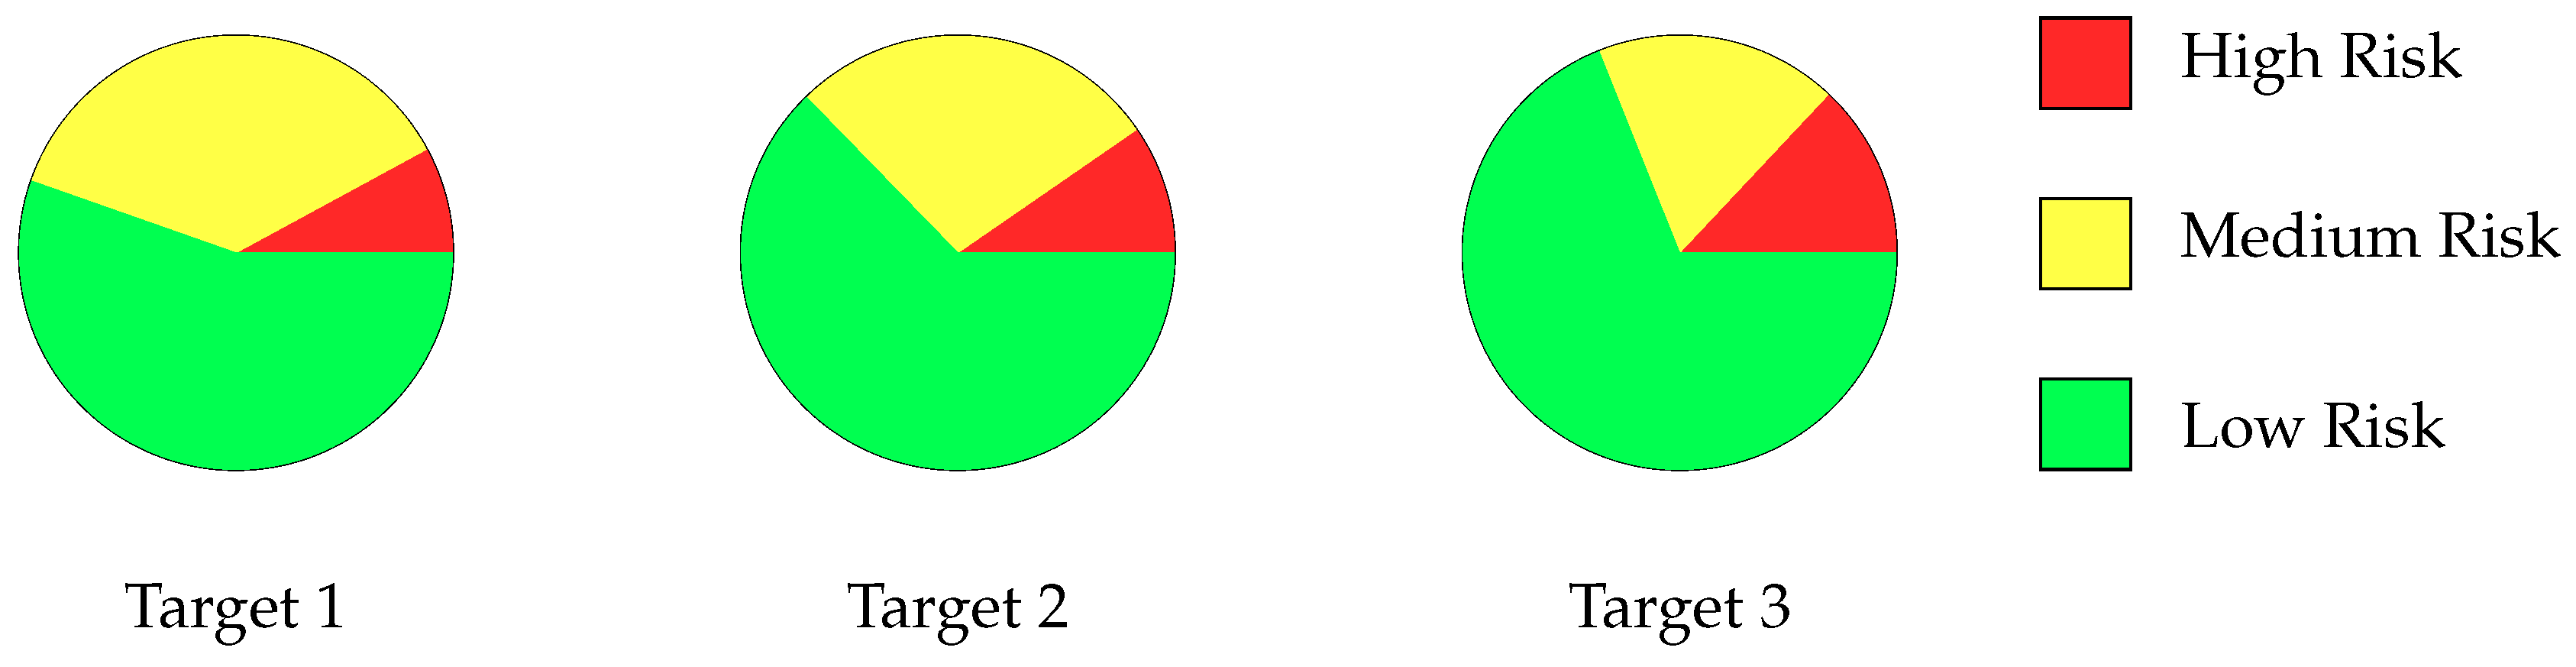
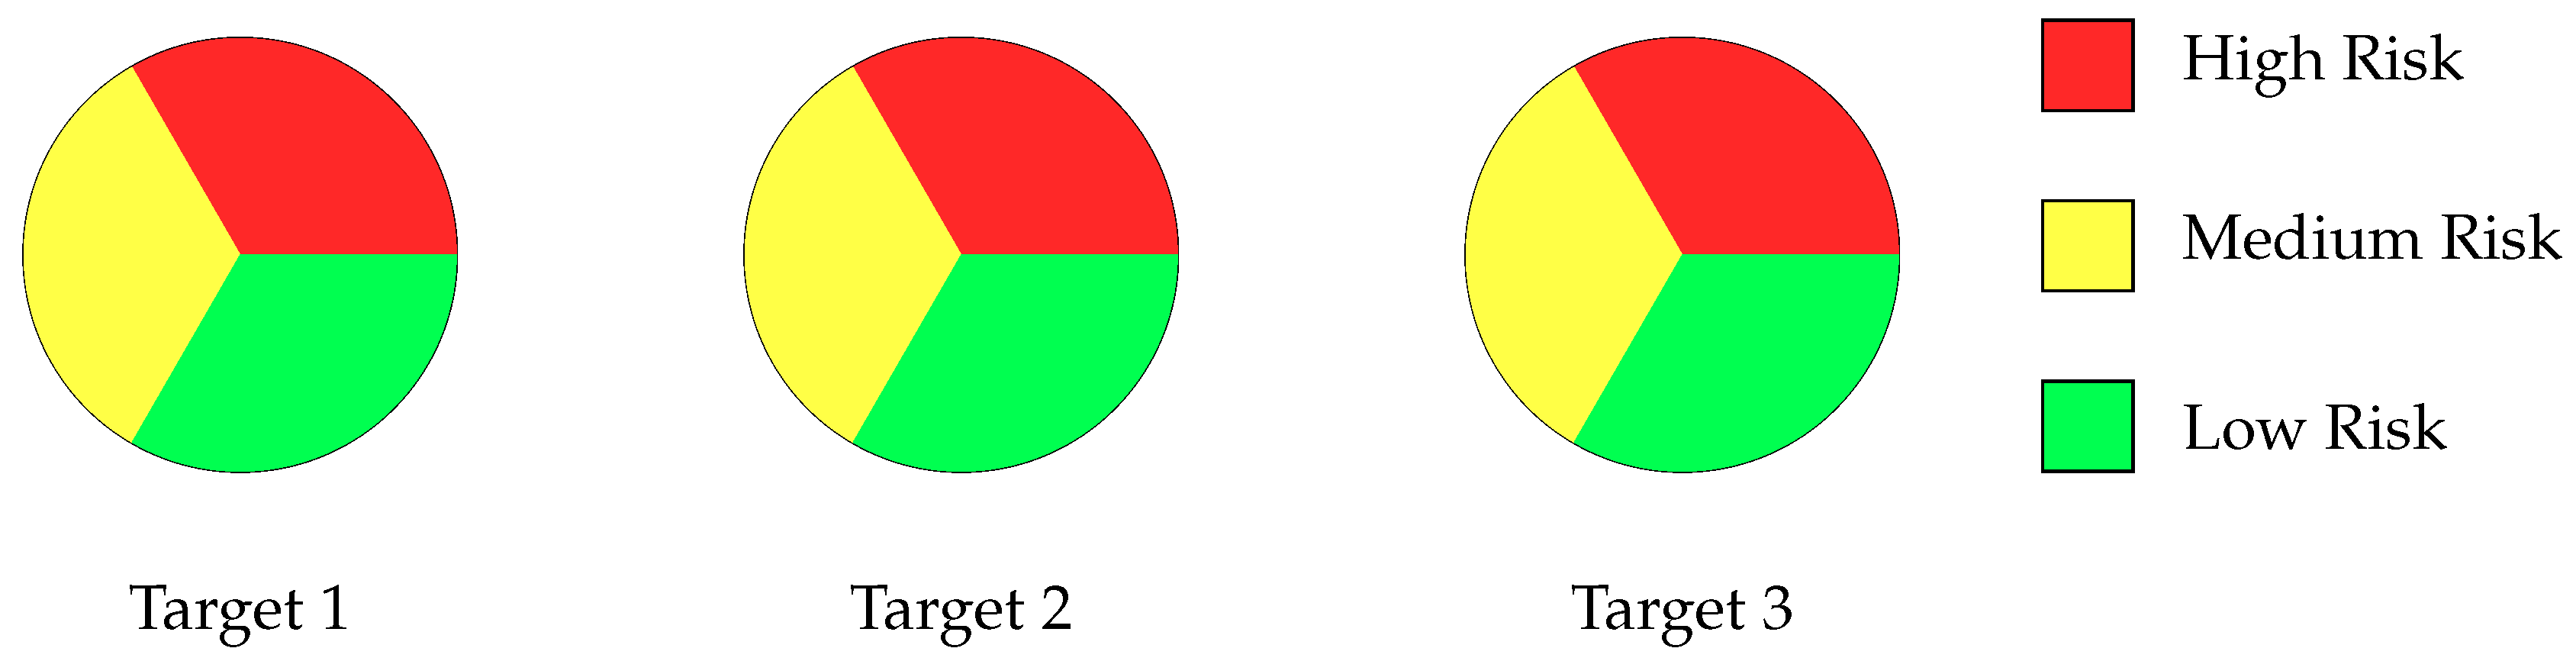
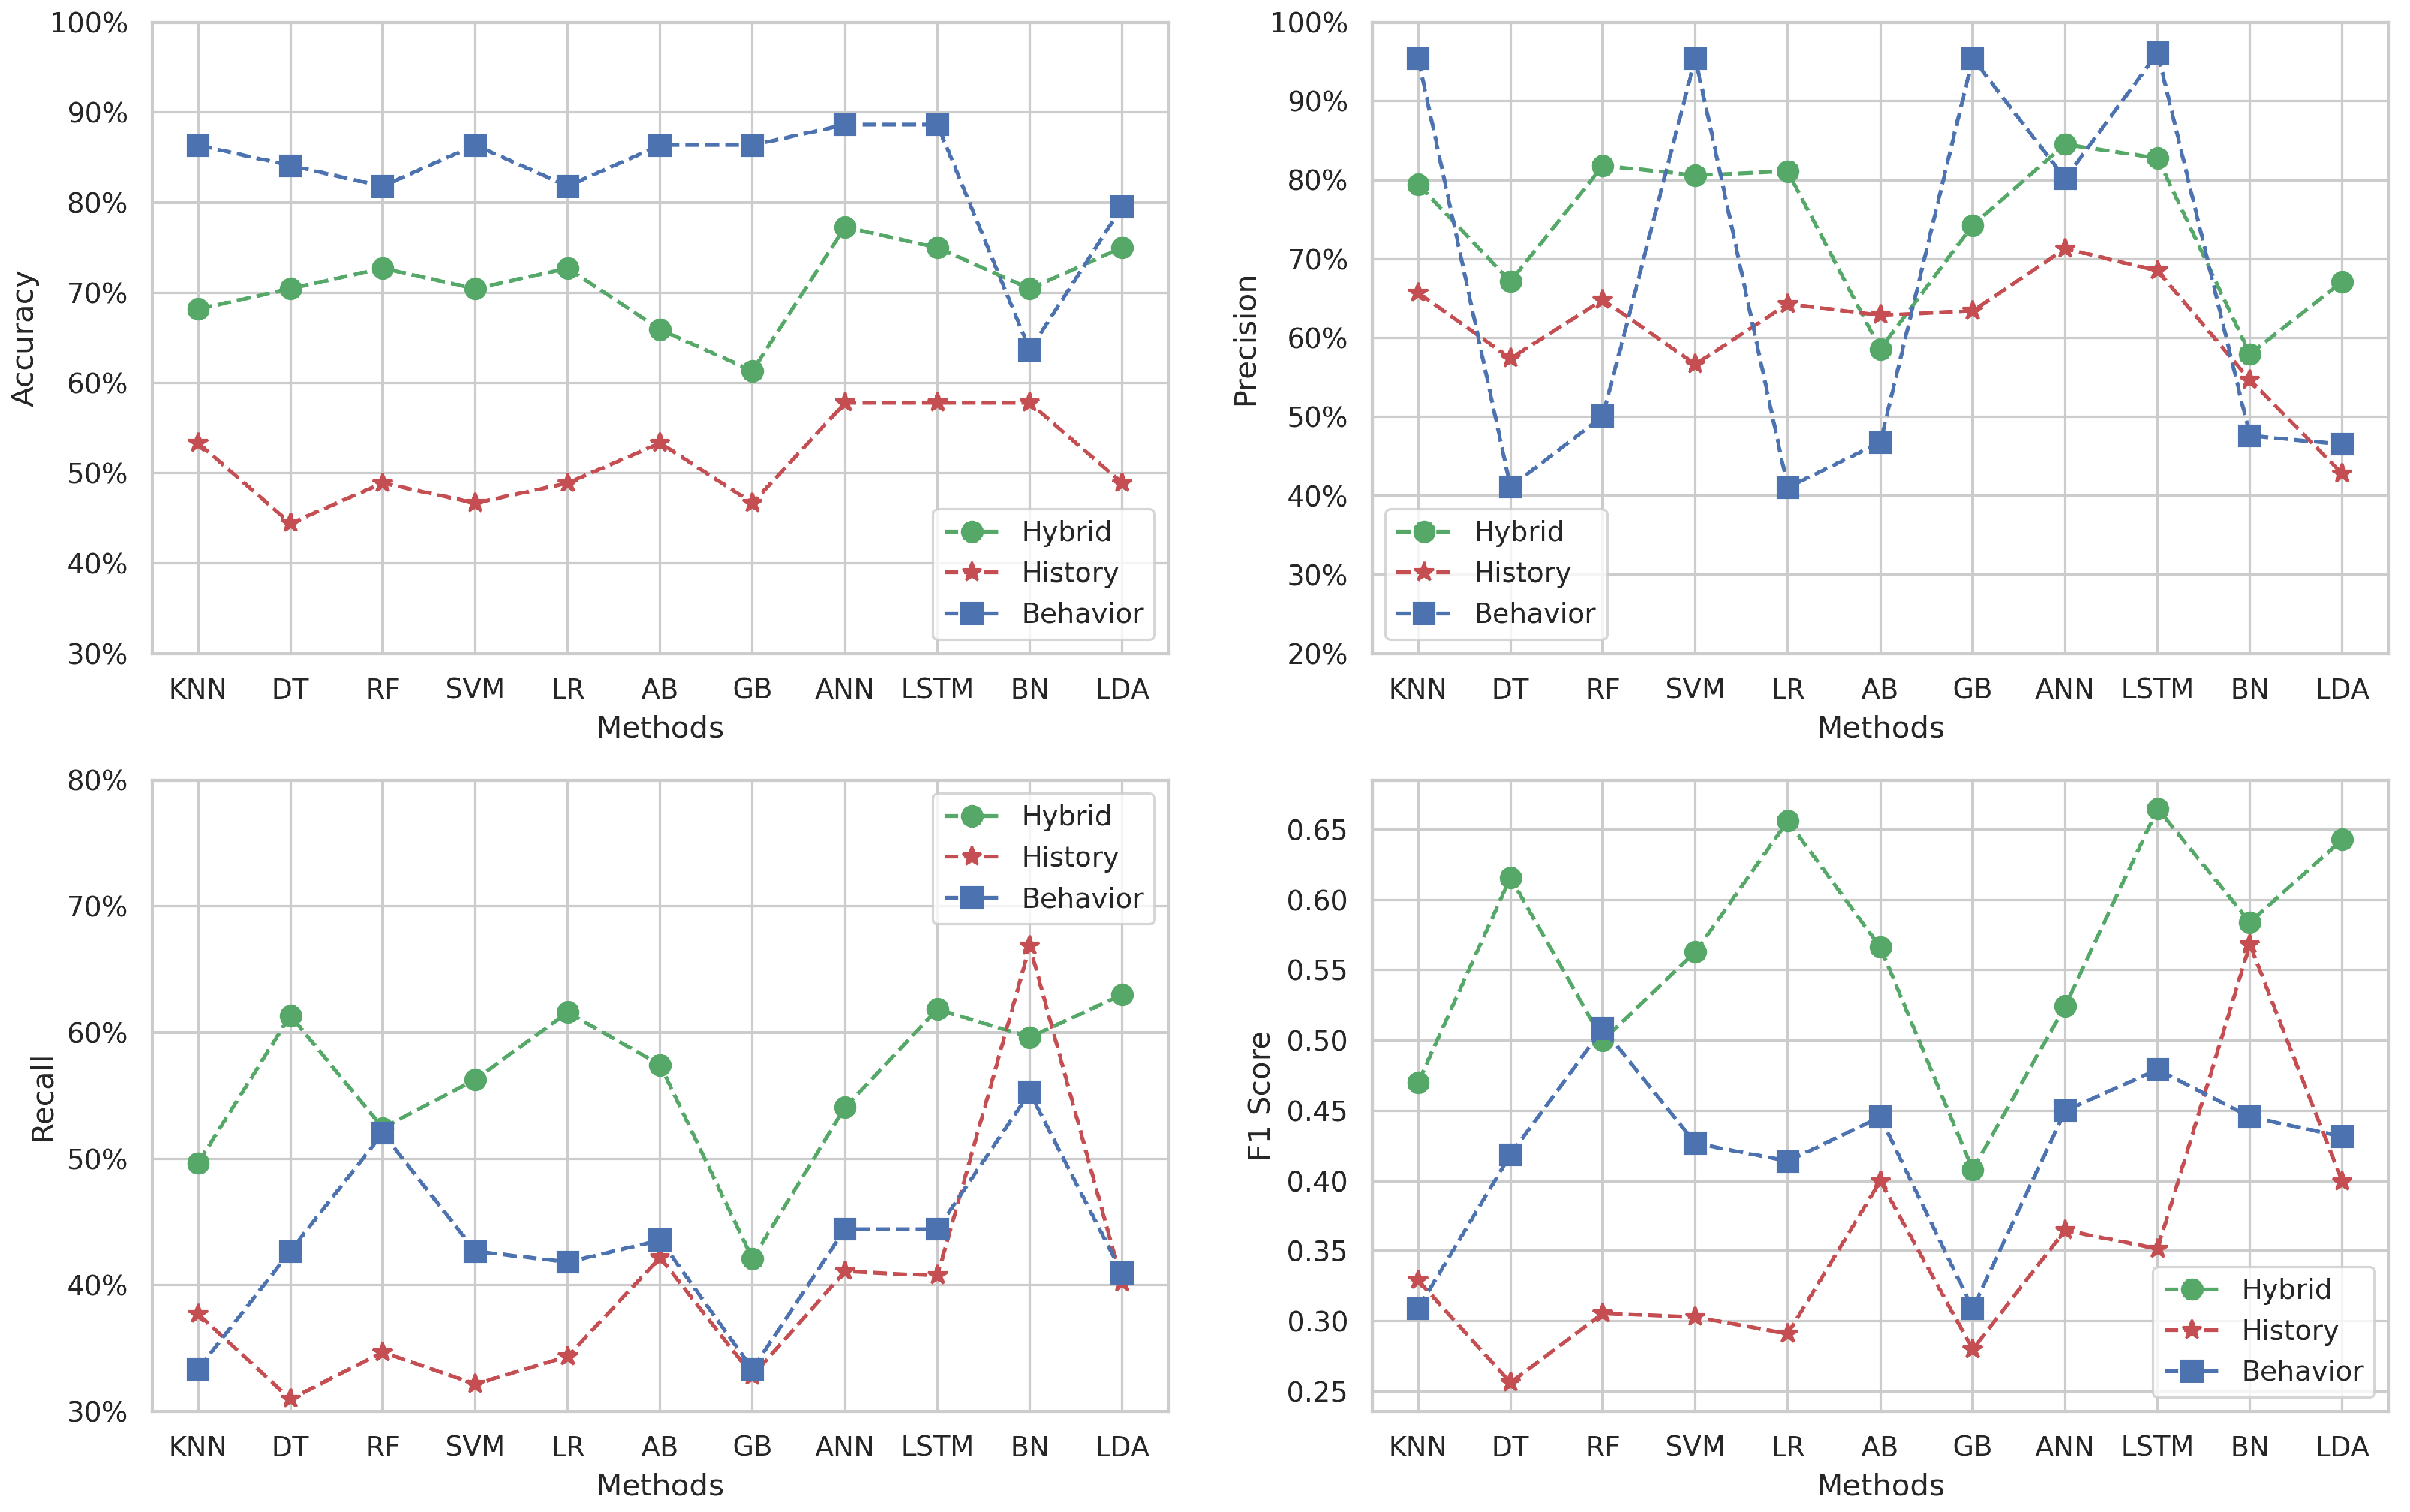
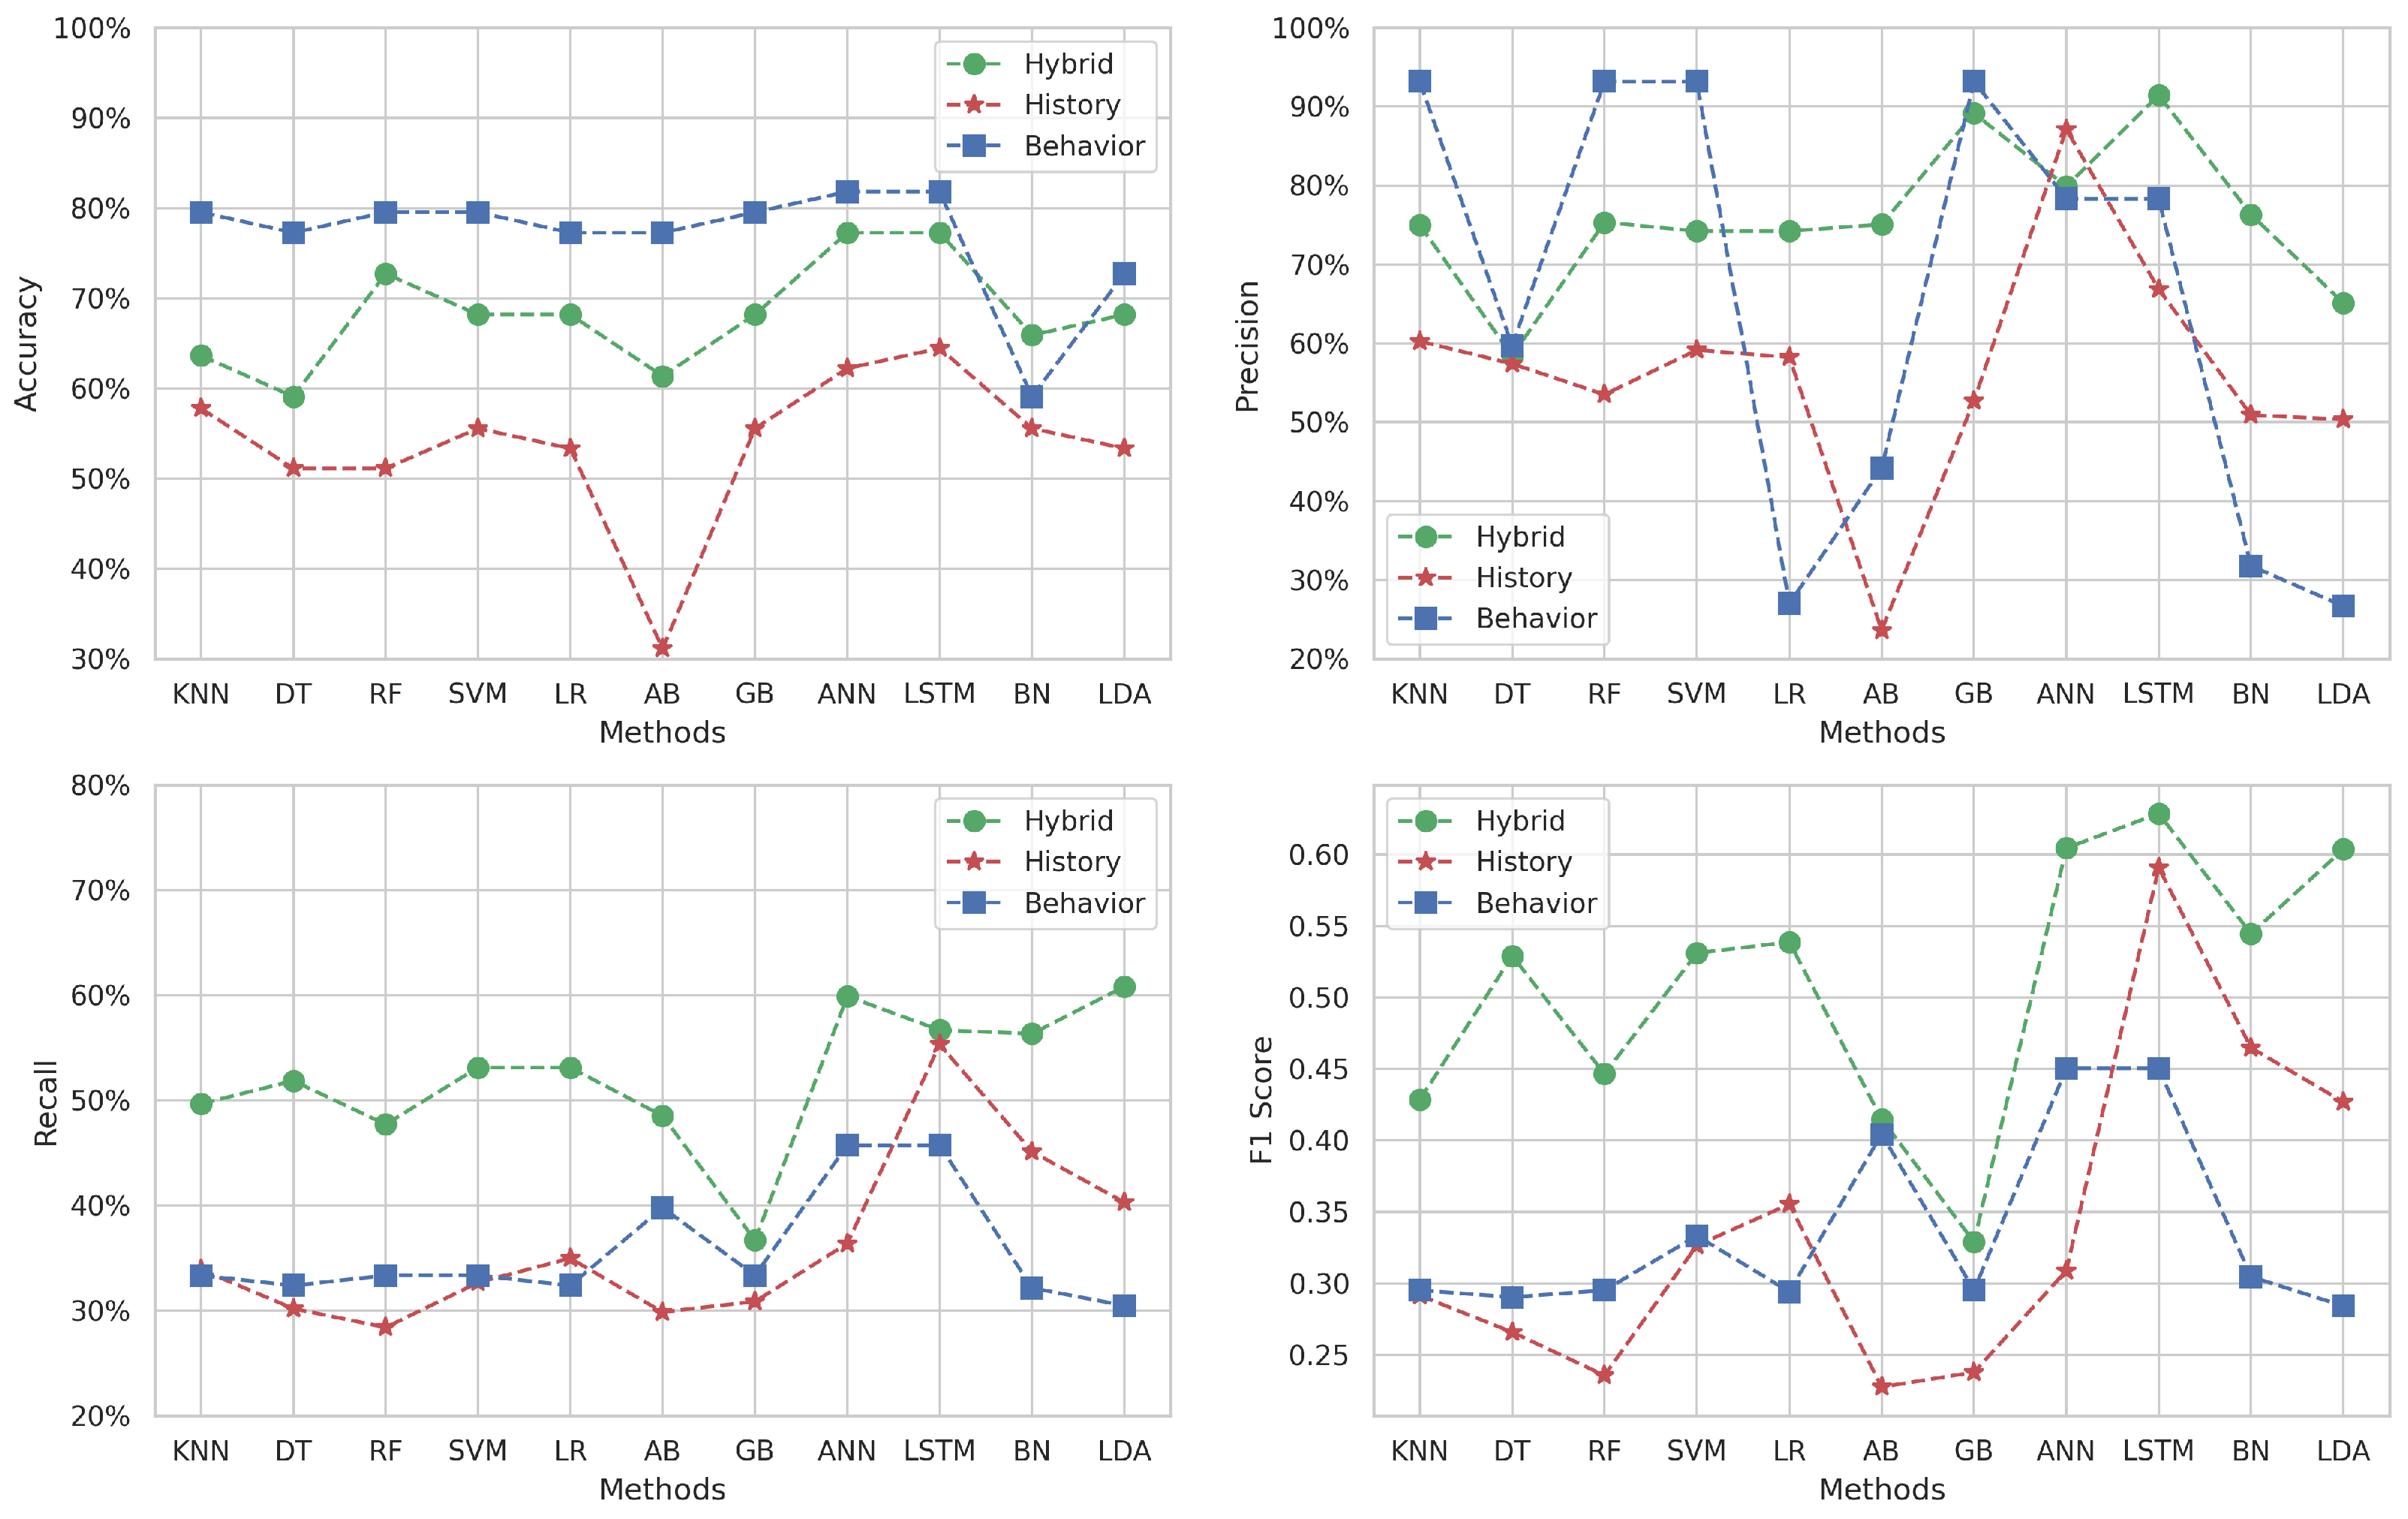
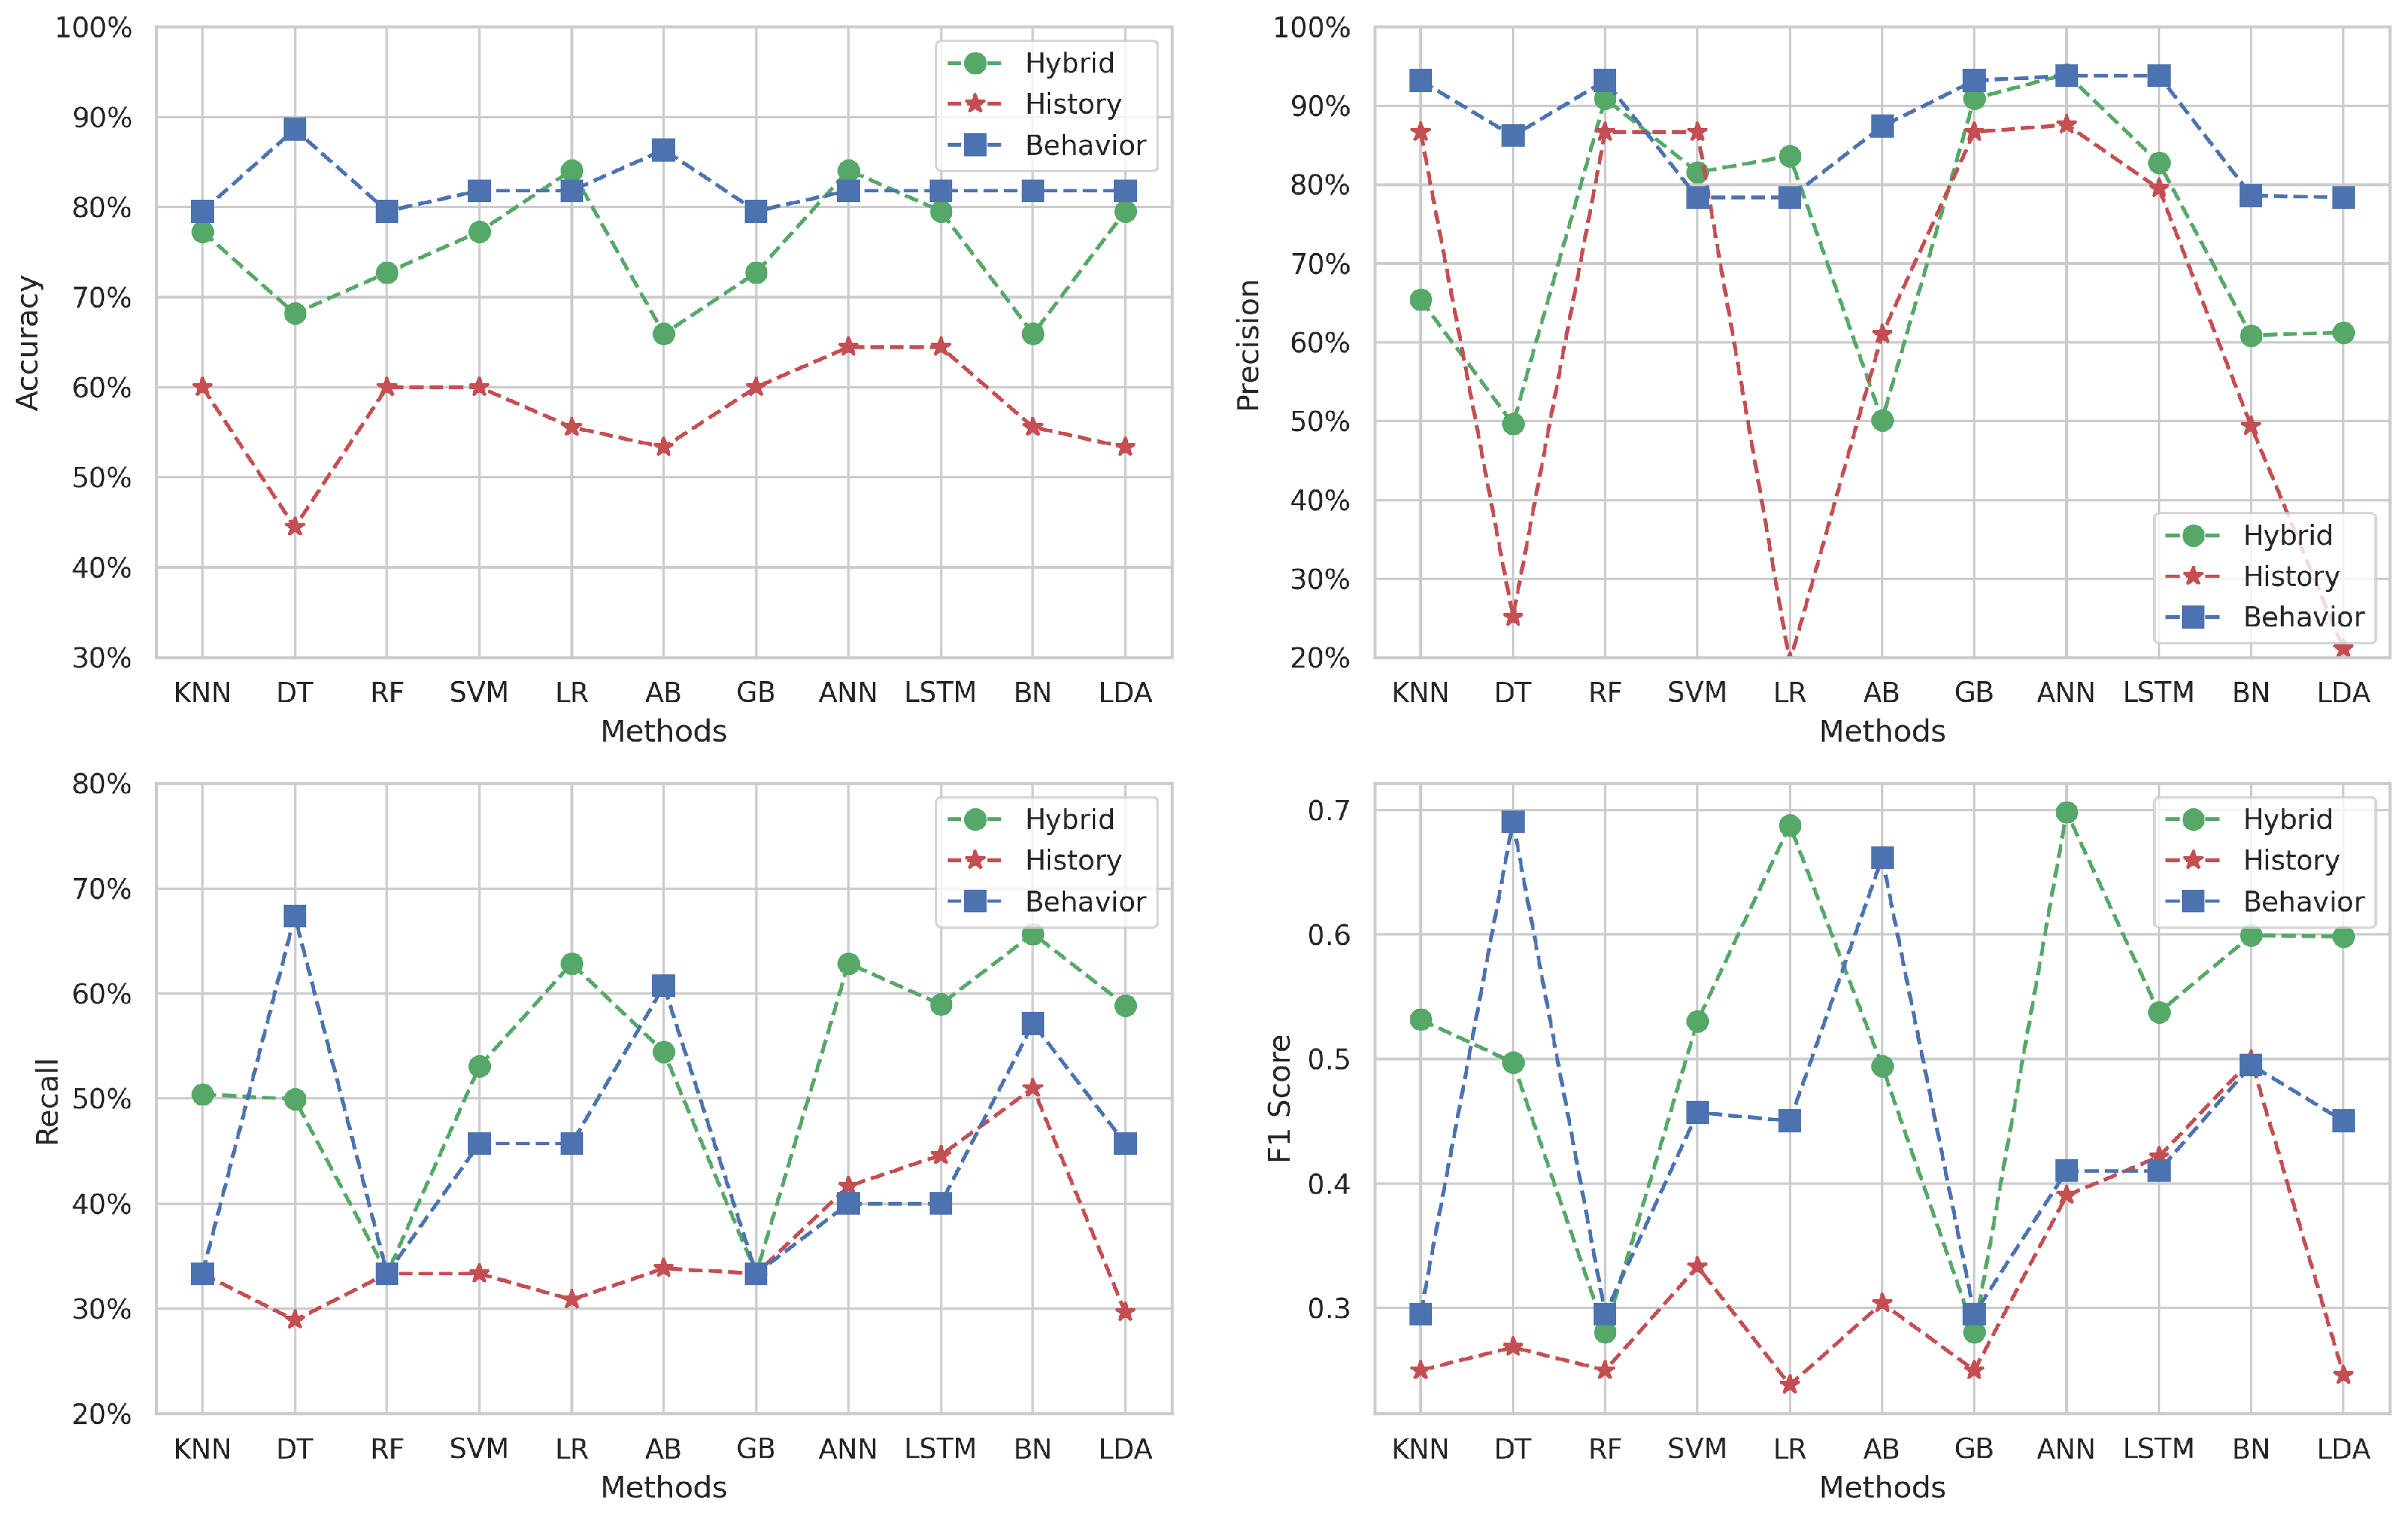
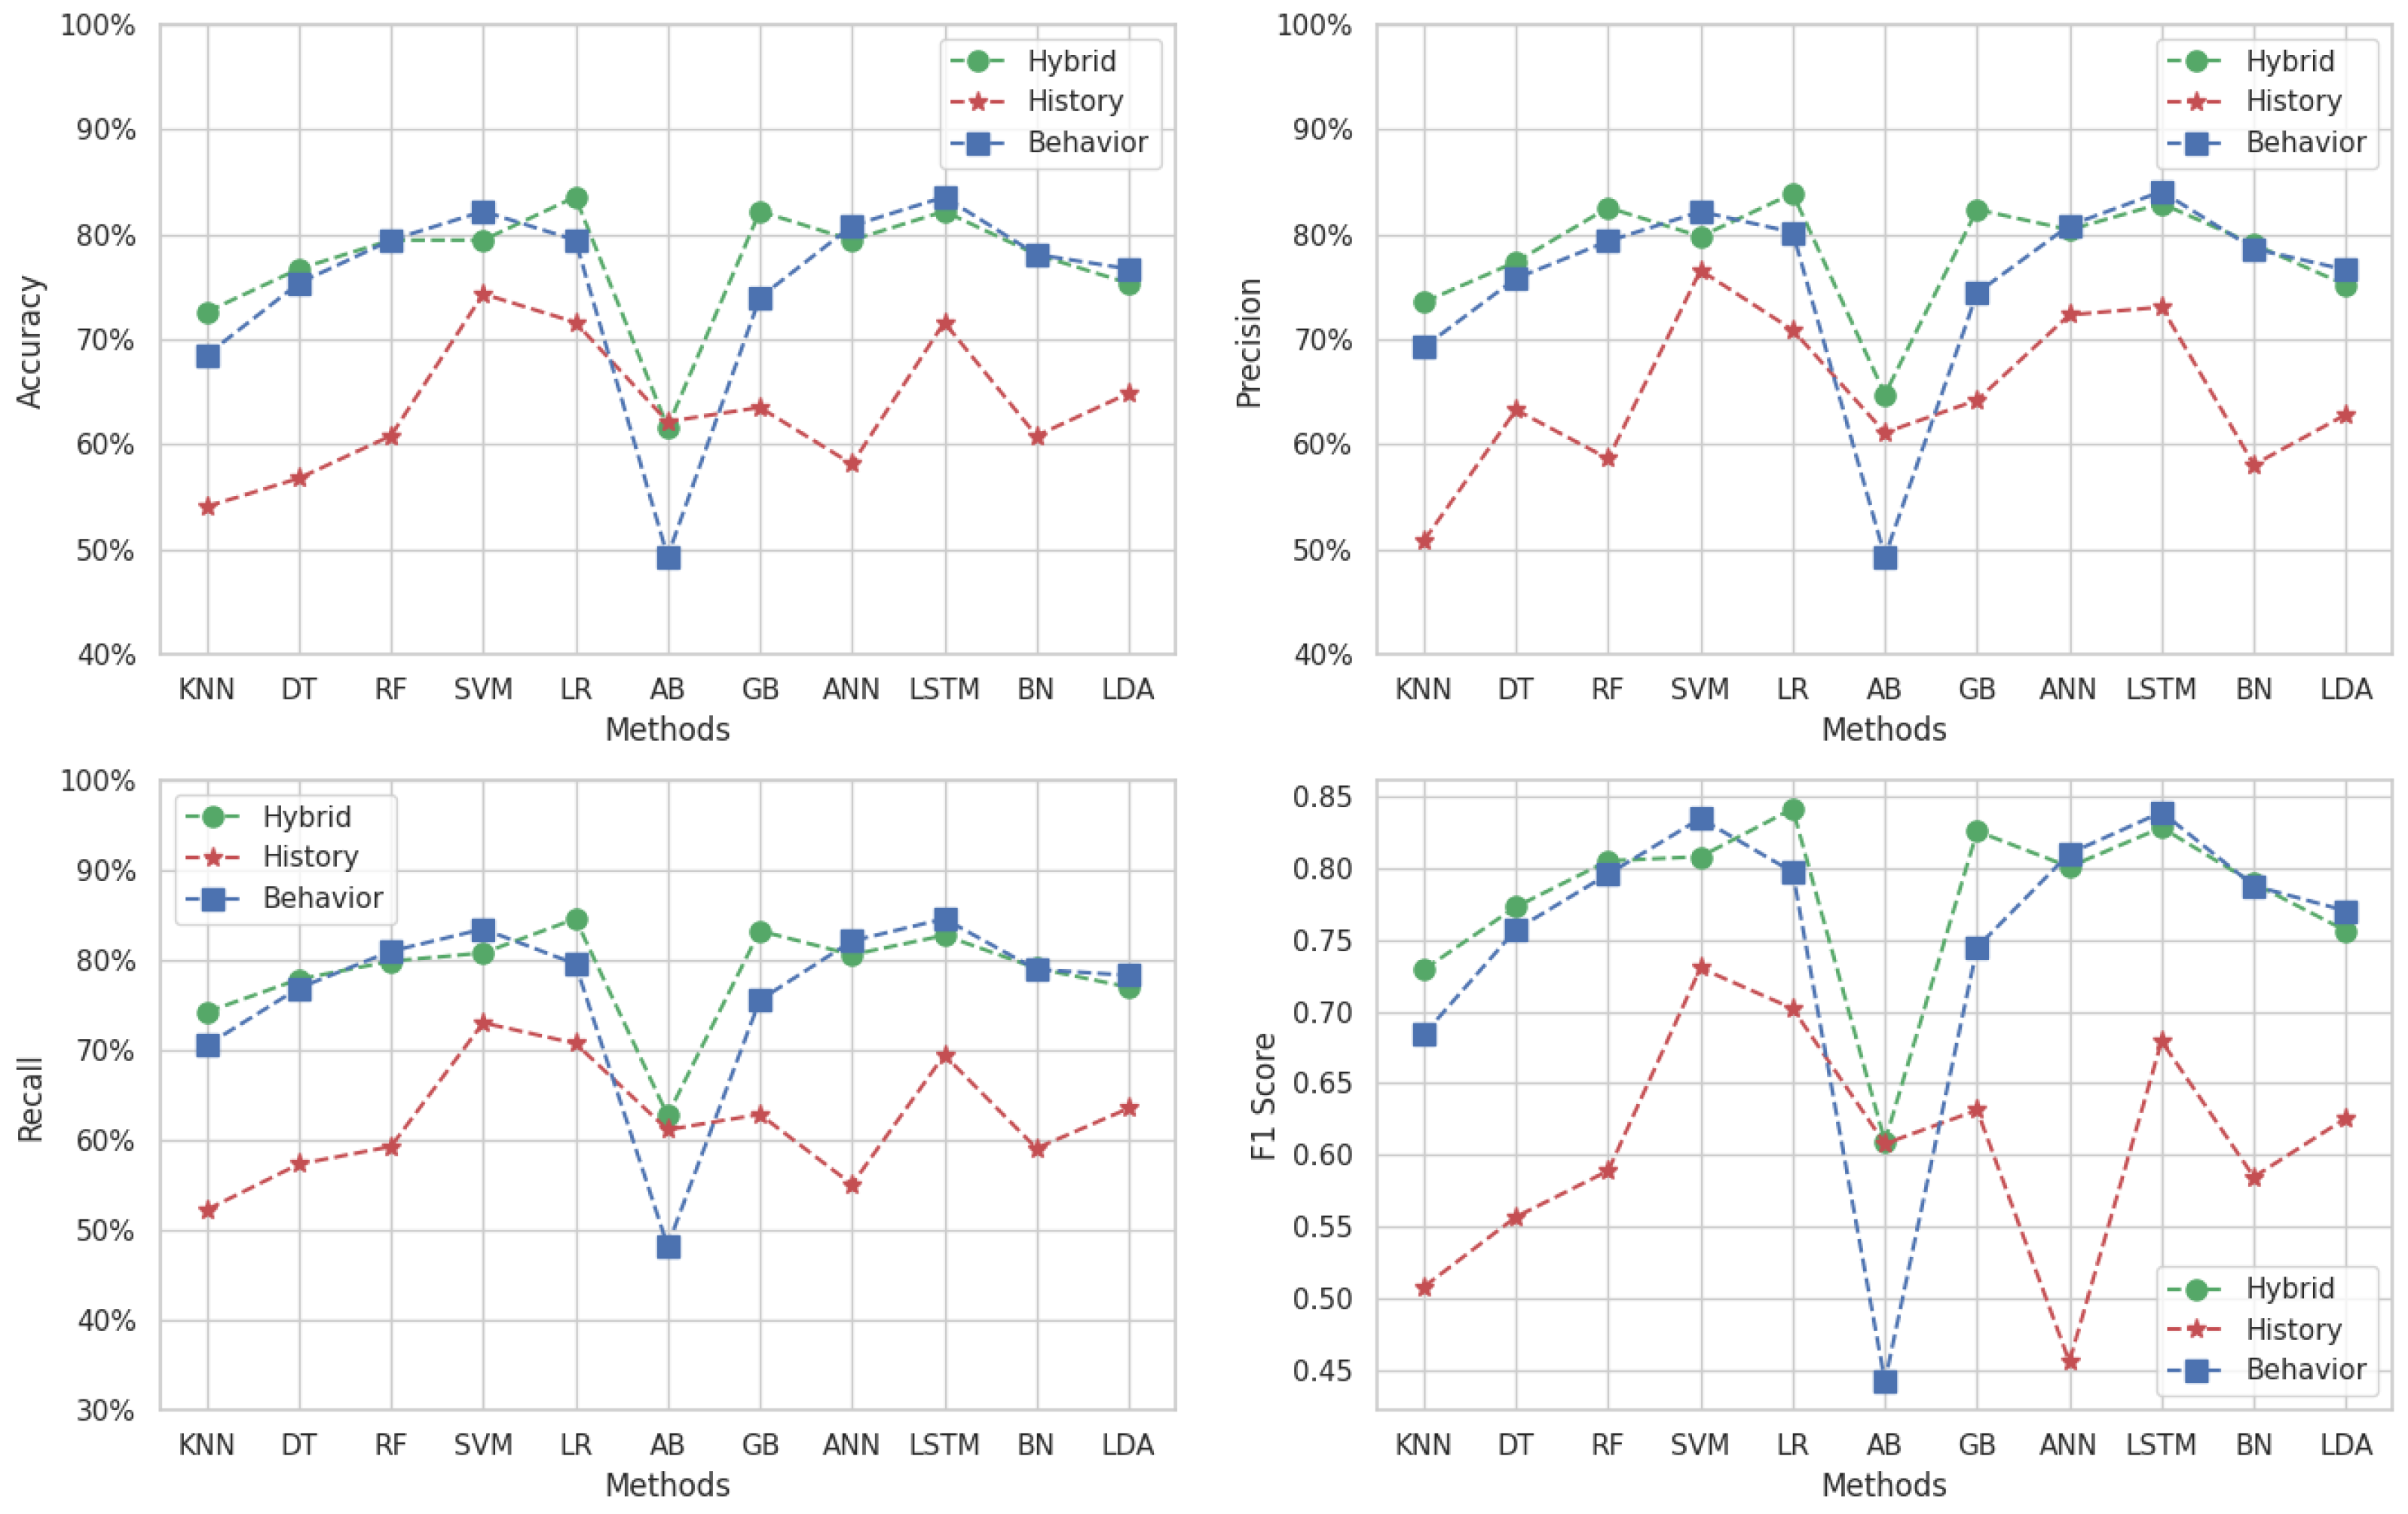
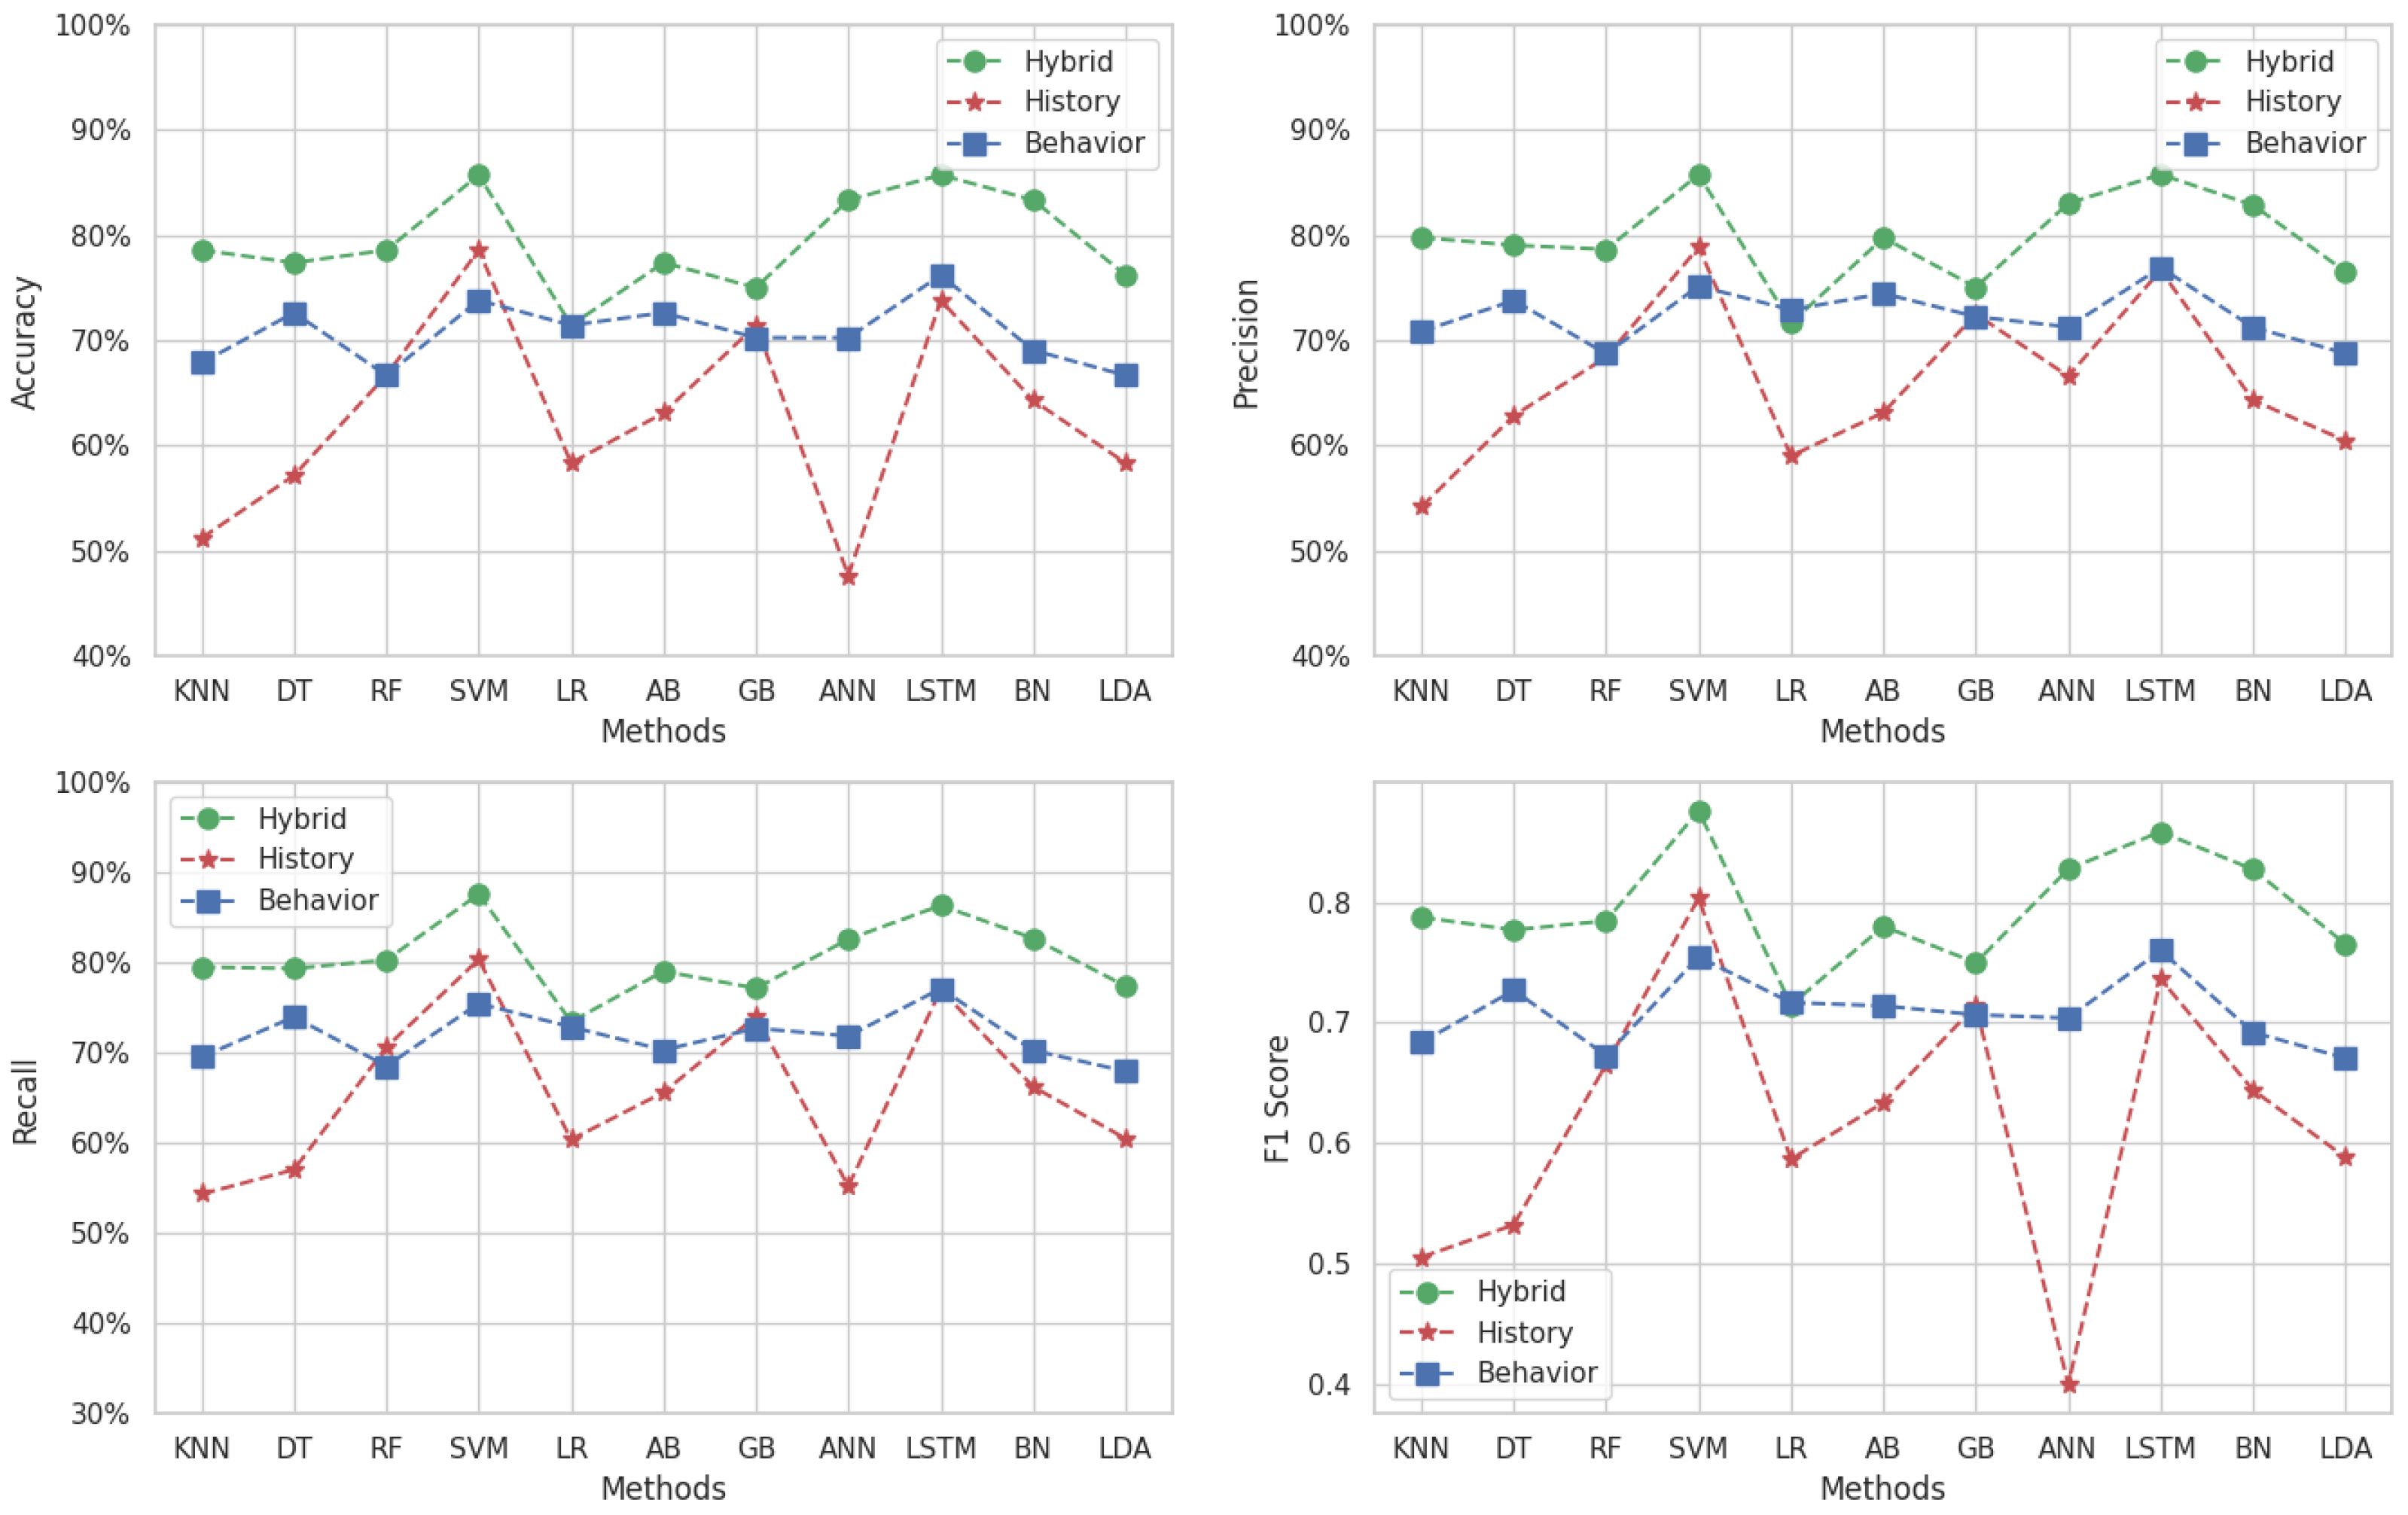
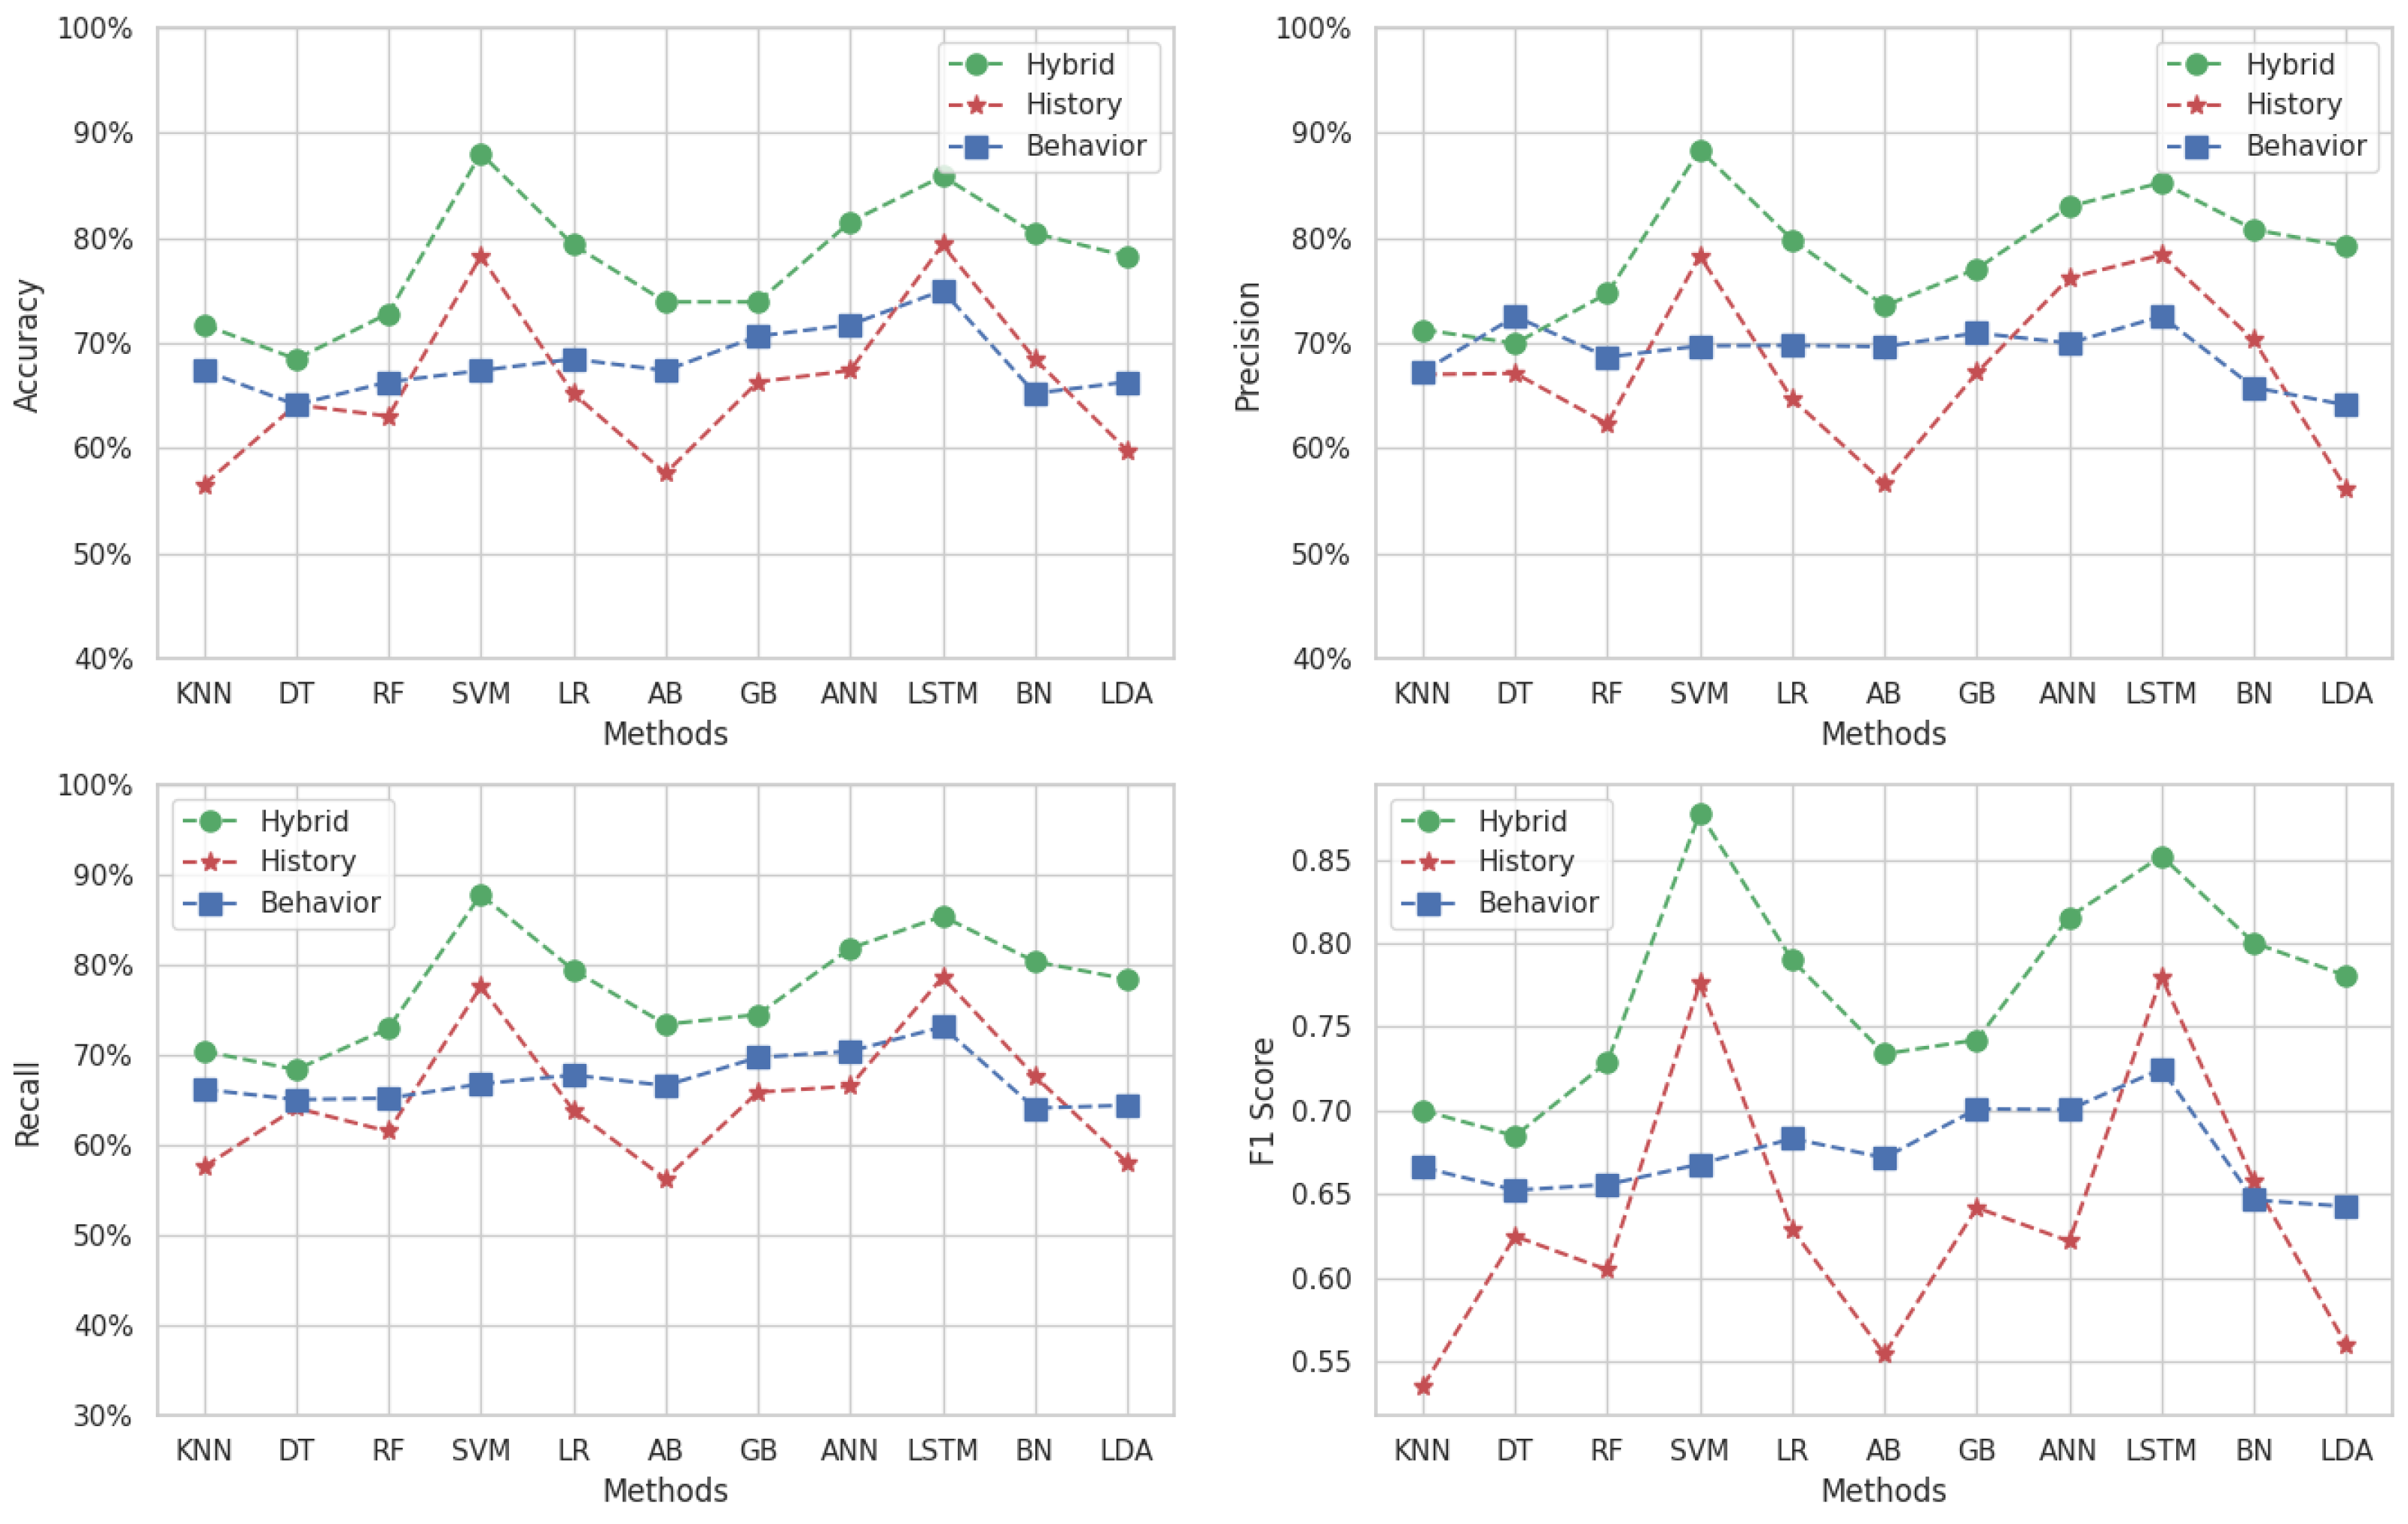
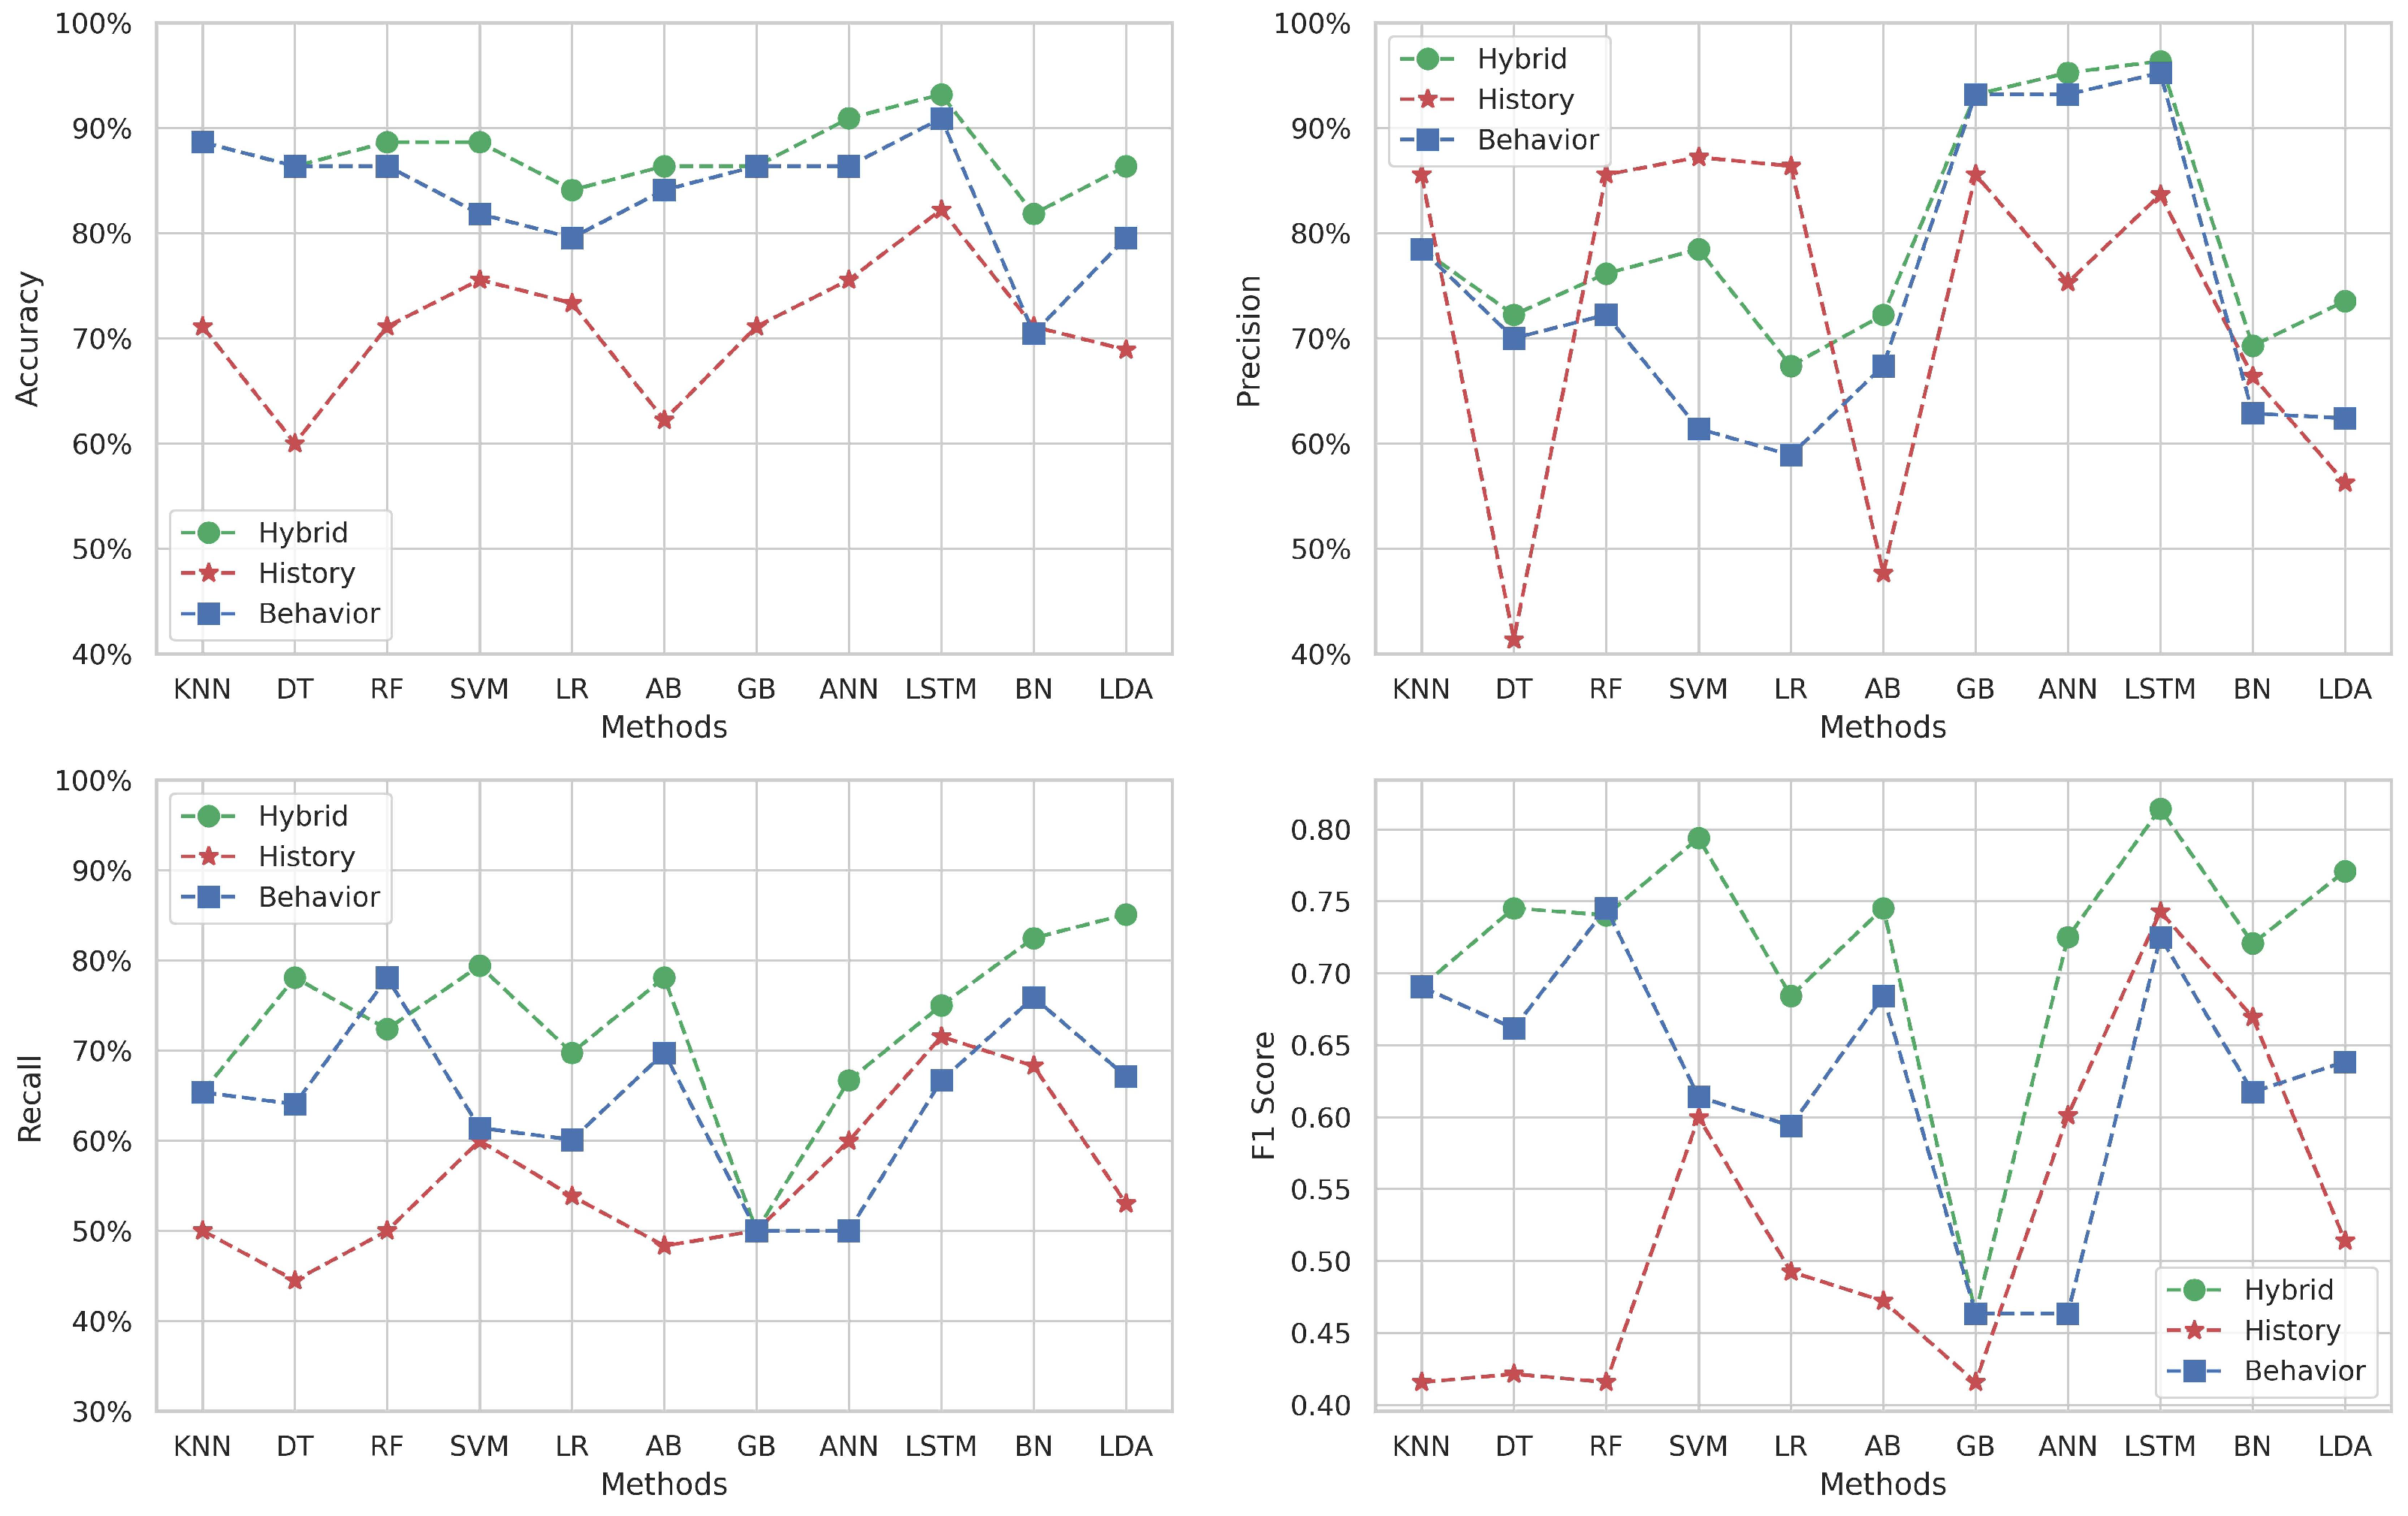
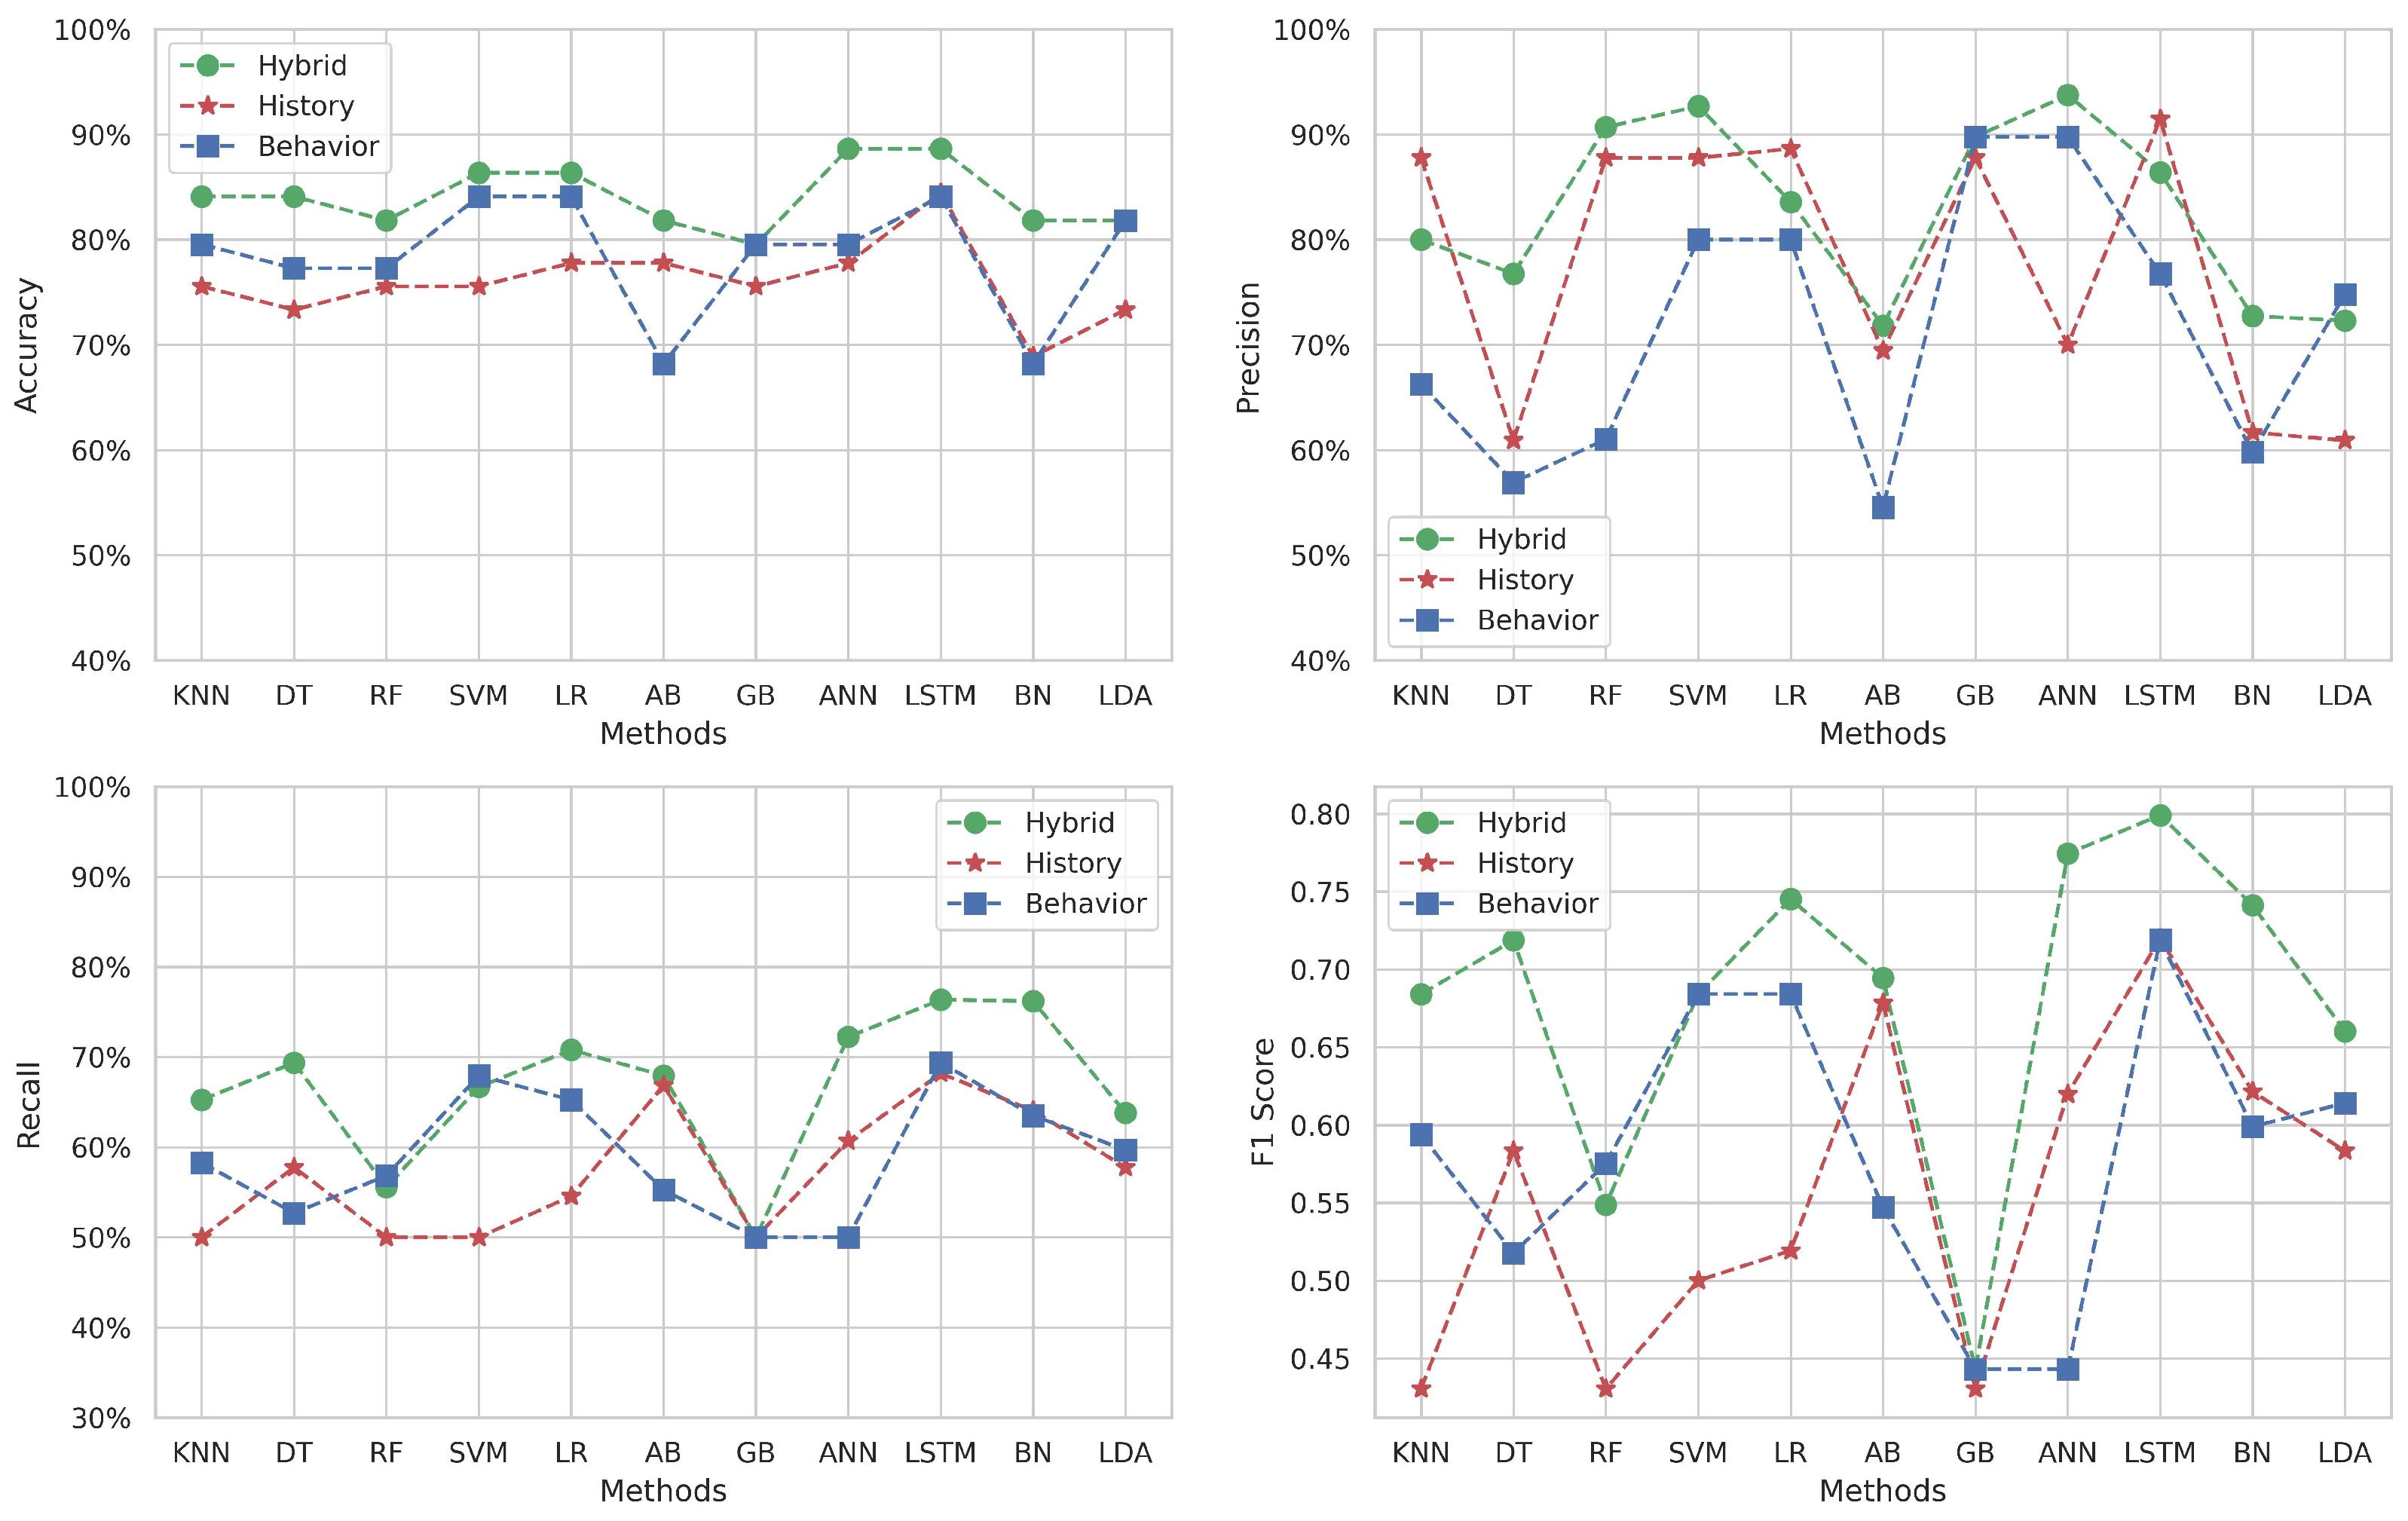
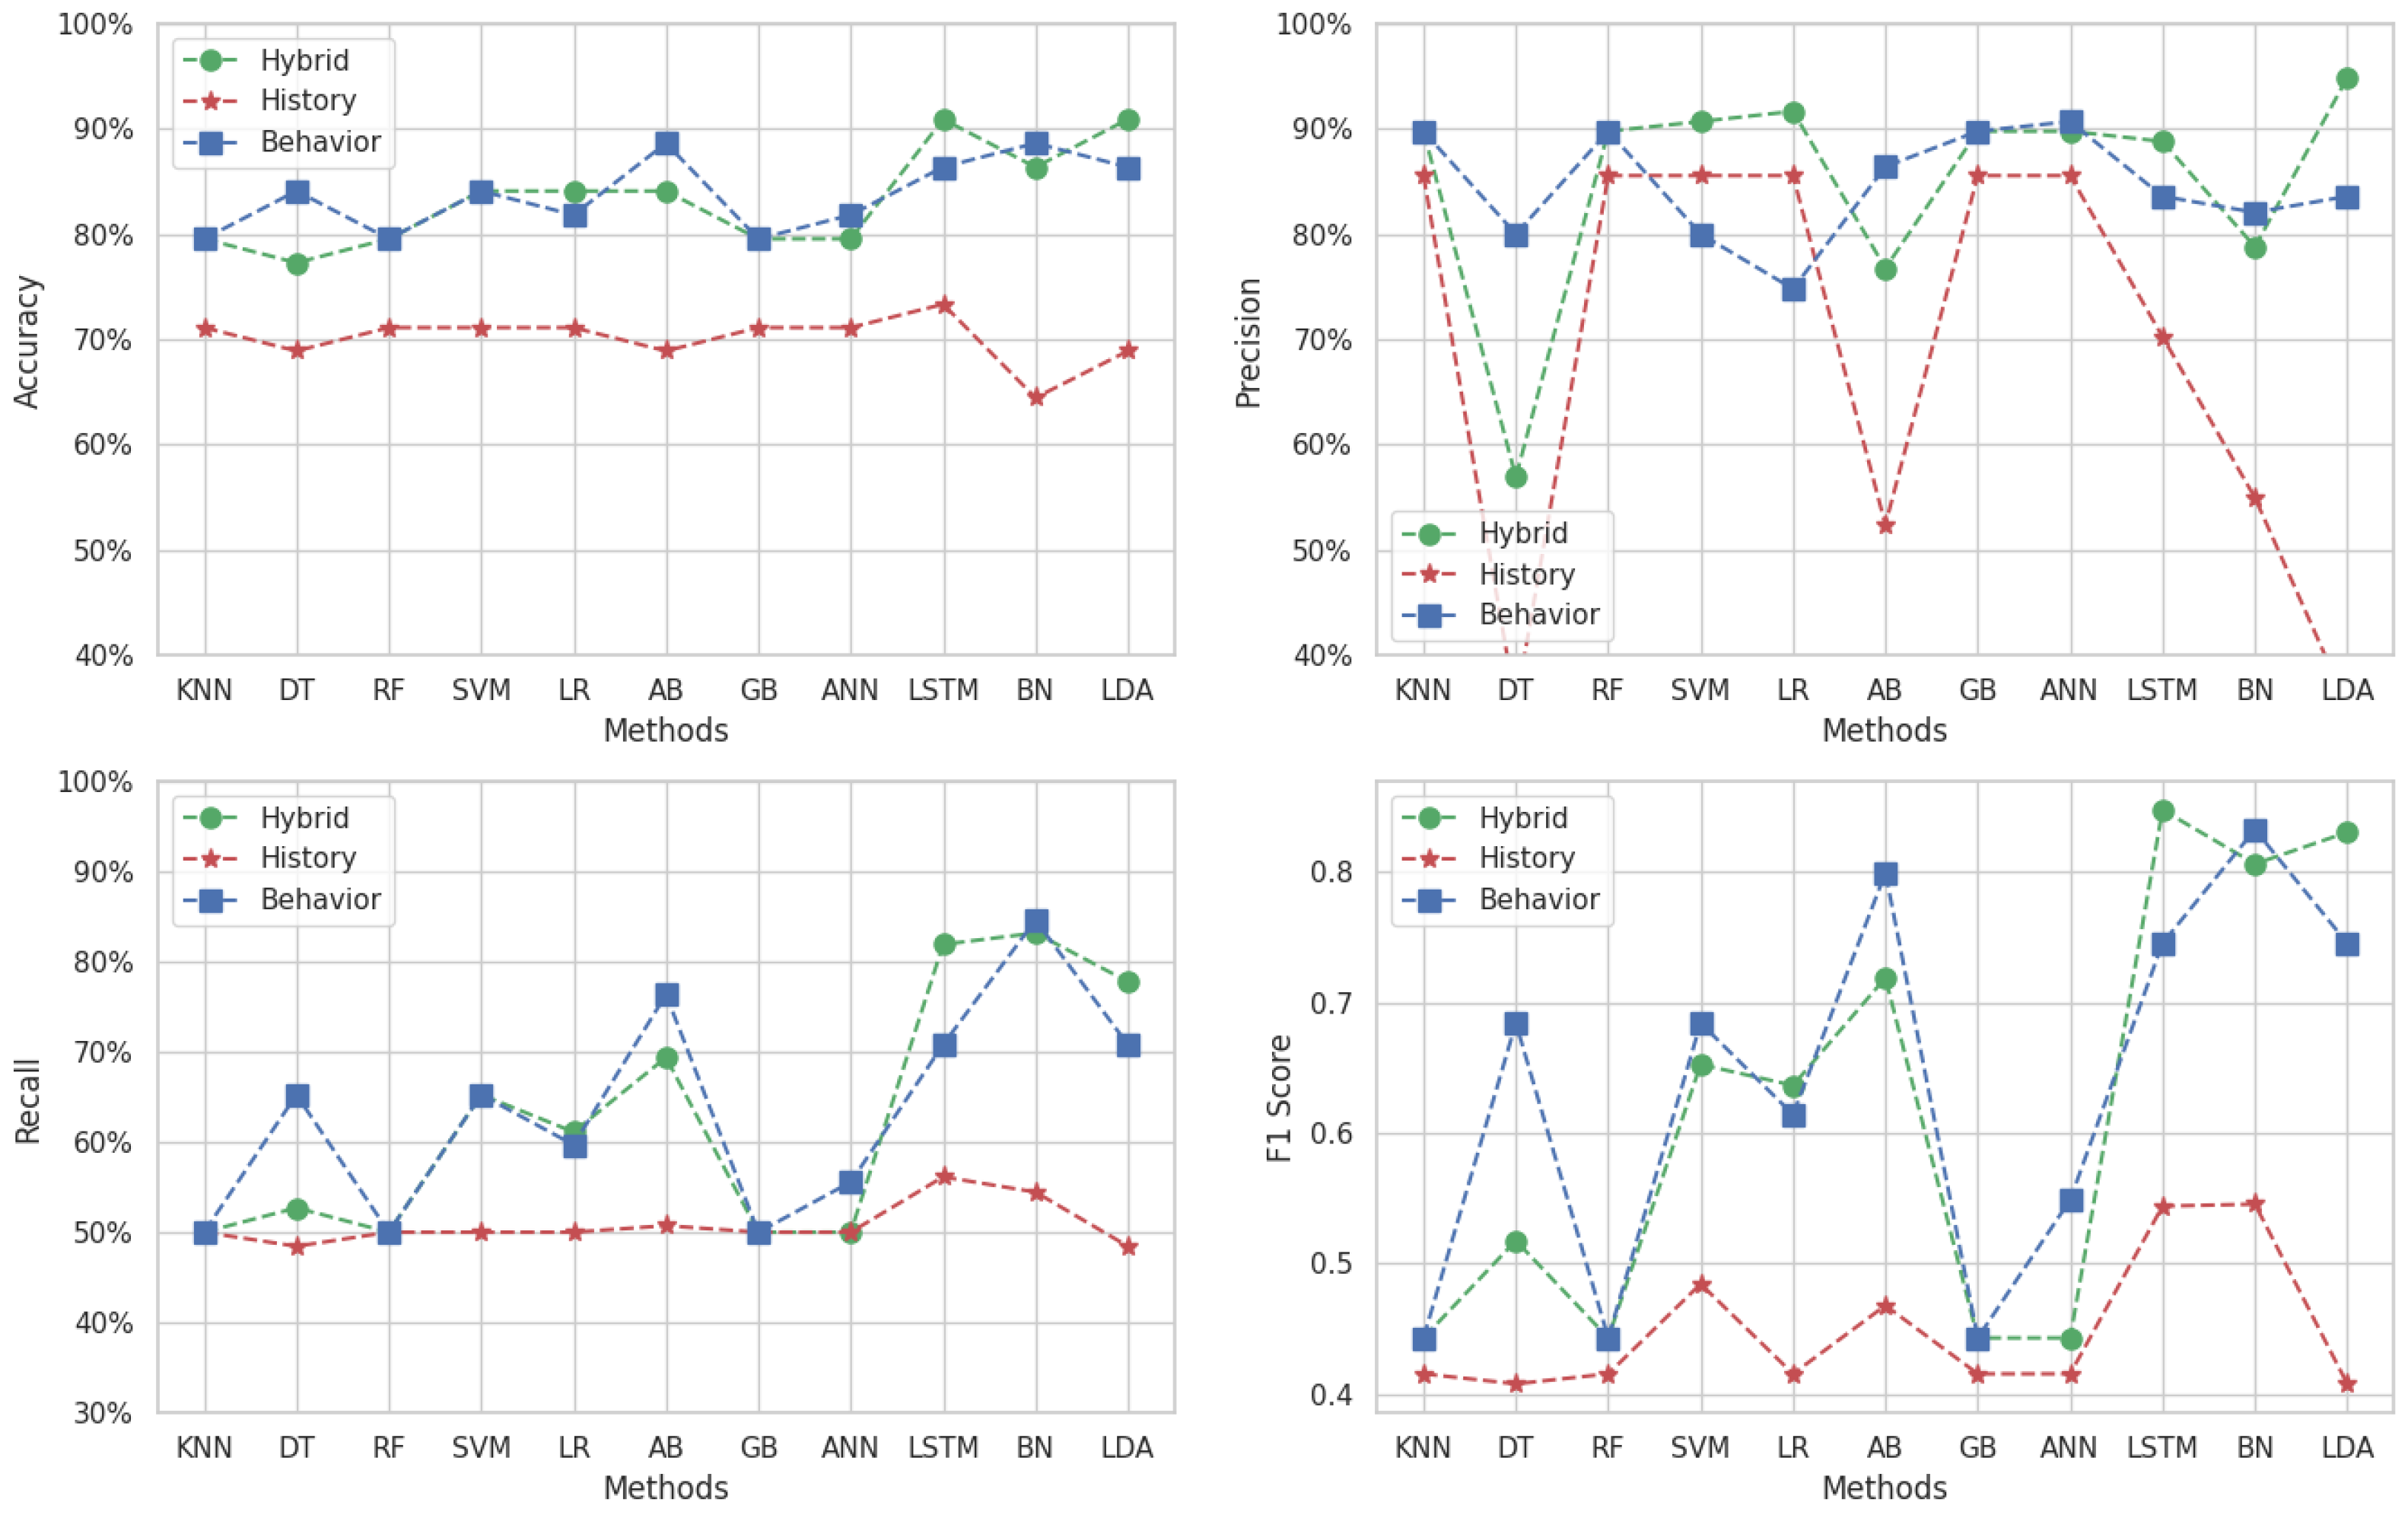
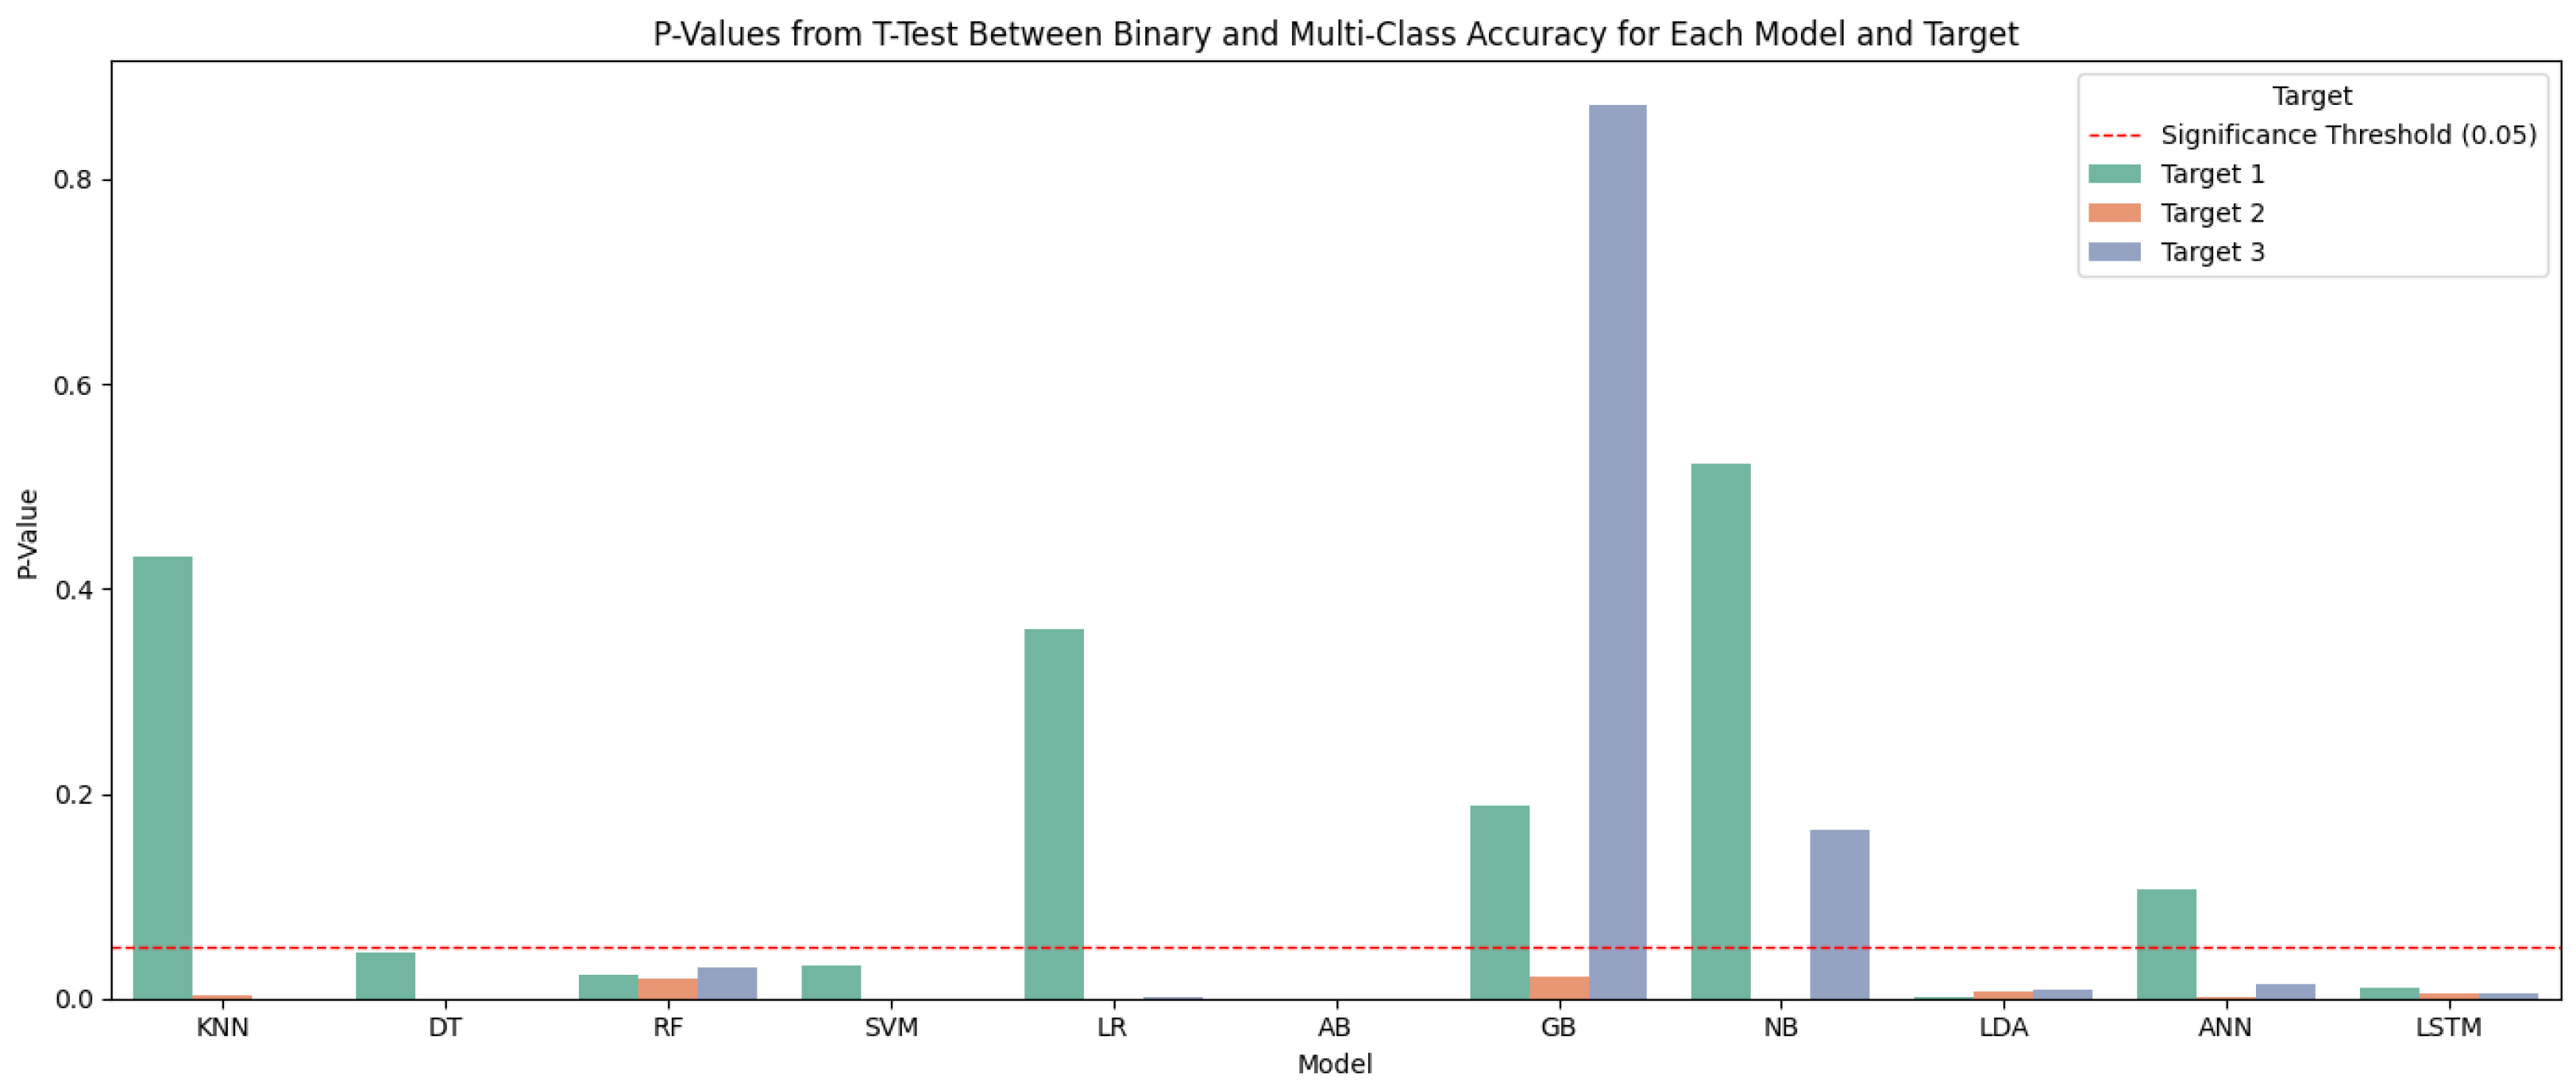
Disclaimer/Publisher’s Note: The statements, opinions and data contained in all publications are solely those of the individual author(s) and contributor(s) and not of MDPI and/or the editor(s). MDPI and/or the editor(s) disclaim responsibility for any injury to people or property resulting from any ideas, methods, instructions or products referred to in the content. |
© 2025 by the authors. Licensee MDPI, Basel, Switzerland. This article is an open access article distributed under the terms and conditions of the Creative Commons Attribution (CC BY) license (https://creativecommons.org/licenses/by/4.0/).