Article

Modelling Systems with a Finite-Capacity Queue: A Theoretical Investigation into the Design and Operation of Real Systems

Doctoral School of Transport, National University of Science and Technology “Politehnica” Bucharest, Splaiul Independentei 313, 060042 Bucharest, Romania
*
Author to whom correspondence should be addressed.
AppliedMath 2025, 5(1), 17; https://doi.org/10.3390/appliedmath5010017
Submission received: 6 January 2025 / Revised: 22 January 2025 / Accepted: 7 February 2025 / Published: 13 February 2025

Abstract

:
This study investigates M/M/n:(m/FIFO) systems with a limited queue capacity (incorporating both “waiting and rejection”). This category of systems can be considered to be mixed-service systems. They operate as queuing systems for customers admitted to the system awaiting service, as well as systems that implement rejection or loss for customers who are denied when the system is full (when all servers and the buffer capacity are occupied). The correlation between the system size and a set of performance measures is analysed for the given arrival and service rates. The system size is determined based on a threshold rate of rejected customers. The correlation between the buffer size and the utilisation factor has direct relevance in the design of real systems (e.g., when the dynamics of the arrival rate can be estimated, it provides a solution for phasing the building of physical waiting places for a specific service capacity). In addition, the analysis of customer rejection probability and average waiting time as a function of the effective utilisation factor could yield practical insights for designing and operating real systems. The second part of this study presents a model for optimising the size of a multi-server system with a finite queue capacity. Initially, the number of servers is determined, assuming that the existing situation does not allow for an increase in the buffer capacity. Then, the case in which both server and buffer capacities become decision variables is presented. The operating losses (which are more straightforward to measure than the related costs) are used as an optimisation criterion.

1. Introduction

The queuing theory, a stochastic modelling element, has become autonomous over the period of more than a century since its emergence [1,2,3]. It was developed as a distinct field of stochastic modelling, intended to describe and analyse a wide range of real-world phenomena in which complexity transcended deterministic evaluations [4]. Since its first application in the field of telephony, queueing theory has constantly attracted interest in applied sciences [5,6]. New technological developments have generated new questions for all economic sectors (primary, secondary and, especially, tertiary or quaternary) [7]. The search for answers has naturally stimulated research in stochastic modelling. Therefore, we consider that stochastic modelling, in general, and the queuing theory, in particular, are exponents of the interaction between theory and practical applications. The charm of theoretical acquisitions continues to be associated with meanings and valuations in the real world. These justify both the enthusiasm for further research and the popularity of the practical application of the results in various fields (telecommunications, transportation, traffic, source and delivery logistics, information technology, public and commercial services, mass production, electricity production and distribution, military strategy and tactics, entertainment, etc.) [6,8].
Two contradictory interests—researchers pursuing detailed theories and practitioners seeking practical applications of mathematical models—must be recognised and harmonised [9]. Often, a compromise is accepted between a model’s theoretical accuracy and its practical utility. Without awareness of this compromise, risks arise due to unjustified trust in results obtained using unsuitable mathematical models for real systems. In the field of queuing theory, models frequently consider an unlimited queue capacity (i.e., an unlimited number of places for waiting for the service) in the study of real systems, although, in practice, no such systems exist. This research aimed to investigate a system associated with real situations, with a limited number of places for waiting.
The analysis of finite-capacity queuing systems was initiated by Gupta (1995) [10]. For a single-server Markovian system with limited queue length, he introduced the concept of F-policy to control customer admission. The F-policy assumes that customers are denied admission into the system when the system capacity is occupied (both the waiting space and server). During this period, only customers present in the system are served. The subsequent admission of customers is allowed when a threshold “F” of customers remain once the served customers leave the system.
Since then, various models have been developed to control system overload and to reduce customer discomfort [7]. There is already substantial scientific literature on F-policy models for work vacations, during which the server is inactive for customers during specific periods [5]. In this class of queuing systems with processing limitations, due to server idleness, vacations are initialised and the service is stopped or performed at a slower rate. The goal of the working vacation policy is to reduce resource consumption [11], e.g., to diminish energy consumption, stopping processing machines in a production line in the case of fewer workloads (during vacation, the workloads are accumulated in the buffer until the service demand rate has values that determine that processing is occurring at the average designed or standardised service rate [5,12]).
Due to the complexity of modelling finite-capacity queuing systems, most studies consider single-server systems. The problem of multi-server queuing models with finite capacity is insufficiently studied [6,7]. Generally, special conditions are analysed in systems with additional removable servers [13,14,15]. System performance is analysed for cases in which supplementary servers are introduced into (or removed from) service depending on the arrival rate. The adjustment of service in a multiple-server system with finite capacity is also analysed using the concept of service switches, where the service rate can be regulated at three levels (slow, medium, and fast rates) depending on the number of customers in the system [16].
This study re-examines the structure and performance of an elementary traffic system (or elementary queuing system, EQS) with identical parallel multi-servers and a limited number of places for waiting for the service with negative exponential distributions for arrival and service rates. The system proposed for analysis, despite offering applications in different fields, is mainly motivated by numerous representations of real phenomena in transportation systems, which require practical solutions. The system’s structure is determined by the design decisions regarding the number of servers (n) and the number of places for waiting for the service (or buffer capacity, m). This research aimed to emphasise the importance of the correlation between the two parameters, n and m. The effects of this correlation on the system’s performance are presented based on physical (or technological) and economic measures.
The first part of this study examines physical measures associated with the system performance: the probability of customer rejection, the average waiting time or the total transit time (waiting and service time), the harmonisation of the idle time of servers, and the waiting time. Nevertheless, we do not give a result for optimal system design and generally allow for a comparison with a threshold established in advance (mainly based on subjective estimations). In contrast, by using economic indicators, an optimality criterion can be defined. Therefore, the second part of this study presents a model for optimising the size of the multi-server system with a finite-capacity queue. The goal is to find the extreme of an objective function expressed in terms of costs. Nevertheless, sometimes, it is difficult or even impossible to define such a value function when the demands for service are from people (clients, passengers, spectators, and patients, among others).

2. Assessment of Physical Performance

2.1. System Characteristics

The analysed EQS consists of a generator of customers, G; a finite-capacity buffer, W; and a set of identical parallel servers, Sv (Figure 1).
The system structure (depicted in Figure 1) differs from those frequently used in introductory studies into queuing systems, considering a finite-capacity buffer, W. Consequently, from the total arrival rate, λ, only a rate of λ − Δ is accepted in the system for service. The term Δ denotes the rate of customers rejected from the system (if all servers are busy and previously admitted customers occupy all places in W). Suppose arrival and service correspond to negative exponential distributions and the service discipline is FIFO (First In–First Out). In that case, the system in Figure 1 is M/M/n:(m/FIFO) according to the Kendall–Lee classification method. The system operates as a queuing system with a rate of admitted customers for service λ − Δ and as a system with rejection for a rate of Δ. Therefore, the system could be considered a mixed-service system “with queuing and rejection”. In fact, this is the theoretical representation corresponding to all real systems (no real systems are suitable for study with an unlimited number of places for waiting).
The rejection of a customer is considered a loss without a possible return to the system after a random period. Some studies on finite-capacity queuing systems consider the concept of retrial orbit [17,18,19]. When the system is busy, the arriving customers are allocated to a virtual place called retrial orbit. After a random time, the customers retry the service from the orbit. However, this concept is unsuitable for the problems associated with the processes in transport and traffic systems targeted by this study. Therefore, a rejected customer is considered a loss for the operating system [20,21].
The values of several parameters determine the performance of the considered system structure (Figure 1): λ—arrival rate, μ—service rate, m—number of places waiting for service, and n—number of servers. From this set of parameters, only m and n are decided by the system designer, influencing the system performance (λ is the characteristic of the environment in which the system operates; μ is the characteristic of the equipment that ensures the service; both are relatively stable and predefined). Thus, the system performance is determined by the designer’s decisions regarding the values m and n. As previously stated, this research aimed to assess the effects of the correlation between m and n on the system performance, defined by physical and economic measures. This section discusses the physical measures, such as the probability of customer rejection (with an influence on the system capacity), the average waiting time, and the total transit time (defined as the sum of the waiting and service time).

2.2. Probability of Customer Rejection

The probability of customer rejection, denoted by Pr, represents a characteristic measure in the operation of the finite-capacity queuing system. For a system with given values for the parameters μ, m, and n, the probability of rejection depends on the arrival rate, λ. Only λ − Δ customers are admitted into the system and constitute the flow of served customers. Therefore, λ − Δ constitutes the total system capacity, where Δ represents the rate of rejected customers or losses for system service,
Δ = λ P r .
For a queuing system with unlimited buffer capacity, M/M/n:(∞/FIFO), the total system capacity is
max λ 0 ( 2 ) = lim m λ 0 ( 2 ) ( m ) ,
because there is no customer rejection in the system. For the system with rejection, without a buffer (with no waiting places, m = 0), M/M/n:(0/FIFO), for the same parameters λ, μ, and n, the total system capacity is smaller [22], namely, λ0(1). For the M/M/n:(m/FIFO) system, the variation in total system capacity, λ0(2)(m), is strictly increasing as a function of m (Figure 2; a continuous line shows the values corresponding to discrete values of m).
For purposes specific to each real system, in the performance analysis for a finite-capacity queuing system (with queuing and rejection), it is useful to admit a certain threshold, ∆*, for the customer rejection rate. The value ∆*, subject to
Δ max λ 0 ( 2 ) λ 0 ( 1 ) ,
which leads to the values m* and λ0(2)(m). Then, the number of waiting places, m*, must be found according to the loss ∆*.
The probability of a customer rejection in the system M/M/n:(m/FIFO) is [22]
P r = P m + n = ρ m + n n m n ! P ( 0 ) ,
where ρ is the utilisation factor (ρ = λ/μ) and P(0) is the probability that zero customers are in the system (i.e., all servers are idle):
P ( 0 ) = k = 0 n ρ k k ! + ρ n n ! i = 1 m ρ n i 1 .
For ρ/n ≠ 1, Equation (5) becomes
P ( 0 ) = k = 0 n ρ k k ! + ρ n + 1 n ! 1 ρ n m n ρ 1 .
The probability that a customer is served, Pserv, is
P s e r v = 1 P r .

2.3. System Capacity with Waiting and Rejection

As Figure 1 and Figure 2 show, the total system capacity with m* places of waiting in W, C, is
C = λ Δ ,
where Δ* is the loss caused by the impossibility of admission of all arrivals in W, λ; i.e.,
Δ = λ P r .
Substituting Pr into Equation (9) results in
Δ = λ ρ n + m n ! n m k = 0 n ρ k k ! + ρ n + 1 n ! ( n ρ ) 1 ρ n m 1 .
For the value Δ*, the constraint (3) case ρ/n < 1 leads to
Δ λ 1 k = 0 n 1 ρ k k ! k = 0 n ρ k k ! .
which, for n = 1, becomes
Δ λ 1 1 1 + ρ .
For case ρ/n ≥ 1, the constraint (3) means
Δ n μ λ 1 k = 0 n 1 ρ k k ! k = 0 n ρ k k ! .
Because Δ* depends on the decision on m*, as well as the number of parallel servers, n, and the utilisation factor, ρ, additional limitations must be introduced for the system capacity evaluation.
Considering that the system capacity is a function of λ under any conditions, it seems appropriate to propose a specific minimum value for C, in relation to which the values of m* and ρ are determined. It consists of selecting a particular value for Δ*, defined as Δ* = β λ (according to the constraint (11) or (12)). Based on this value, Δ*, the number of places required in W, m*, is determined by the function of ρ as
m = 1 lg ρ n lg Δ λ k = 0 n ρ k k ! + ρ n + 1 n ! ρ n ρ ρ n n ! 1 + Δ λ ρ n ρ
Figure 3 presents the results for n = 1 and β = 0.1 (meaning Δ*/λ = 0.1, respectively; C = 0.9 λ). To ensure the system capacity λ − Δ, for the same relative decrease Δ = 0.1 λ, the required number of places for waiting, m* (respectively, mw*), increases as the utilisation factor ρ increases. At the same time, for a given mw*, the range of ρ shrinks. The recommended solutions for mw* become increasingly sensitive as the values of ρ increase.
Depending on the relative reduction in the admitted customers, β, the effective utilisation factor of servers in Sv, ρe, is
ρ e = λ Δ μ = λ β λ μ = 1 β ρ .
These cases show the different interpretations and, subsequently, applications that queuing systems can have. They support the development of methods and concepts to analyse more complex and generalised queuing systems.

2.4. Average Waiting Time

For a system M/M/n:(m/FIFO), the average queue length, lq (lqm), is [3,22]
l q = ρ n + 1 n n ! 1 ρ n 2 1 ρ m m m + 1 m ρ n P ( 0 ) ,   for   ρ n 1 ,
and the average waiting time, tw, results in
t w = l q P s e r v λ = l q 1 P r λ .
This research assumes that if there is at least one free place in the queue, then customers can be admitted to the system if the total transit time is assessed as acceptable. The total transit time, tt, is
t t = t w + t s ,
where ts is the average service time (ts = 1/μ).
Therefore, considering that the discomfort of waiting is assessed in relation to the service time [23], the ratio tw/ts = μ·tw, is computed as
μ t w = l q 1 P r ρ .
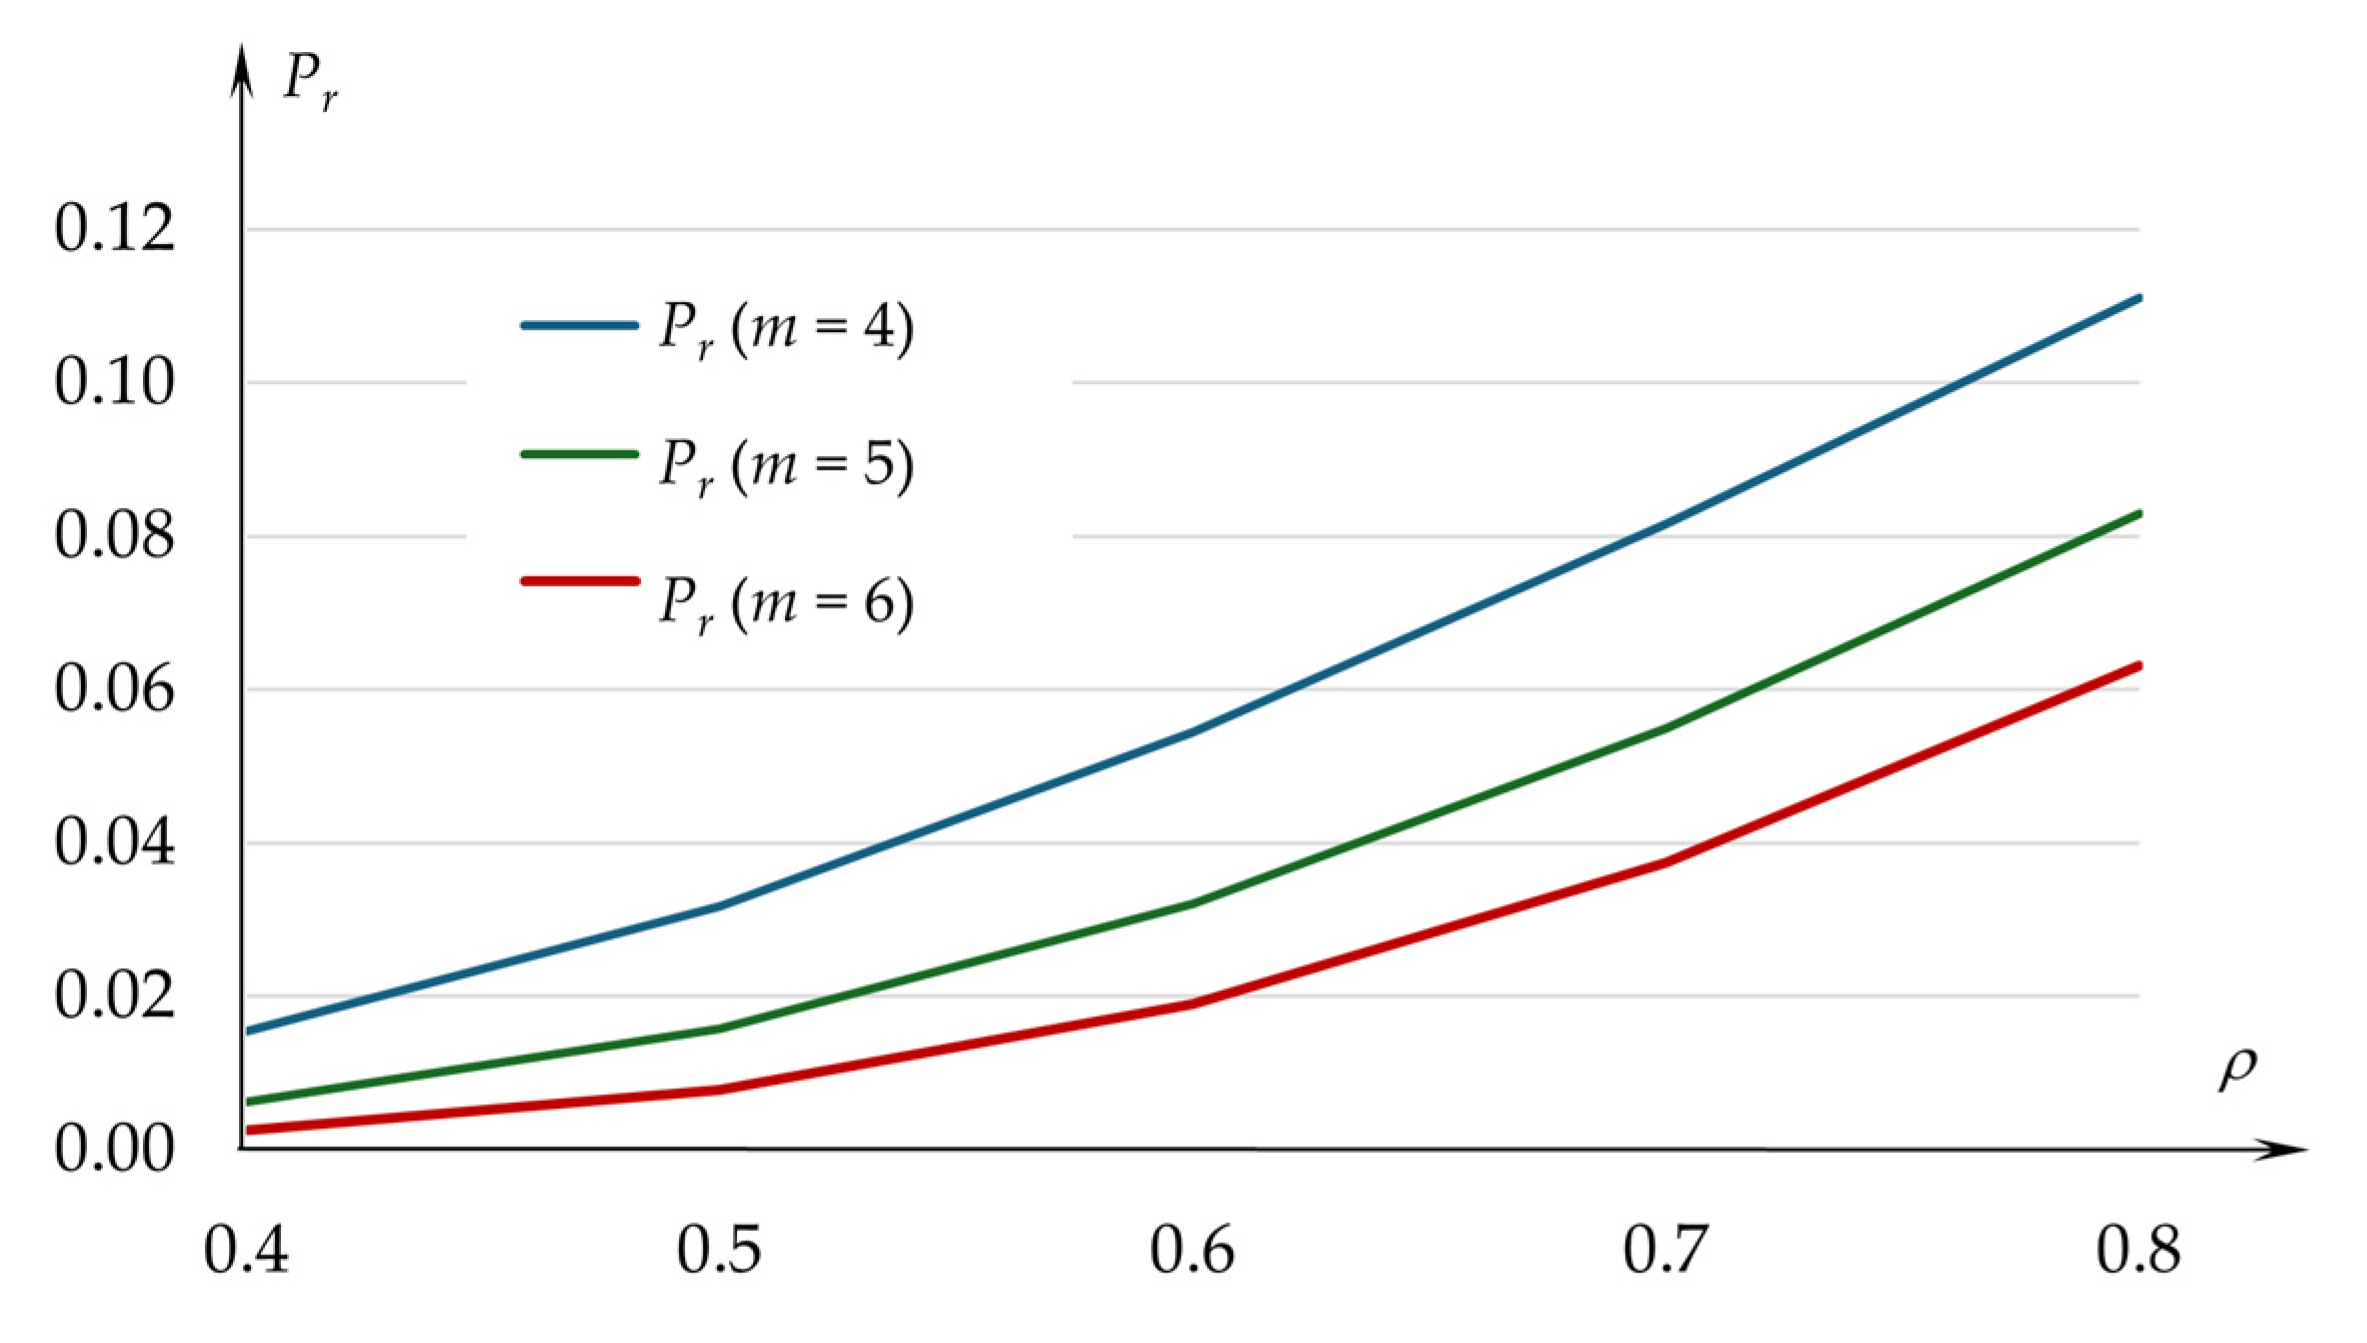
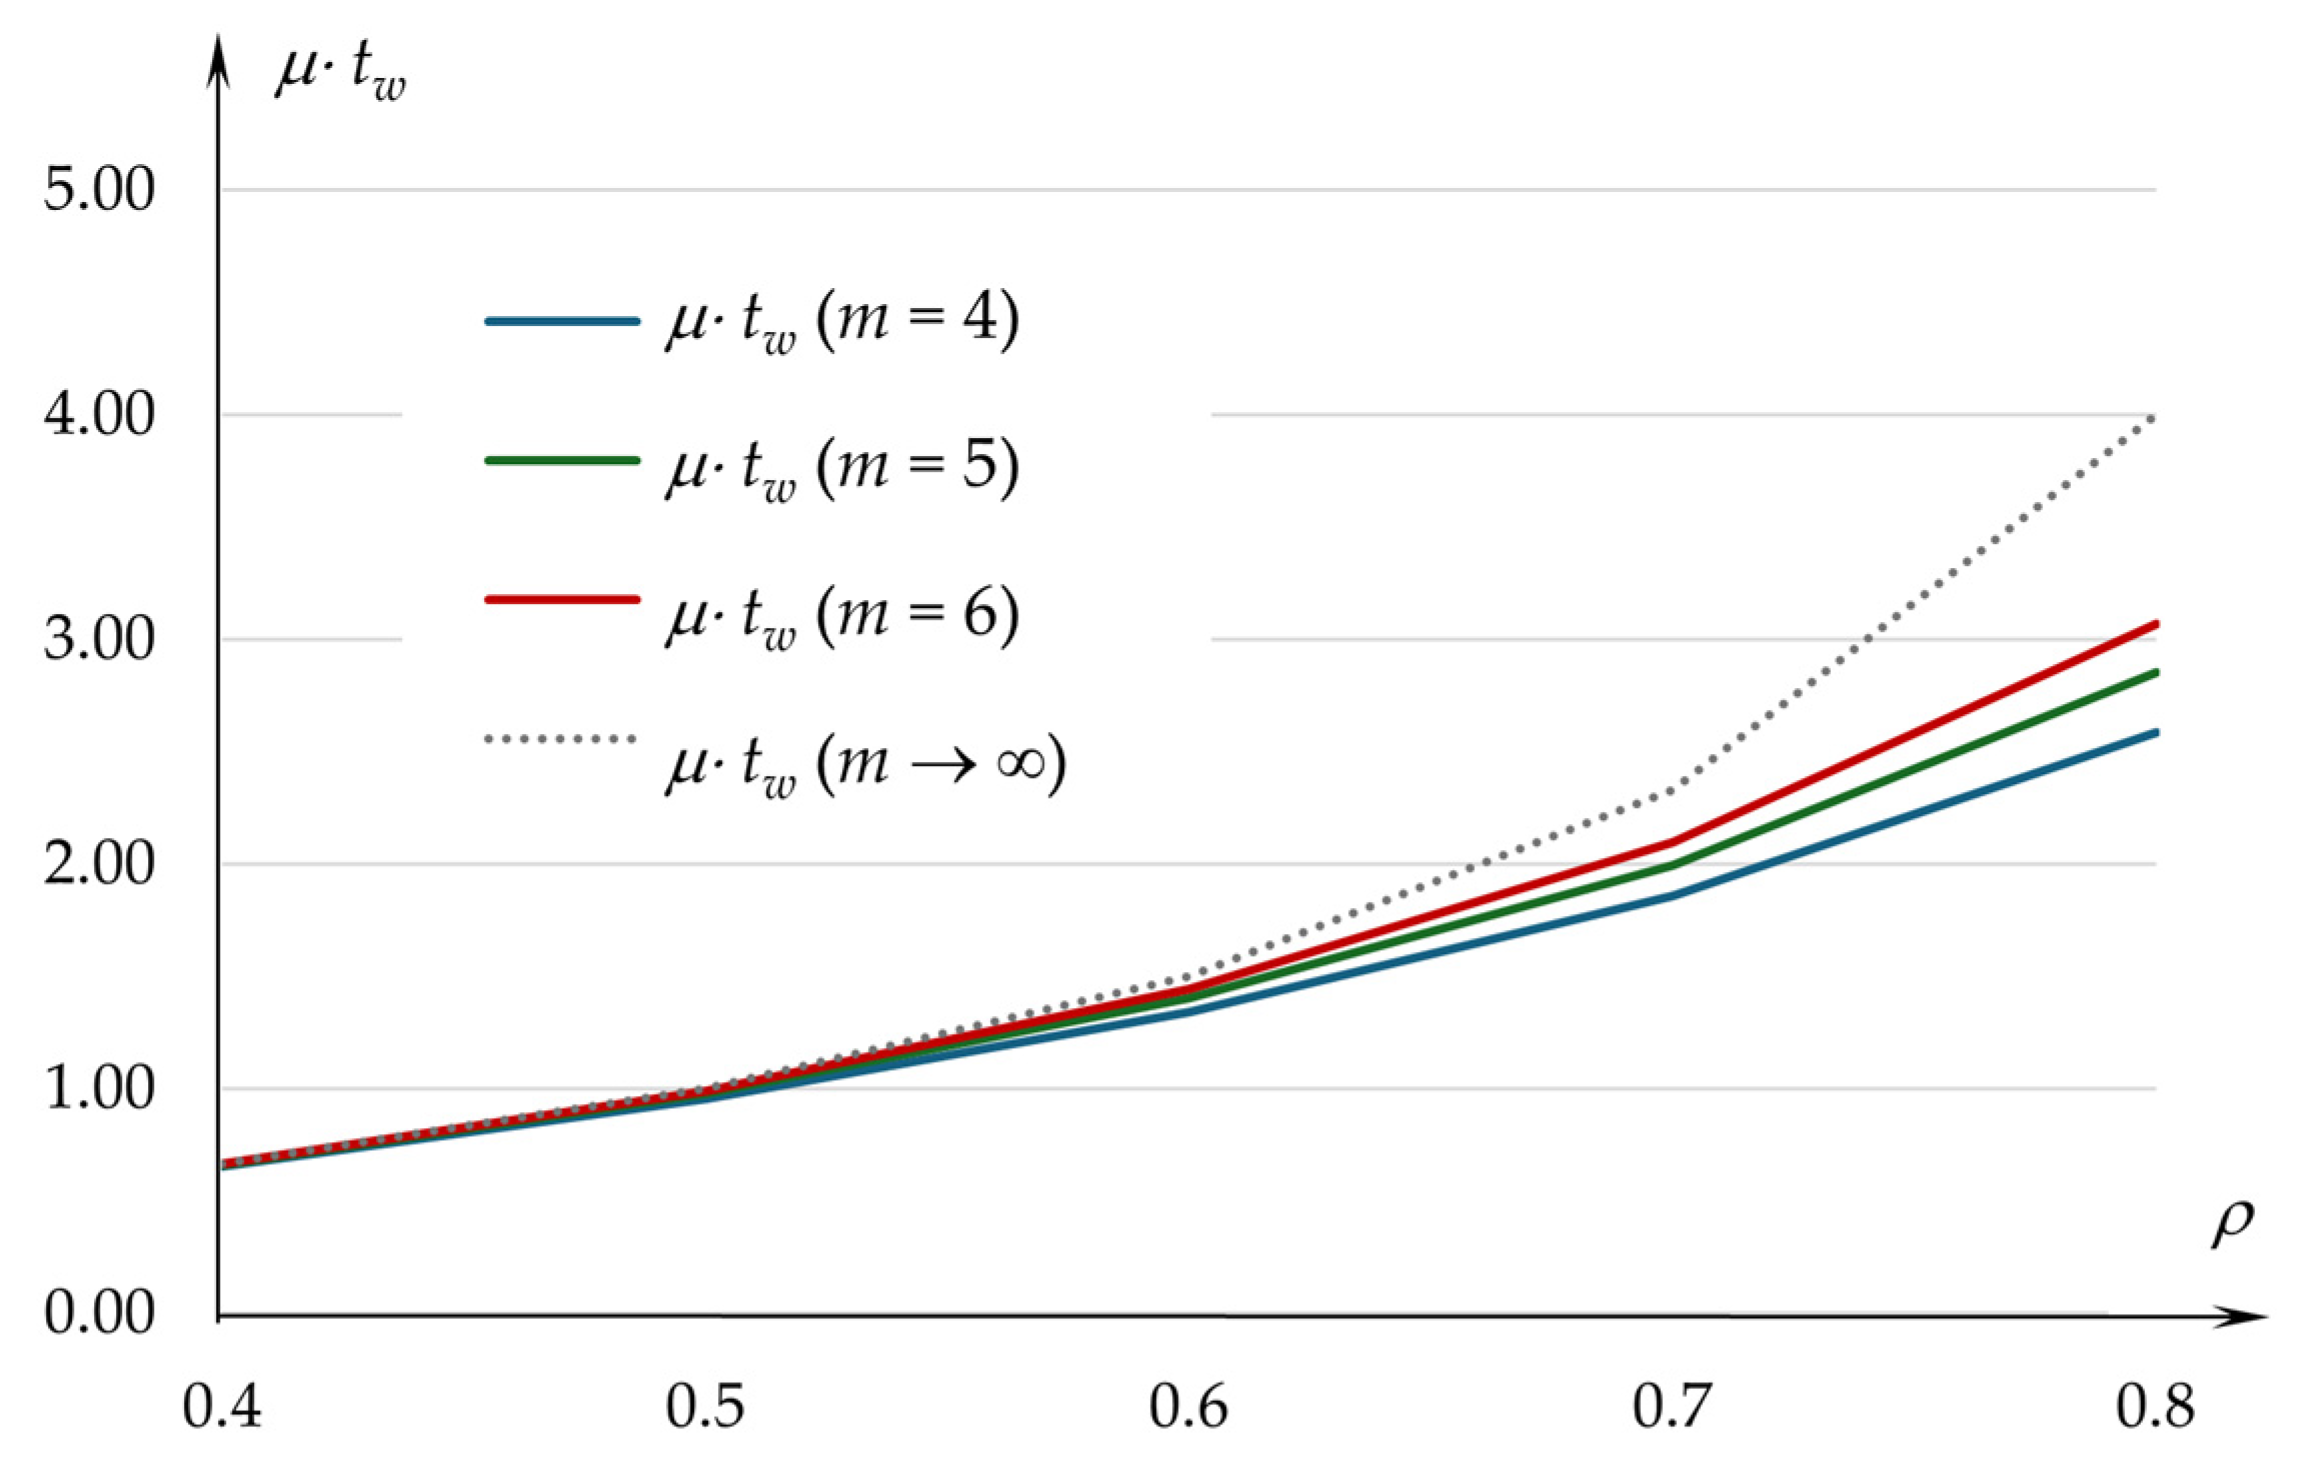
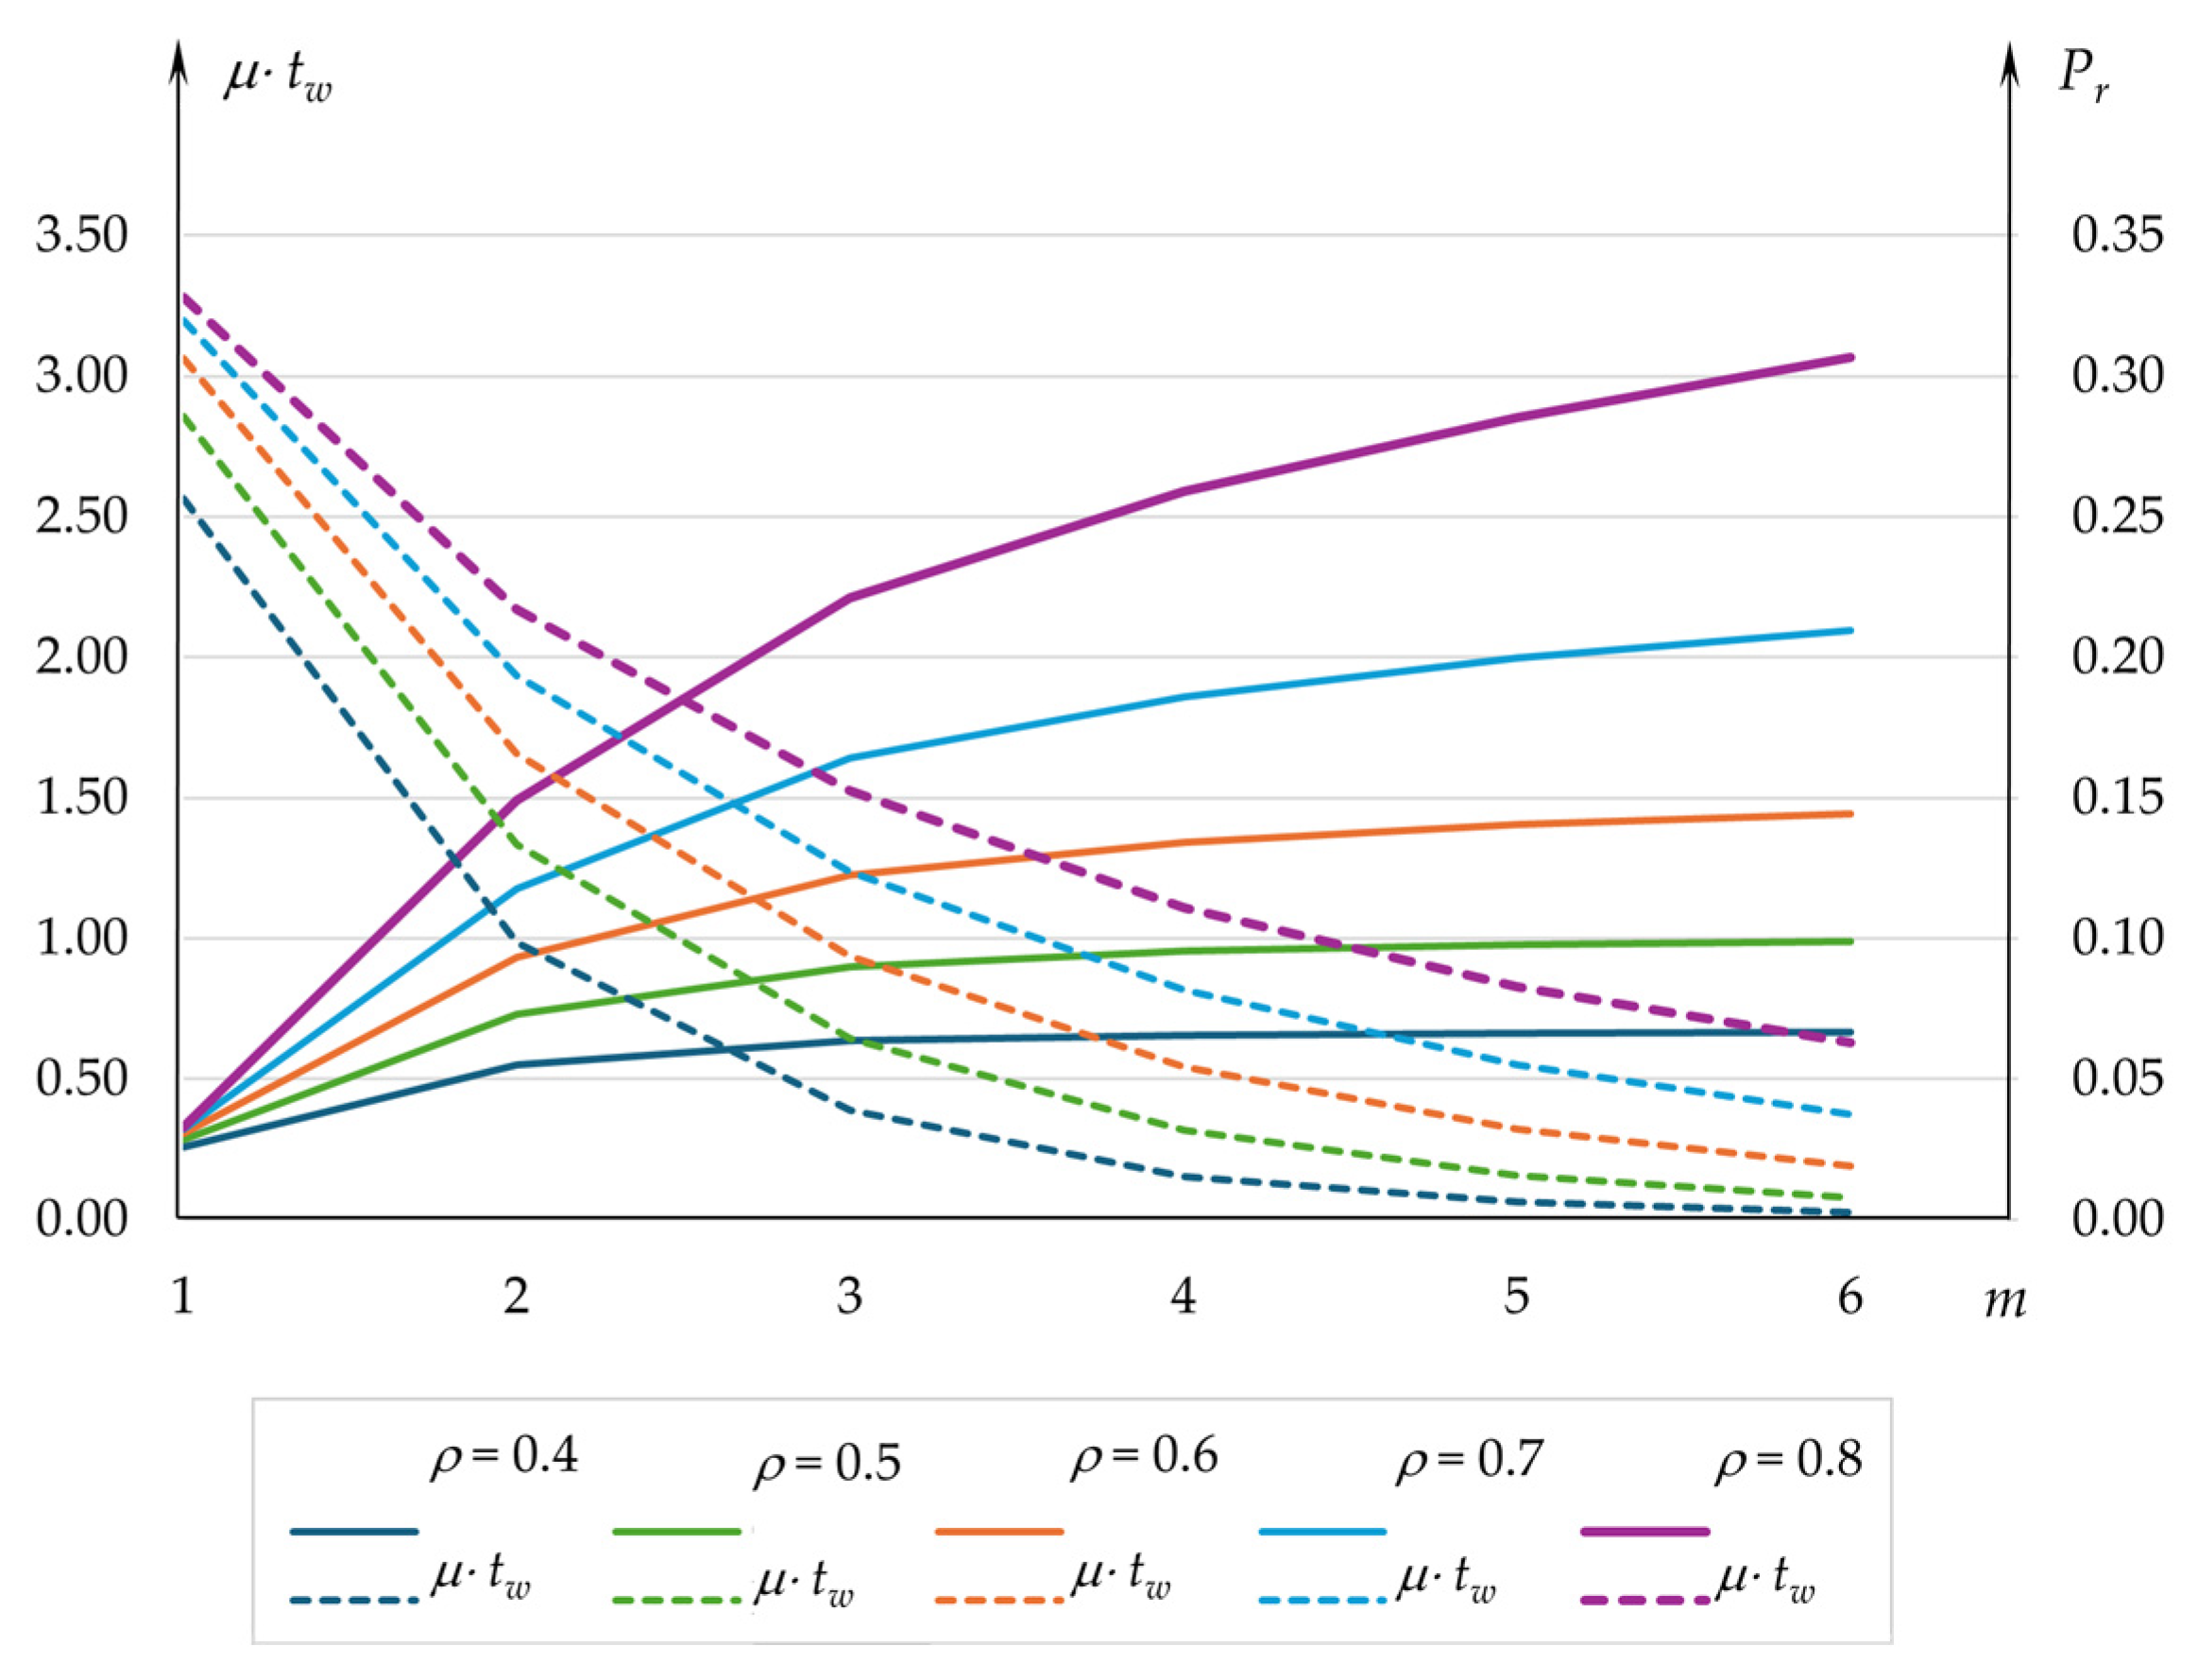
Figure 4, Figure 5 and Figure 6 show examples of the variation in the probability of customer rejection and average waiting time for different buffer capacities. Limiting the system size (by limiting the buffer capacity or number of places for waiting) determines a diminished average waiting time compared to the values in the case of an unlimited capacity (in which the length of the queue is considered as ∞) (Figure 6).
Consequently, the system capacity and the number of servers can be established in relation to standards related to the following:
  • The probability of losing customers while the system is busy.
  • The average waiting time compared to a specified threshold accepted for waiting time or total transit time.
For example, the probability of rejection can be reduced by increasing the system capacity (the buffer capacity, m, and the number of servers, n), but circumstances can appear to increase the average waiting time. By reducing the system capacity, the average waiting time can be reduced (but the probability of customer rejection increases). Under these circumstances, to evaluate the system performance, the further evaluation of the cost related to customer rejection due to limited buffer capacity is necessary.

3. Optimisation of the System Structure

3.1. Cost Function Related to System Operation

For a queuing system with the given parameters λ and μ (as random variables), the problem is determining the system size in a correlated manner, i.e., the number of serving stations, n, and the buffer capacity, m, in relation to physical or economic indicators. The sizing regarding physical indicators is based on threshold values for service, such as the probability of customer rejection or the average waiting time. The sizing in relation to economic indicators is achieved by determining the extreme of an objective function defined based on the criterion of operating costs [6,8]. Frequently, in order to avoid difficult, complex cost evaluation, the minimisation of losses or expenses that depend on the decisions on n and m is considered.
This study uses an economic criterion of interest for the service provider (the customer’s interest in the service quality is considered through physical measures). The cost function related to the operation of the system, F(n, m), is defined as
F ( n , m ) = λ P r ( m ) v + m h + n c ,
where
  • Pr—the probability of rejection given by Equation (4).
  • v—the profit obtained for customer service.
  • h—the cost associated with a place for waiting.
  • c—the cost associated with a server
This sort of problem is defined when a finite-capacity queueing system is designed, and there are physical possibilities for selecting the values n and m simultaneously (Equation (20), assuming that h and c do not depend on m and n, which is a simplification).

3.2. Number of Servers

The following example describes the sizing of a finite-capacity queuing system. Initially, it assumes a system (like many real situations) in which only one variable, namely, n, can be decided. Assume that m is settled and that we cannot intervene in its modification.
The example considers a gas station defined as a finite-capacity queuing system with the following parameters:
  • The arrival rate is 320 vehicles/day (λ = 320 vehicles/day).
  • The service rate of a refuelling server is 160 vehicles/day (μ = 160 vehicles/day).
  • There are six places for waiting for fuelling (m = 6).
  • The fixed costs associated with a server comprise 600 monetary units/day (c = 600 m.u./day).
  • The profit resulting from a vehicle fuelling comprises 10 monetary units/vehicle (v = 10 m.u./vehicle).
The number of servers has to be established. Because m is given, it does not influence the cost function. Therefore, Equation (20) becomes
F ( n ) = λ P r p + n c ,  for the given  m .
The number of servers, n*, must be determined to minimise the function
F ( n , m 1 ) = min n   F ( n , m 1 ) + m 1 h .
For a function of a discrete variable, the constraints to obtain its minimum are
F ( n 1 ) F ( n ) and   F ( n ) F ( n + 1 ) ,
resulting in the double constraint for n*:
P r ( n ) P r ( n + 1 ) c p λ P r ( n 1 ) P r ( n ) .
For ρ = λ/μ = 2 and m = 6, the rejection probabilities are computed (Table 1). It is noticed that the constraint (24) is satisfied for n* = 2.
If the profit increases, suppose v = 20, then the constraint (24) is satisfied for n* = 3. This method could provide the system operator with guidance on the pricing policy, i.e., on the profit ranges that can be achieved without changing the system size (or that require changing the system); e.g., Figure 7 shows the profit ranges that can be stated for n* = 2 and n* = 3.

3.3. Number of Servers and Number of Waiting Places

The previous problem extends to the possibility of selecting the values n and m simultaneously. The objective function (Equation (20)) becomes
F ( n , m ) = min m ( F ( n , m ) + m h ) .
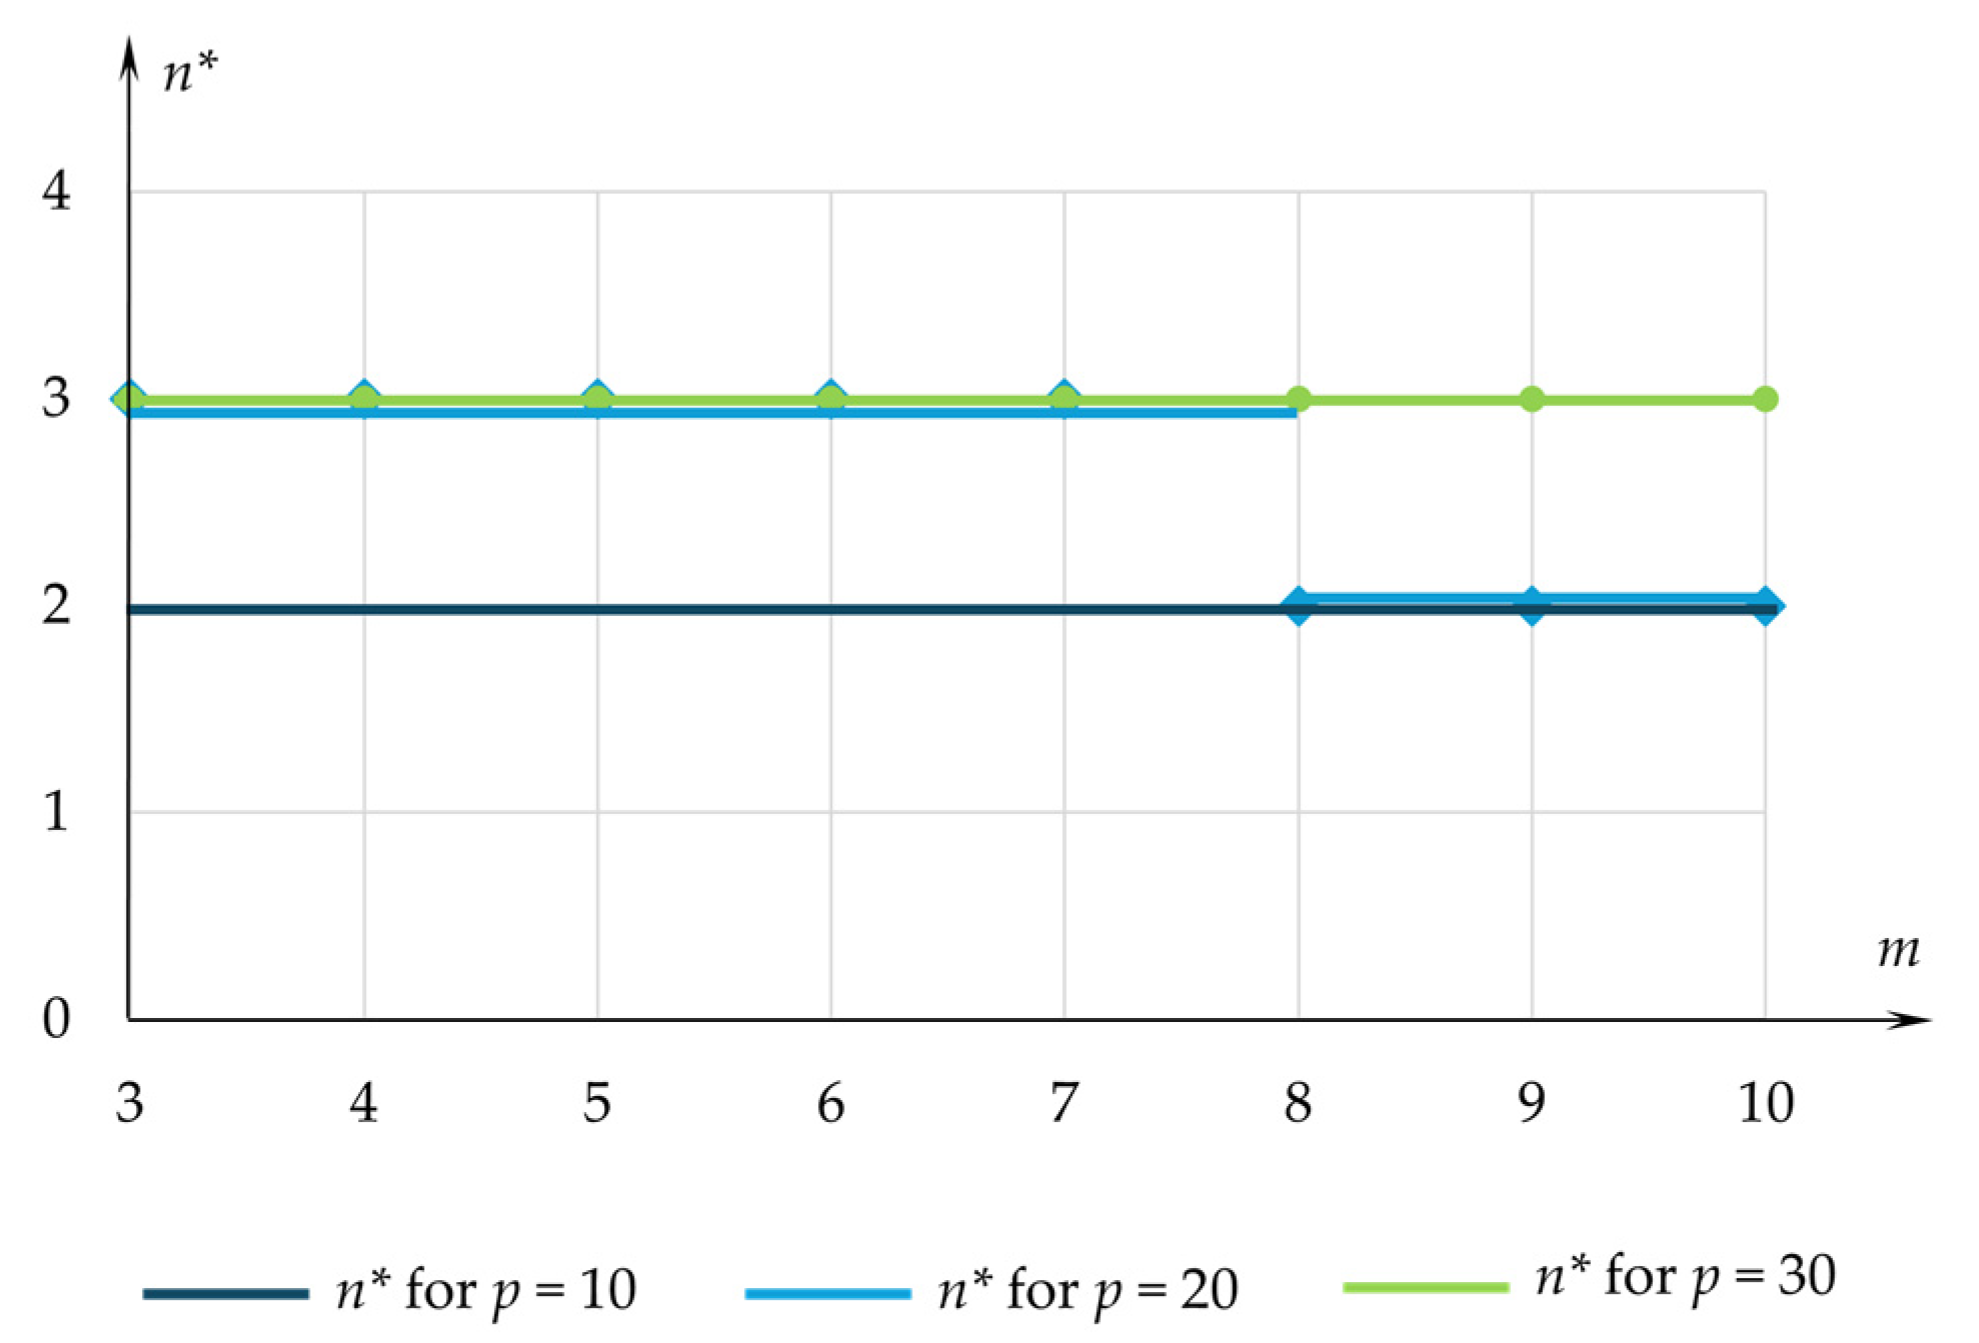
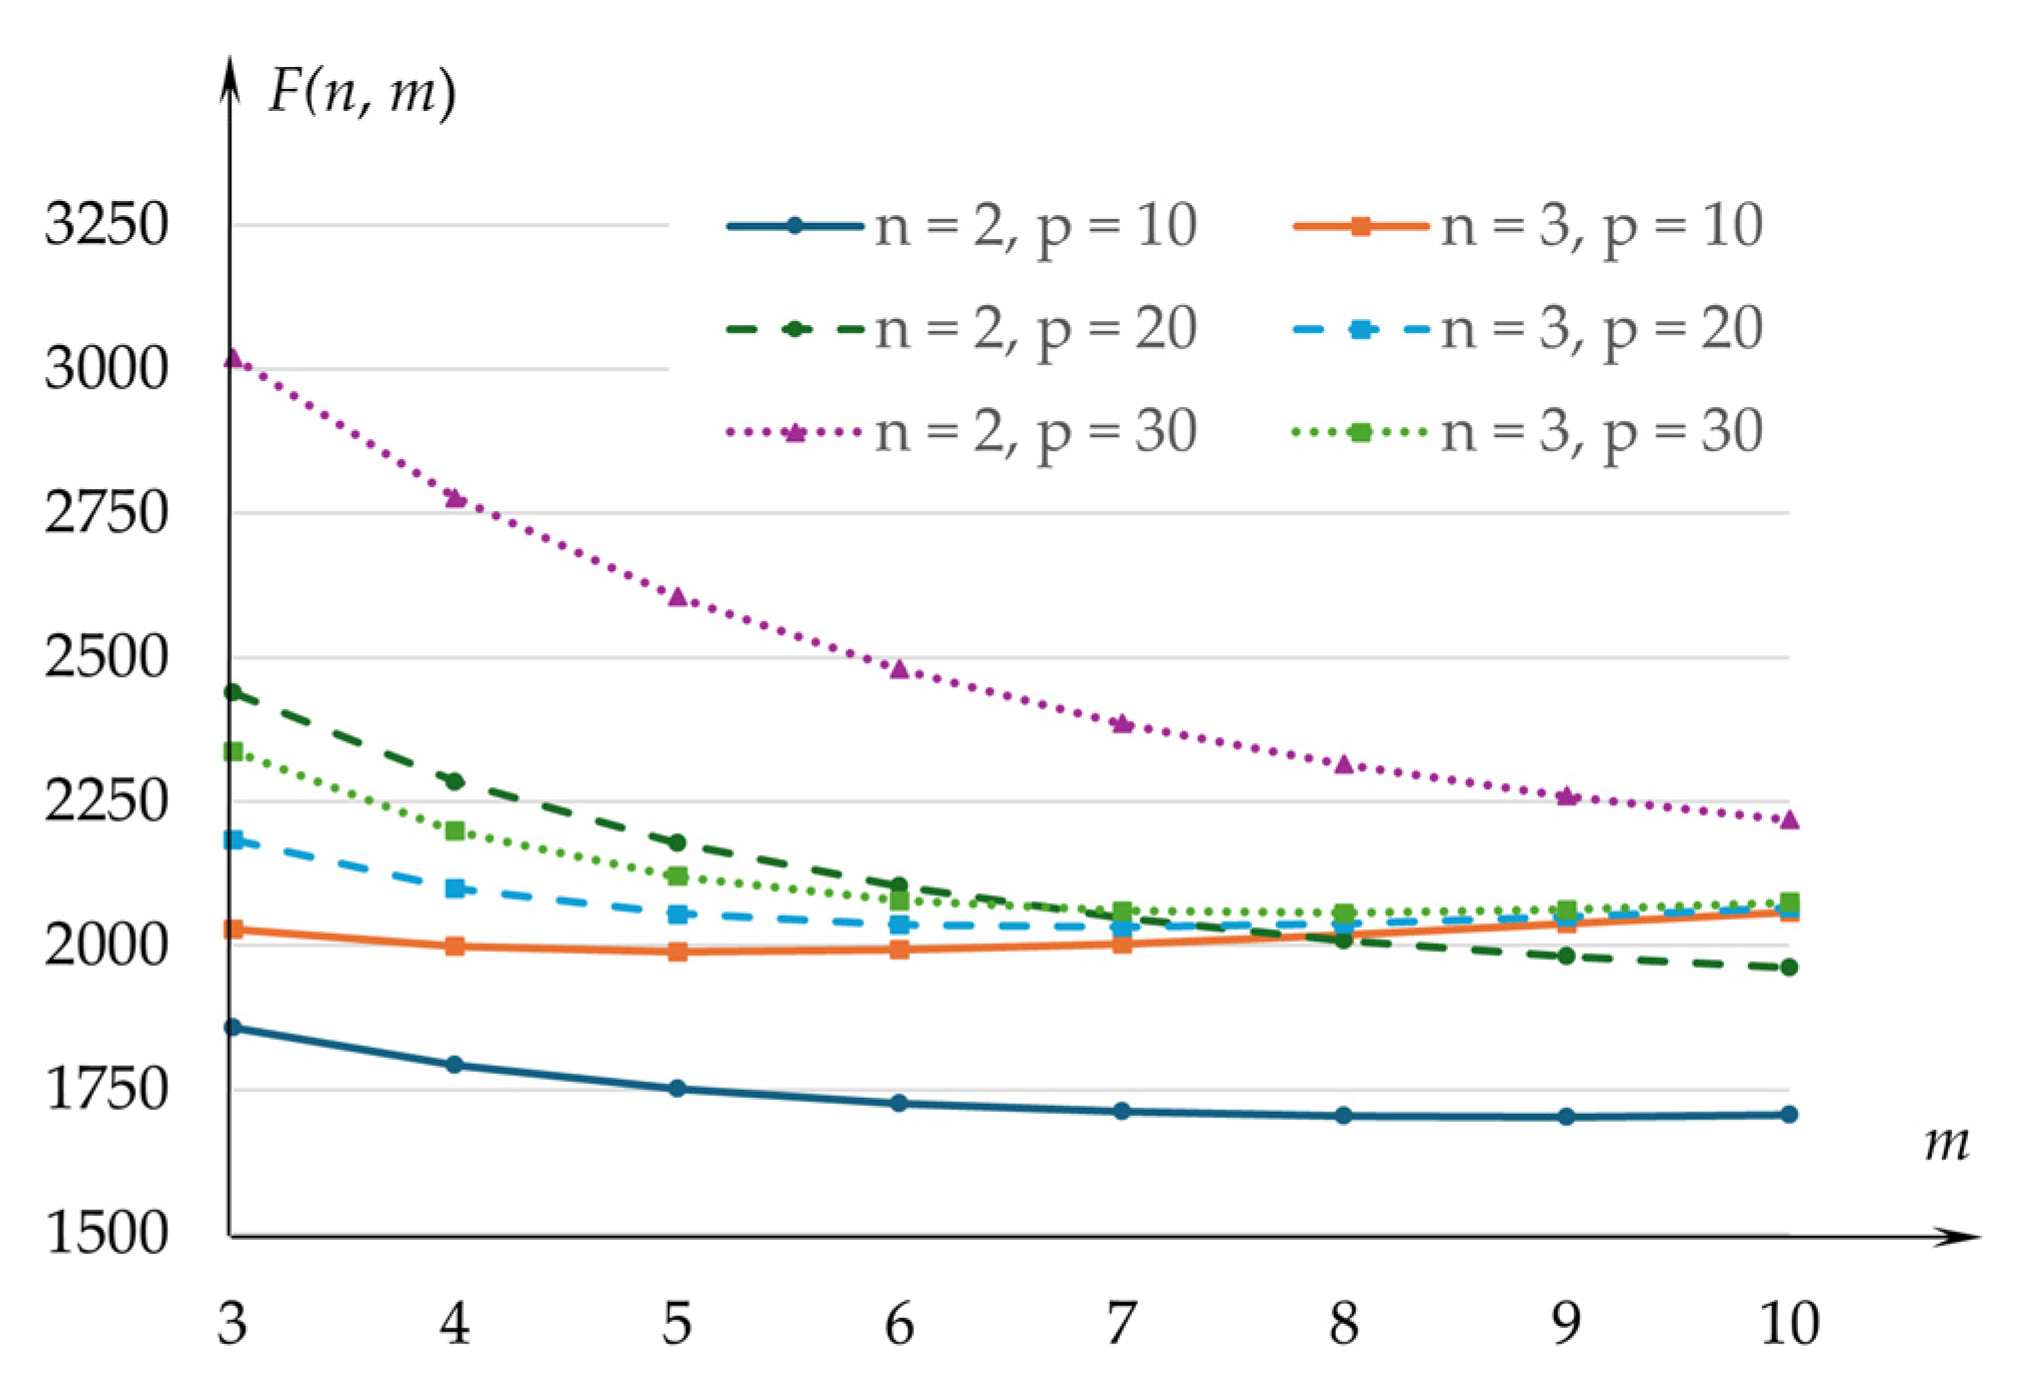
Figure 8 presents the variation in n* as a function of m for profit values v = 10, 20, and 30. Depending on the values of n and m, the values of the cost function associated with the system operation are determined (Figure 9). The values of the cost function allow for the comparison of different schemes of system structure and determine the appropriate design.

4. Discussion

Compared to unlimited-capacity queuing systems, finite-capacity queuing systems (with waiting and rejection) need an additional defining parameter—namely, the buffer capacity, m, of waiting places in the system. Therefore, the complexity increases when evaluating the system performance through physical measures and optimising the system structure. The integer parameter, m, determines the probability of customer rejection.
The probability of the rejection level, Pr, expresses the performance of a system M/M/m:(n/FIFO) for the specific values λ and μ (i.e., for a particular utilisation factor, ρ = λ/μ). Assuming that the parameters n and μ are previously decided based on other technological criteria, the values Pr could be scaled by selecting m and ρ. The possible modification of m does not require explanations. On the other hand, if μ is established, then the modification of ρ needs clarifications. If A denotes the daily arrival rate of customers for service and T is the operational time per day, then the hourly arrival rate is λ = A/T. Thus, by modifying the operational time, T, in which the system is available for customer service, the value of λ changes, with implications for ρ and Pr.
Concerning the comparison of queuing systems (with unlimited queuing capacity) with finite-capacity queuing systems, this research emphasises the effects of the rejection rate when ρ/n ≥ 1 (otherwise, the finite-capacity queue implies no customer rejections). Then, defining the rejection rate by Δ = λ·Pr, the performance can be assessed for a multi-server queuing system for the rate λ − Δ, when the effective utilisation, ρe/n = (λ − Δ)/, becomes less than one. In this context, the analysis of finite-capacity queuing systems is based on the factors ρ/n and ρe/n (with ρe/nρ/n and ρe/n < 1).
The examination of the correlation between the buffer capacity, m*, and the effective utilisation ρe (for n = 1) for the same rejection rate Δ* (or system loss, depicted in Figure 3 for Δ*/λ = 0.1) could be relevant in the case of an intention to split the service domain between several stakeholders or between several service facilities of the same stakeholder. The same relative demand rate from the market could be assigned to each partner. By satisfying the correlation between m* and ρe, each system will operate with the same value of loss Δ*. Failure to fulfil the correlation of the increase in λ (reflected in the rise in ρ and the possible need for variation in the buffer capacity) modifies the scheduled relative loss for the system capacity. For example, if the system is designed for a load ρ = 0.5, then this corresponds to a buffer capacity m* = 2 for Δ* = 0.1·λ (according to Figure 3). Subsequently, by increasing λ (without any change in μ and m*), ρ becomes 0.9. Equation (10) indicates that Δ becomes 0.23·λ. This indicates a modification to the effective utilisation ρe, from ρe = (1 − 0.1)·0.5 = 0.45 to ρe = (1 − 0.23)·0.9 = 0.69 (compared to ρe = 0.81 if the buffer capacity is increased to m* = 5 to preserve the capacity loss set at 0.1·λ). In conclusion, failure to satisfy the correlation between ρ and m* leads to changes in both the system capacity and average waiting time (by changing ρe).
Specificity also characterises the average waiting time in W compared to queuing systems with unlimited buffer capacity. In relation to the service duration, 1⁄μ, the average waiting time, expressed by μ·tw, is a function of effective utilisation ρe (a function of the probability of rejection, Pr, and the buffer capacity, m). Figure 4 and Figure 5 suggest (if the evaluation of Pr and μ·tw is not possible) the opportunity to define a recommended range buffer capacity, m, either according to ρe, which determines a particular threshold value for Pr, or according to a threshold value for μ·tw. The selection of m based on harmonising the two alternatives is recommended (Figure 6).
Estimating the costs relevant to the operation of a finite-capacity queuing system allows for the optimisation of the system structure. Minimising a discrete objective function is necessary in order to select the value n for a given m (which, for objective reasons, cannot be modified) or to select both the values of m and n (if practical conditions allow it). The function considers the assessment of losses caused by customer rejection and the costs of operating the servers (also as losses). Deciding the system structure by minimising the cost function is more applicable in practice. The results of the optimisation, n*, for a given m or n* and m* provide specific stability in relation to the variations in the parameters c, v, and h. Hence, tactical and operational decisions could be made within the accepted range without modifying the optimal solutions.

5. Conclusions

From a theoretical point of view, the investigation of finite-capacity queuing systems implies generalising valencies and involves queuing and customer rejection. The evaluation of the system performance involves the additional complexity of two parameters that intervene simultaneously: the number of servers, n, and the buffer capacity, m. The selection of the parameters involves opposite effects on the system performance for a set of parameters: λ, μ, and n. Lower values of m indicate poorer performances in terms of customer admission to service (higher probabilities of customer rejection). At the same time, they lead to better service performance in terms of a lower average waiting time.
From a practical point of view, this research proves the utility of modelling finite-capacity queuing systems. In order to substantiate decisions on the structure of real systems, quantitative evaluations can be performed based on physical and/or economic measures.
The implementation of the results of this theoretical investigation into finite-capacity queuing systems must be preceded by a cautious analysis to confirm the suitability of the mathematical modelling assumptions for the operation of the practical system (either existing or designed). Statements regarding the distribution functions of the arrival and service must be primarily verified. Deep learning algorithms could provide valuable research directions for the accurate evaluation of arrival and service rates based on large time series.
It must also be considered that the estimated performances refer to a stationary operating regime. For many real systems with largely temporary dynamics, the operation time in transient and/or disturbed regimes is also relevant. These recommendations emphasise the necessity for further research on the mathematical modelling of finite-capacity queuing systems (with waiting and rejection).

Author Contributions

Conceptualisation, S.R., D.C. and M.P.; methodology, S.R., D.C. and M.P.; formal analysis, S.R., D.C. and M.P.; resources, S.R., D.C. and M.P.; writing—review and editing, S.R., D.C. and M.P. All authors have read and agreed to the published version of the manuscript.

Funding

This research received no external funding.

Data Availability Statement

Data are contained within the article.

Conflicts of Interest

The authors declare no conflicts of interest.

References

  1. Asanjarani, A.; Nazarathy, Y.; Taylor, P. A survey of parameter and state estimation in queues. Queueing Syst. 2021, 97, 39–80. [Google Scholar] [CrossRef]
  2. Gross, D.; Shortie, J.F.; Thompson, J.M.; Harris, C.M. Fundamentals of Queueing Theory; Wiley Series in Probability and Statistics; John Wiley & Sons: Hoboken, NJ, USA, 2008. [Google Scholar] [CrossRef]
  3. Hall, R.W. Queueing Methods for Services and Manufacturing; Prentice Hall: Hoboken, NJ, USA, 1991. [Google Scholar]
  4. Barndorff-Nielsen, O.E.; Cox, D.R.; Kluppelberg, C. (Eds.) Complex Stochastic Systems, 1st ed.; CRC Press. Taylor & Francis Group: Boca Raton, FL, USA, 2000. [Google Scholar] [CrossRef]
  5. Kempa, W.M.; Kobielnik, M. Transient solution for the queue-size distribution in a finite-buffer model with general independent input stream and single working vacation policy. Appl. Math. Mod. 2018, 59, 614–628. [Google Scholar] [CrossRef]
  6. Sanga, S.S. Nidhi. Cost optimisation and ANFIS computing for M/M/(R+c)/N queue under admission control policy and server breakdown. Simul. Model. Pr. Theory 2025, 138, 103037. [Google Scholar] [CrossRef]
  7. Jain, M.; Sanga, S.S. State dependent queueing models under admission control F-policy: A survey. J. Ambient. Intell. Humaniz. Comput. 2020, 11, 3873–3891. [Google Scholar] [CrossRef]
  8. Yang, D.Y.; Chiang, Y.C.; Tsou, C.S. Cost analysis of a finite capacity queue with server breakdowns and threshold-based recovery policy. J. Manuf. Syst. 2013, 32, 174–179. [Google Scholar] [CrossRef]
  9. Raicu, S.; Costescu, D.; Popa, M. Effects of the queue discipline on system performance. AppliedMath 2023, 3, 37–48. [Google Scholar] [CrossRef]
  10. Gupta, S.M. Interrelationship between controlling arrival and service in queueing systems. Comput. Oper. Res. 1995, 22, 1005–1014. [Google Scholar] [CrossRef]
  11. Tian, N.; Zhang, Z.G. Vacation Queueing Models. Theory and Applications; Springer: New York, NY, USA, 2006. [Google Scholar] [CrossRef]
  12. Yang, D.Y.; Wang, K.H.; Wu, C.H. Optimization and sensitivity analysis of controlling arrivals in the queueing system with single working vacation. J. Comput. Appl. Math. 2010, 234, 545–556. [Google Scholar] [CrossRef]
  13. Huang, H.I.; Hsu, P.C.; Ke, J.C. Controlling arrival and service of a two-removable-server system using genetic algorithm. Expert Syst. Appl. 2011, 38, 10054–10059. [Google Scholar] [CrossRef]
  14. Yang, D.Y.; Yang, N.C. Performance and cost analysis of a finite capacity queue with two heterogeneous servers under F-policy. Int. J. Serv. Oper. Inform. 2018, 9, 101–115. [Google Scholar] [CrossRef]
  15. Jain, M.; Kumari, S.; Qureshi, R.; Shankaran, R. Markovian multi-server queue with reneging and provision of additional removable servers. In Performance Prediction and Analytics of Fuzzy, Reliability and Queuing Models. Asset Analytics; Deep, K., Jain, M., Salhi, S., Eds.; Springer: Singapore, 2019; pp. 203–217. [Google Scholar] [CrossRef]
  16. Abdul Rasheed, K.V.; Manoharan, M. Markovian queueing system with discouraged arrivals and self-regulatory servers. Adv. Oper. Res. 2016, 2016, 2456135. [Google Scholar] [CrossRef]
  17. Jain, M.; Sanga, S.S. F-Policy for M/M/1/K retrial queueing model with state-dependent rates. In Performance Prediction and Analytics of Fuzzy, Reliability and Queuing Models. Asset Analytics; Deep, K., Jain, M., Salhi, S., Eds.; Springer: Singapore, 2019; pp. 127–138. [Google Scholar] [CrossRef]
  18. Kim, J.; Kim, B. A survey of retrial queueing systems. Ann. Oper. Res. 2016, 247, 3–36. [Google Scholar] [CrossRef]
  19. Artalejo, J.R.; Gómez-Corral, A. Retrial Queueing Systems. A Computational Approach; Springer: Berlin, Germany, 2008. [Google Scholar] [CrossRef]
  20. MacGregor Smith, J. System capacity and performance modelling of finite buffer queueing networks. Int. J. Prod. Res. 2014, 52, 3125–3163. [Google Scholar] [CrossRef]
  21. Pourvaziri, H.; Sarhadi, H.; Azad, N.; Afshari, H.; Taghavi, M. Planning of electric vehicle charging stations: An integrated deep learning and queueing theory approach. Transp. Res. Part E Logist. Transp. Rev. 2024, 186, 103568. [Google Scholar] [CrossRef]
  22. Cox, D.R.; Smith, W. Queues, 1st ed.; Chapman & Hall/CRC: New York, NY, USA, 1991. [Google Scholar] [CrossRef]
  23. Natvig, B. On the transient state probabilities for a queueing model where potential customers are discouraged by queue length. J. Appl. Probab. 1974, 11, 345–354. [Google Scholar] [CrossRef]
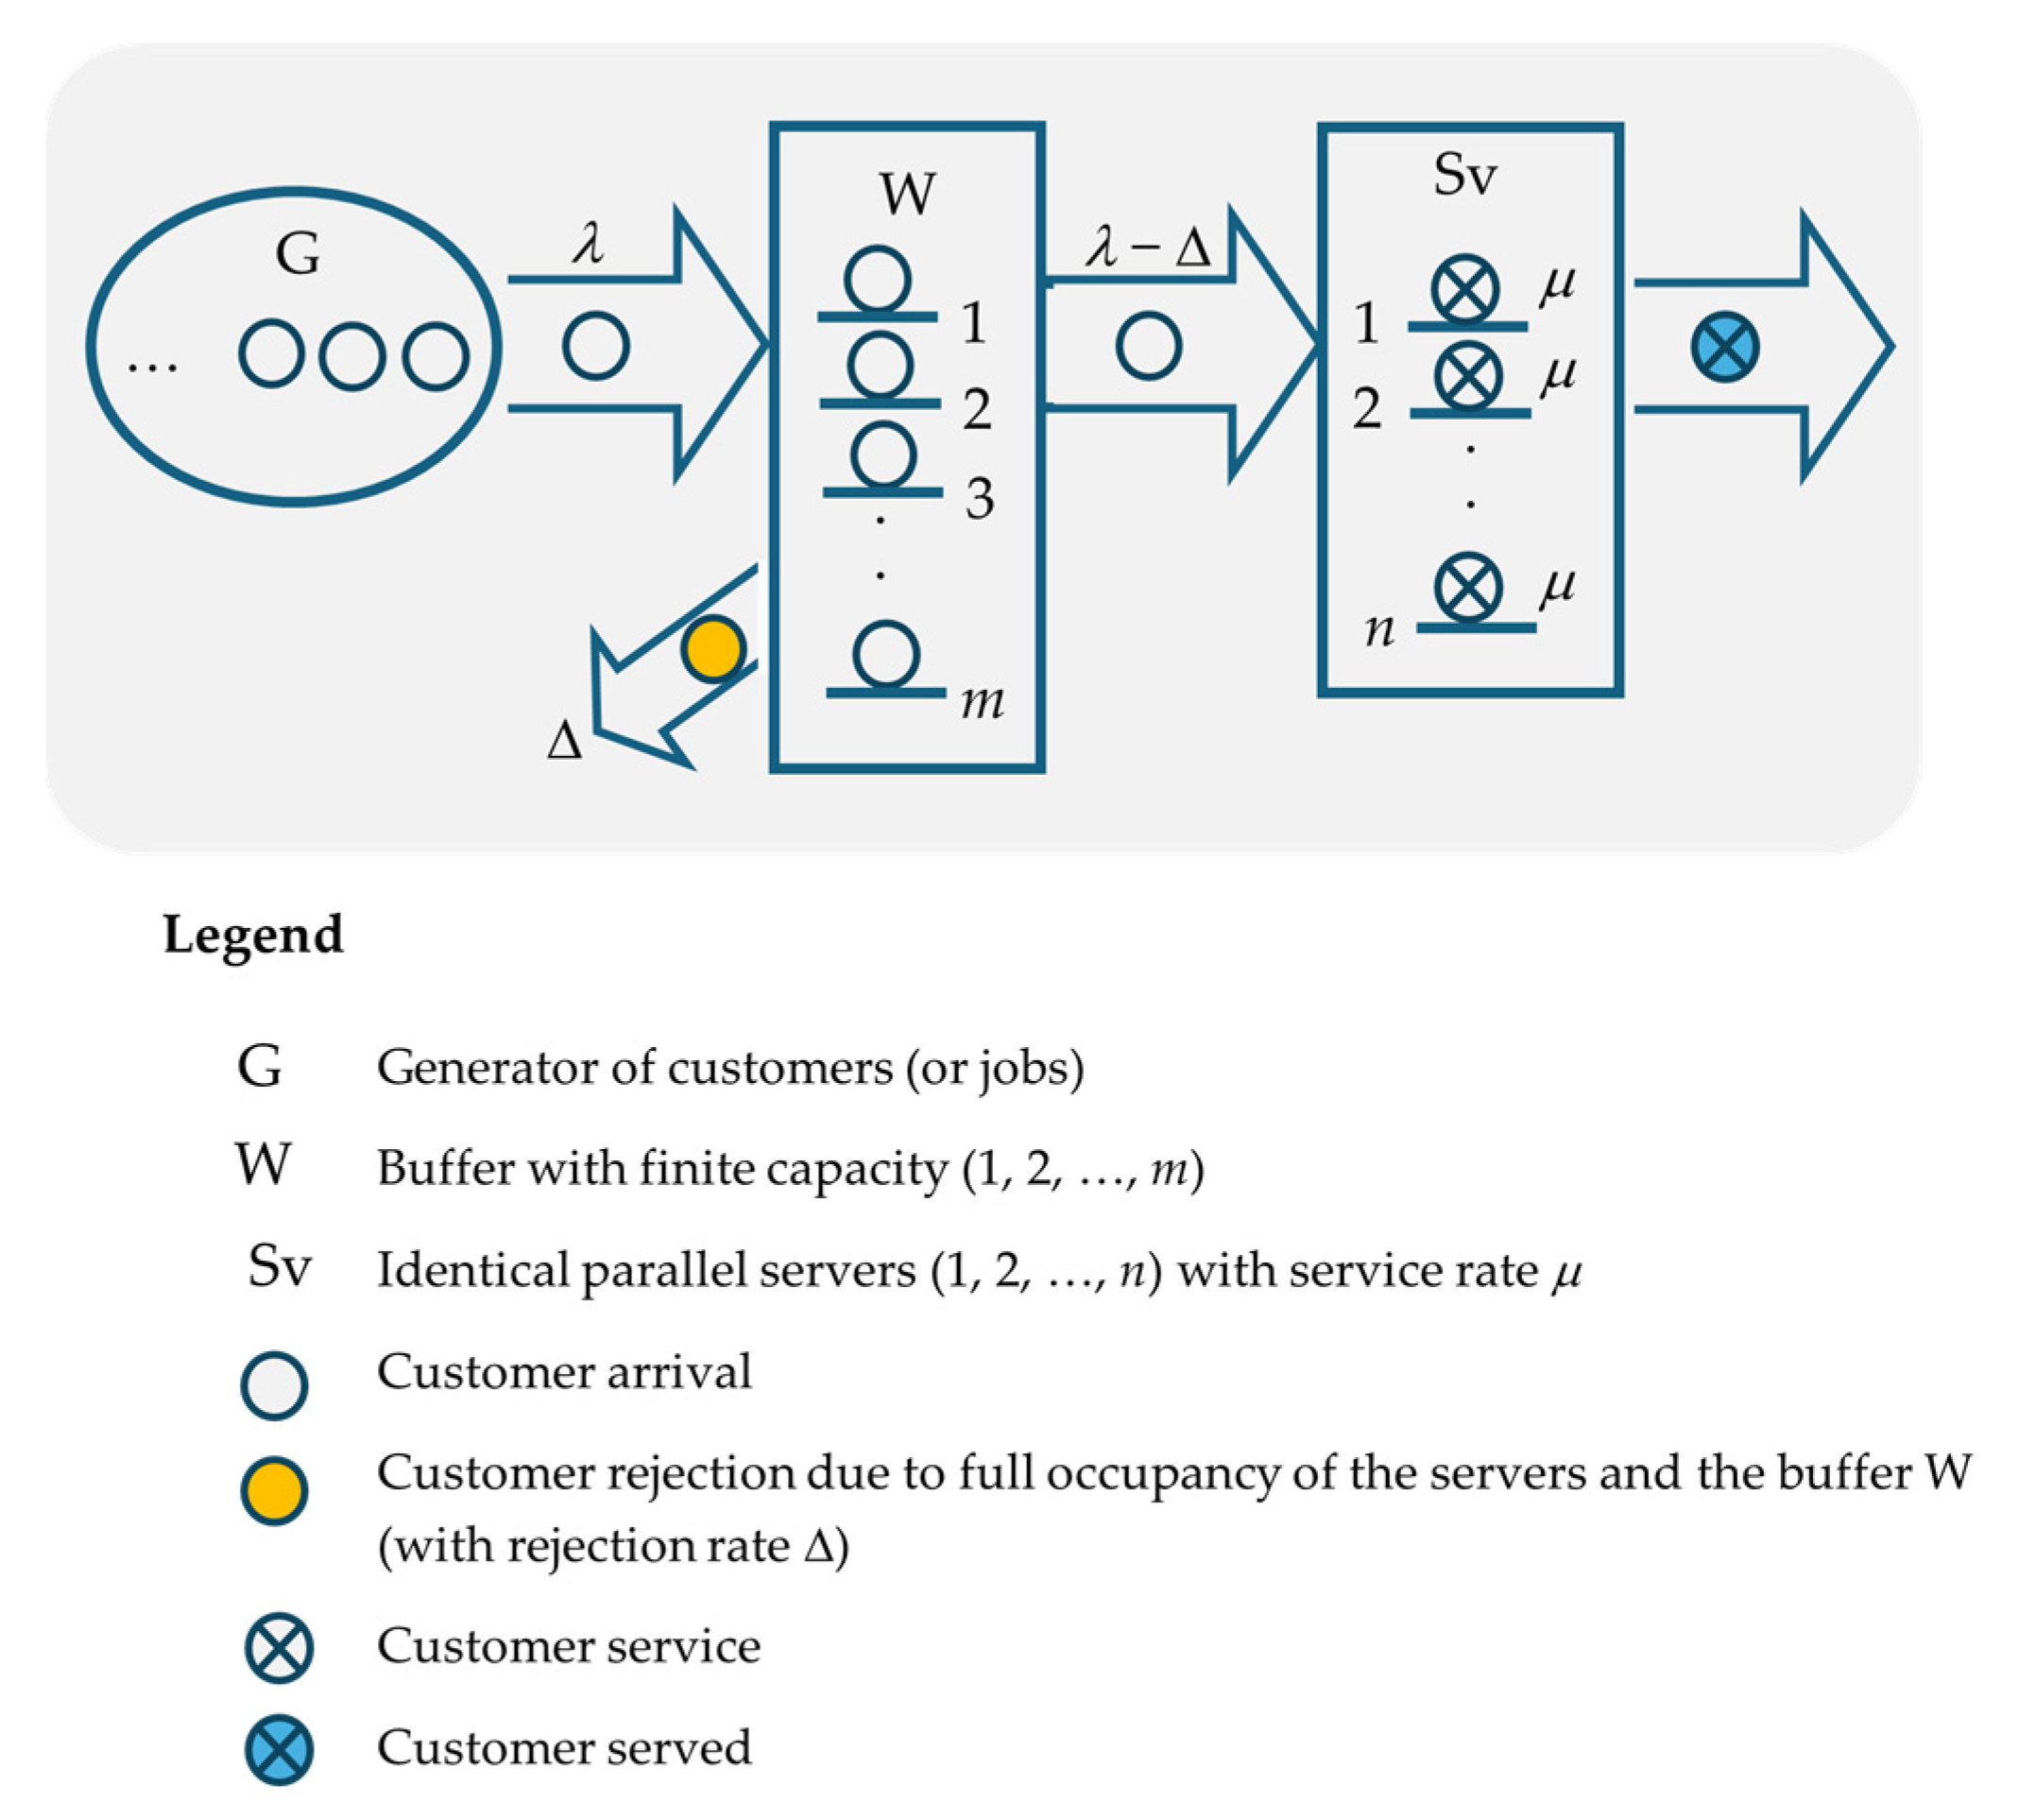
Figure 1. Elementary queuing system with a finite capacity (with waiting and rejection).
Appliedmath 05 00017 g001
Figure 2. The total system capacity, λ0(2)(m); the function of the number of places for waiting, m.
Appliedmath 05 00017 g002
Figure 3. Variation in the number of places for waiting, m*, and function of utilisation factor, ρ, for Δ* = 0.01λ (mw*, values obtained by rounding up the computed values of m*).
Appliedmath 05 00017 g003
Figure 4. Probability of customer rejection, Pr, and the function of utilisation factor, ρ (for m = 4, 5, 6).
Appliedmath 05 00017 g004
Figure 5. Variation in μ·tw function of utilisation factor, ρ (for m = 4, 5, 6).
Appliedmath 05 00017 g005
Figure 6. Variation in μ·tw and Pr function of buffer capacity, m, for different utilisation factors, ρ.
Appliedmath 05 00017 g006
Figure 7. The number of servers, n, and the function of the profit resulting from customer service, v.
Appliedmath 05 00017 g007
Figure 8. Number of servers, n, for profit values v = 10, 20, and 30.
Appliedmath 05 00017 g008
Figure 9. Cost function, F(n, m), for profit values v = 10, 20, and 30.
Appliedmath 05 00017 g009
Table 1. Verification of the constraint of cost minimisation for ρ = 2 and m = 6.
nPr(n)Pr(n) − Pr(n + 1)Ratio (c/)Pr(n − 1) − Pr(n)
10.5020---
20.11770.10430.18750.3843
30.01340.01200.18750.1043
40.00140.00120.18750.0120
50.00010.00010.18750.0012
Disclaimer/Publisher’s Note: The statements, opinions and data contained in all publications are solely those of the individual author(s) and contributor(s) and not of MDPI and/or the editor(s). MDPI and/or the editor(s) disclaim responsibility for any injury to people or property resulting from any ideas, methods, instructions or products referred to in the content.