Article

AI-Driven Image Analysis for Precision Screening Transposon-Mediated Transgenesis of NFκB eGFP Reporter System in Zebrafish

1
Department of Systems Pharmacology, Graduate School of Medicine, Mie University, Tsu 514-8507, Japan
2
Transgenic Inc., Tokyo 100-0006, Japan
3
Medical Zebrafish Research Center, Mie University, Tsu 514-8507, Japan
*
Author to whom correspondence should be addressed.
Future Pharmacol. 2025, 5(3), 50; https://doi.org/10.3390/futurepharmacol5030050
Submission received: 2 June 2025 / Revised: 19 August 2025 / Accepted: 23 August 2025 / Published: 31 August 2025

Abstract

Background: Zebrafish-based drug discovery systems provide significant advantages over mammalian models for high-throughput in vivo screening. Among these, the NF-κB eGFP reporter system significantly enhances drug discovery in zebrafish by enabling real-time, high-resolution monitoring of pathway activity in live organisms, thereby streamlining mechanistic studies and high-throughput screening. Methods: We developed a novel AI (Quantifish and Orange software)-based zebrafish precision individualized 96-well ZF plates (0–7 dpf) and individualized MT tanks (8 dpf–4 mpf) protocol for the transposon-mediated transgenesis of the NFκB eGFP reporter system. Results: One-cell stage embryos were administered NFκB reporter construct and Tol2 transposase mRNA via microinjection and transferred to separate wells of a 96-well ZF plate. Bright-field and fluorescence images of each well were captured at 5 dpf in the F0, F1, and F2 generations using the automated confocal high-content imager CQ1. The Quantifish software was used for the automated detection and segmentation of zebrafish larval fluorescence intensity in specific regions of interest. Quantitative data on the fluorescence intensity and distribution patterns were measured in Quantifish, and advanced statistical and machine learning methods were applied using Orange. Imaging data with eGFP expression results were assessed to evaluate the efficiency of the transgenic protocol. Discussion: This AI-enhanced precision protocol allows for high-throughput screening and quantitative analysis of NFκB reporter transgenesis in zebrafish, enabling the efficient identification and characterization of stable transgenic lines that exhibit tissue-specific expression of the NF-κB reporter, such as lines with induced expression restricted to the retina following LPS stimulation. This approach streamlines the evaluation of regulatory elements, enhances data consistency, and reduces animal use, making it a valuable tool for zebrafish drug discovery.

Graphical Abstract

1. Introduction

Zebrafish-based drug discovery systems provide advantages in high-throughput in vivo screening compared with mammalian models [1]. To enable efficient drug discovery using zebrafish, our system utilizes AI-driven image analysis to screen for tissue-selective transgene expression in early (F0) generations after Tol2-mediated transgenesis [2]. This approach rapidly identifies optimal reporter expression patterns, allowing researchers to systematically select and breed founders for stable (F1 and F2) lines, which can then be used in downstream drug screening. By integrating automated phenotyping with transposon-based transgenesis, our platform accelerates the creation and deployment of highly specific transgenic lines for drug discovery purposes. The integration of zebrafish transposon-mediated transgenesis with NF-κB eGFP reporter systems represents a transformative approach for drug discovery that combines efficient genetic engineering with the real-time monitoring of biological pathways [3,4]. This integrated platform enables high-throughput phenotypic screening of candidate compounds for modulatory effects on NF-κB pathway activation in vivo. By quantifying tissue-specific reporter activity, particularly in the retina, researchers can identify and characterize lead compounds that suppress or enhance NF-κB signaling relevant to inflammatory and degenerative diseases. Zebrafish NF-κB reporter models have been successfully used in drug discovery and toxicology studies, demonstrating the translational value of this approach [4]. AI-driven image analysis further accelerates screening, improves data consistency, and enables robust statistical evaluation, aligning with current trends in automated drug discovery workflows. The NF-κB eGFP reporter system significantly enhances drug discovery in zebrafish by enabling real-time, high-resolution monitoring of pathway activity in live organisms, thereby streamlining mechanistic studies and high-throughput screening [5,6]. Overall, the NF-κB eGFP reporter system provides a versatile platform for understanding complex biological processes and accelerating the identification of effective drug candidates across various disease contexts [1,7].
While NF-κB eGFP systems enable unprecedented resolution in drug screening, addressing phototoxicity [8,9], computational demands [10,11], and biological variability remains critical for optimizing throughput and translational relevance [12]. We note that achieving high-resolution imaging for precise drug screening increases the risk of phototoxicity, as higher-intensity or more frequent light exposure can induce cellular damage or physiological artifacts, especially when photosensitive compounds are present. Balancing imaging resolution and minimizing phototoxic effects is therefore essential to ensure reliable screening outcomes. For example, some tissue-specific NF-κB eGFP systems need large-scale random screening for optimizing throughput and translational relevance. The Tol2 transposon system, which is widely used in zebrafish research, presents several challenges that must be addressed to achieve optimal experimental outcomes [13]. While Tol2 transposon-mediated transgenesis enables efficient introduction of exogenous DNA into the zebrafish genome, the resulting genomic integration is random rather than precise [14]. Therefore, this approach is best suited for generating transgenic lines and enhancer traps rather than targeted genomic modifications. However, a significant limitation of the Tol2 transposon system is its random genomic integration. This random insertion can lead to variable levels and patterns of transgene expression, known as position effects, and carries a risk of disrupting endogenous gene function or regulatory sequences. These limitations should be considered when interpreting results from Tol2-mediated transgenesis in zebrafish research. These limitations highlight the need for careful experimental design and validation when using Tol2 for zebrafish transgenesis, especially in applications requiring precise genomic modifications or consistent transgene expression [13,15]. Tol2-mediated transgenesis facilitates the random integration of exogenous DNA into the zebrafish genome, which often results in variable expression levels and patterns due to position effects. In the absence of an exogenous tissue-specific promoter or enhancer, the expression of the integrated transgene may be ubiquitous, mosaic, or, in certain cases, tissue-selective if integration occurs near endogenous regulatory elements. To address this variability, researchers sometimes use constructs with defined tissue-specific regulatory sequences or perform high-throughput screening to identify integration events that confer desired expression patterns. Previous studies have leveraged such random or semi-targeted integrations to generate lines for investigating tissue-specific gene function and regulatory mechanisms in vivo [4]. Our AI-driven screening strategy allows the rapid and objective identification of such expression patterns in F0 fish, further facilitating the use of these variable lines for tissue-specific studies and applications in drug discovery
To achieve this, we developed a novel AI (Quantifish and Orange)-based zebrafish precision (individualized 96-well ZF plates and MT tanks) protocol for the transposon-mediated transgenesis of the NFκB eGFP reporter system in order to overcome transposon insertion randomness. Quantifish (version 2.1.2), an open-source image analysis software utilizing machine learning-based AI algorithms, was used for automated detection, segmentation, and quantification of fluorescence within zebrafish larvae. Subsequent data analysis was performed using Orange (version 3-3.37.0), a machine learning and data mining platform, which applies AI-driven statistical and predictive models (e.g., clustering, classification) to analyze and visualize high-dimensional transgene expression data. These challenges highlight the balance between the versatility of Tol2 and the need for a meticulous experimental design to ensure reliable and reproducible outcomes in zebrafish transgenesis. Although Tol2-mediated transgenesis results in random genomic integration, the application of AI-based software (Quantifish and Orange) allows rapid and unbiased screening of large numbers of individuals, so that those with optimal or tissue-specific transgene expression patterns can be efficiently identified and selected for further breeding or analysis. This study proposes an integrated protocol combining AI-driven high-throughput screening with precision transposon transgenesis for NF-κB reporter zebrafish for the efficient identification and selection of desired genetic events despite inherent transposon variability.

2. Materials and Methods

2.1. AI and Imaging Systems

The integration of artificial intelligence (AI) with high-content imaging systems has created new possibilities for the transposon-mediated transgenesis of the NFκB eGFP reporter system for zebrafish-based drug discovery. This protocol combines QuantiFish spatial analysis algorithms with Orange data mining workflows to establish a standardized pipeline for tracking tissue-specific NFκB activation patterns across three generations of Tol2-transgenic zebrafish [10,11].
This protocol integrates Quantifish and Orange AI with individualized housing systems (96-well ZF plates for 0–7-dpf and individualized MT tanks for 8–4 mpf) to enhance the efficiency of Tol2-mediated transgenesis across the F0, F1, and F2 generations. The use of Quantifish and Orange software greatly improves the efficiency of our workflow by enabling the rapid, objective, and reproducible quantification and analysis of transgene expression patterns in large numbers of zebrafish, thus expediting both data generation and interpretation. These steps leverage AI-driven imaging with a high-content confocal imager CQ1, predictive modeling, and optimized workflows for high-throughput and reproducible results (Figure 1). In this study, predictive modeling refers to the application of machine learning algorithms (such as Random Forests and neural networks) in Orange to analyze quantitative expression data from transgenic zebrafish. These models are trained to recognize patterns in the data and to accurately predict transgene expression outcomes based on experimental variables and image-derived features.

2.2. Key Components of the Zebrafish Precision System (Figure 1 and Figure 2)

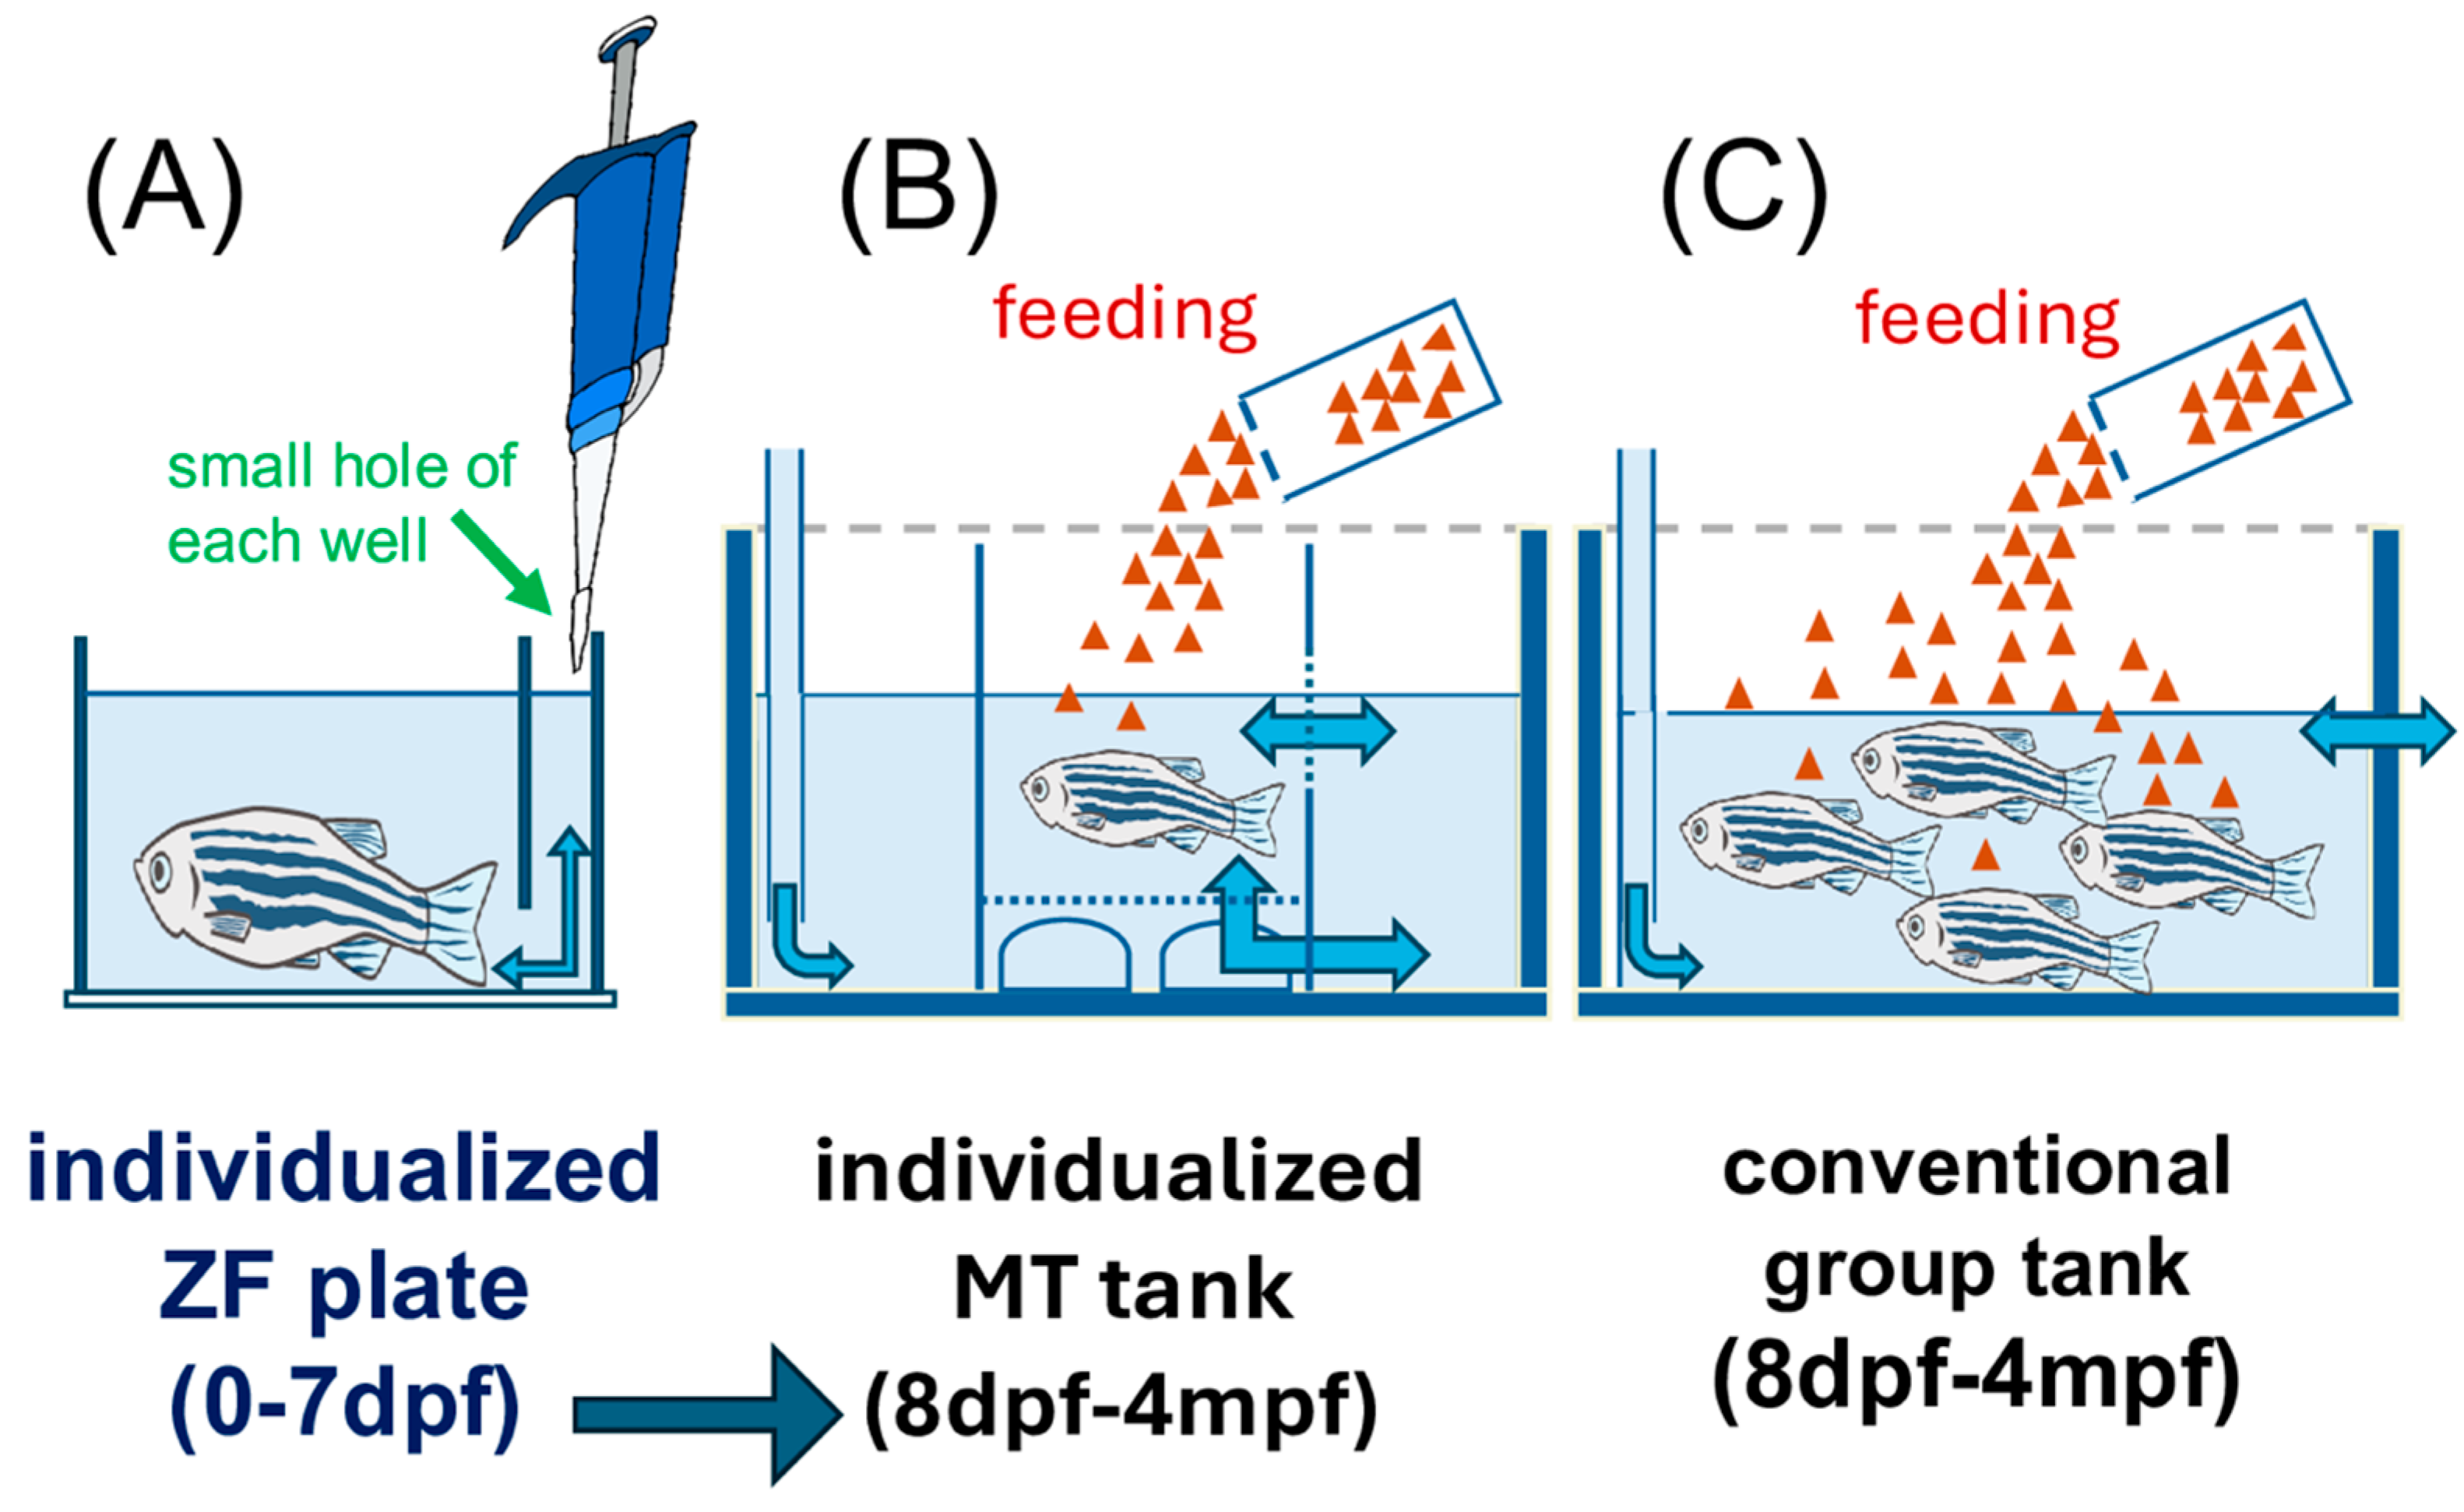
  • ZF Plates (0–7 pdf) enable individualized embryo and larva handling and early fluorescence imaging screening, and using a fine-tipped pipette or aspiration tool, carefully access the small hole at the bottom of each well in the ZF plate. This allows for the removal of excess medium or debris and facilitates subsequent handling or imaging of individual zebrafish embryos in each well. Ensure that the pipette tip is inserted gently through the hole to avoid damaging the embryos. The small hole of each well in the ZF plate is used with an 8-channel pipette to avoid injury or stress in liquid handling, and the solution is removed (Figure 2). ZF plates were purchased from Funakoshi Co., Ltd., Tokyo, Japan [15].
  • High-content imager CQ1, a high-throughput confocal time-lapse imager (Yokogawa Electric Corporation, Tokyo, Japan) [16,17].
  • Individualized MT tanks (8 dpf–4 mpf): There were 24-tanks in the tray to provide precise environmental control for long-term phenotyping and breeding. This is compatible with the ZF plate, which is a 96-well plate for zebrafish fingerlings, and four MT trays are equivalent to one ZF plate (Figure 1 and Figure 2). Acclimate the rearing water in the MT tank by adjusting its temperature and chemical parameters to match those of the main system. Complete this acclimation at least one day prior to introducing zebrafish from the ZF plate. After acclimatization, suck one fish at a time with a p200 pipette with a wide-mouth tip from a ZF plate, and transfer it to a tank in the MT tank filled with rearing water from the receiving system. The zebrafish are fed paramecia (raw feed) from the day of entry. Feed only paramecia (raw feed) for the first month after the start of feeding twice daily using a syringe or pipette to dispense 2 mL per tank at a time. Feed powder food from 2mpf using a sprinkle container for feeding adult fish. The MT tanks were custom-made at the Systems Pharmacology Laboratory, Mie University Graduate School of Medicine, Mie, Japan. The individualized MT tanks were constructed using transparent polycarbonate or acrylic, with internal dimensions approximately 5.5 cm (diameter) × 8.0 cm (height), resulting in a water capacity of 100 mL per tank.
  • Quantifish (https://biii.eu/quantifish (accessed on 7 May 2025).) automated the imaging and quantification of eGFP expression [10].
  • Orange (https://orangedatamining.com/ (accessed on 12 May 2025).) analyzes phenotypic data, predicts transgene stability, and optimizes experimental parameters [11].
  • One-cell stage zebrafish embryos were microinjected with a mixture containing the NFκB: eGFP reporter construct and in vitro-transcribed Tol2 transposase mRNA. Following injection, embryos were individually transferred into the wells of a 96-well ZF plate and incubated at 28.5 °C. At 5 days post-fertilization, each larva was imaged using an automated confocal high-content imager (CQ1). Image analysis was performed using the Quantifish software, which provided automated detection, segmentation, and quantification of eGFP fluorescence within defined anatomical regions of interest. Quantitative data outputs were further analyzed in Orange to assess transgene expression patterns and efficiencies across experimental groups.
  • Zebrafish strains. AB (wild-type fish) and albino (slc45a2b4) for retinal imaging were purchased from the Zebrafish International Resource Center (ZIRC), 5274 University of Oregon Eugene, OR 97403-5274, USA [18]. The zebrafish were incubated at 28 °C under a 14 h (7:00–21:00) light:10 h (21:00–7:00) dark cycle in environmental quality water, as previously described [19].

2.3. F0 Generation Protocol (Figure 1 and Figure 2)

Objective: To generate mosaic founders with transient transgene expression for germline transmission.

2.3.1. Preparation of Injection Mixture for Tg (6xNFκB:eGFP)

A Tol2-flanked DNA construct was used, containing NFκB response elements upstream of a minimal promoter driving eGFP, and codon-optimized Tol2 transposase mRNA (~25 ng/μL) was used to improve integration efficiency. The NFκB:eGFP reporter plasmid (pNF-kB-eGFP; Addgene plasmid #44922), containing a minimal promoter with NF-κB response elements, was used for microinjection. Tol2 transposase mRNA was synthesized in vitro from a helper plasmid containing the full-length Tol2 coding sequence, prepared according to published protocols [2].

2.3.2. Microinjection

Inject approximately 1–2 nL of the mixture into one-cell stage embryos using automated microinjection systems to minimize variability and mosaicism. Microinjection of the NFκB reporter construct and Tol2 transposase mRNA was performed at the one-cell stage using an Eppendorf Femtojet, automated microinjection system, following the manufacturer’s recommended protocols. Microinjections were performed on one-cell stage zebrafish embryos using a micromanipulator (Narishige PC-10) mounted on a stereomicroscope (Nikon P-DSL32) equipped with a microinjector system (Eppendorf FemtoJet 4i).

2.3.3. Screening in ZF Plates (Figure 1 and Figure 2)

Place injected embryos individually into 96-well ZF plates up to 7-dpf filled with 0.3× Danieau’s solution (19.3 mM NaCl, 0.23 mM KCl, 0.13 mM MgSO, 0.2 mM Ca(NO3)2, 1.7 mM HEPES, and pH 7.2). Remove as much of the rearing water as possible from the small hole of each well in the ZF plate with an 8-channel pipette.
Add 50 μL of 0.15% 2-Hydroxyethylagarose with 0.01% Tricaine (MS-222) at room temperature per well by 8-channel pipettes (also known as an 8-channel multichannel micropipette) to simultaneously transfer embryos or reagents across multiple wells in the 96-well ZF plate. Change the agarose concentration as necessary because agarose changes its firmness with room temperature.
One-cell stage embryos (approximately 0–1 h post-fertilization) were collected immediately after fertilization and individually transferred to the wells of a 96-well ZF plate for subsequent growth and imaging.
Use Quantifish for high-throughput CQ1 confocal quantitative imaging, bright-field imaging for morphological assessment, and fluorescence imaging to quantify GFP intensity across tissues. Select embryos with uniform eGFP expression for further development. At this time, be careful not to prolong the imaging time for anesthesia-sensitive systems. Fluorescence images were analyzed using Quantifish (v2.1.2), an open-source platform that utilizes machine learning-based segmentation for automated identification of zebrafish larvae and quantification of eGFP fluorescence intensity within designated anatomical regions (e.g., retina, yolk, body). The resulting quantitative datasets were exported and subjected to further statistical and machine learning analysis using Orange (v3-3.37.0), which enables clustering, classification, and predictive modeling of transgene expression patterns across experimental groups. A step-by-step description of image preprocessing, segmentation, region-of-interest extraction, feature quantification, and downstream data integration is provided in the following workflow. Step 1: Importation of CQ1 image files into Quantifish. Step 2: Automated detection of individual larvae and segmentation of relevant anatomical regions. Step 3: Quantitative measurement of eGFP fluorescence intensity within each region. Step 4: Exportation of quantified data for each sample (in .csv format). Step 5: Upload .csv files into Orange data mining software. Step 6: Application of data normalization, clustering, and supervised classification to analyze transgene expression patterns. Step 7: Visualization of results and selection of optimal transgenic founders.

2.3.4. Awakening from Anesthesia

Add 150 ul of 0.3x Danieau’s solution using an 8-channel pipette and mix with anesthetized agarose by gently tapping the ZF plate from the side. Zebrafish larvae were anesthetized in 0.016% tricaine and subsequently embedded in low-melting-point agarose for imaging.
Insert the tip into the small hole of the ZF plate, using a pipette with an 8-serial pipette to avoid injury or stress in liquid handling, and remove the solution.
Repeat this process about 2 times. If agarose cannot be aspirated from the small hole in the ZF plate, insert the tip into the main hole in the well under the microscope and aspirate the agarose, taking care not to suck in the pups.

2.3.5. Raising F0 Founders

Raise selected embryos to adulthood in individualized MT tanks. We aimed to raise at least 30 fish to ensure a sufficient number of potential founders. Each individualized cylindrical MT tank measures 5.5 cm (diameter) × 8.0 cm (height) and has a water volume capacity of approximately 100 mL. These dimensions are sufficient to support the healthy development and normal growth of individual zebrafish from 8 dpf to 4 mpf, in accordance with established zebrafish husbandry guidelines. Each zebrafish larva was individually transferred to a well of the MT tank at 8 days post-fertilization (dpf), where it was raised through the juvenile and adult stages.

2.4. F1 Generation Protocol (Figure 1 and Figure 2)

Objective: Identify single-insertion lines with stable germline transmission.

2.4.1. Breeding

Outcross F0 founders with wild-type zebrafish to produce F1 progeny and screen offspring for eGFP expression using fluorescence CQ1 imaging and Quantifish.

2.4.2. Orange AI

Orange AI was used to cluster eGFP expression data from F1 progeny and predict stable single-insertion lines based on fluorescence intensity patterns. Fluorescence images of zebrafish larvae were analyzed using Quantifish (v2.1.2), an open-source image analysis software that applies machine learning-based segmentation to automatically detect individual larvae, segment relevant anatomical regions (such as retina, yolk, and body), and quantify eGFP fluorescence intensity. The process involved the following steps:
  • Importing CQ1-acquired image files into Quantifish.
  • Automated identification and segmentation of each larva and specified regions of interest.
  • Quantitative extraction of eGFP fluorescence intensity for each segmented region.
  • Exporting the resulting quantitative data in .csv format.
Subsequently, the data were imported into Orange (v3-3.37.0), a machine learning and data mining platform. The following analysis steps were performed in Orange:
  • Data normalization and preprocessing.
  • Application of machine learning algorithms (such as Random Forests and clustering) to classify expression patterns and identify trends.
  • Visualization of results and prediction of optimal transgenic lines based on multivariate fluorescence data.
Solid lines indicate the fixed physical boundaries of wells and tanks, illustrating actual walls and dividers that separate individual fish or groups.
Dashed lines denote optional or removable partitions, which can be inserted as needed during specific procedures (e.g., temporary isolation during solution exchange or sampling). These dividers are not permanent structures.
Semicircles depicted at the bottom of the MT tank indicate shallow, curved grooves specifically designed to facilitate sedimentation and collection of waste particles, making cleaning easier and minimizing disturbance to the fish.”
All terminology in the figure and legend has been updated; previous references to “MA tank” have been corrected to “MT tank” to reflect the accurate system described in the Methods Section.

2.4.3. Validation

Quantitative PCR was performed using the THUNDERBIRD® SYBR® qPCR Mix (TOYOBO, QPS-201) in a final reaction volume of 20 μL per well on a LightCycler 96 instrument (Roche, Basel, Switzerland). The following primers were used (Table 1)):
Thermocycling conditions were 95 °C for 180 s (initial denaturation), followed by 50 cycles of 95 °C for 20 s, 62 °C for 30 s, and 72 °C for 45 s. A dissociation (melting) curve analysis was performed at the end of the amplification protocol to verify specificity. Each sample was analyzed in technical triplicate.
Relative eGFP gene copy number was normalized to the copy number of a reference intergenic genomic region (amplified using the control primer set listed above), which is located in a non-coding locus without annotated genes. Quantification was carried out using the 2−ΔΔCt method [19]. Statistical analyses were performed using the included LightCycler 96 software. Results are reported as mean ± standard error of the mean (SEM) from at least three biological replicates.
Relative gene copy number was normalized to the copy number of a reference intergenic region (a genomic locus without annotated genes) using the 2−ΔΔCt method [19]. Statistical analysis was performed with the LightCycler 96 (Roche) software. Results are presented as mean ± SEM from at least three biological replicates. Confirm single-copy insertions using THUNDERBIRD® SYBR™ qPCR Mix (QPS-201; Toyobo, Osaka , Japan) [20] and select F1 fish with consistent eGFP expression across tissues for further breeding. To verify the accuracy of the real-time PCR, homozygous and heterozygous genomes of the purchased strains were prepared.

2.5. F2 Generation Protocol

Objective: Establish homozygous stable lines for experiments.

2.5.1. Breeding in Individualized MT Tanks (Figure 2)

To verify the accuracy of the real-time PCR, homozygous and heterozygous genomes of the purchased strains were prepared. Validate homozygosity using fluorescence intensity analysis or genotyping techniques like PCR/qPCR.

2.5.2. Phenotypic Validation Test

NFκB:eGFP reporter activity under experimental stimuli such as LPS exposure and use Quantifish for longitudinal monitoring of eGFP expression patterns. Five days post-fertilization (5 dpf), larvae were anesthetized with 0.016% tricaine and placed individually in wells of a glass-bottom 96-well plate containing 0.3×Danieau’s solution (NaCl:17.4 mM, KCl:0.21 mM, MgSO4:0.12 mM, Ca(NO3)2: 0.18 mM, HEPES:1.5 mM,pH:7.6). Bright-field and fluorescence images were acquired using a CQ1 confocal high-content imaging system (Yokogawa Electric, Tokyo, Japan). Images were analyzed with Quantifish software to automatically segment each larva and quantify eGFP fluorescence intensity in defined regions of interest. Quantitative data were exported and further analyzed with Orange software for statistical evaluation and visualization.

2.5.3. Statistical Analysis

All analyses were performed using Microsoft Excel and Orange [10]. Statistical significance was set at 5%,1%, and 0.1% (* p < 0.05, ** p < 0.01, and *** p < 0.001).
This protocol enhanced the efficiency, precision, and scalability of Tol2-mediated transgenesis in zebrafish across all generations (F0–F2) by combining individualized housing systems (ZF plates and MT tanks), codon optimization, and AI-driven tools, such as Quantifish and Orange AI. The protocol establishes the first integrated platform for multi-generational analysis of NFκB dynamics in zebrafish, combining Tol2 transgenesis, precision husbandry, and AI-driven quantification to enable high-resolution studies of inflammatory signaling and drug discovery. The statement is supported by both our current experimental observations—such as describing key results, e.g., the robust induction of NF-κB reporter expression following LPS stimulation by prior studies demonstrating NF-κB pathway responsiveness and transgene expression dynamics in zebrafish models with similar reporter constructs [3]. For example, previous research has established that fluorescent and bioluminescent NF-κB reporter transgenic lines enable real-time and quantitative monitoring of pathway activation in vivo, under both basal and induced conditions [4].

3. Results

3.1. Accuracy, Speed, and Stability in This Precision Zebrafish System

Using Quantifish for automated segmentation and quantification of eGFP fluorescence resulted in highly accurate and reproducible data. In our workflow, AI is incorporated primarily through the use of Orange machine learning software, which applies algorithms such as Random Forests and Neural Networks to classify and predict transgene expression patterns based on image-derived quantitative data. Quantifish automates image processing using classical machine learning and statistical methods for segmentation and quantification. This AI-driven approach significantly reduced manual errors and increased the processing speed compared with traditional methods.
The Orange platform facilitated comprehensive data visualization and statistical analysis, allowing for a rapid comparison of reporter expression levels across different generations and experimental conditions. The use of the high-throughput fluorescence microscopy CQ1 system enabled rapid imaging of zebrafish larvae in 96-well plates. This setup allowed for 35 s/fish orientation time and the analysis of 800 samples per day, making it ideal for large-scale genetic screens.

3.2. Longitudinal Stability in Individualized MT Tanks

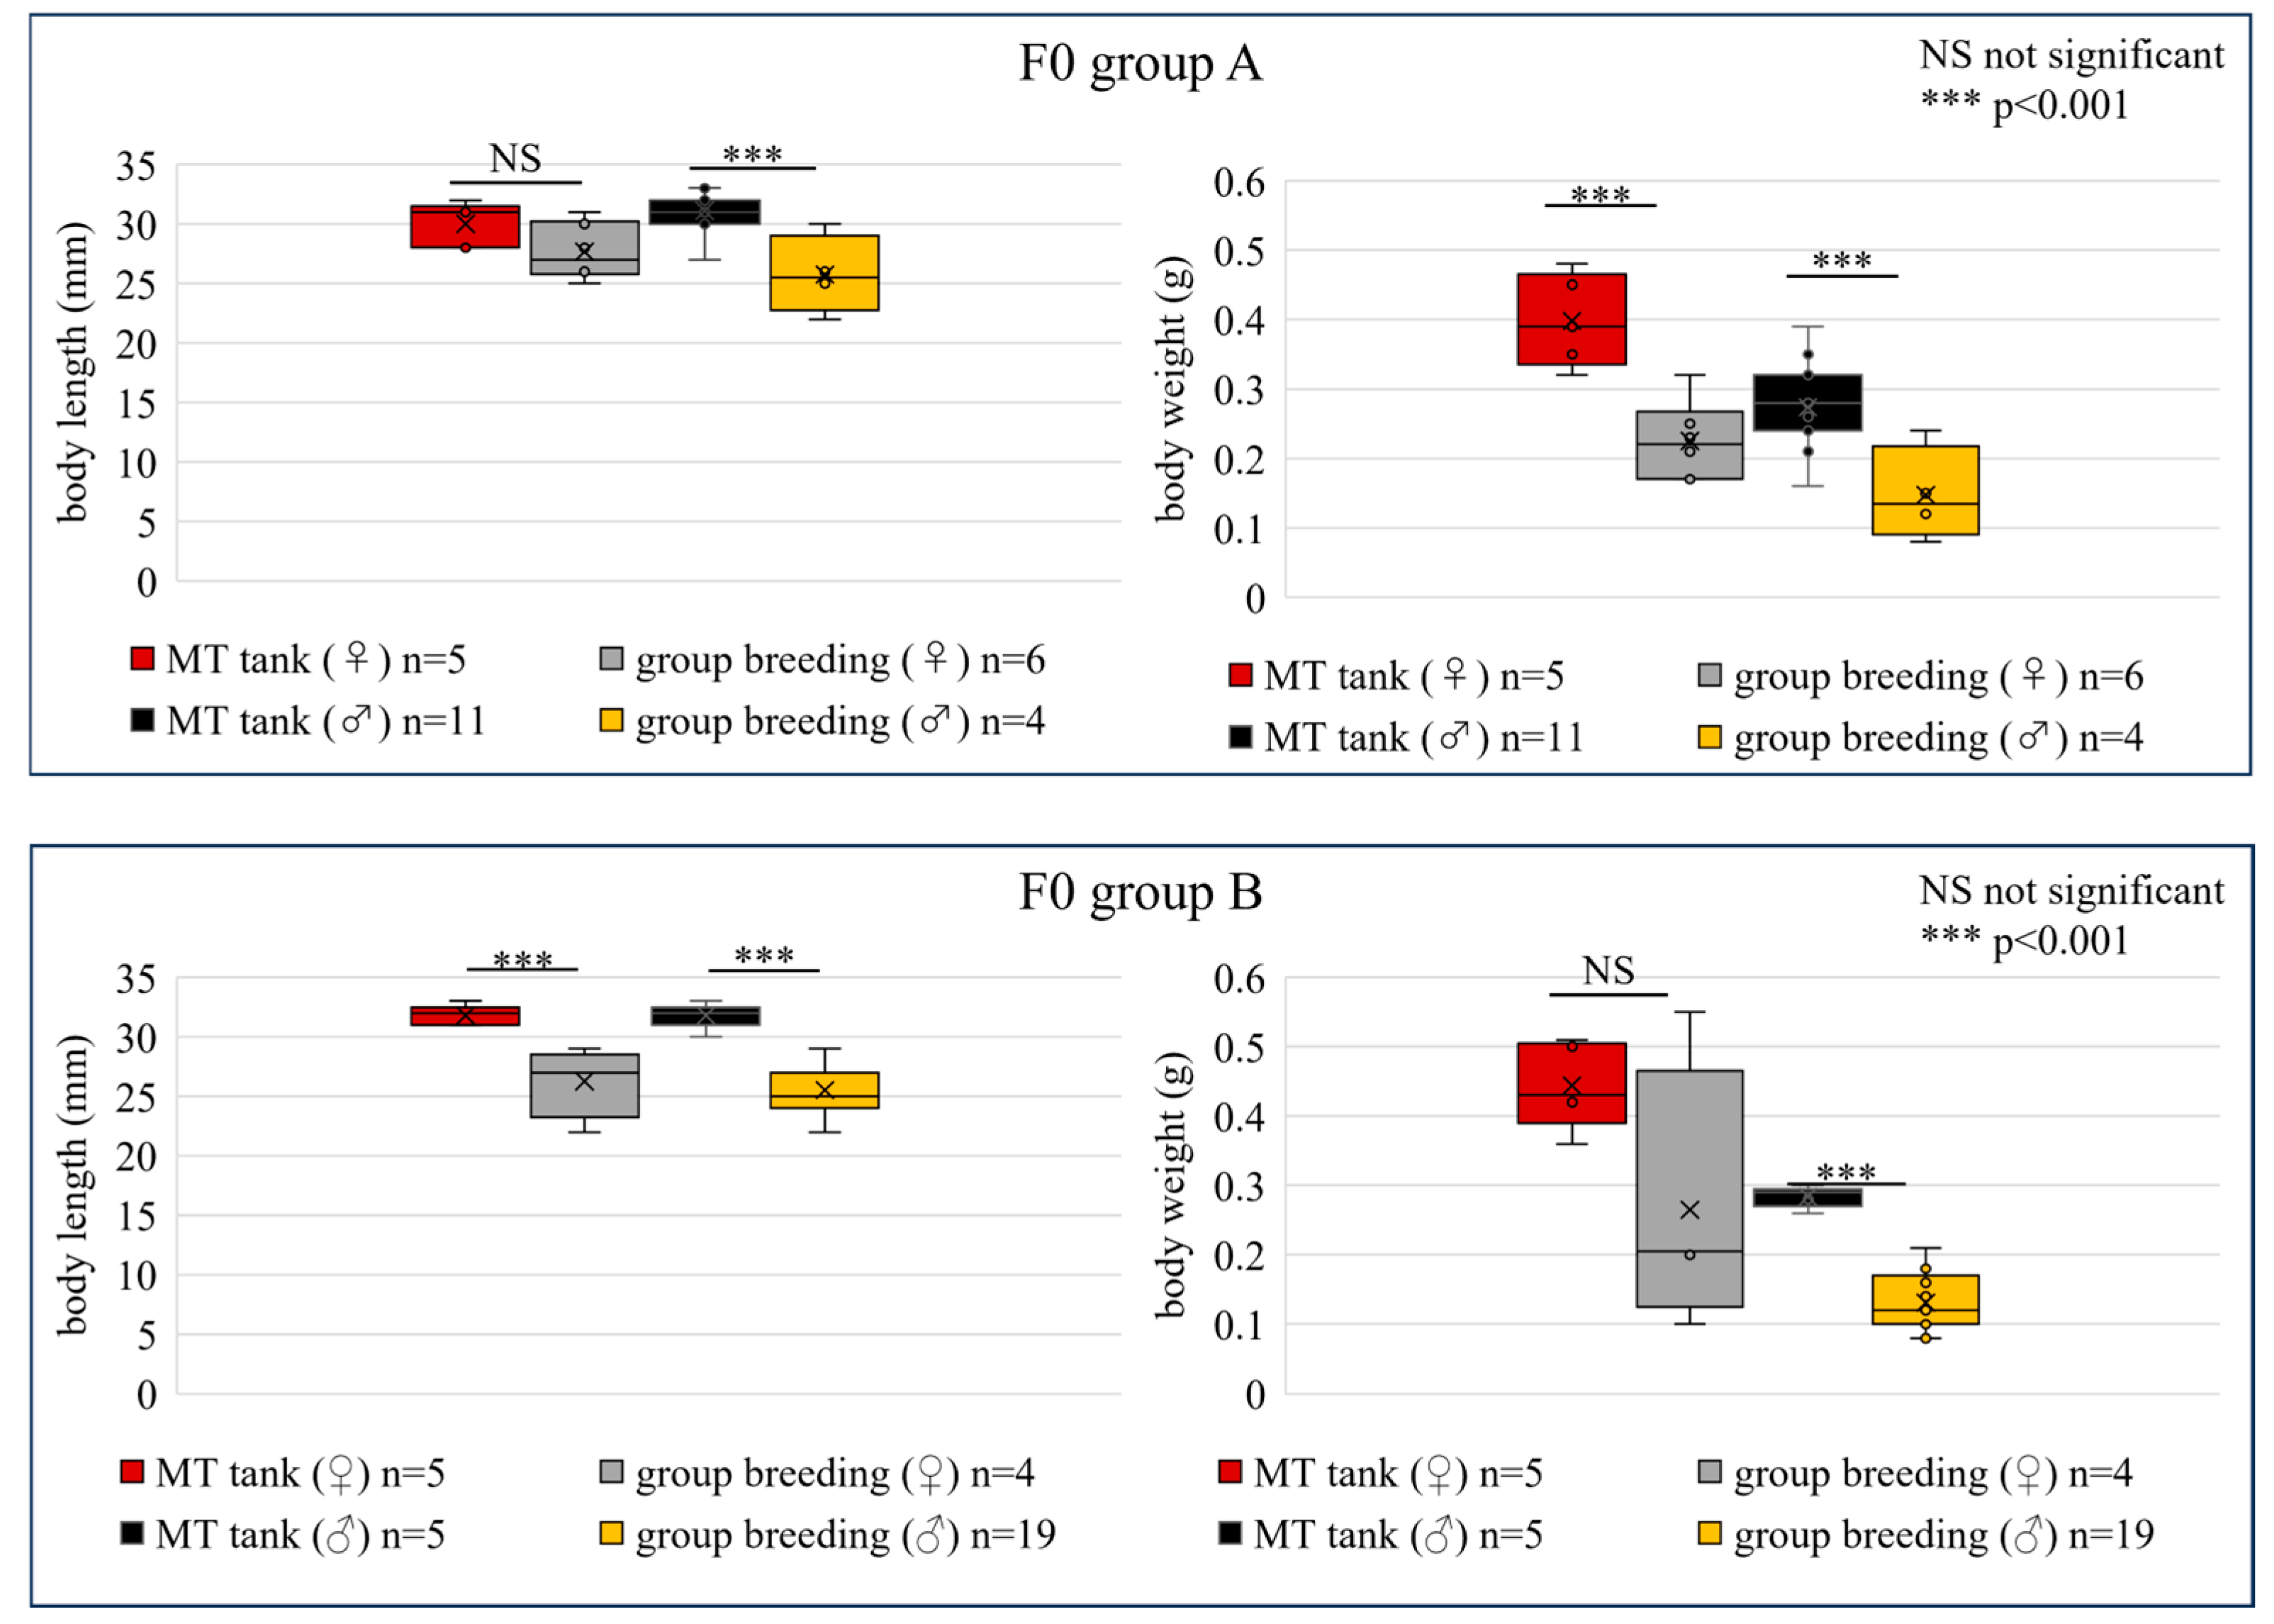
The survival rate of larvae and juveniles maintained in individualized tanks was 60%, which was higher than the 49% survival rate observed in conventional group breeding. Moreover, zebrafish body height and weight in the individualized MT tanks were higher than those in the conventional breeding group (Figure 3). In addition, the variation in body height and weight in individualized tanks was significantly lower than that in conventional group breeding, suggesting uniform feeding of all individual fish (Figure 3).

3.3. AI-Driven CQ1 Image Analysis in the F0 and F1 Generations Accelerates Germline Transmission Efficiency

The integrated CQ1 confocal system with individualized 96-well ZF plates (0–7-dpf) demonstrated 35 s/fish of orientation time and the analysis of 800 samples per day, Z-stack resolution of 2 μm, and scan time/specimen of 45 s, making it ideal for large-scale imaging screens. The processing speed for the Orange data mining was 15 s/sample. This integrated AI-based protocol in the F0 and F1 generations improved the efficiency of germline transmission to 73% compared to 49% without the AI protocol. Application of the AI-based Quantifish and Orange workflow increased the efficiency of germline transmission of the NFκB:eGFP reporter to 73% (n = 11 founders, 8/11 F1 positive) compared to 49% (n = 74 founders, 36/74 F1 positive) using conventional selection methods. Our AI-based imaging and analysis protocol improves the detection of germline transmission of transgenes by enabling high-throughput, quantitative identification of founder fish with successful reporter integration.

3.4. Cluster Analysis in F1 Generation of eGFP Fluorescence Intensity and Copy Number

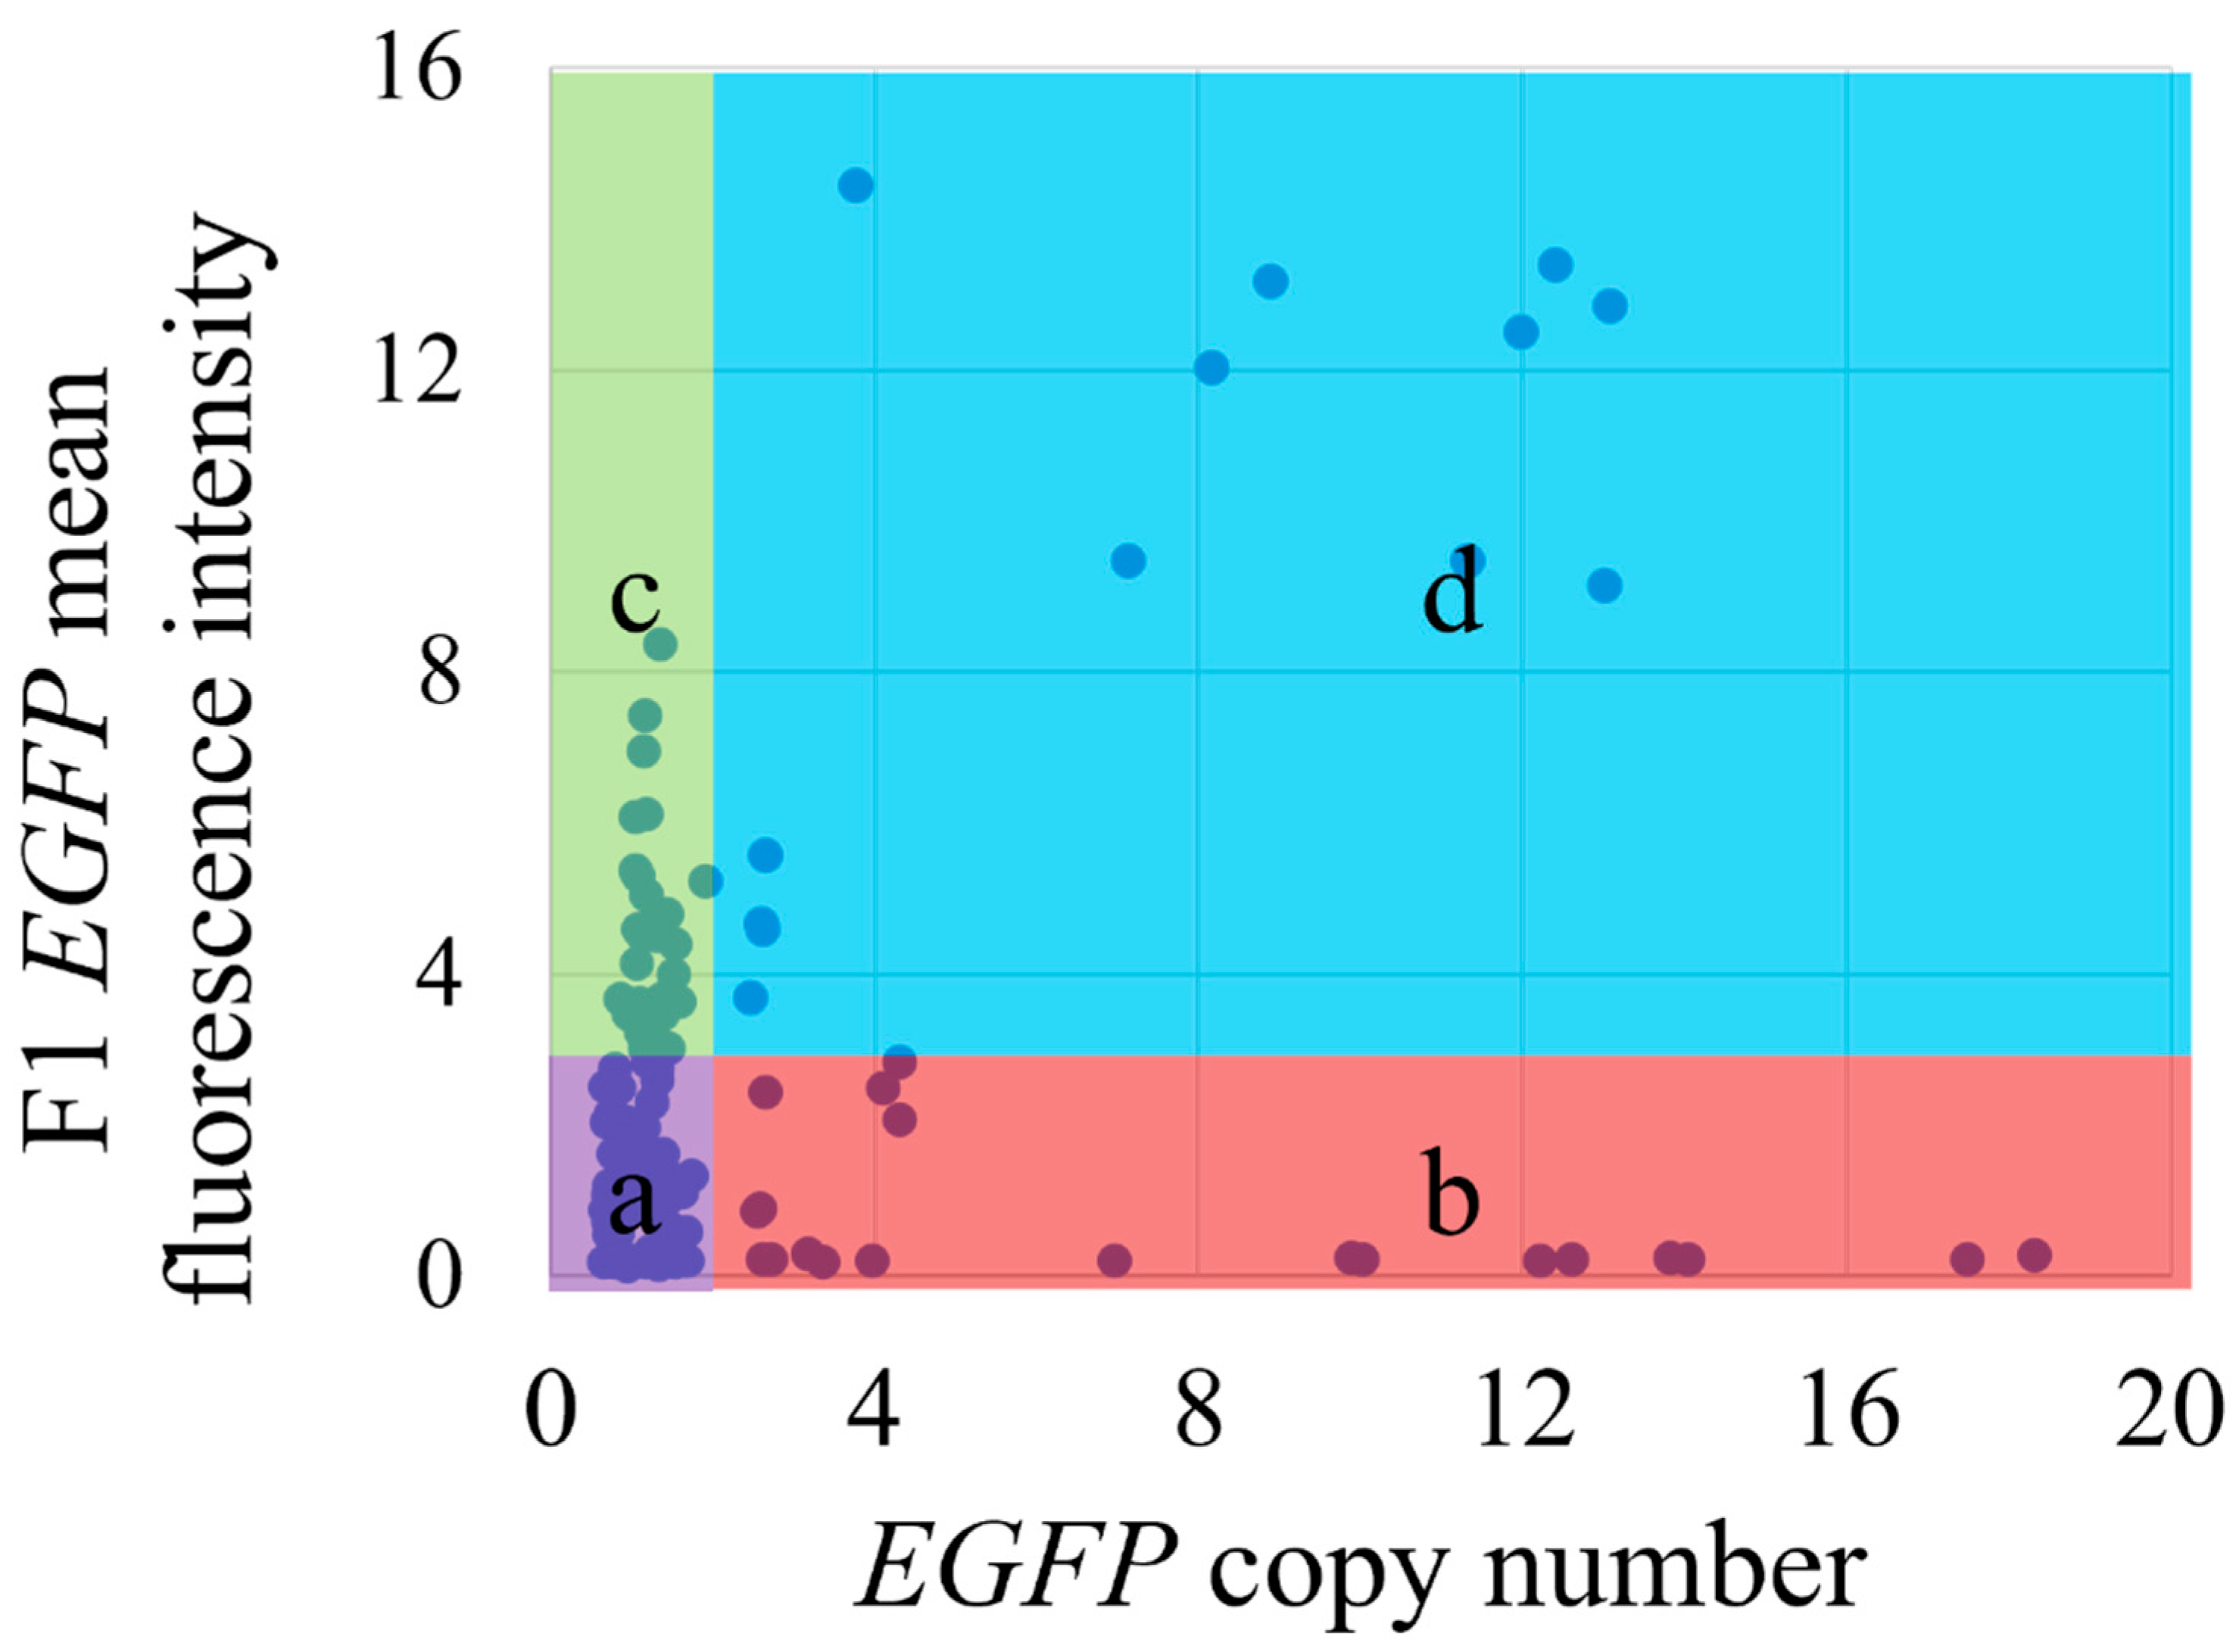
To select the best zebrafish NFκB eGFP reporter for the application purpose, we evaluated not only eGFP fluorescence intensity but also eGFP copy number of each zebrafish NFκB eGFP reporter (Figure 4). Next, we selected Group C, high eGFP fluorescence, and low eGFP copy number for a suitable zebrafish NFκB eGFP reporter (Figure 4).

3.5. LPS-Dependent Zebrafish Retinal NFκB eGFP Reporter

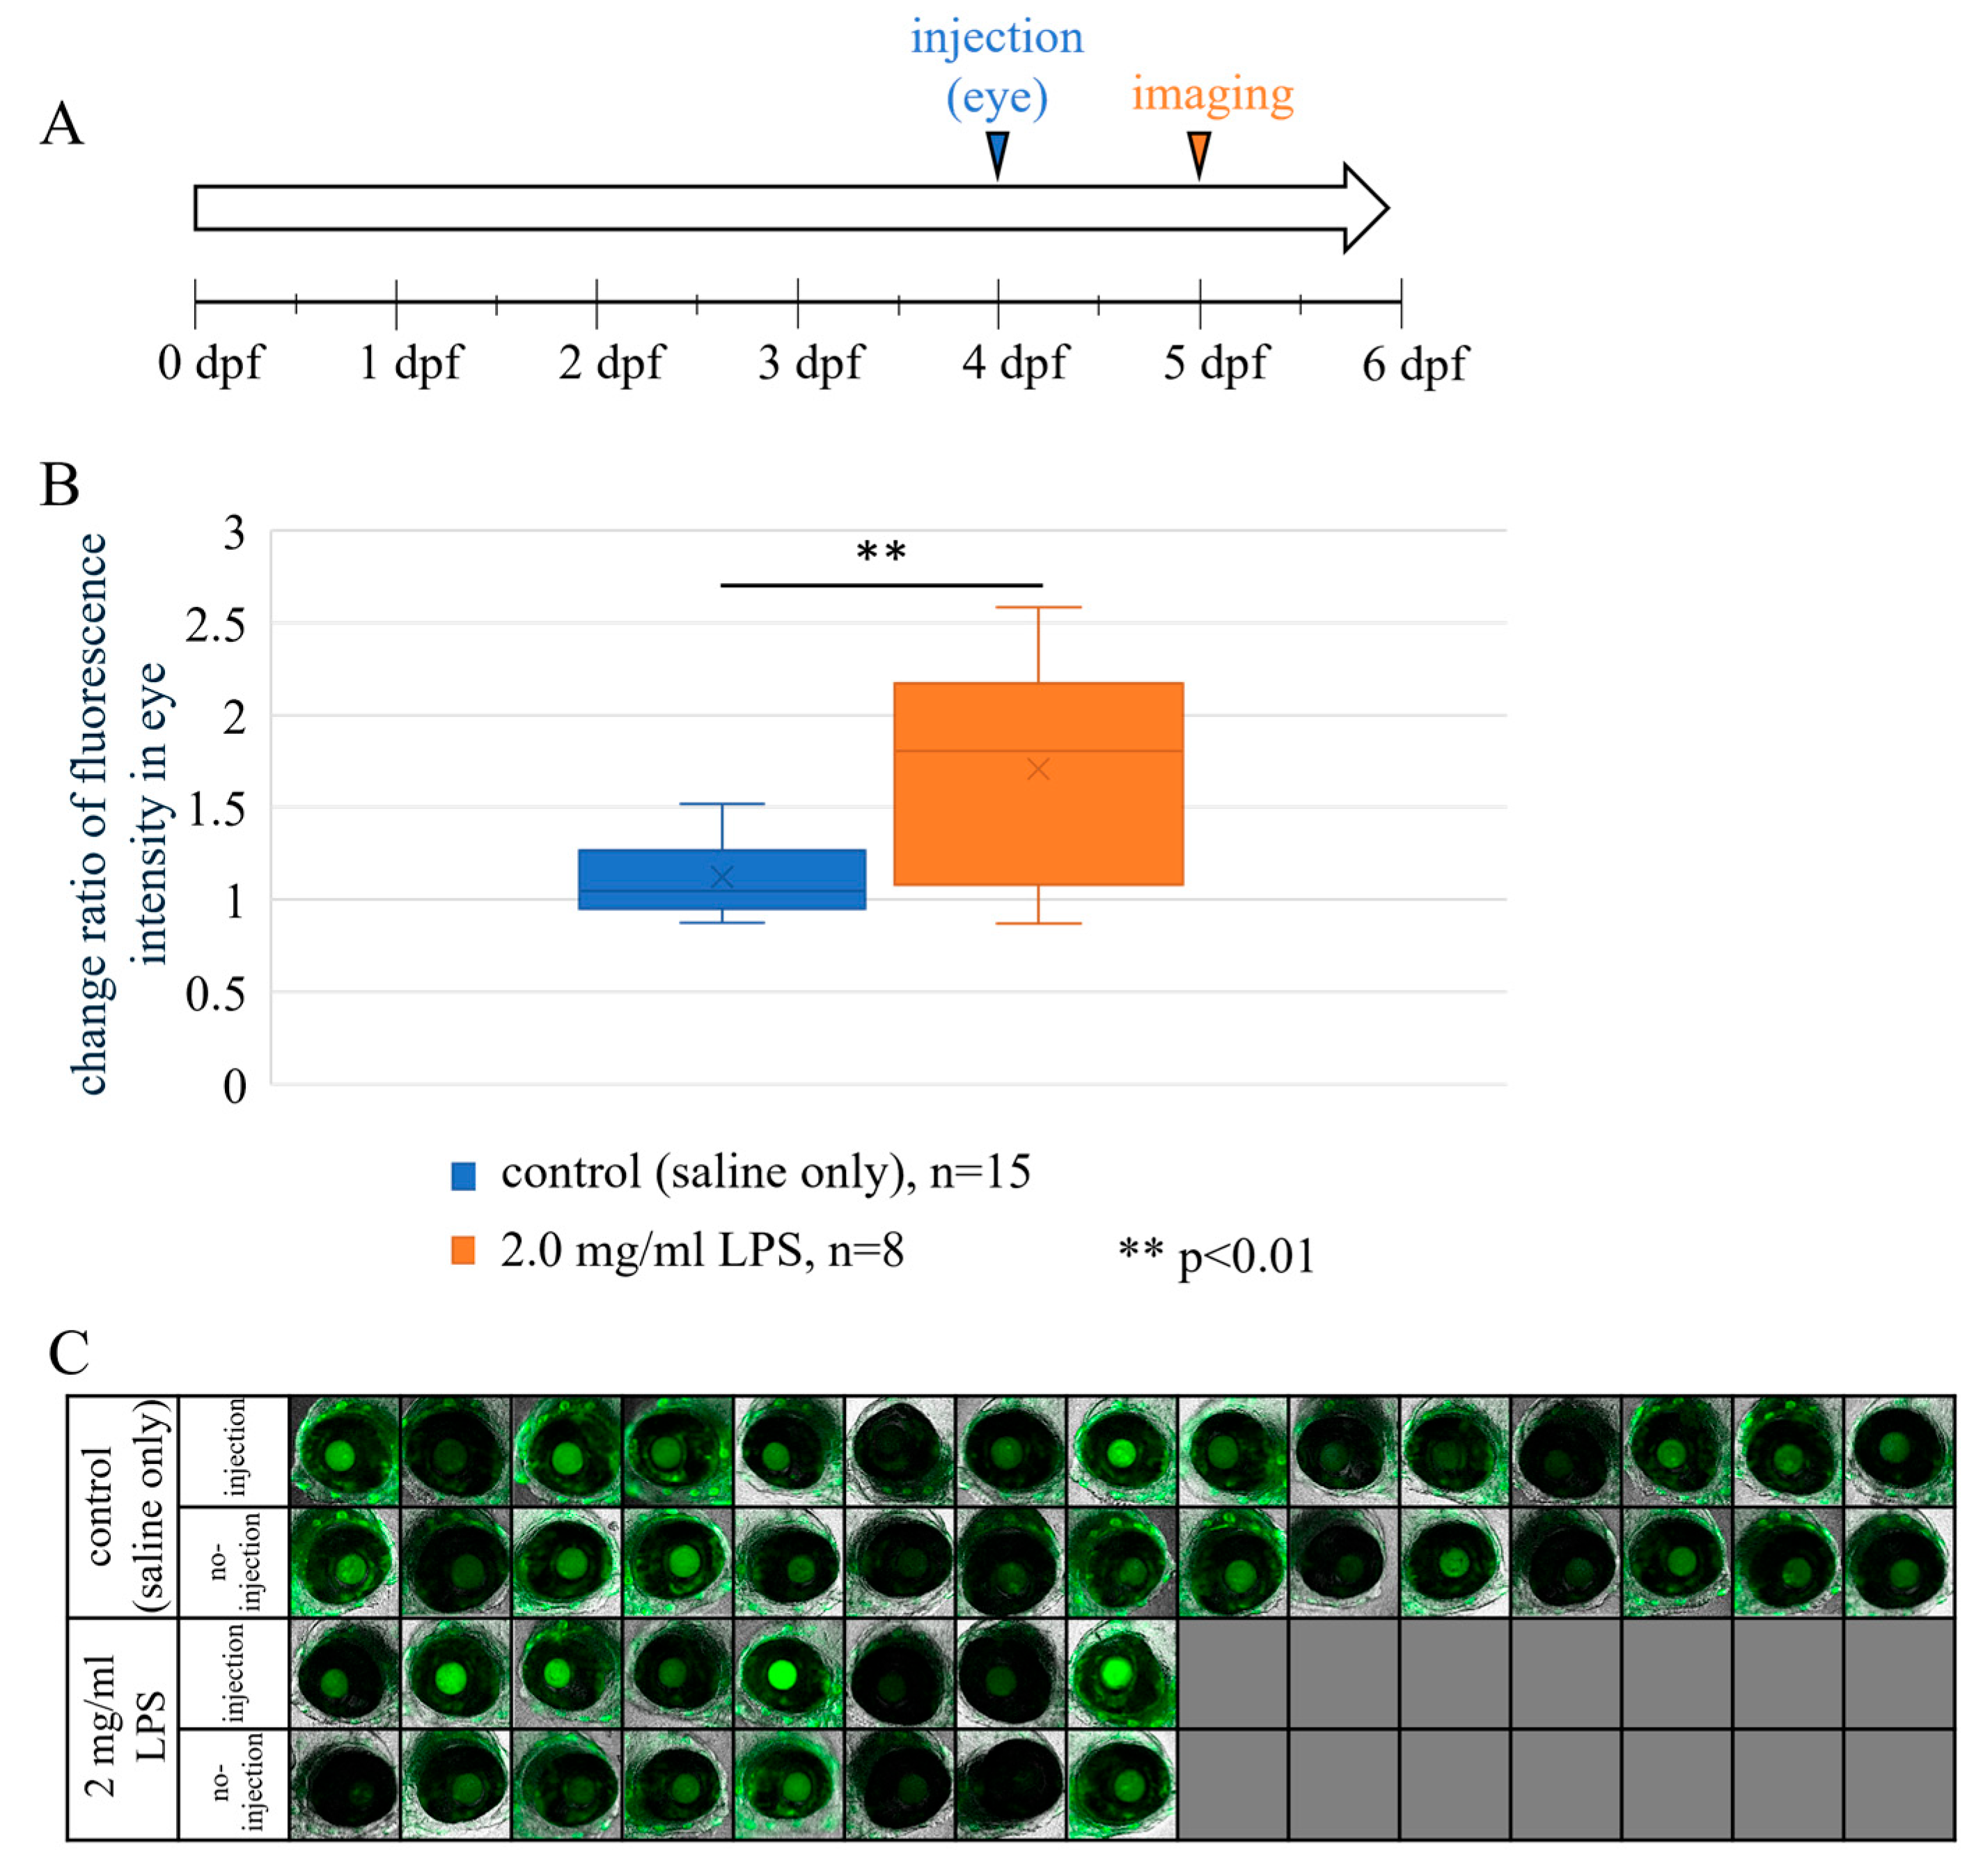
The LPS-dependent NF-κB eGFP reporter system in the zebrafish retina is indispensable for the discovery of modern drugs for various retinal diseases. Its ability to visualize inflammatory dynamics, decode regenerative mechanisms, and accelerate FDA-approved drug repurposing makes it a cost-effective and ethically favorable alternative to traditional models. In addition to the Tol2 transposon system, alternative transgenesis approaches in zebrafish include Sleeping Beauty and PiggyBac transposons, direct DNA/BAC microinjection, retroviral integration, and recombinase-driven systems such as Cre/loxP and Gal4/UAS, each with distinct advantages for creating stable or tissue-restricted transgenic lines. Multiple NF-κB reporter formats, including luciferase-based and dual-reporter constructs, are also available for in vivo pathway analysis. By resolving the interplay between inflammation and regeneration, this AI-enhanced NF-κB:eGFP zebrafish screening platform enables a novel therapeutic strategy for treating retinal diseases. We selected the zebrafish retinal NFκB eGFP reporter, as only a small number of zebrafish in Group C showed detectable NF-κB reporter expression with a high eGFP fluorescence and low eGFP copy number, as shown in Figure 3, using the Orange tissue classifier protocol. Moreover, the LPS-dependent activation of eGFP fluorescence in these retinal zebrafish NFκB eGFP reporter was validated (Figure 5). We clarified in the Methods and Results that Orange analysis was applied to region-specific quantitative fluorescence data generated by Quantifish. For retinal LPS injection experiments, the analysis focused on the retina and adjacent tissues. The results demonstrated that NFκB reporter expression was induced mainly in the retina, with minimal whole-body changes observed following localized LPS administration. Eight founder fish and seven control fish were included in the analysis based on the criteria of survival, health, and reliable detection of NFκB eGFP fluorescence at the relevant stage. Fish that did not meet these criteria were excluded from quantitative analysis to ensure data quality and consistency. The LPS-dependent NF-κB eGFP reporter system in the zebrafish retina offers valuable opportunities for the discovery of drug candidates targeting retinal inflammation and disease mechanisms, as demonstrated in several recent studies [21,22].

3.6. NFκB Decoy Pharmacology of NFκB eGFP Reporter Zebrafish Model System

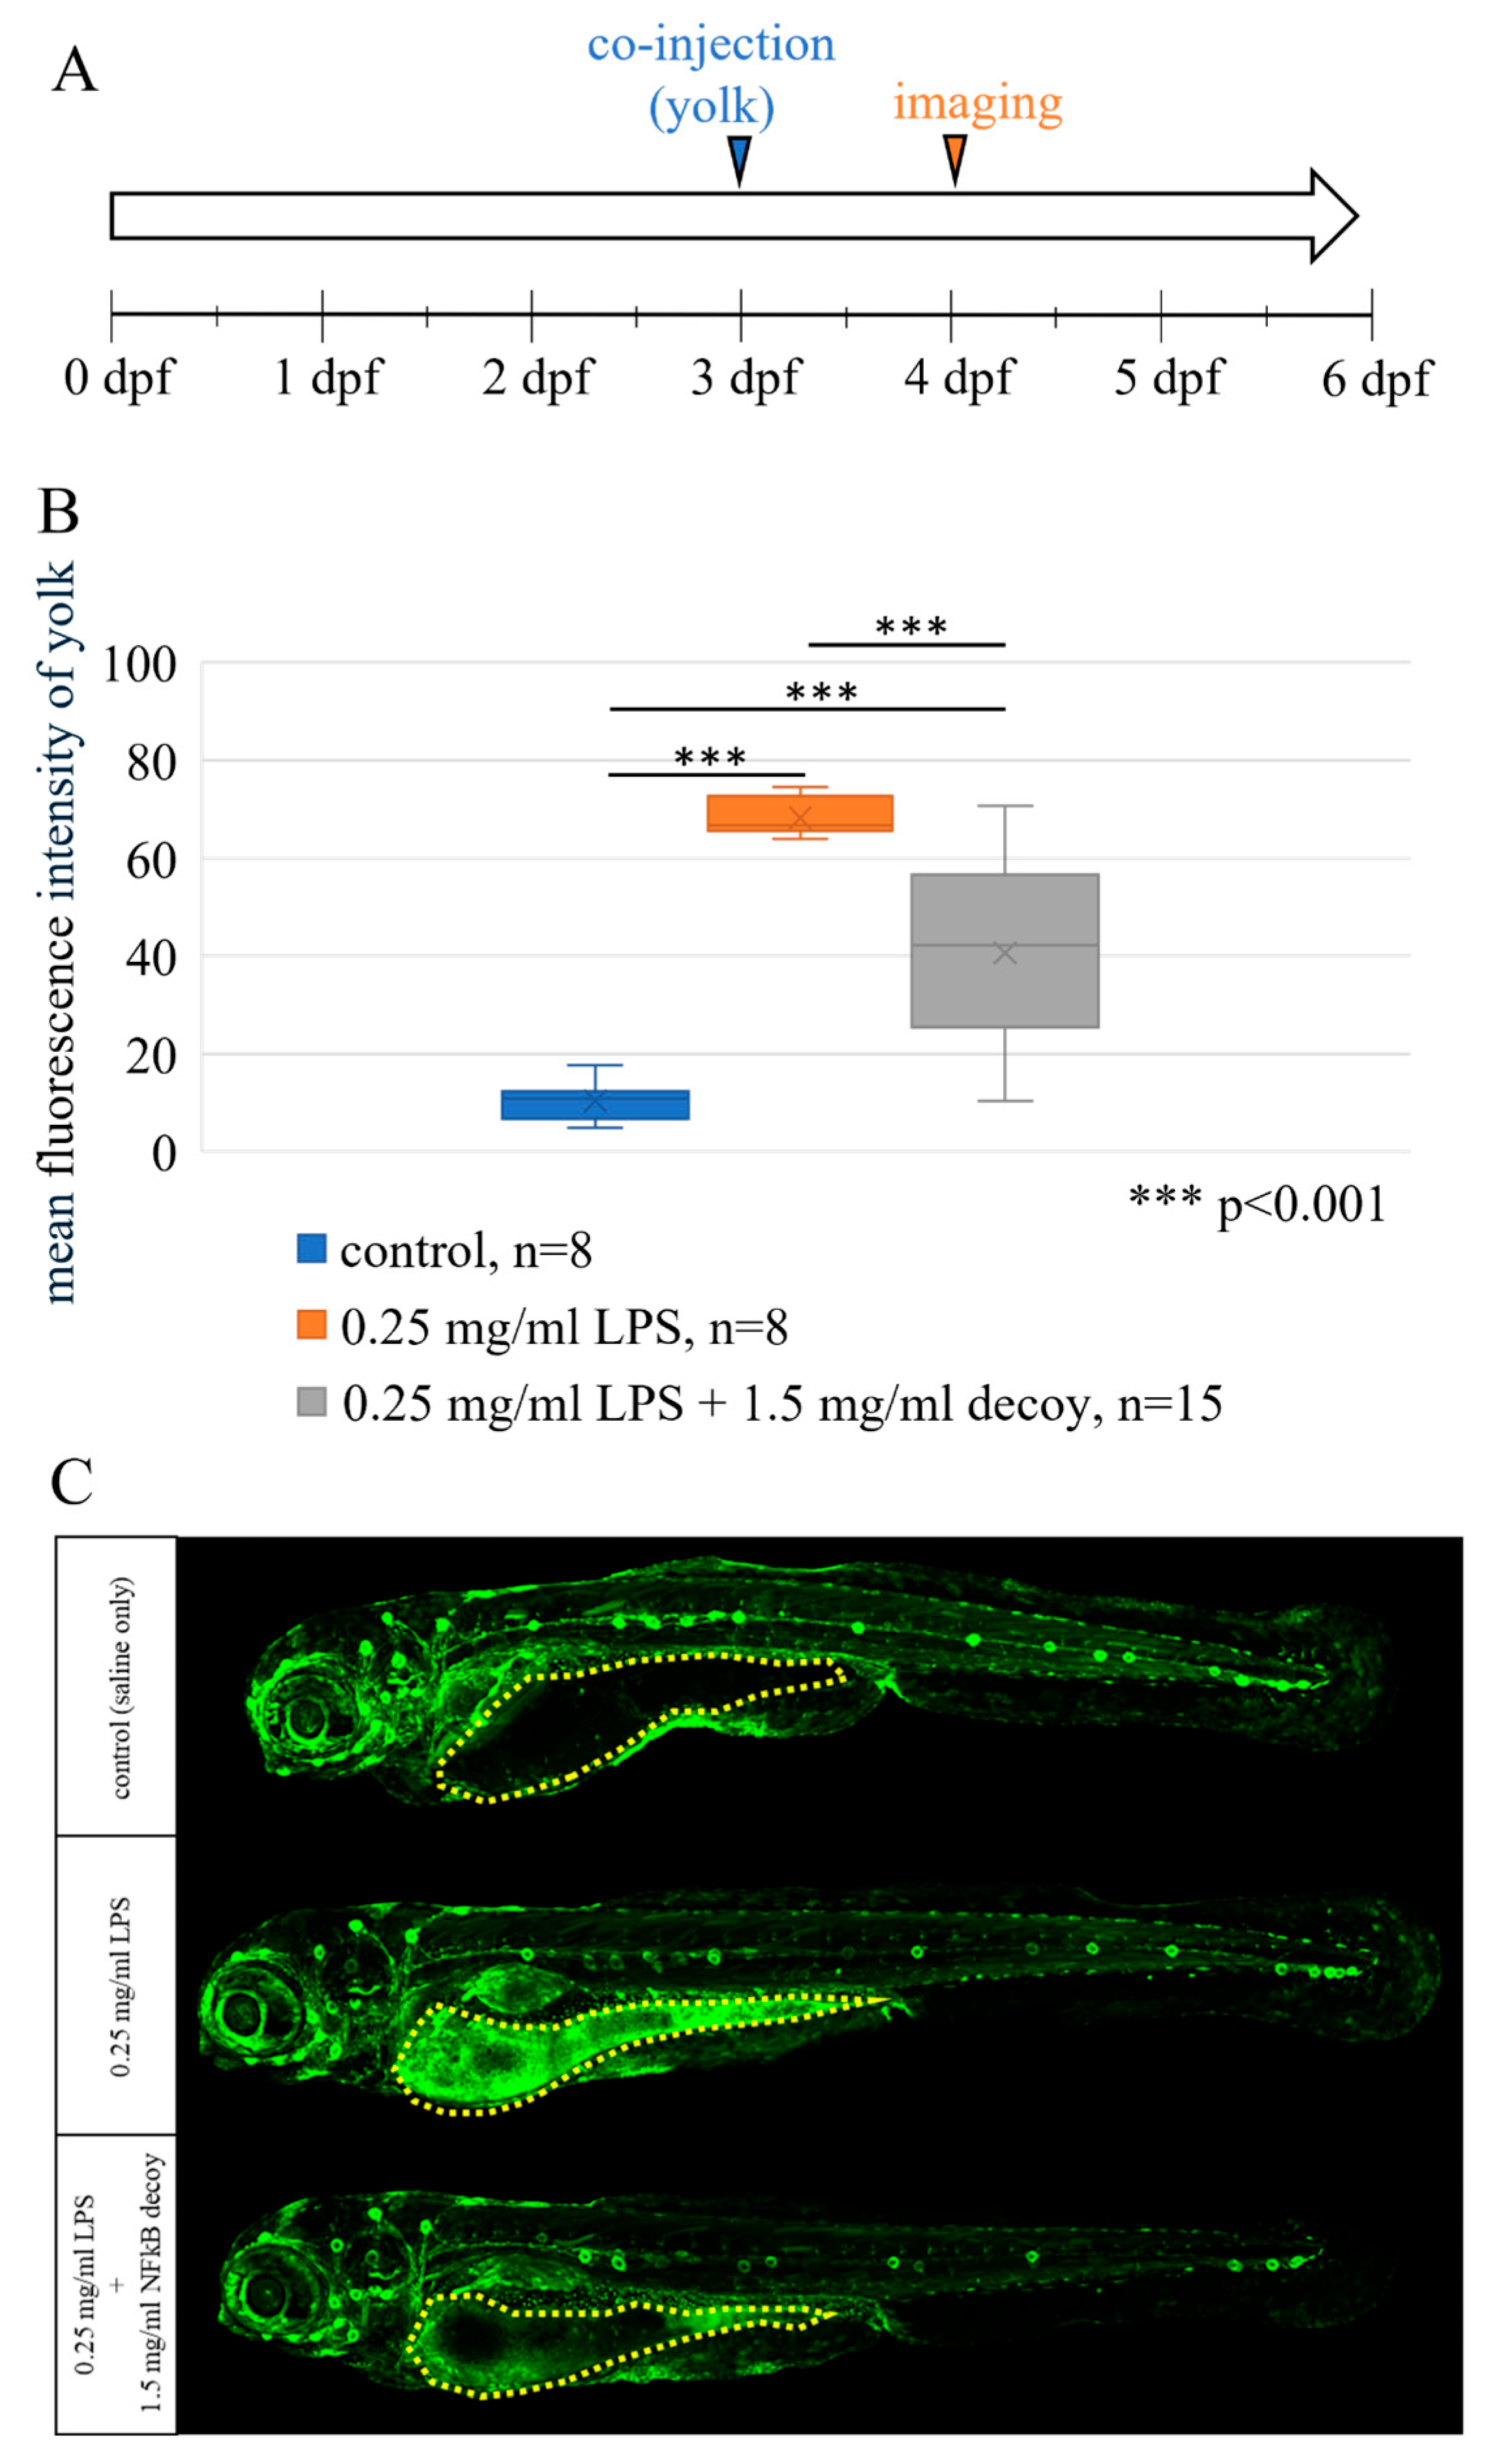
The zebrafish NF-κB:eGFP reporter system has been effectively used in drug discovery research targeting retinal inflammation and degeneration [23]. However, other modalities, such as nucleic acid medicine and NFκB decoy [24], have yet to be reported. In this study, we demonstrated for the first time that LPS-dependent NFκB eGFP fluorescence in the zebrafish model system was significantly suppressed by NFκB decoy (Figure 6). The successful identification of tissue-specific expression using AI-driven analysis in our study supports previous reports on the utility of automated image analysis for accelerating phenotypic drug screening in zebrafish [24]. This model remains indispensable for decoding NF-κB biology and for accelerating the therapeutic development of multiple modalities across diverse disease areas. To illustrate the cellular resolution of our platform, we selected a founder that demonstrated strong yolk NF-κB activation after LPS injection. This individual provided clear morphological and quantitative contrasts with and without decoy administration. To assess reproducibility and inter-individual variation, we performed high-throughput Orange analysis on multiple founders and controls. This broader evaluation confirmed that LPS-induced yolk NF-κB activation was consistently observed across independent founders and was attenuated by decoy co-injection, although some degree of variation in absolute fluorescence intensity was noted between individuals. These findings support the generalizability of our results while justifying the use of representative imaging for detailed mechanistic illustration.

4. Discussion

A novel AI-based protocol utilizing Quantifish and Orange for analyzing the NFκB eGFP reporter system in zebrafish represents a significant advancement in high-throughput image analysis and precision transgenesis [25]. This approach combined the efficiency of Tol2-mediated transgenesis with the accuracy and speed of AI-driven image analysis, leveraging individualized 96-well ZF plates and customized MT tanks to enhance experimental precision control and reproducibility.

4.1. Advantages over Traditional Methods of This AI-Driven Analysis Protocol

Similar to the ARQiv method, which uses microplate readers for the high-throughput screening of reporter expression in zebrafish, this protocol leverages AI for enhanced precision and speed [26,27]. However, the incorporation of Quantifish and Orange offers advanced capabilities for tissue-specific analysis and data visualization, complementing existing high-content imaging approaches.

4.1.1. Accuracy and Speed

Quantifish and Orange enabled the rapid and precise quantification of eGFP fluorescence, reducing manual errors and increasing processing speed compared with traditional methods. This is particularly beneficial for large-scale genetic screening, where high-throughput is crucial.

4.1.2. Throughput

The high-throughput imaging system, combined with AI-driven analysis, allowed for the rapid processing of 800 samples per day. This capacity is comparable to that of other high-throughput methods, such as ARQiv, which uses microplate readers for reporter quantification [21,22] but offers enhanced spatial resolution and tissue-specific analysis.

4.1.3. Tissue-Specific Analysis

The protocol provides detailed spatial analysis of reporter expression, allowing researchers to study NFκB activity in specific tissues. This level of detail is essential for understanding complex biological processes and is superior to methods that only provide quantitative data without a spatial context. In this study, we have established a retinal NFκB eGFP reporter system in zebrafish that combines the efficiency of Tol2-mediated transgenesis with the accuracy and speed of AI-driven image analysis.

4.2. Multimodalities in the Therapeutic Development of NFκB eGFP Reporter Zebrafish Model System

The NFκB eGFP reporter zebrafish model system has revolutionized many low molecular weight drug discoveries [11]. However, this zebrafish model system is not always useful with insoluble drugs such as thalidomide or higher molecular weight therapeutics, and we have overcome this kind of difficulty by yolksac injection [28]. Moreover, other modalities, such as nucleic acid medicine, which has a relatively higher molecular weight, have not yet been reported. In this study, we demonstrated for the first time that LPS-dependent NFκB eGFP fluorescence in the zebrafish model system was significantly suppressed by NFκB decoy [24] (Figure 6). The observed non-uniform suppression of NFκB-driven GFP expression across embryonic regions in Figure 6 likely reflects a combination of biological and technical factors. Biologically, tissue-specific differences in NFκB decoy accessibility and the distinct spatiotemporal patterns of NFκB pathway activity during zebrafish development may contribute to differential suppression effects. Technically, microinjection variability and mosaicism inherent to Tol2-mediated transgenesis may further influence regional uniformity. Future studies incorporating region-specific quantification using our AI-driven image analysis pipeline would strengthen the interpretation of these suppression patterns [29]. This model remains indispensable for decoding NF-κB biology and for accelerating the therapeutic development of multiple modalities such as antibody medicine across diverse disease areas.

5. Conclusions

The integration of AI tools, such as Quantifish and Orange, into the precision analysis of Tol2-mediated transgenesis in zebrafish enhances the accuracy, speed, and throughput of reporter expression analyses. This approach supports high-quality research in zebrafish-based drug discovery, offers significant advantages over traditional methods, and complements other high-throughput screening technologies for drug discovery [6,11].

Author Contributions

Conceptualization, T.T. and S.K.; methodology, Y.I., A.M., K.S., T.N., and F.T.; software, A.S., Y.I., A.M., and K.S.; validation, K.N., S.M., Y.K., and Y.S.; investigation, A.M., K.S., K.N., S.M., Y.K., Y.S., and A.S.; formal analysis, Y.I., A.S., F.T., T.N., and S.K.; resources, A.M., K.S., K.N., S.M., Y.K., and Y.S.; data curation, T.N., S.K., and Y.I. All authors have read and agreed to the published version of the manuscript.

Funding

This study received no external funding.

Institutional Review Board Statement

The experiments followed the Ethical Principles of Animal Experimentation and were approved on 30 April 2024 by the Ethics Committee on the Use of Animals of Mie University (2020-23-re2-v1) in accordance with the Ethical Principles of Animal Experimentation.

Informed Consent Statement

Not applicable.

Data Availability Statement

The raw data supporting the conclusions of this study will be made available by the authors upon request.

Acknowledgments

This work was conducted at the Systems Pharmacology Laboratory of the Department of Systems Pharmacology at Mie University Graduate School of Medicine and Medical Zebrafish Research Center. We would like to thank Editage (www.editage.jp) for English language editing.

Conflicts of Interest

Y.I., T.N., and S.K. are employed by Transgenic Inc. The remaining authors declare no conflict of interest. The company had no role in the design of the study; in the collection, analyses, or interpretation of data; in the writing of the manuscript, or in the decision to publish the results.

References

  1. Zon, L.I.; Peterson, R.T. In vivo drug discovery in the zebrafish. Nat. Rev. Drug. Discov. 2005, 4, 35–44. [Google Scholar] [CrossRef]
  2. Rajpurohit, S.K.; Ouellette, L.; Sura, S.; Appiah, C.; O’Keefe, A.; McCarthy, K.; Kandepu, U.; Ye Mon, M.; Kimmerling, K.; Arora, V.; et al. Development of a Transparent Transgenic Zebrafish Cellular Phenotype Tg(6xNF-kB:EGFP); Casper(roy-/-, nacre-/-) to Study NF-kB Activity. Biomedicines 2023, 11, 1985. [Google Scholar] [CrossRef]
  3. Kawakami, K.; Shima, A.; Kawakami, N. Identification of a functional transposase of the Tol2 element, an Ac-like element from the Japanese medaka fish, and its transposition in the zebrafish germ lineage. Proc. Natl. Acad. Sci. USA 2000, 97, 11403–11408. [Google Scholar] [CrossRef]
  4. Kuri, P.; Ellwanger, K.; Kufer, T.A.; Leptin, M.; Bajoghli, B. A high-sensitivity bi-directional reporter to monitor NF-κB activity in cell culture and zebrafish in real time. J. Cell Sci. 2017, 130, 648–657. [Google Scholar] [CrossRef]
  5. Kanther, M.; Sun, X.; Mühlbauer, M.; Mackey, L.C.; Flynn, E.J.; Bagnat, M.; Jobin, C.; Rawls, J.F. Microbial colonization induces dynamic temporal and spatial patterns of NF-κB activation in the zebrafish digestive tract. Gastroenterology 2011, 141, 197–207. [Google Scholar] [CrossRef] [PubMed]
  6. Patton, E.E.; Zon, L.I.; Langenau, D.M. Zebrafish disease models in drug discovery: From preclinical modelling to clinical trials. Nat Rev Drug Discov. 2021, 20, 611–628. [Google Scholar] [CrossRef] [PubMed]
  7. Banerjee, S.; Leptin, M. Systemic response to ultraviolet radiation involves induction of leukocytic IL-1β and inflammation in zebrafish. J Immunol. 2014, 193, 1408–1415. [Google Scholar] [CrossRef]
  8. Icha, J.; Weber, M.; Waters, J.C.; Norden, C. Phototoxicity in live fluorescence microscopy, and how to avoid it. Bioessays 2017, 39, 1700003. [Google Scholar] [CrossRef]
  9. Stirling, D.R.; Suleyman, O.; Gil, E.; Elks, P.M.; Torraca, V.; Noursadeghi, M.; Tomlinson, G.S. Analysis tools to quantify dissemination of pathology in zebrafish larvae. Sci Rep. 2020, 10, 3149. [Google Scholar] [CrossRef]
  10. Demšar, J.; Curk, T.; Erjavec, A.; Gorup, Č.; Hočevar, T.; Milutinovič, M.; Možina, M.; Polajnar, M.; Toplak, M.; Starič, A.; et al. Orange: Data mining toolbox in Python. J. Mach. Learn. Res. 2013, 14, 2349–2353. [Google Scholar]
  11. Dash, S.N.; Patnaik, L. Flight for fish in drug discovery: A review of zebrafish-based screening of molecules. Biol Lett. 2023, 19, 20220541. [Google Scholar] [CrossRef]
  12. Suster, M.L.; Kikuta, H.; Urasaki, A.; Asakawa, K.; Kawakami, K. Transgenesis in zebrafish with the Tol2 transposon system. Methods Mol. Biol. 2009, 561, 41–63. [Google Scholar] [PubMed]
  13. Mosimann, C.; Puller, A.C.; Lawson, K.L.; Tschopp, P.; Amsterdam, A.; Zon, L.I. Site-directed zebrafish transgenesis into single landing sites with the phiC31 integrase system. Dev. Dyn. 2013, 242, 949–963. [Google Scholar] [CrossRef] [PubMed]
  14. Gut, P.; Reischauer, S.; Stainier, D.Y.R.; Arnaout, R. Little fish, big data: Zebrafish as a model for cardiovascular and metabolic disease. Physiol Rev. 2017, 97, 889–938. [Google Scholar] [CrossRef] [PubMed]
  15. Funakoshi Co. Ltd ZF Plate 96-Well Microplate Specifications. Product Code: ZF-96-BLK-G. Tokyo, Japan. 2022. Available online: https://www.funakoshi.co.jp/contents/63672 (accessed on 19 August 2025).
  16. Yokogawa Electric Corporation CQ1 High-Content Analysis System Technical Specifications. IMSOL Technical Documentation 2022; v3.1.2. Available online: https://www.yokogawa.co.jp/solutions/products-and-services/life-science/high-content-analysis/cellvoyager-cq1/#%E8%A9%B3%E7%B4%B0 (accessed on 19 August 2025).
  17. Nomoto, T.; Mori, A.; Yamada, K.; Terami, F.; Shimizu, A.; Tanaka, T. In vivo assessment of individual and total proteinuria in zebrafish larvae using the solvatochromic compound ZMB741. Chem. Biomed. Imaging 2024, 2, 755–764. [Google Scholar] [CrossRef]
  18. Westerfield, M. The Zebrafish Book: A Guide for the Laboratory Use of Zebrafish (Danio rerio), 5th ed.; University of Oregon Press: Eugene, Oregon, 2007. [Google Scholar]
  19. Liu, W.; Saint, D.A. Validation of a quantitative method for real-time PCR kinetics. Anal Biochem. 2002, 294, 347–353. [Google Scholar] [CrossRef]
  20. TOYOBO CO., LTD. THUNDERBIRD® SYBR™ qPCR Mix (QPS-201)—Technical Manual; TOYOBO CO., LTD.: Osaka, Japan, 2014. [Google Scholar]
  21. Bludau, O.; Weber, A.; Bosak, V.; Kuscha, V.; Dietrich, K.; Hans, S.; Brand, M. Inflammation is a critical factor for successful regeneration of the adult zebrafish retina in response to diffuse light lesion. Front. Cell Dev. Biol. 2024, 12, 1332347. [Google Scholar] [CrossRef]
  22. Johnston, H.J.; Gillies, S.L.J.; Verdon, R.; Stone, V.; Henry, T.; Tran, L.; Tucker, C.; Rossi, A.G.; Tyler, C.R. Application of transgenic zebrafish for investigating inflammatory responses to nanomaterials: Recommendations for new users. F1000Research 2025, 12, 51. [Google Scholar] [CrossRef]
  23. Stirling, D.R.; Swain-Bowden, M.J.; Lucas, A.M.; Carpenter, A.E.; Cimini, B.A. CellProfiler 4: Improvements in speed, utility and usability. BMC Bioinf. 2020, 21, 433. [Google Scholar] [CrossRef]
  24. Nemoto, H.; Sakai, D.; Watson, D.; Masuda, K. Nuclear factor-κB decoy oligodeoxynucleotide attenuates cartilage resorption in vitro. Bioengineering 2024, 11, 46. [Google Scholar] [CrossRef]
  25. Walker, S.L.; Ariga, J.; Mathias, J.R.; Coothankandaswamy, V.; Xie, X.; Distel, M.; Köster, R.W.; Parsons, M.J.; Bhalla, K.N.; Saxena, M.T.; et al. Automated reporter quantification in vivo: High-throughput screening method for reporter-based assays in Zebrafish. PLoS ONE 2012, 7, e29916. [Google Scholar] [CrossRef]
  26. Wang, G.; Rajpurohit, S.K.; Delaspre, F.; Walker, S.L.; White, D.T.; Ceasrine, A.; Kuruvilla, R.; Li, R.-J.; Shim, J.S.; Liu, J.O.; et al. First quantitative high-throughput screen in zebrafish identifies novel pathways for increasing pancreatic β-cell mass. eLife 2015, 4, e08261. [Google Scholar] [CrossRef]
  27. Wong, R.L.; Choi, M.Y.; Wang, H.-Y.; Kipps, T.J. Mutation in Bruton Tyrosine Kinase (BTK) A428D confers resistance To BTK-degrader therapy in chronic lymphocytic leukemia. Leukemia 2024, 38, 1818–1821. [Google Scholar] [CrossRef]
  28. Mikami, I.; Takahashi, Y.; Koiwa, J.; Okamura, M.; Tanaka, T. Zebrafish yolk sac microinjection of thalidomide for assessment of developmental toxicology. Congenit Anom 2020, 60, 71–72. [Google Scholar] [CrossRef]
  29. Zanandrea, R.; Bonan, C.D.; Campos, M.M. Zebrafish as a model for inflammation and drug discovery. Drug Discov. Today 2020, 25, 2201–2211. [Google Scholar] [CrossRef]
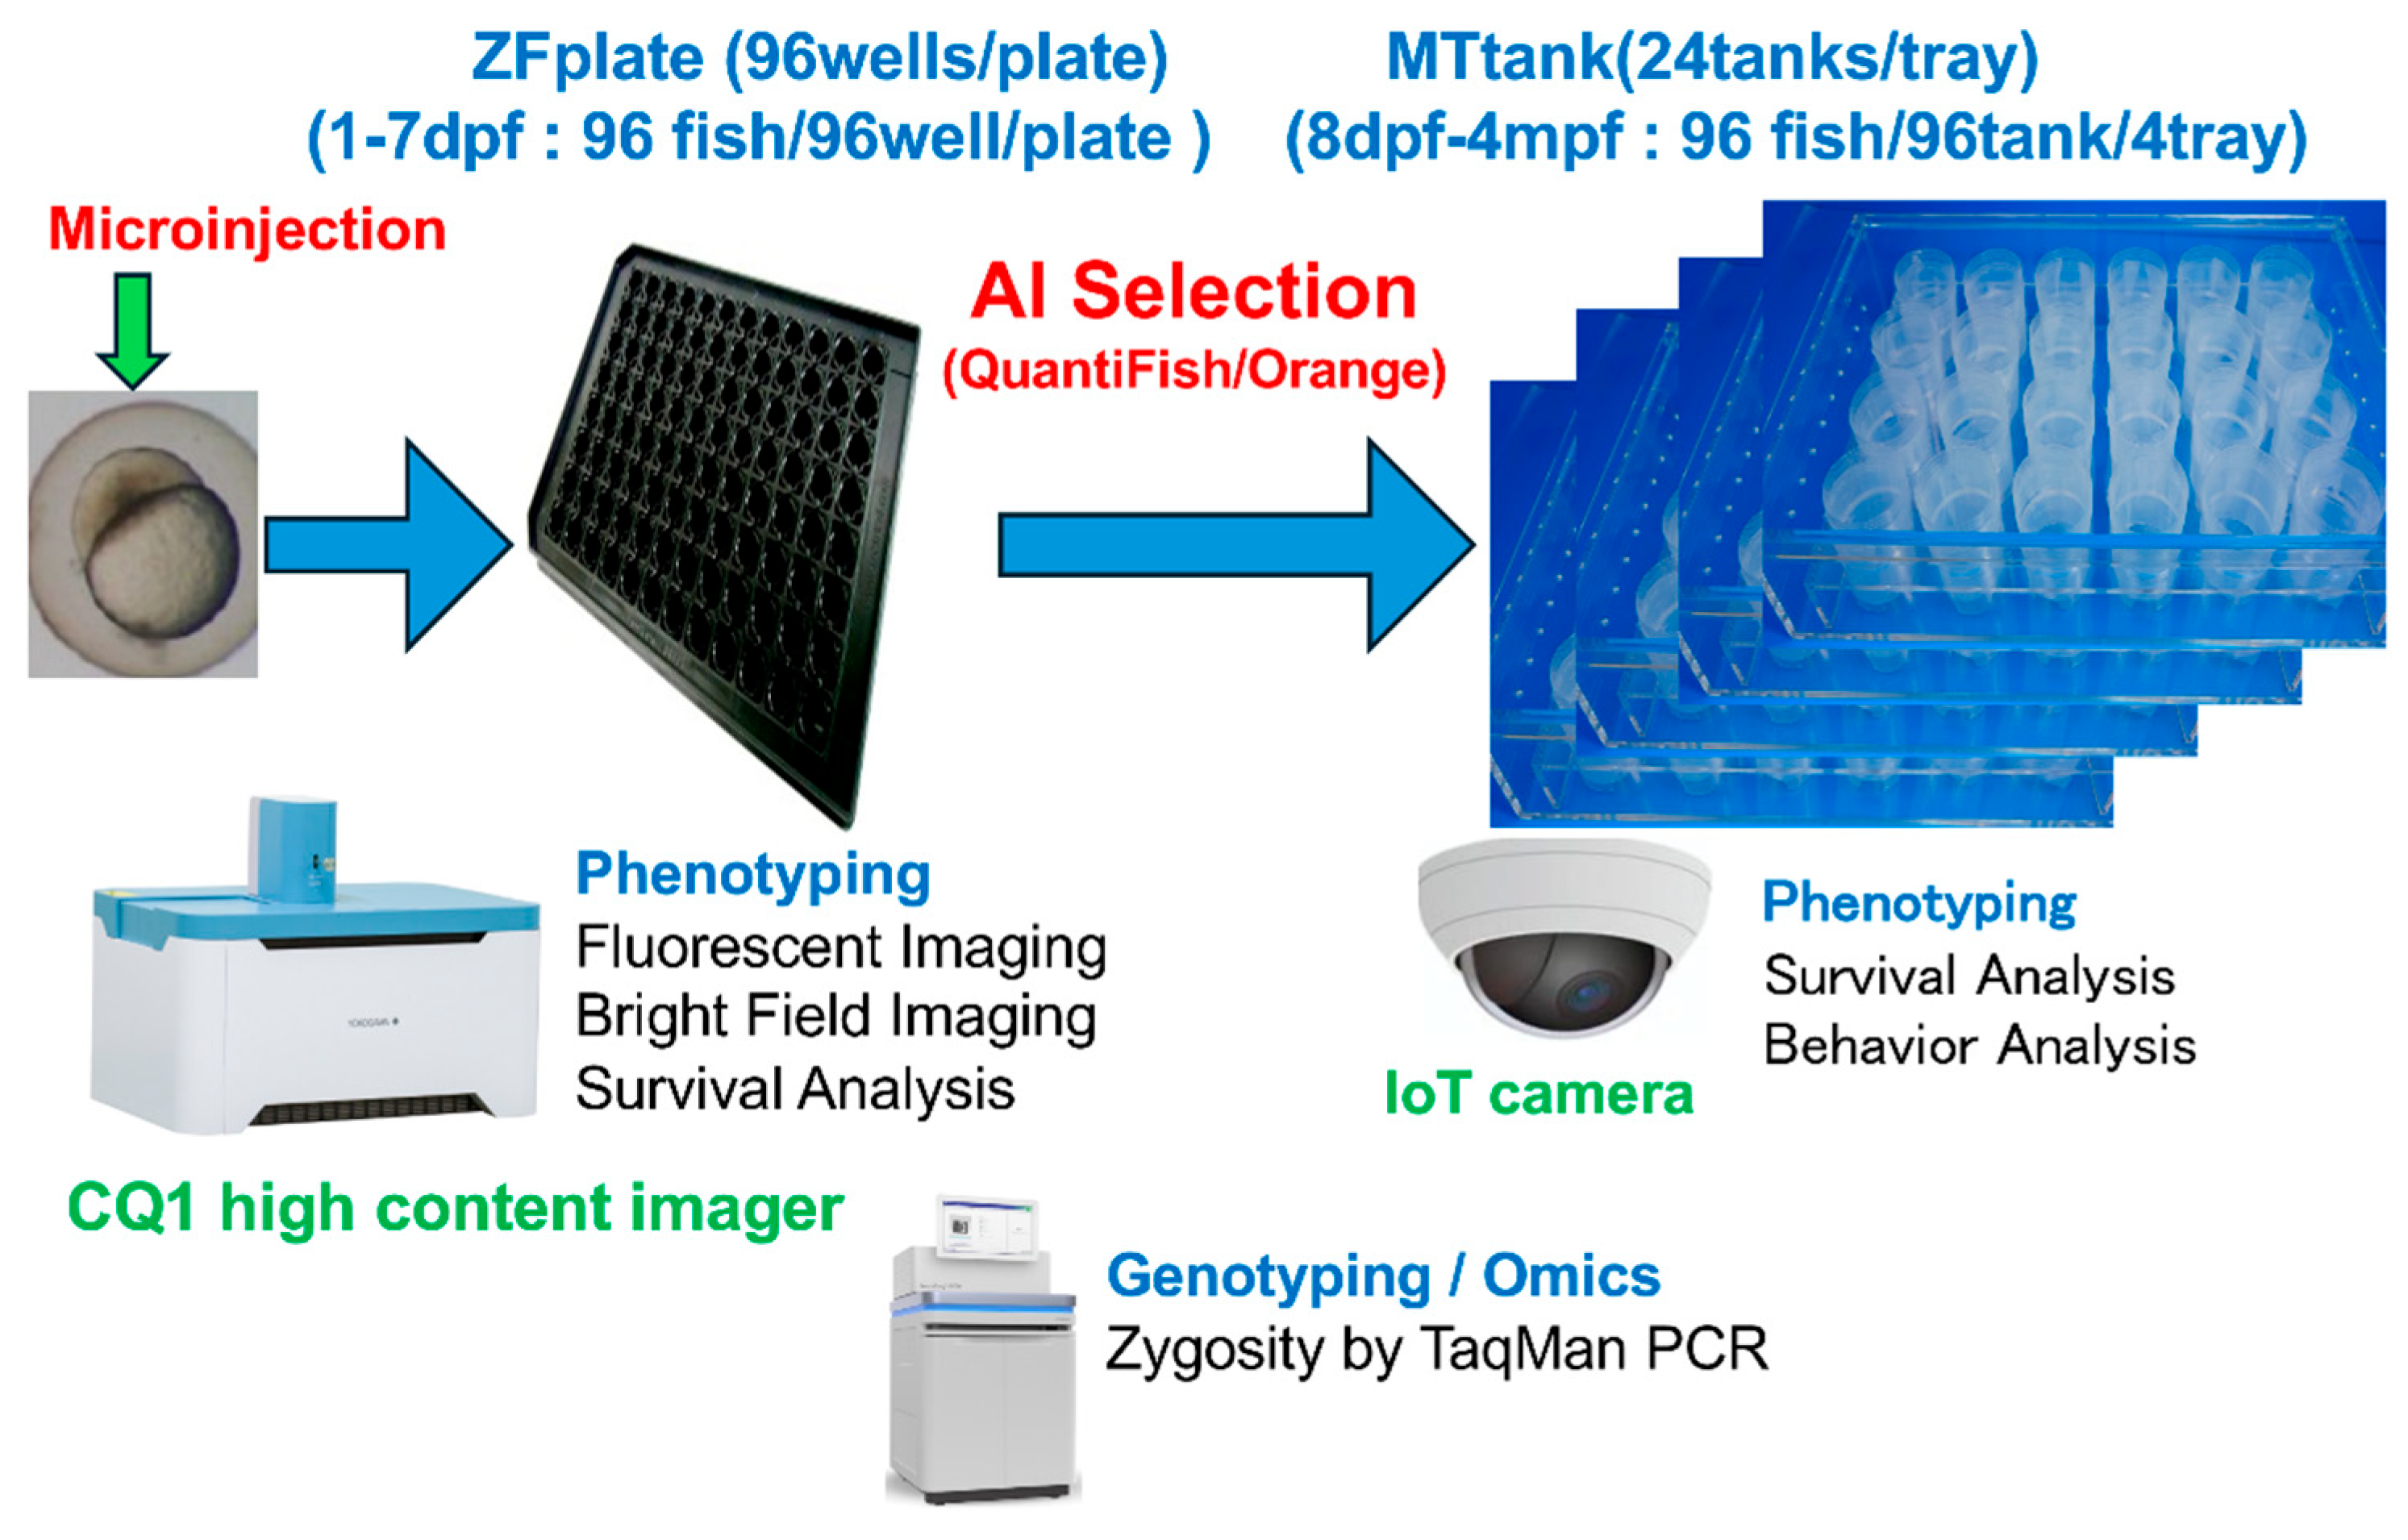
Figure 1. Schematic workflow for AI-enhanced transposon-mediated transgenesis of the NFκB:eGFP reporter system in zebrafish. One-cell stage embryos are microinjected with the reporter construct and transferred to individual wells of 96-well ZF plates. High-content imaging and quantitative analysis are performed using Quantifish software at specified developmental stages. The workflow enables efficient identification and characterization of stable transgenic lines with tissue-specific expression patterns.
Futurepharmacol 05 00050 g001
Figure 2. Design and function of the individualized ZF plate (A), individualized MT tank (B), and conventional group tank (C). Small hole of the ZF plate to pipette with an 8-serial micropipette to avoid injury or stress in liquid handling. Constant individualized feeding in the MA tank and variable competitive feeding of each zebrafish in the conventional group tank. Blue arrows represent the direction of fluid exchange (such as medium removal or addition), performed using an 8-channel multichannel pipette through the small access holes at the top of each well in the ZF plate.
Futurepharmacol 05 00050 g002
Figure 3. Longitudinal stability in individualized MT tank and group breeding. Survival rates in MT tanks and group tank breeding, zebrafish height and weight, and their variations in individualized MT tanks and conventional group breeding. Clustering and stability screening of transgenic zebrafish. Data are shown for 23 F0 founders (microinjected and screened), 155 F1 offspring (8 per germline-transmitting line). *** p < 0.001.
Futurepharmacol 05 00050 g003
Figure 4. Cluster analysis in F1 generation of eGFP mean fluorescence intensity and eGFP copy number was analyzed as previously reported [19]. All plots were classified into four groups: a, low eGFP fluorescence and low eGFP copy number; b, low eGFP fluorescence and high eGFP copy number; c, high eGFP fluorescence and low eGFP copy number; d, high eGFP fluorescence and high eGFP copy number.
Futurepharmacol 05 00050 g004
Figure 5. LPS-dependent induction of NFκB eGFP fluorescence in the lens region of a selective retinal Tol-2-mediated transgenesis of NFκB eGFP reporter model system: (A) Experimental design of retinal LPS injection and retinal imaging. (B,C) LPS-dependent induction of retinal NFκB eGFP fluorescence intensity by LPS injection. ** p < 0.01.
Futurepharmacol 05 00050 g005
Figure 6. Suppression of LPS-dependent induction of zebrafish fluorescence in Tol2-mediated transgenesis of NFκB eGFP reporter zebrafish model system by NFκB decoy (AnGes Inc., Osaka, Japan) [24]: (A) Experimental design of LPS/NFκB decoy co-injection and imaging. (B) Inhibition of LPS-dependent induction of NFκB eGFP fluorescence intensity by NFκB decoy. (C) Suppression of LPS-dependent induction of NF-κB-driven eGFP fluorescence in zebrafish larvae by NFκB decoy. *** p < 0.001.
Futurepharmacol 05 00050 g006
Table 1. Primer Design for Quantitative PCR. [19].
Primer NameSequence (5′→3′)Amplicon Length
real-time_PCR_control-FTCCAGTGTAAACAAGTCTGGAAAACT76 bp
real-time_PCR_control-RGAGTAGCCATGCGGTCCAA
real-time_PCR_eGFP-FAGAACGGCATCAAGGTGAAC135 bp
real-time_PCR_eGFP-RTGCTCAGGTAGTGGTTGTCG
Disclaimer/Publisher’s Note: The statements, opinions and data contained in all publications are solely those of the individual author(s) and contributor(s) and not of MDPI and/or the editor(s). MDPI and/or the editor(s) disclaim responsibility for any injury to people or property resulting from any ideas, methods, instructions or products referred to in the content.