

Subacute Toxicity and Pharmacokinetic Evaluation of the Synthetic Cannabinoid 4F-MDMB-BUTINACA in Rats: A Forensic and Toxicological Perspective


Abstract
1. Introduction
2. Materials and Methods
2.1. Drug Preparation and Animals
2.2. Chemicals and Reagents
2.3. Preparation of the Calibrators and QC Samples for GC-MS Validation
2.4. Procedures of Liquid–Liquid Extraction of the Drug from the Plasma
2.5. Validation of GC–MS/MS Analysis
2.5.1. Evaluation of the GC–MS/MS Selectivity
2.5.2. Evaluation of the GC–MS/MS Sensitivity
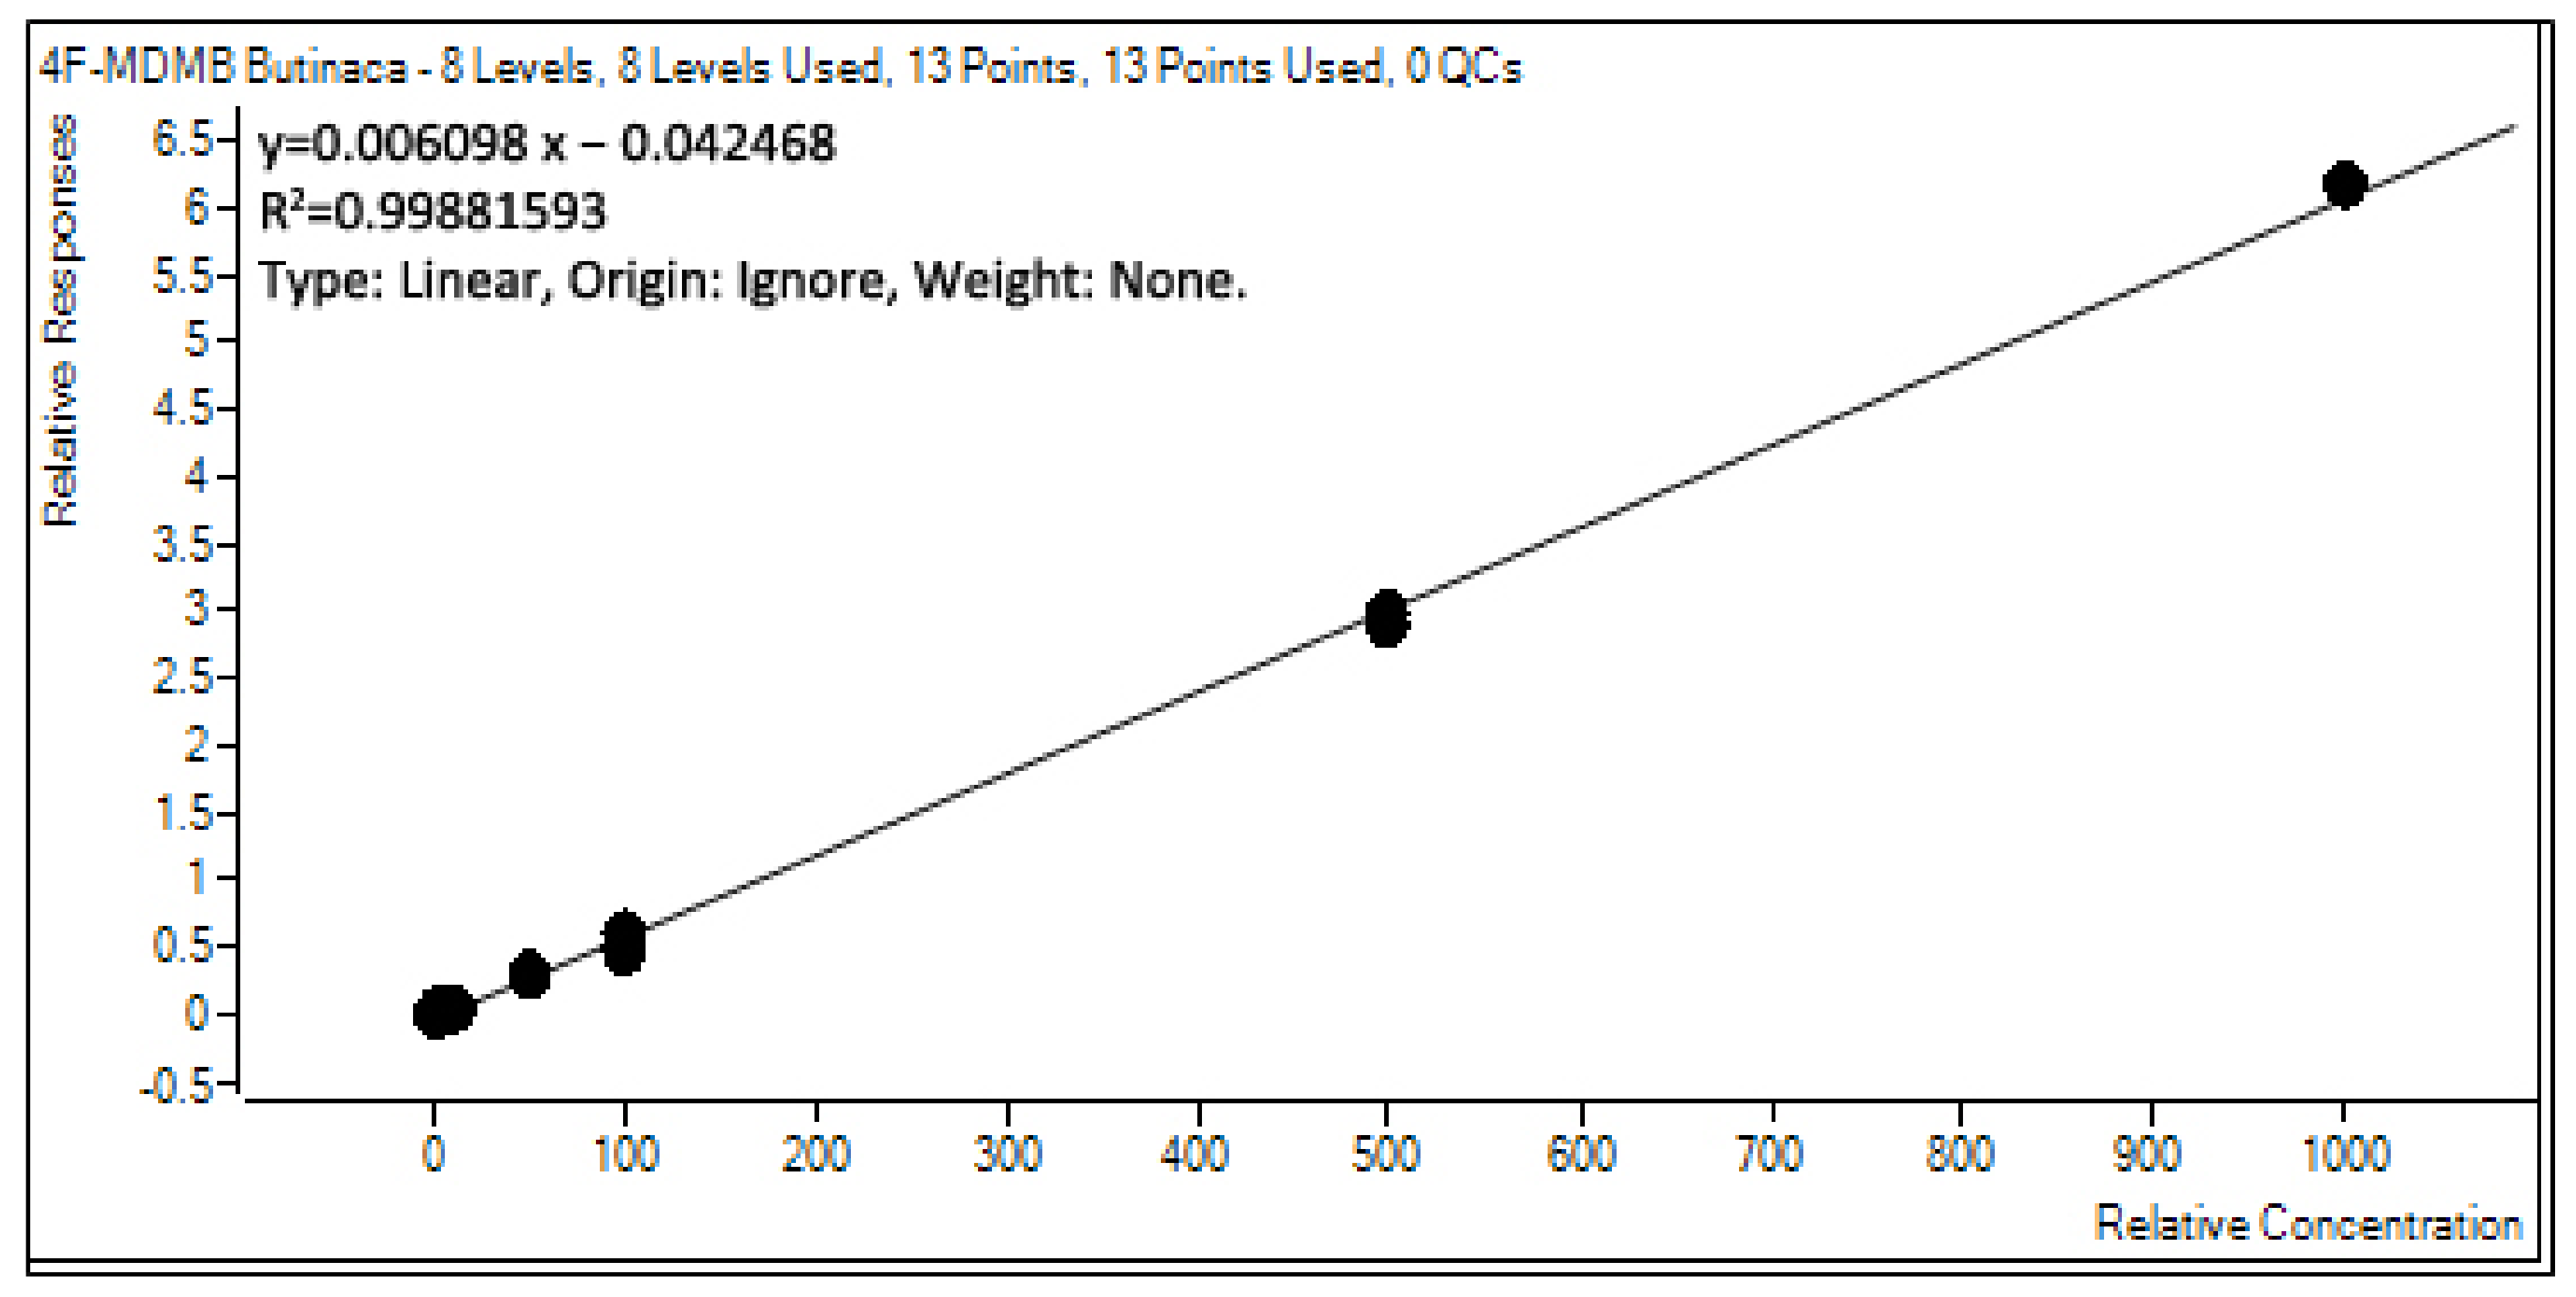
2.5.3. Evaluation of the GC–MS/MS Linearity
2.5.4. Evaluation of the GC–MS/MS Accuracy and Precision
2.5.5. Evaluation of the Method’s Recovery and Stability
2.6. Animal Experiments for Evaluating the Pharmacokinetic Profile
2.6.1. Calculations of the Pharmacokinetic Parameters
2.6.2. Statistical Analysis
2.7. Animal Experiments for Evaluating the Sub-Acute Toxicity
2.7.1. Hematological Parameters
2.7.2. Biochemical Parameters
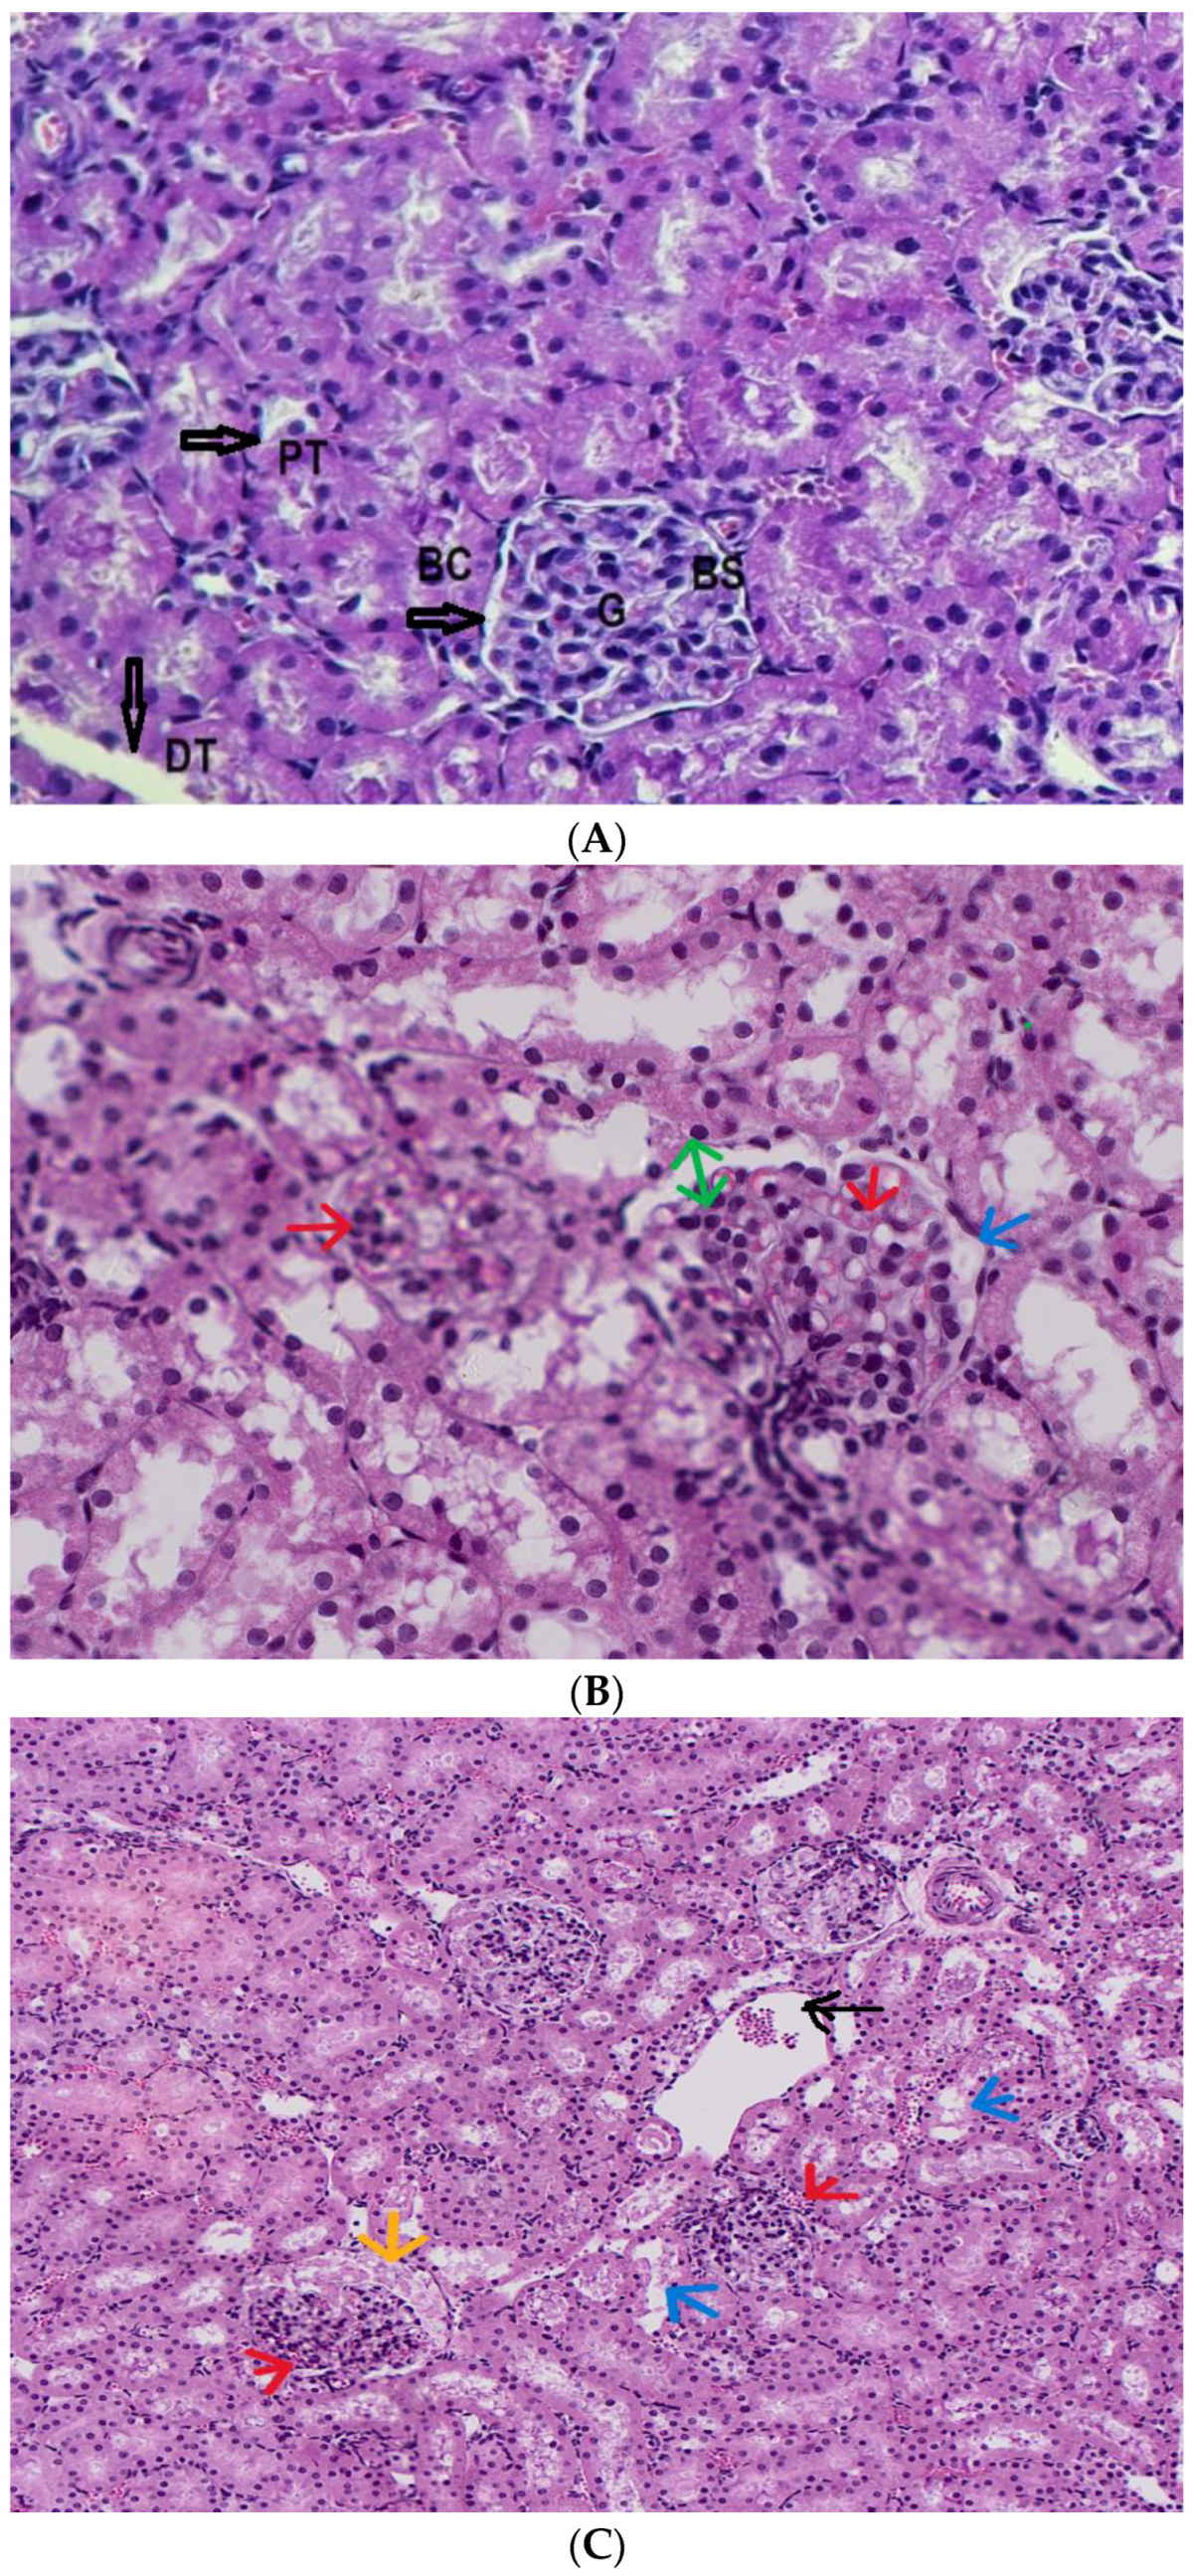
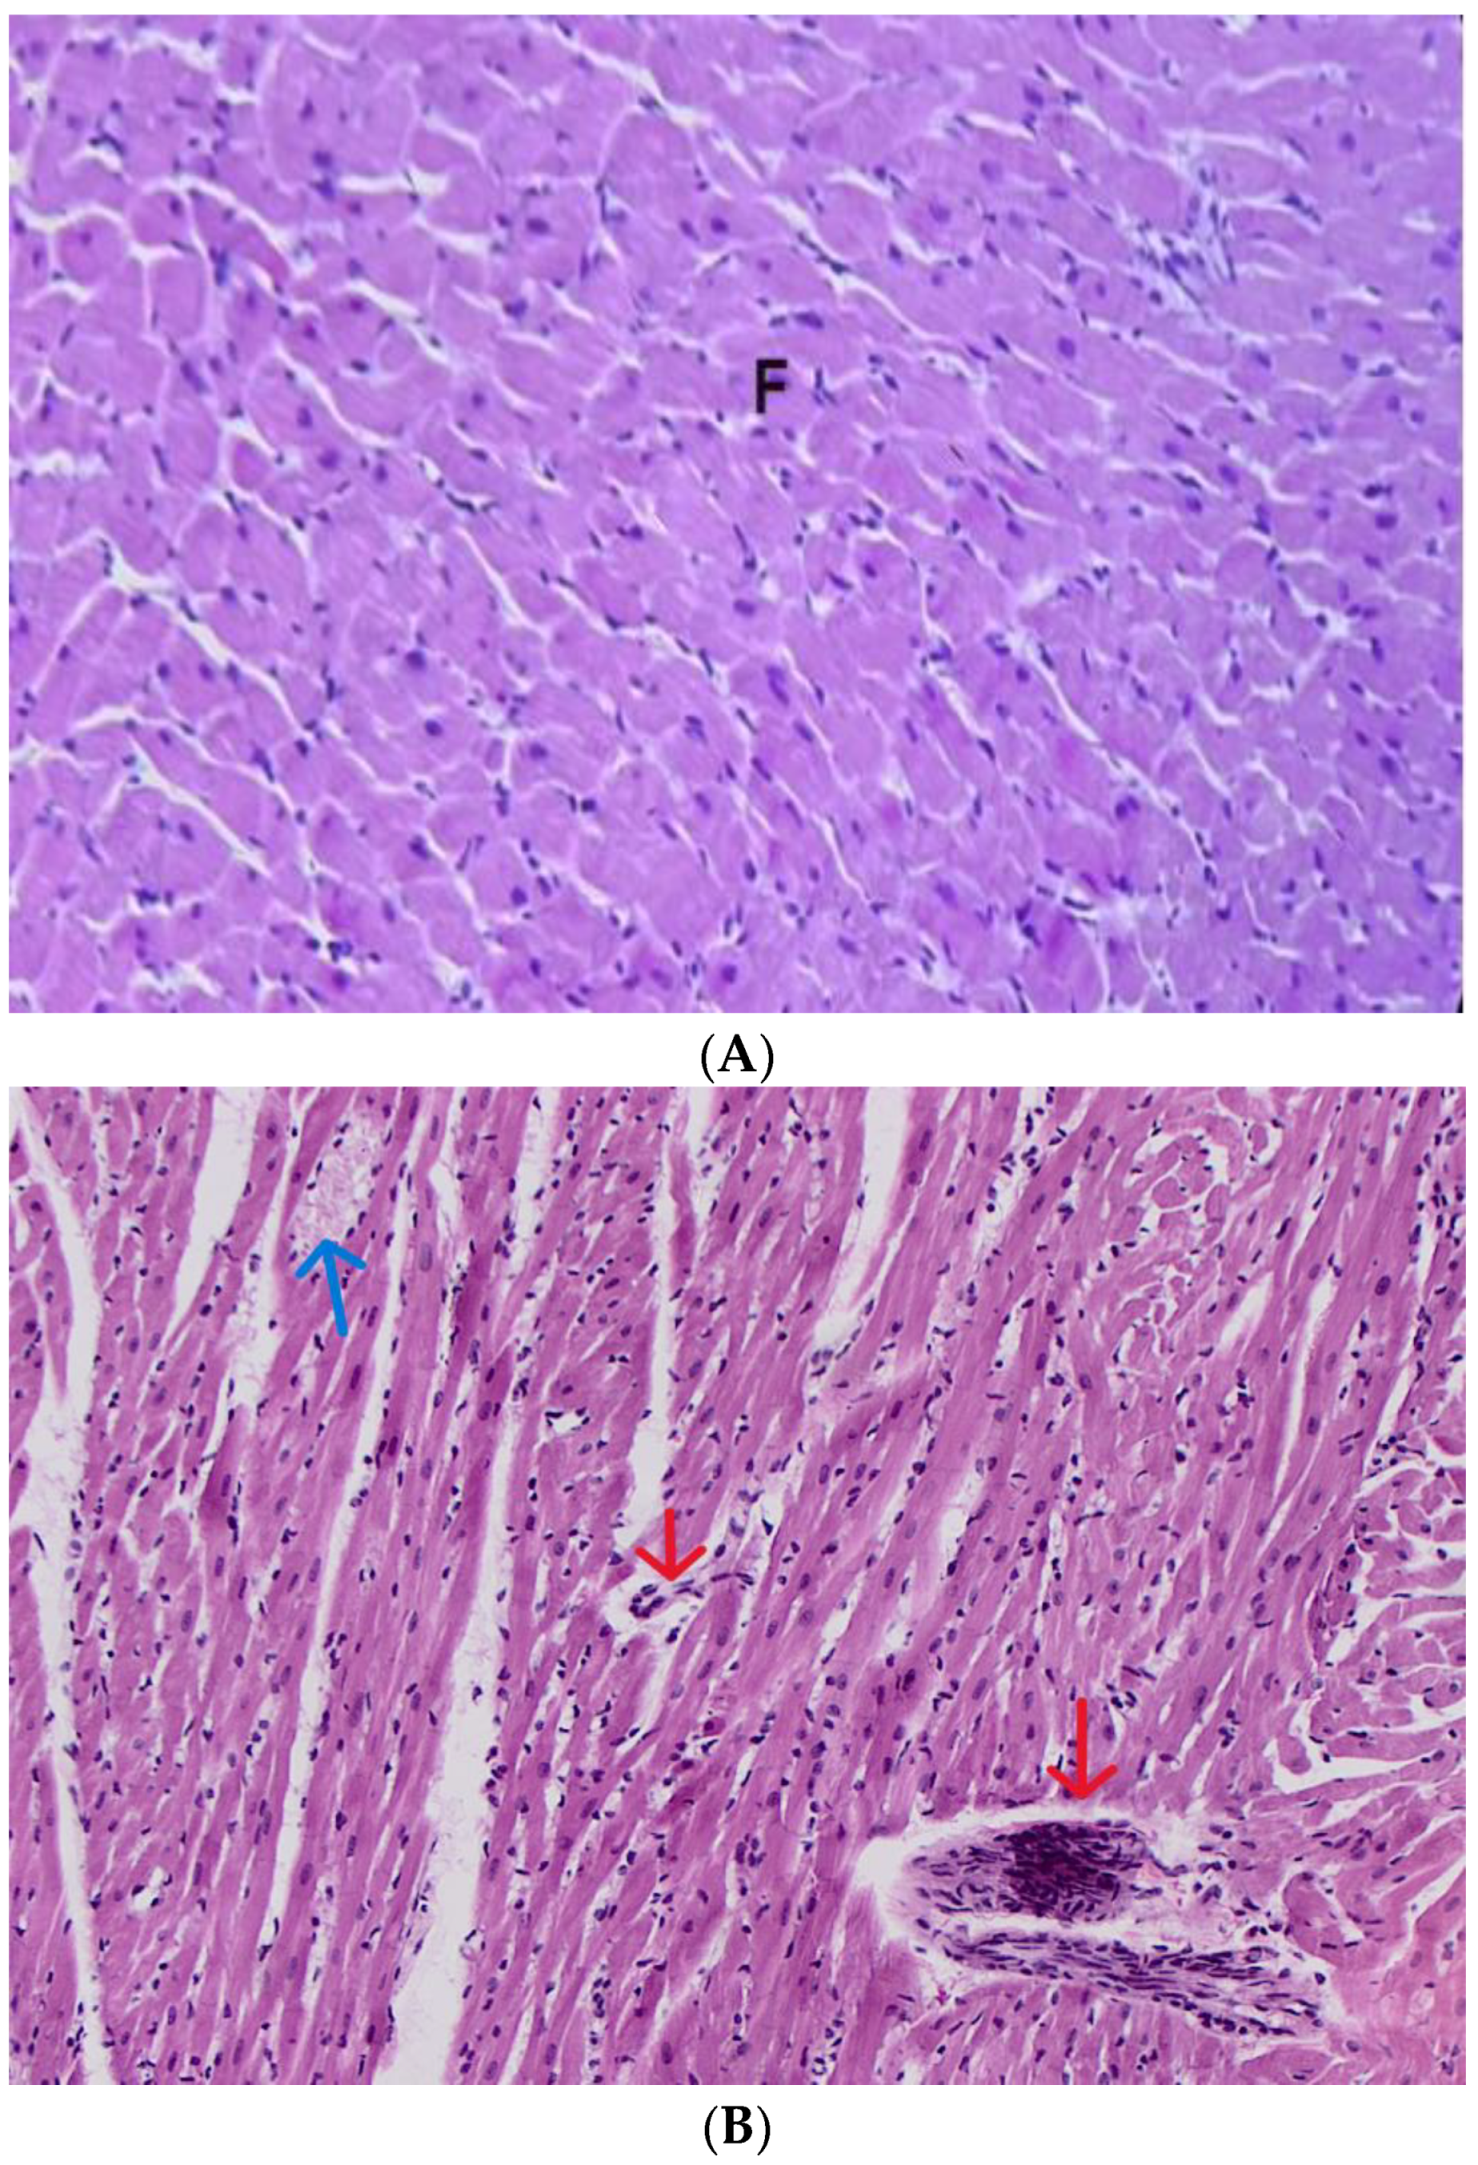
2.7.3. Histopathology
3. Results and Discussions
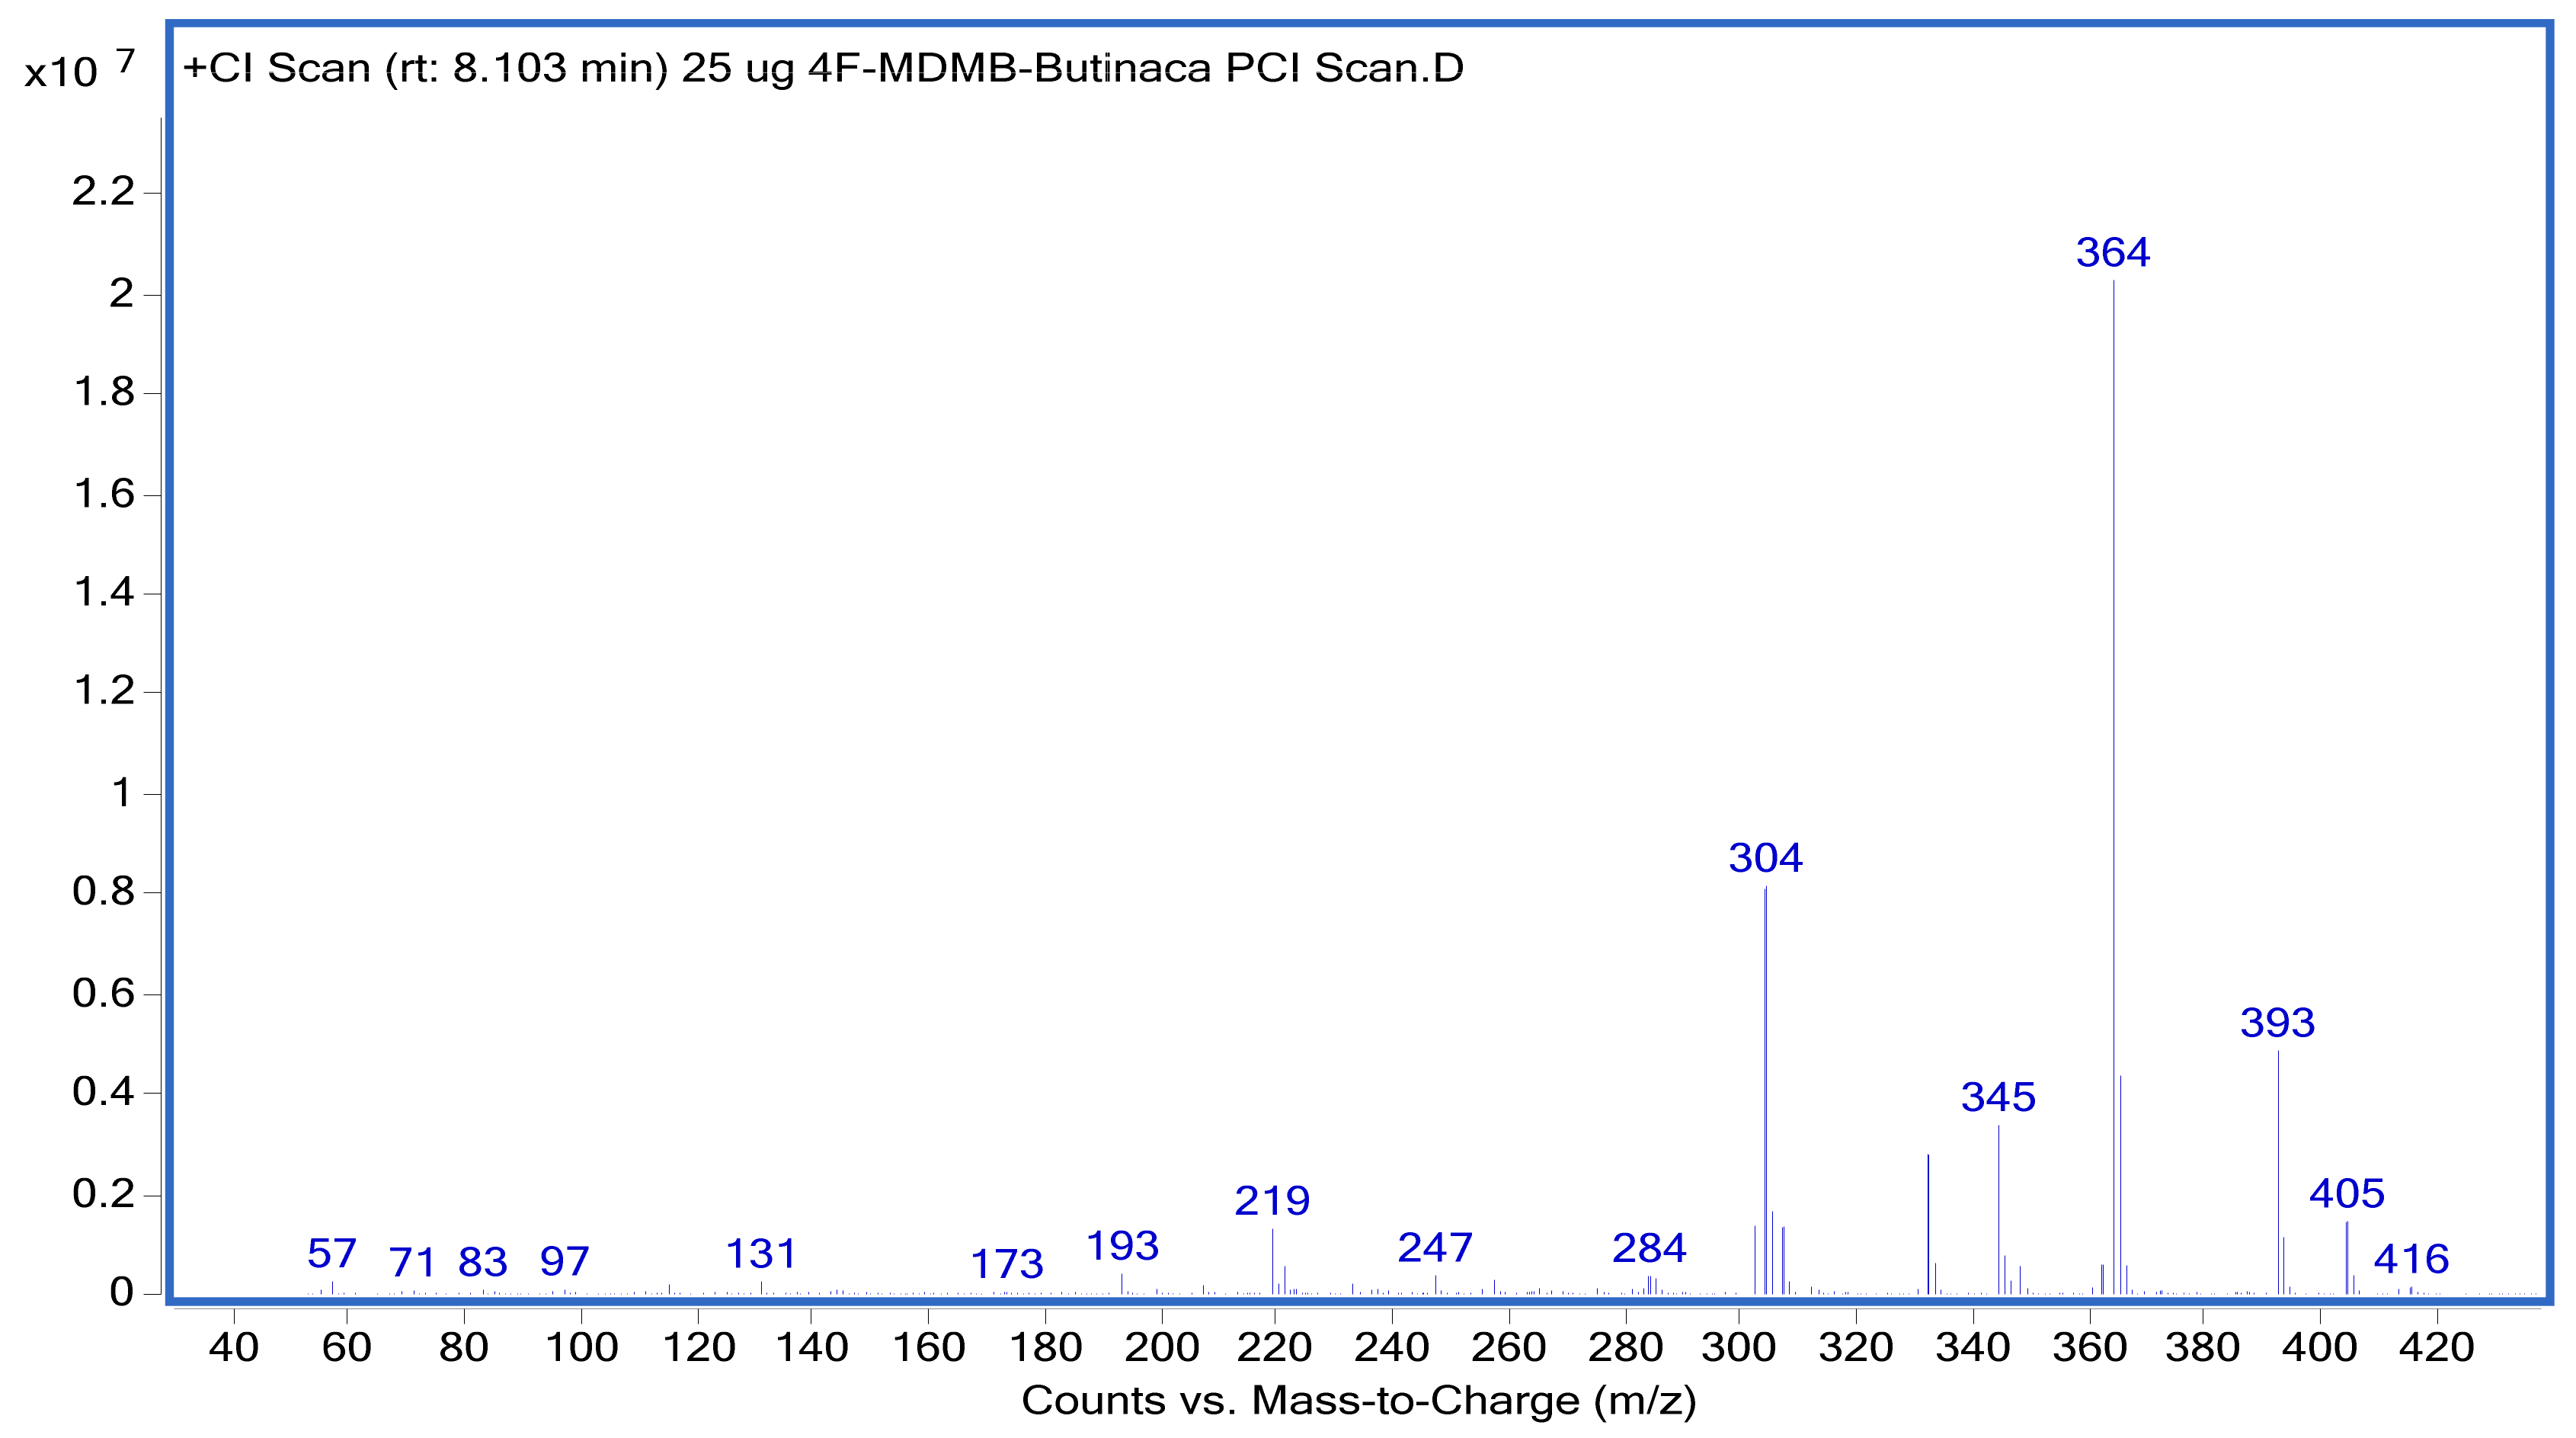
3.1. GC–MS/MS Method Suitability for Routine Analysis
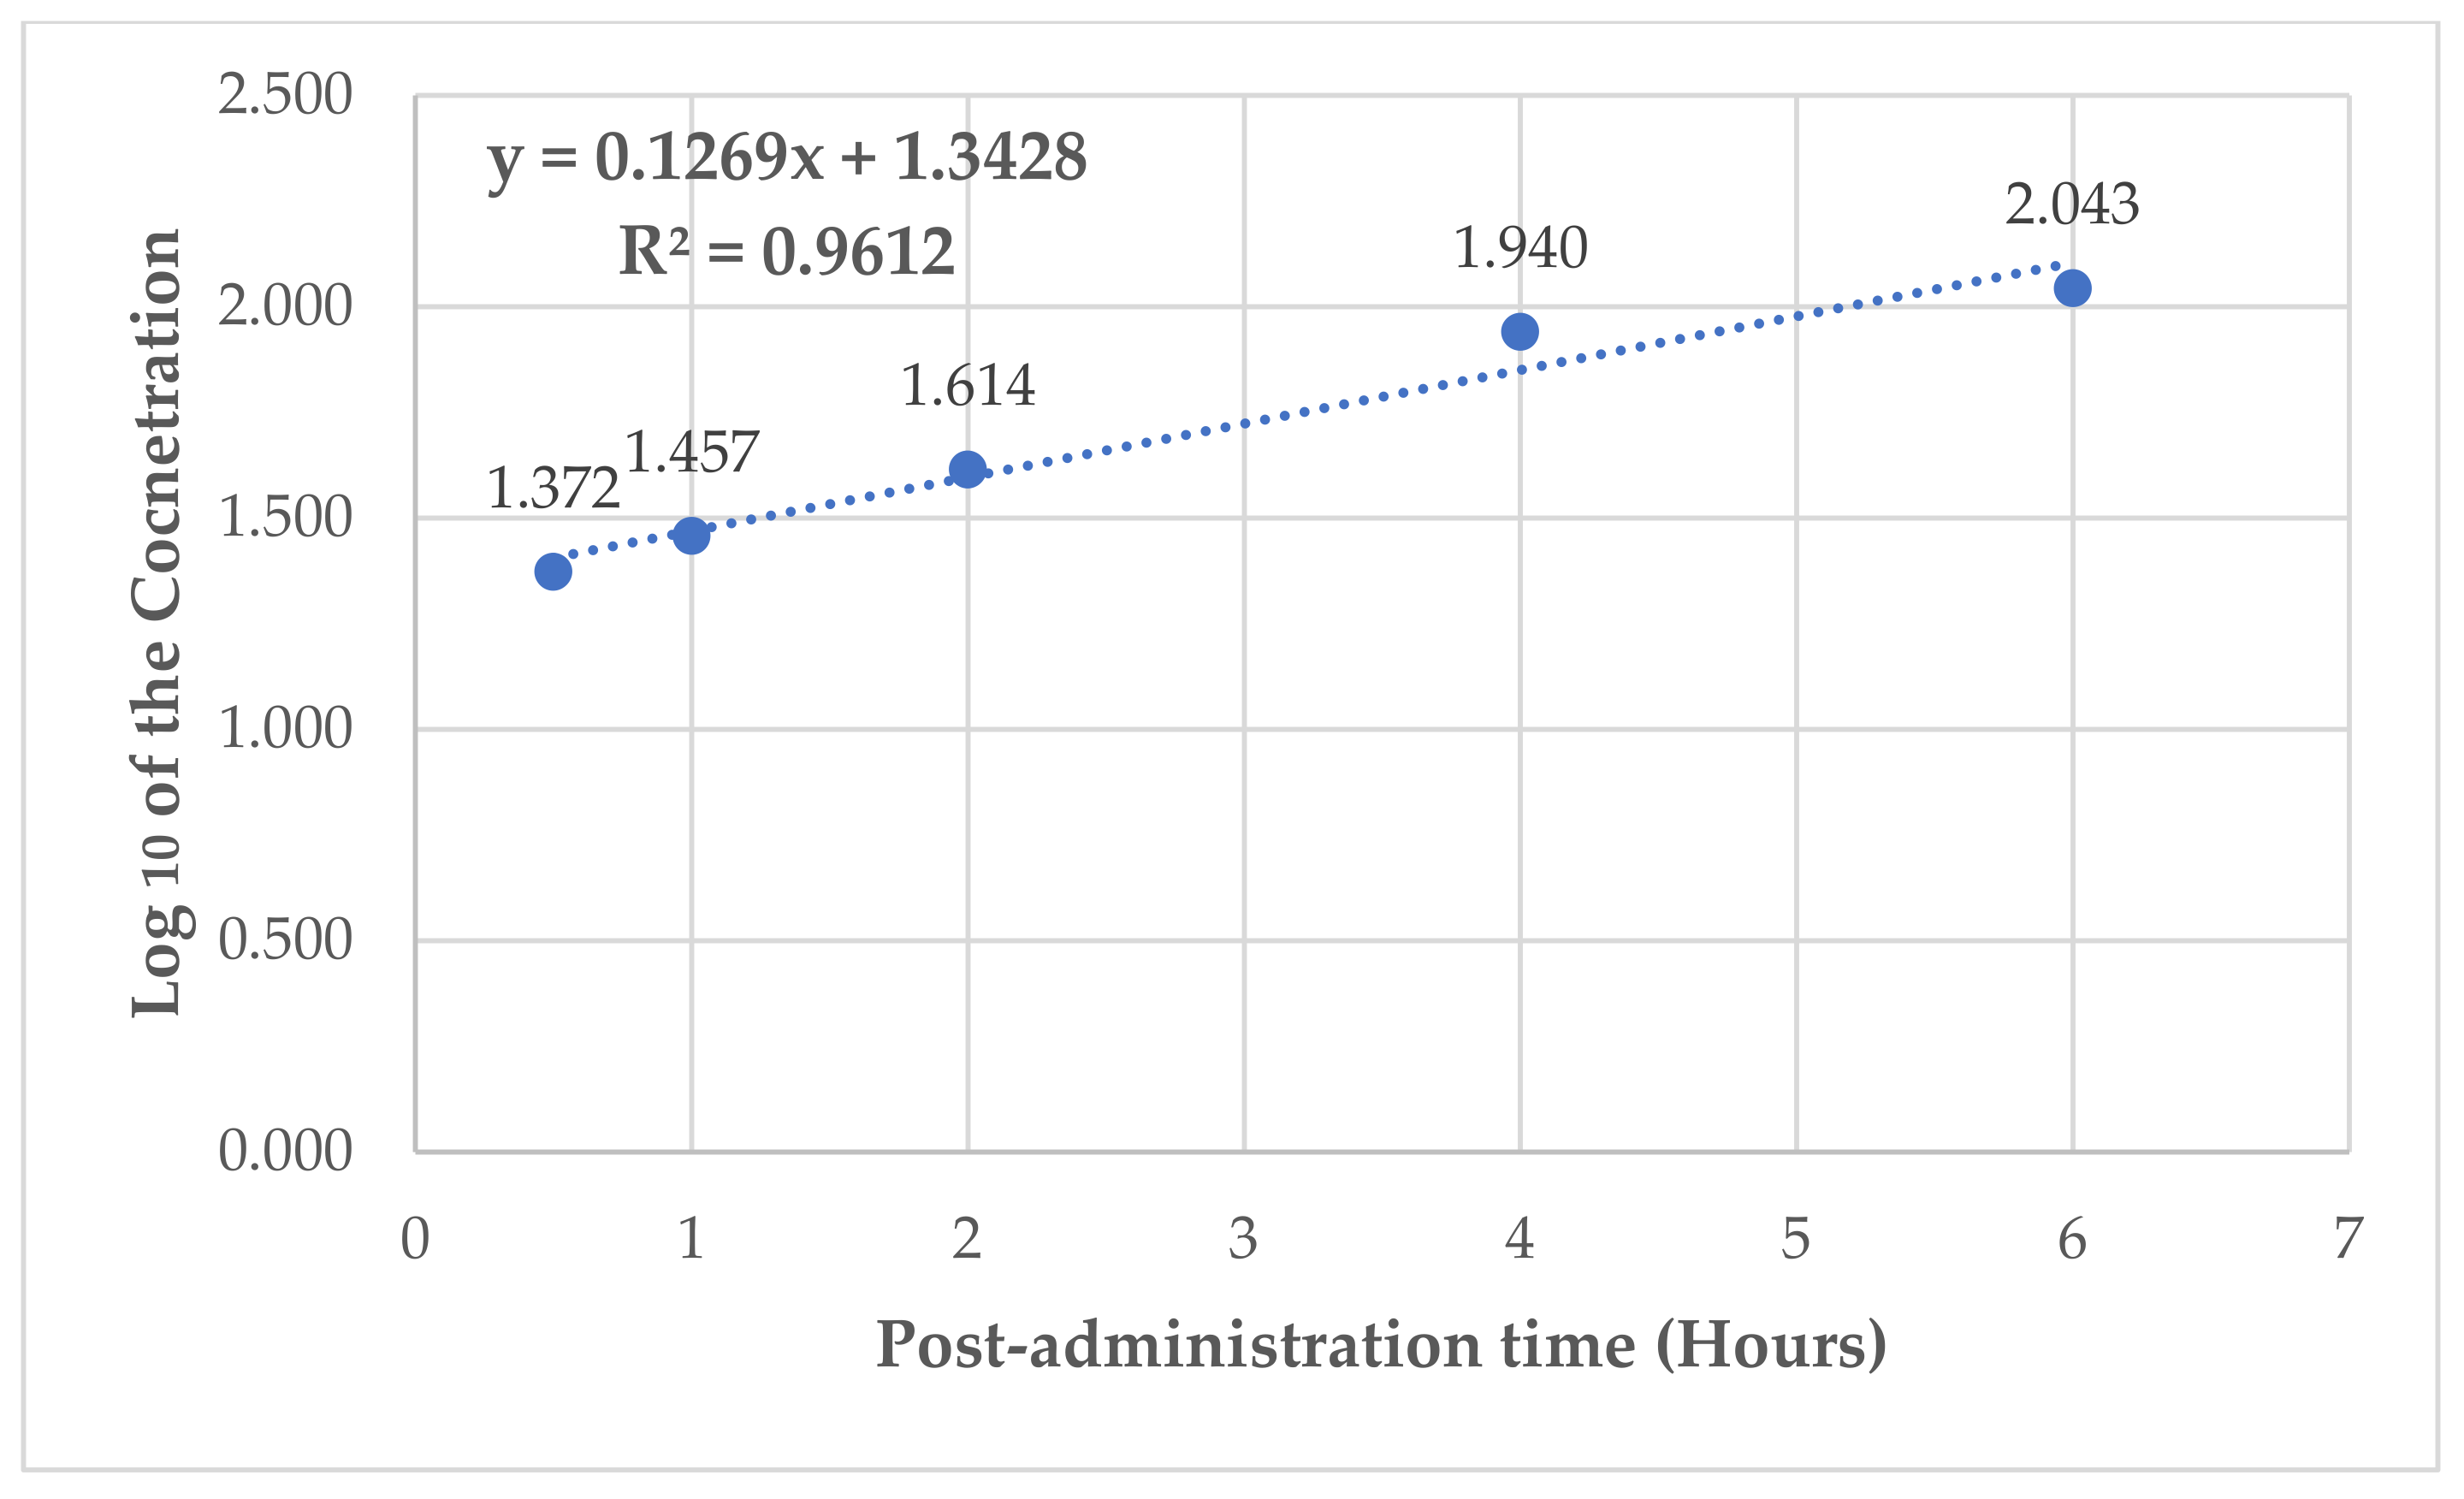
3.2. Pharmacokinetic Profile of 4F-MDMB-BUTINACA Following Oral Administration at a Dose of 50 mg/kg
3.3. Monitoring the Sub-Acute Toxicity of the 4F-MDMB BUTINACA on the Studied Animals
3.4. Hematological Changes with 4F-MDMB BUTINACA Oral Administration
3.5. Serobiochemical Changes with 4F-MDMB BUTINACA Oral Administration
3.6. Diagnosis of the Subacute Toxicity of 4-MDMB-Butinaca and Histopathological Changes
4. Conclusions
Author Contributions
Funding
Institutional Review Board Statement
Informed Consent Statement
Data Availability Statement
Acknowledgments
Conflicts of Interest
Abbreviations
| Abbreviation | Meaning |
| °C | Degree Celsius |
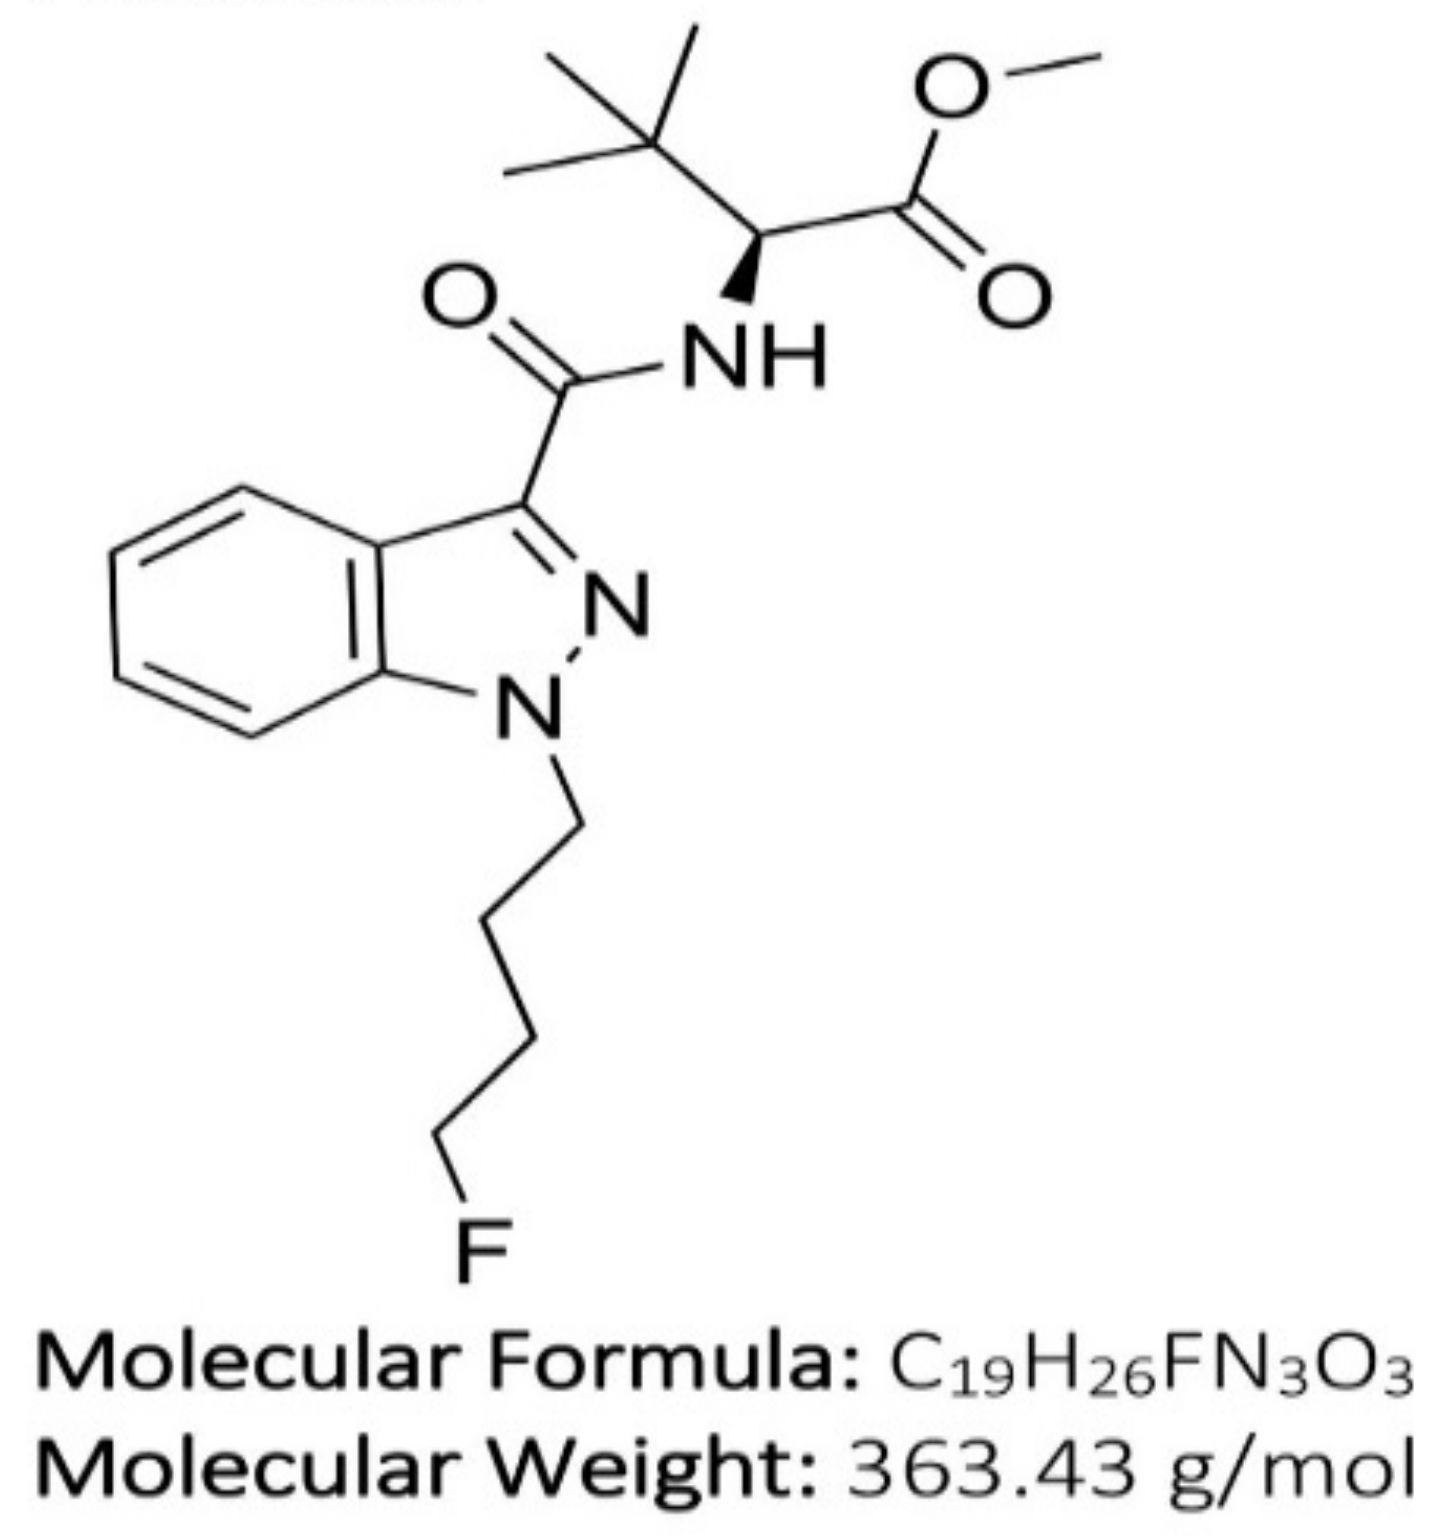
| 4F-Binaca | N-[[1-(4-fluorobutyl)-1H-indazol-3-yl]carbonyl]-3-methyl-L-valine, methyl ester |
| 4F-MDMB-BUTINACA | N-[[1-(4-fluorobutyl)-1H-indazol-3-yl]carbonyl]-3-methyl-L-valine, methyl ester |
| ALB | Albumin |
| ALP | Alkaline phosphatase |
| ALT | Alanine aminotransferase |
| AST | Aspartate aminotransferase |
| BC | Bowman’s capsule |
| Bias% | Accuracy |
| BS | Bowman’s space |
| Ca | Calcium |
| CE | Collision energy (mass spectroscopy) |
| CHOL | Total cholesterol |
| Cl | Clearance |
| DBIL | Direct bilirubin |
| DMSO | Dimethyl sulfoxide |
| DT | Distal tubule |
| El | Electron ionization technic |
| eV | Potential energy/electric vehicle |
| FDA’s | Food and Drug Administration |
| G | Dlomerulus |
| GC-MS | Gas chromatographic–mass spectrometric |
| GGT | Gamma-glutamyl transferase |
| H&E | Hematoxylin and eosin stain |
| HDL | High-density lipoprotein |
| HQC | High-quality control |
| IS | Internal standard |
| K | Elimination rate |
| LC–MS | Liquid chromatography–mass spectrometry |
| LC–MS/MS | Liquid chromatography with tandem mass spectrometry |
| LOD | Limit of detection |
| LOQ | Limit of quantitation |
| LQC | Low-quality control |
| m/z | Mass-to-charge ratio |
| Min | Minutes |
| MQC | Medium-quality control |
| MS | Mass spectrometry |
| OECD | Organization for Economic Cooperation and Development |
| PHOS | Phosphate |
| PT | Proximal tubule |
| QC | Quality control |
| r2 | Correlation coefficient |
| RSD | Relative standard deviation |
| RSD% | Precision |
| RT | Retention time |
| SCs | Synthetic cannabinoids |
| SIM | Selected ion monitoring |
| t1/2 | Half-life |
| TBIL | Total bilirubin |
| TG | Triglycerides |
| THC | Tetrahydrocannabinol |
| TP | Total protein |
| UCT | United Chemical Technologies |
| Vd | Volume of distribution |
| WBC | White blood cell count |
References
- Johnson, L.A.; Johnson, R.L.; Portier, R.-B. Current “legal highs”. J. Emerg. Med. 2013, 44, 1108–1115. [Google Scholar] [CrossRef] [PubMed]
- Seely, K.A.; Lapoint, J.; Moran, J.H.; Fattore, L. Spice drugs are more than harmless herbal blends: A review of the pharmacology and toxicology of synthetic cannabinoids. Prog. Neuro-Psychopharmacol. Biol. Psychiatry 2012, 39, 234–243. [Google Scholar] [CrossRef] [PubMed]
- Debruyne, D.; Le Boisselier, R. Emerging drugs of abuse: Current perspectives on synthetic cannabinoids. Subst. Abus. Rehabil. 2015, 6, 113–129. [Google Scholar] [CrossRef] [PubMed]
- Simon, G.; Kuzma, M.; Mayer, M.; Petrus, K.; Tóth, D. Fatal Overdose with the Cannabinoid Receptor Agonists MDMB-4en-PINACA and 4F-ABUTINACA: A Case Report and Review of the Literature. Toxics 2023, 11, 673. [Google Scholar] [CrossRef] [PubMed]
- Simon, G.; Tóth, D.; Heckmann, V.; Mayer, M.; Kuzma, M. Simultaneous fatal poisoning of two victims with 4F-MDMB-BINACA and ethanol. Forensic Toxicol. 2023, 41, 151–157. [Google Scholar] [CrossRef] [PubMed]
- Cannaert, A.; Sparkes, E.; Pike, E.; Luo, J.L.; Fang, A.; Kevin, R.C.; Ellison, R.; Gerona, R.; Banister, S.D.; Stove, C.P. Synthesis and in Vitro Cannabinoid Receptor 1 Activity of Recently Detected Synthetic Cannabinoids 4F-MDMB-BICA, 5F-MPP-PICA, MMB-4en-PICA, CUMYL-CBMICA, ADB-BINACA, APP-BINACA, 4F-MDMB-BINACA, MDMB-4en-PINACA, A-CHMINACA, 5F-AB-P7AICA, 5F-MDMB-P7AICA, and 5F-AP7AICA. ACS Chem. Neurosci. 2020, 11, 4434–4446. [Google Scholar] [PubMed]
- Wang, K.D.; Yuan, X.L.; Zhang, Y.R.; Hu, J.J.; Cao, F.Q.; Chen, Y.S. Identification of synthetic cannabinoid new psychoactive substances 4F-MDMB-BUTINACA and MDMB-4en-PINACA. Fa Yi Xue Za Zhi 2021, 37, 505–510. [Google Scholar] [PubMed]
- Lie, W.; Cheong, E.J.Y.; Goh, E.M.L.; Moy, H.Y.; Cannaert, A.; Stove, C.P.; Chan, E.C.Y. Diagnosing intake and rationalizing toxicities associated with 5F-MDMB-PINACA and 4F-MDMB-BINACA abuse. Arch. Toxicol. 2021, 95, 489–508. [Google Scholar] [CrossRef] [PubMed]
- Shopan, N.; Scolnik, D.; Hassoun, E.; Firsow, A.; Volkov, I.; Glatstein, M. Acute intoxication caused by three common synthetic cannabinoids: The experience of a large, urban, tertiary care hospital. Am. J. Emerg. Med. 2023, 73, 7–10. [Google Scholar] [CrossRef] [PubMed]
- Tokarczyk, B.; Jurczyk, A.; Krupińska, J.; Adamowicz, P. Fatal intoxication with new synthetic cannabinoids 5F-MDMB-PICA and 4F-MDMB-BINACA—Parent compounds and metabolite identification in blood, urine and cerebrospinal fluid. Forensic Sci. Med. Pathol. 2022, 18, 393–402. [Google Scholar] [CrossRef] [PubMed]
- Krotulski, A.J.; Cannaert, A.; Stove, C.; Logan, B.K. The next generation of synthetic cannabinoids: Detection, activity, and potential toxicity of pent-4en and but-3en analogues including MDMB-4en-PINACA. Drug Test. Anal. 2021, 13, 427–438. [Google Scholar] [CrossRef] [PubMed]
- Lin-Na, Y.; Ping, X.; Fen-Yun, S. Metabolism of New Psychoactive Substances 4F-MDMB-BUTINACA in Zebrafish. J. Forensic Med. 2021, 37, 493. [Google Scholar]
- Kevin, R.C.; Cairns, E.A.; Boyd, R.; Arnold, J.C.; Bowen, M.T.; McGregor, I.S.; Banister, S.D. Off-target pharmacological profiling of synthetic cannabinoid receptor agonists including AMB-FUBINACA, CUMYL-PINACA, PB-22, and XLR-11. Front. Psychiatry 2022, 13, 1048836. [Google Scholar] [CrossRef] [PubMed]
- Sparkes, E.; Boyd, R.; Chen, S.; Markham, J.W.; Luo, J.L.; Foyzun, T.; Zaman, H.; Fletcher, C.; Ellison, R.; McGregor, I.S.; et al. Synthesis and pharmacological evaluation of newly detected synthetic cannabinoid receptor agonists AB-4CN-BUTICA, MMB-4CN-BUTINACA, MDMB-4F-BUTICA, MDMB-4F-BUTINACA, and their analogs. Front. Psychiatry 2022, 13, 1010501. [Google Scholar] [CrossRef] [PubMed]
- Abbott, M.J.; Dunnett, J.; Wheeler, J.; Davidson, A. The identification of synthetic cannabinoids in English prisons. Forensic Sci. Int. 2023, 348, 111613. [Google Scholar] [CrossRef] [PubMed]
- Patel, M.; Grimsey, N.L.; Banister, S.D.; Finlay, D.B.; Glass, M. Evaluating signaling bias for synthetic cannabinoid receptor agonists at the cannabinoid CB2 receptor. Pharmacol. Res. Perspect. 2023, 11, e01157. [Google Scholar] [CrossRef] [PubMed]
- Lobato-Freitas, C.; Brito-Da-Costa, A.M.; Dinis-Oliveira, R.J.; Carmo, H.; Carvalho, F.; Silva, J.P.; Dias-Da-Silva, D. Overview of synthetic cannabinoids ADB-FUBINACA and AMB-FUBINACA: Clinical, analytical, and forensic implications. Pharmaceuticals 2021, 14, 186. [Google Scholar] [CrossRef] [PubMed]
- Adamowicz, P. Fatal intoxication with synthetic cannabinoid MDMB-CHMICA. Forensic Sci. Int. 2016, 261, e5–e10. [Google Scholar] [CrossRef] [PubMed]
- Brandon, A.M.; Antonides, L.H.; Riley, J.; Epemolu, O.; McKeown, D.A.; Read, K.D.; McKenzie, C. A systematic study of the in vitro pharmacokinetics and estimated human in vivo clearance of indole and indazole-3-carboxamide synthetic cannabinoid receptor agonists detected on the illicit drug market. Molecules 2021, 26, 1396. [Google Scholar] [CrossRef] [PubMed]
- US FDA, CDER., and CBER, M10 Bioanalytical Method Validation and Study Sample Analysis (Guidance for Industry); The International Council for Harmonisation (ICH) of Technical Requirements for Pharmaceuticals for Human Use): New Hampshire Avenue, Washington, DC, USA, 2022; pp. 1–55.
- Yu, R.-H.; Cao, Y.-X. A method to determine pharmacokinetic parameters based on andante constant-rate intravenous infusion. Sci. Rep. 2017, 7, 13279. [Google Scholar] [CrossRef]
- Carrillo, J.A.; Benitez, J. CYP1A2 activity, gender and smoking, as variables influencing the toxicity of caffeine. Br. J. Clin. Pharmacol. 1996, 41, 605–608. [Google Scholar] [CrossRef]
- OECD. OECD Guideline for Testing of Chemicals, Section 4, Test No. 407: Repeated Dose 28-Day Oral Toxicity Study in Rodents; OECD Publishing: Paris, France, 2008. [Google Scholar] [CrossRef]
- Carleton, H.M. Carleton’s Histological Technique; Drury, R.A.B., Wallington, E.A., Eds.; Oxford University Press: Oxford, UK; New York, NY, USA, 1980. [Google Scholar]


| Temp. Gradient °C/min | Temperature °C | Hold Time min | Run Time min |
|---|---|---|---|
| - | 150 | 2 | 0.5 |
| 30 | 320 | 5.3333 | 13 |
| Compound | Retention Time (min) | Quantifier Transition Ion | Collision Energy (eV) | Qualifier Transition Ions | Collision Energy (eV) | ||
|---|---|---|---|---|---|---|---|
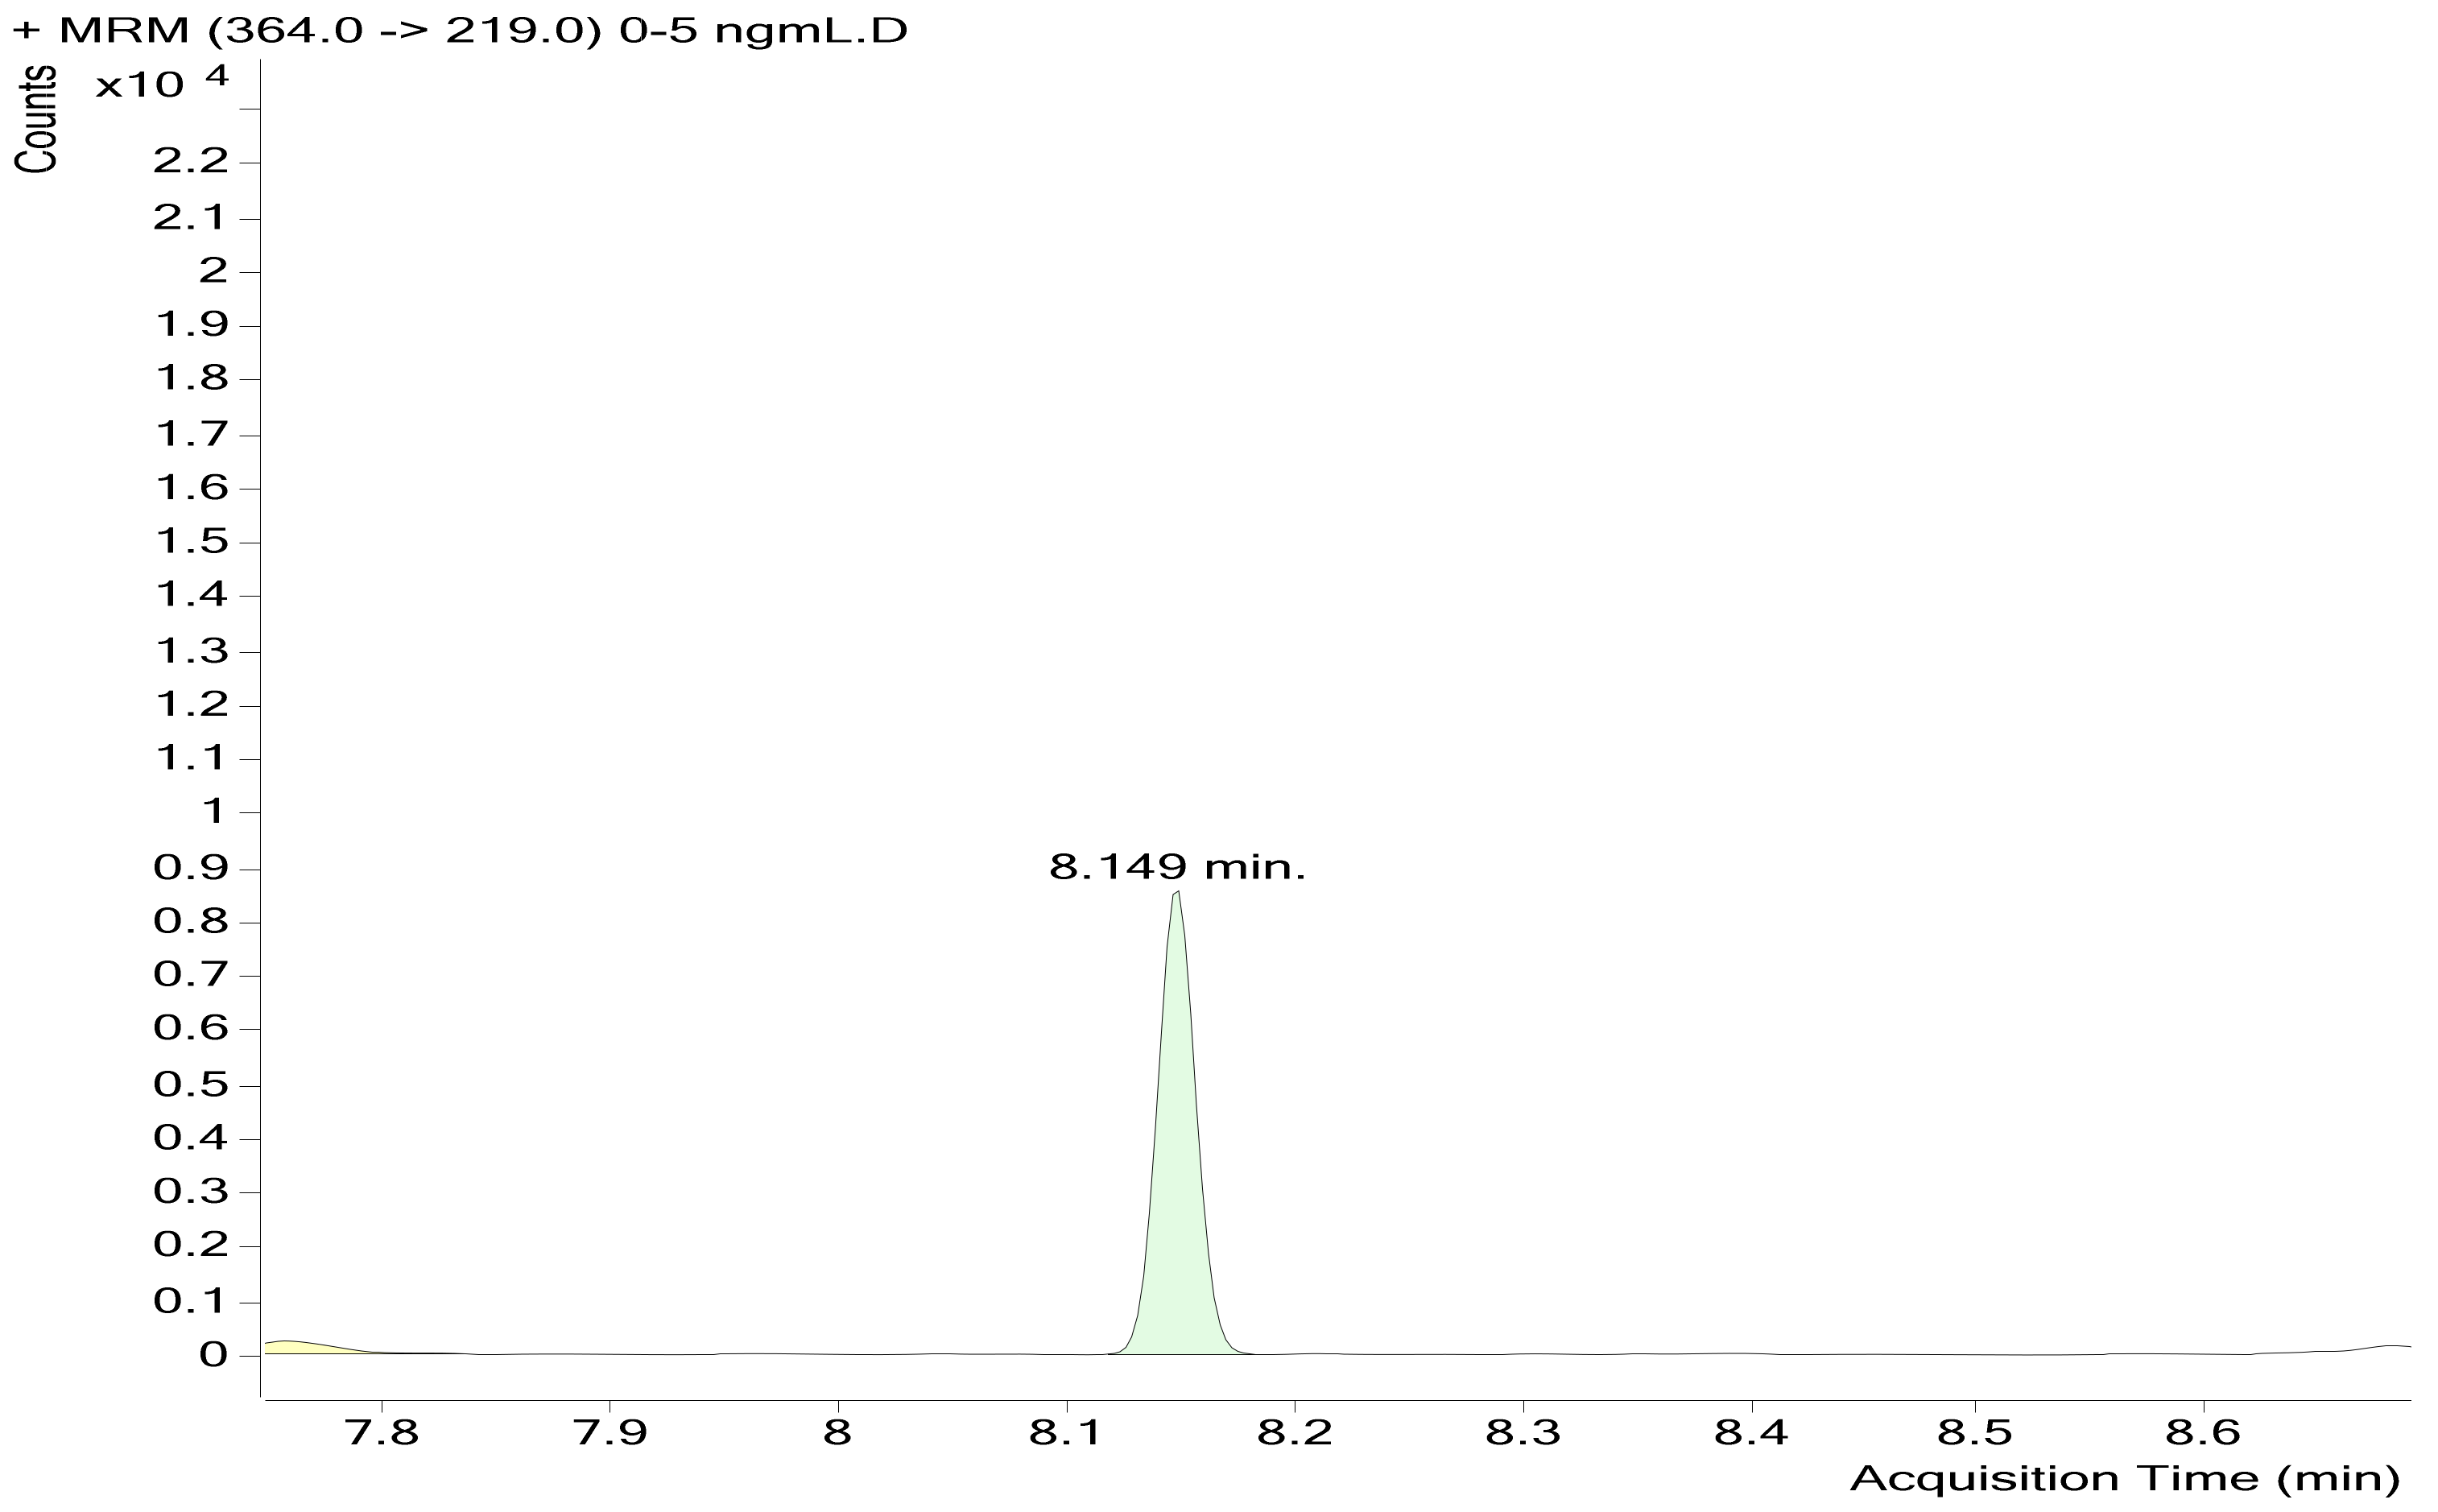
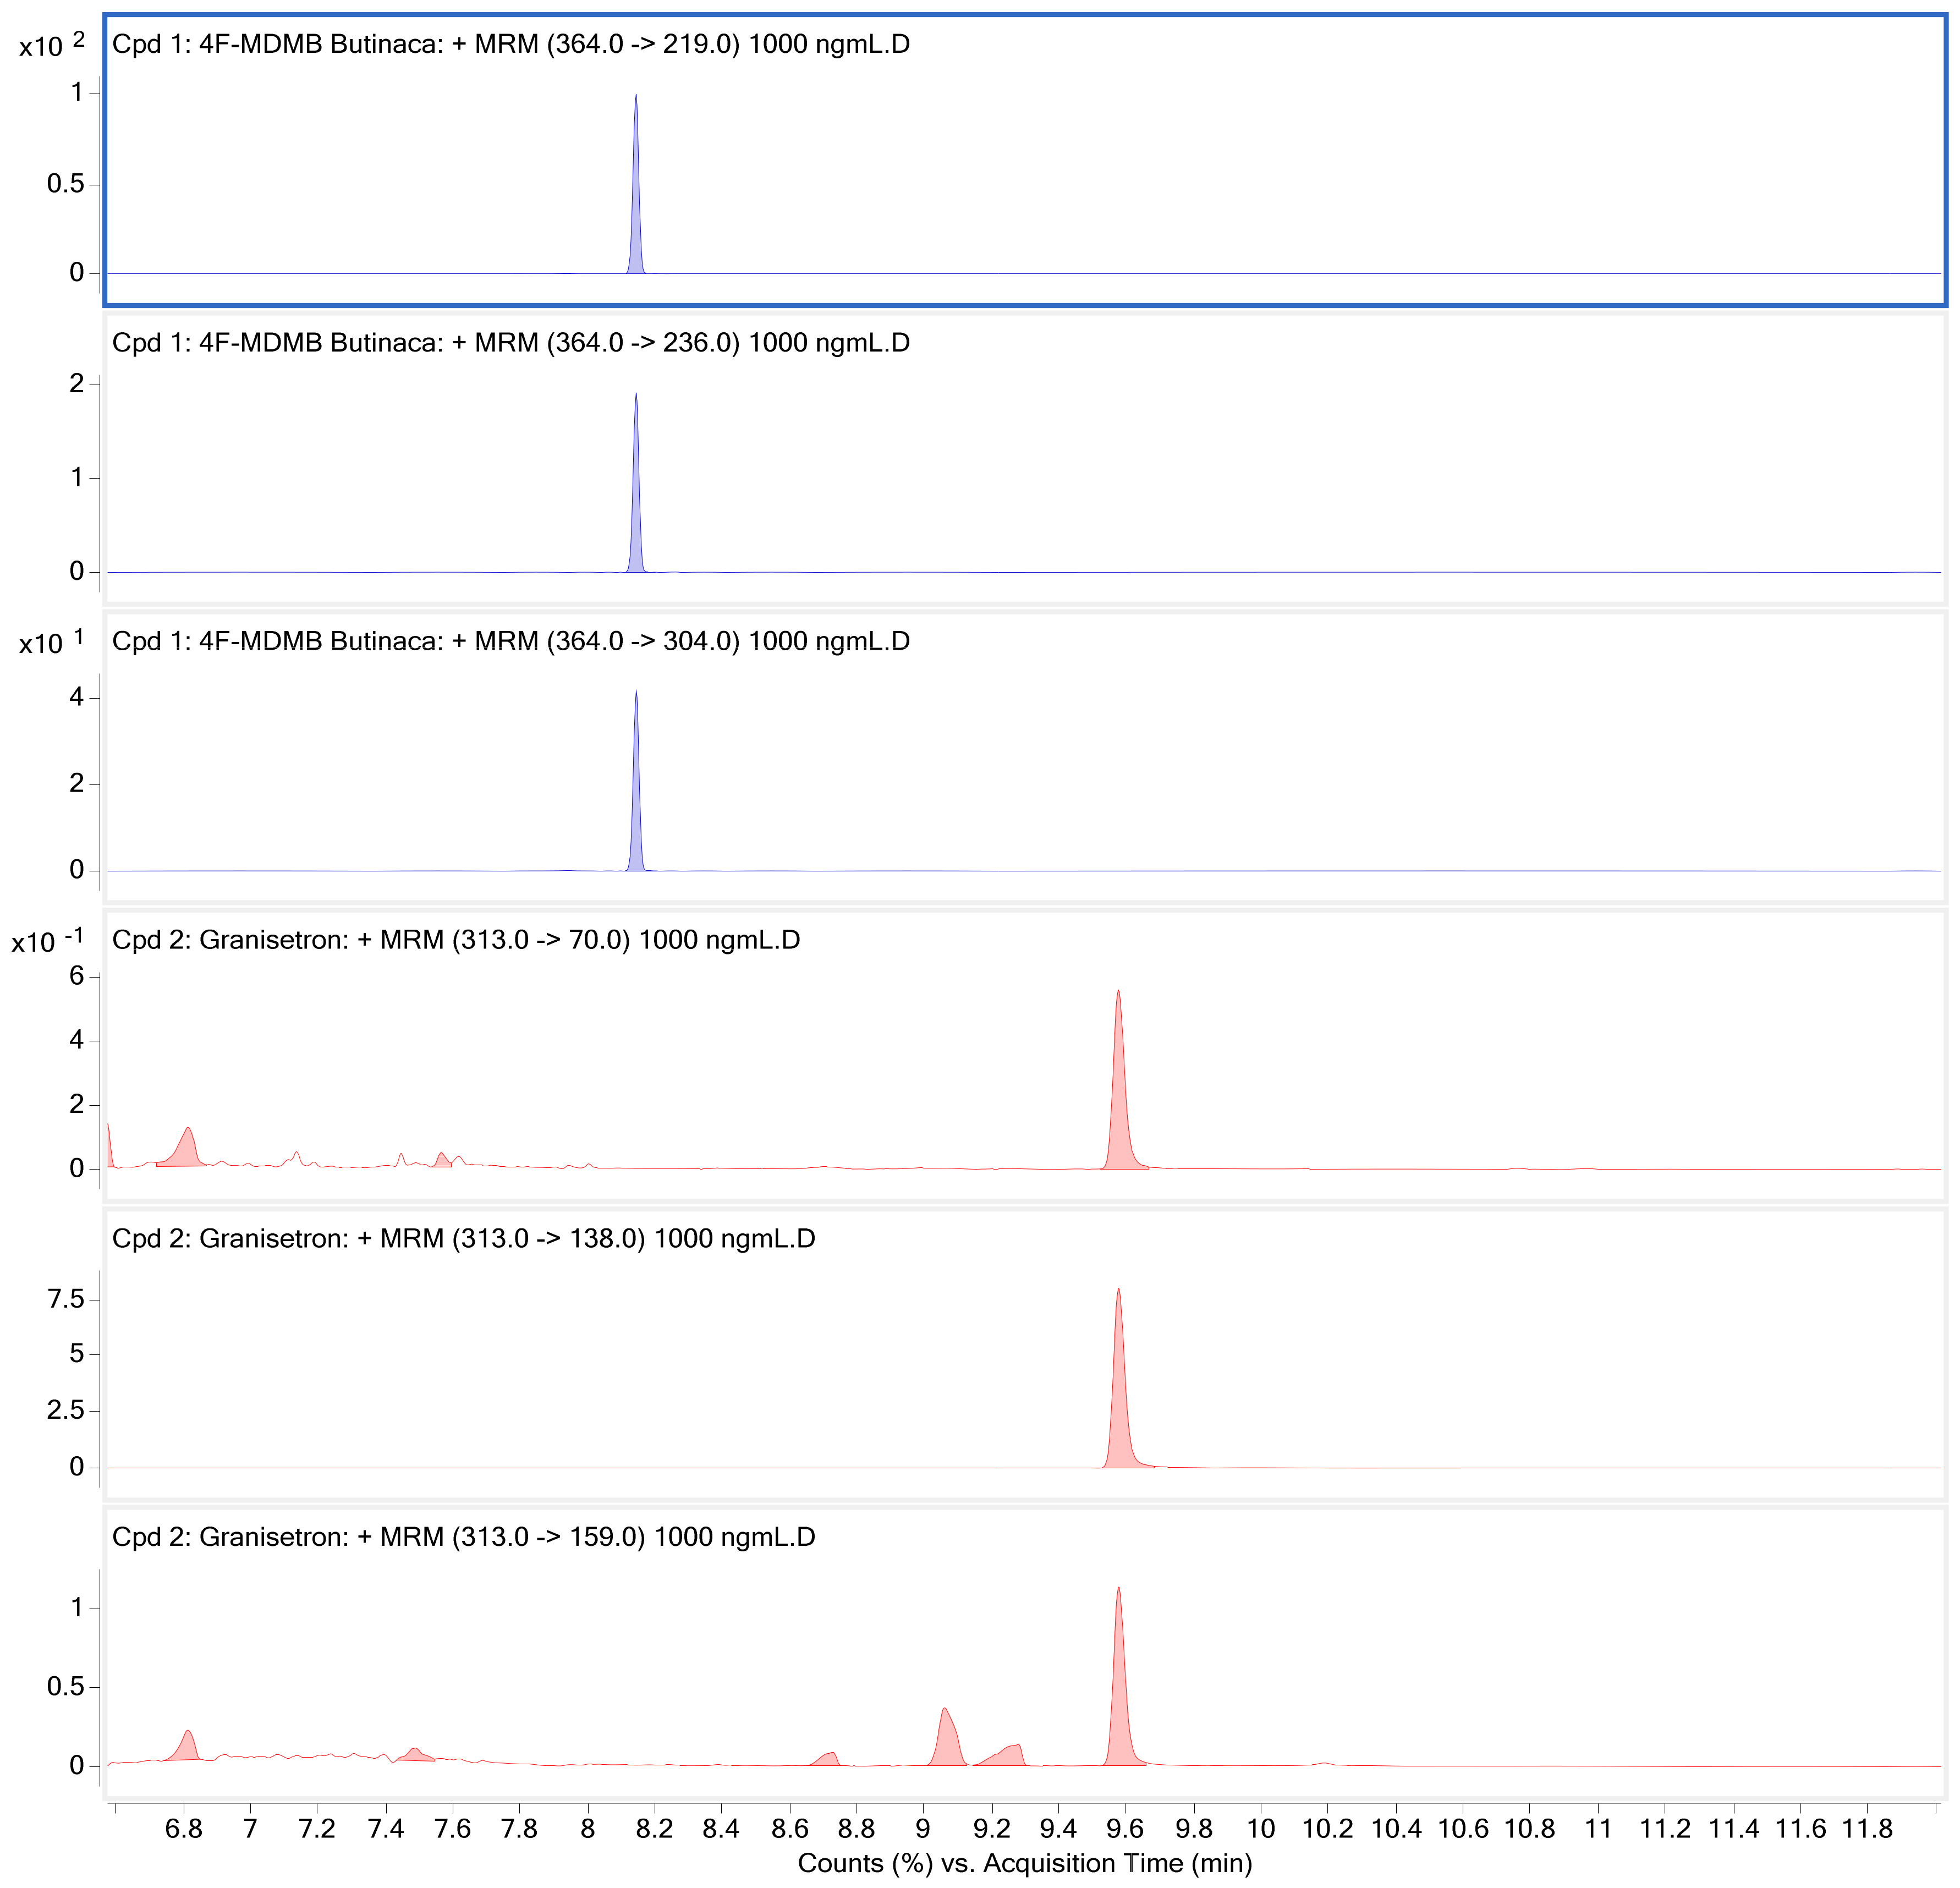
| 4−Fluoro MDMB−BUTINACA | 8.149 | 364 | 304 | 20 | 364 | 345 | 20 |
| 364 | 219 | ||||||
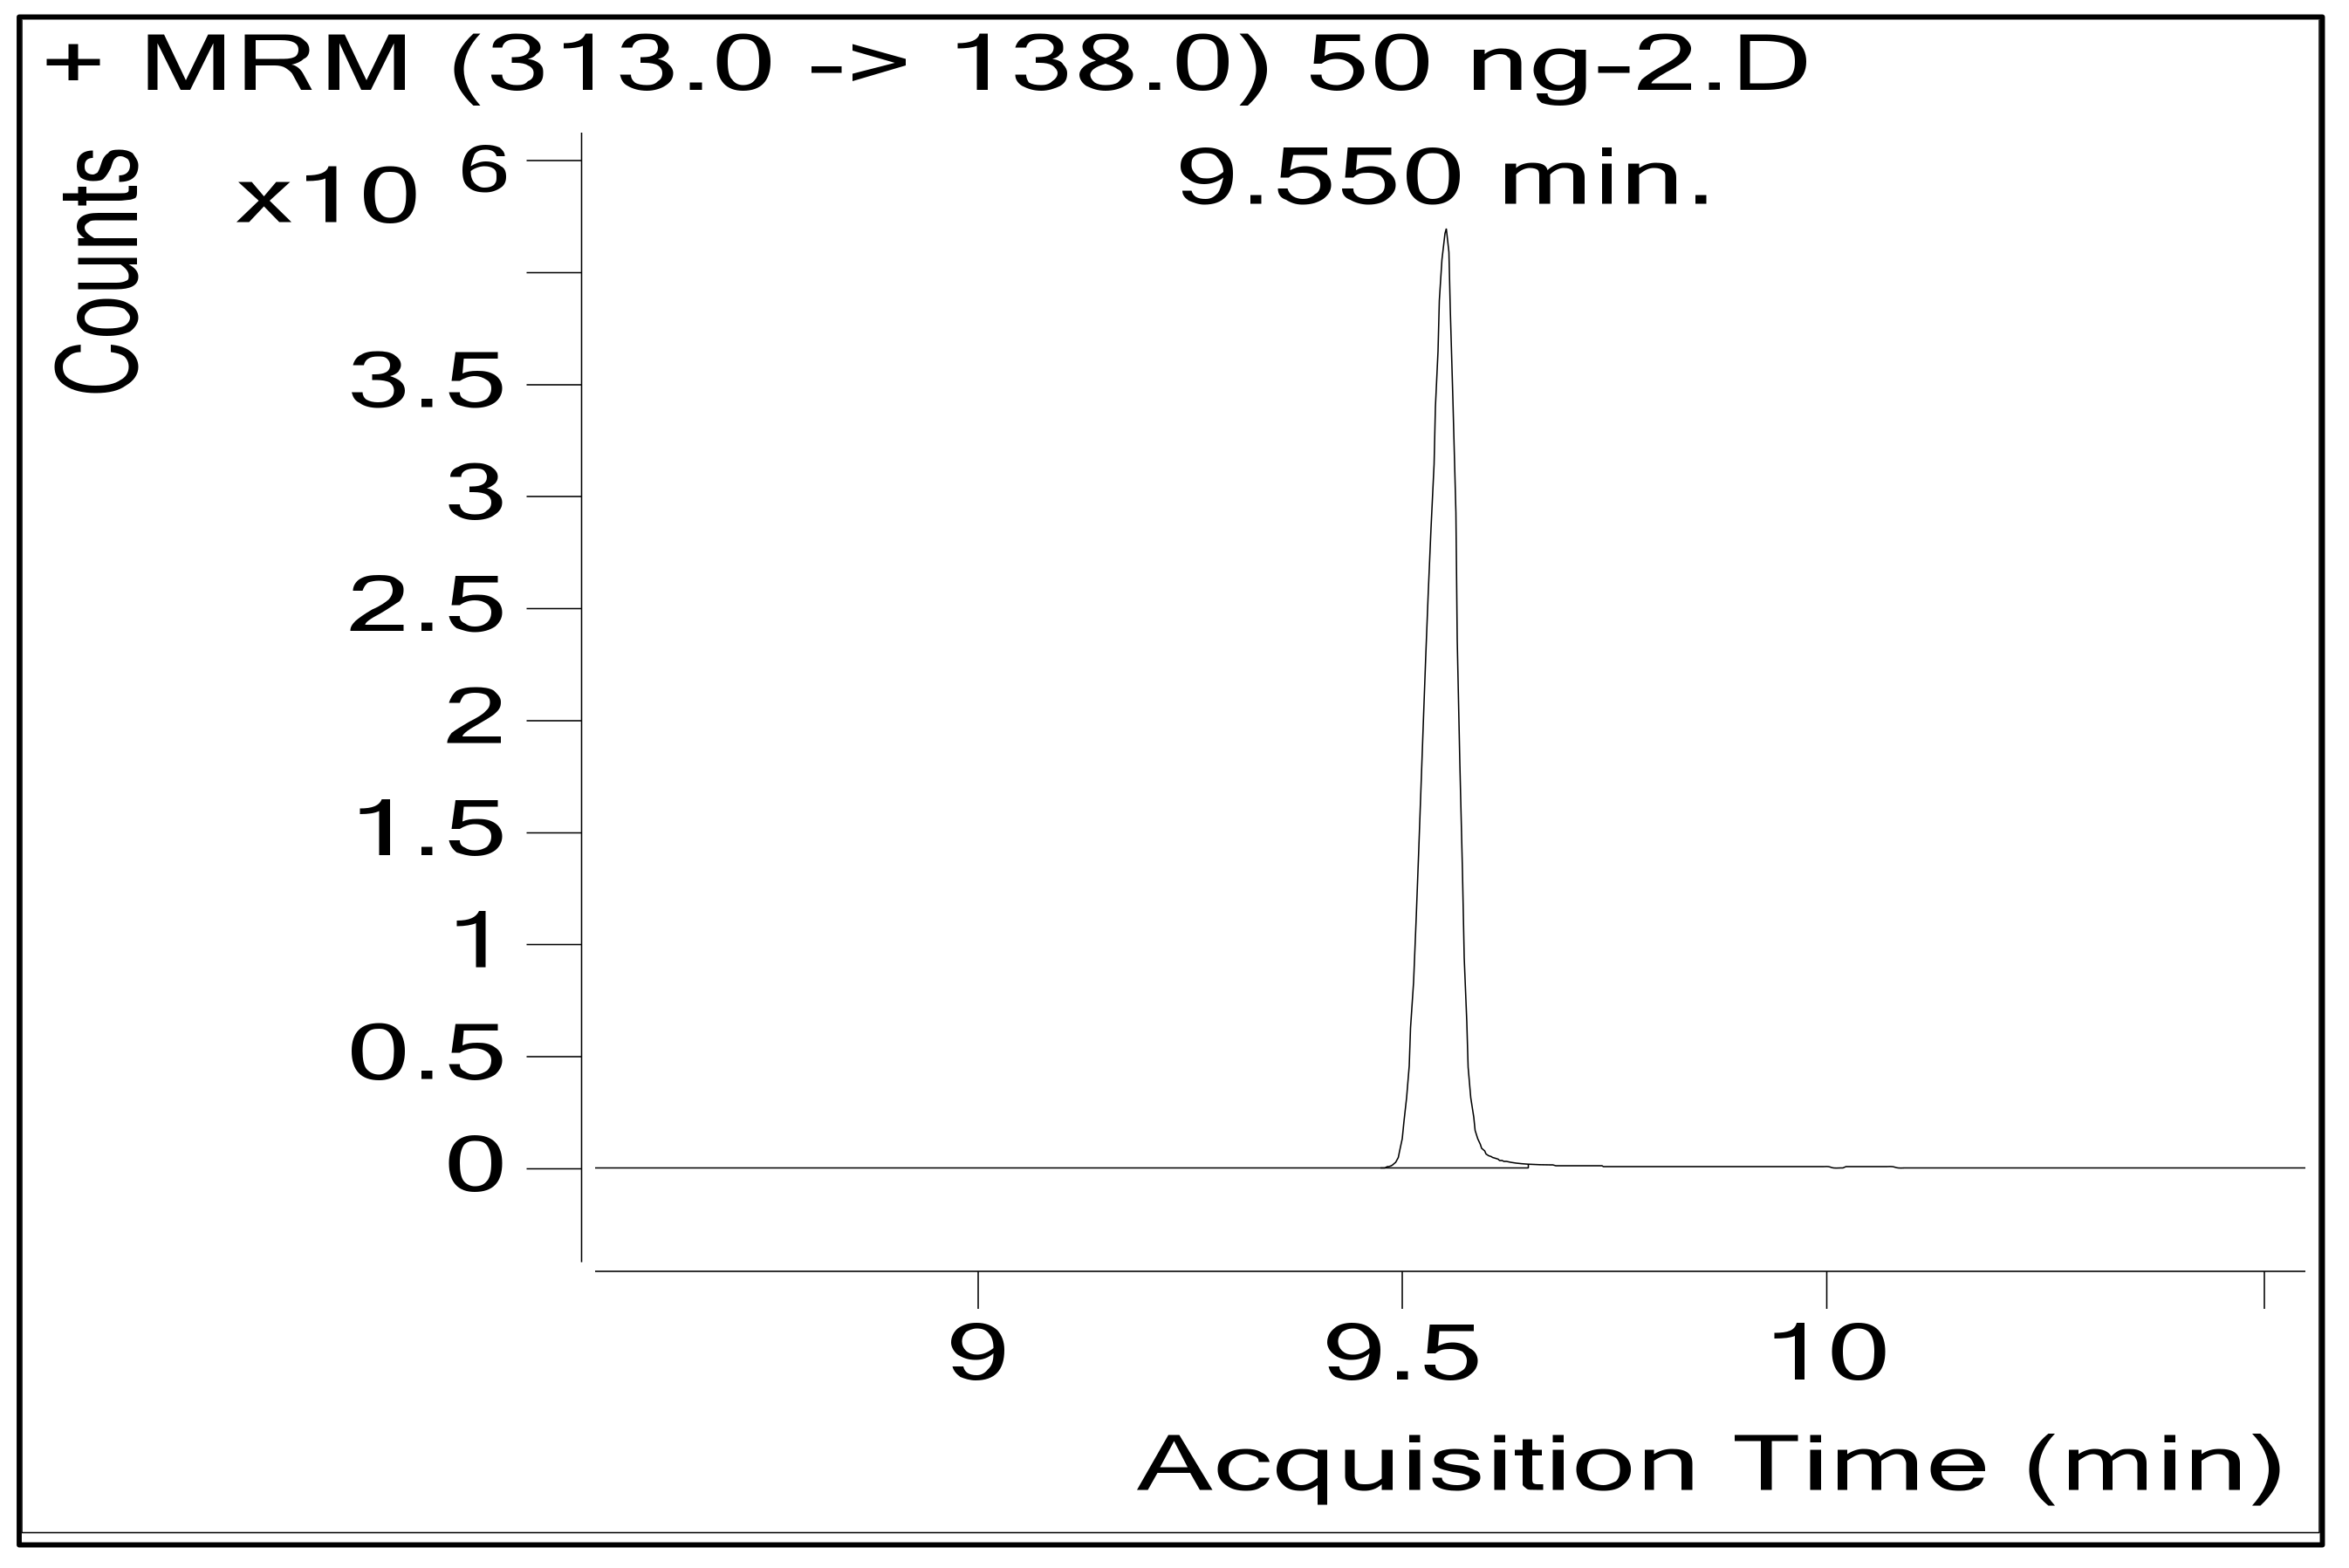
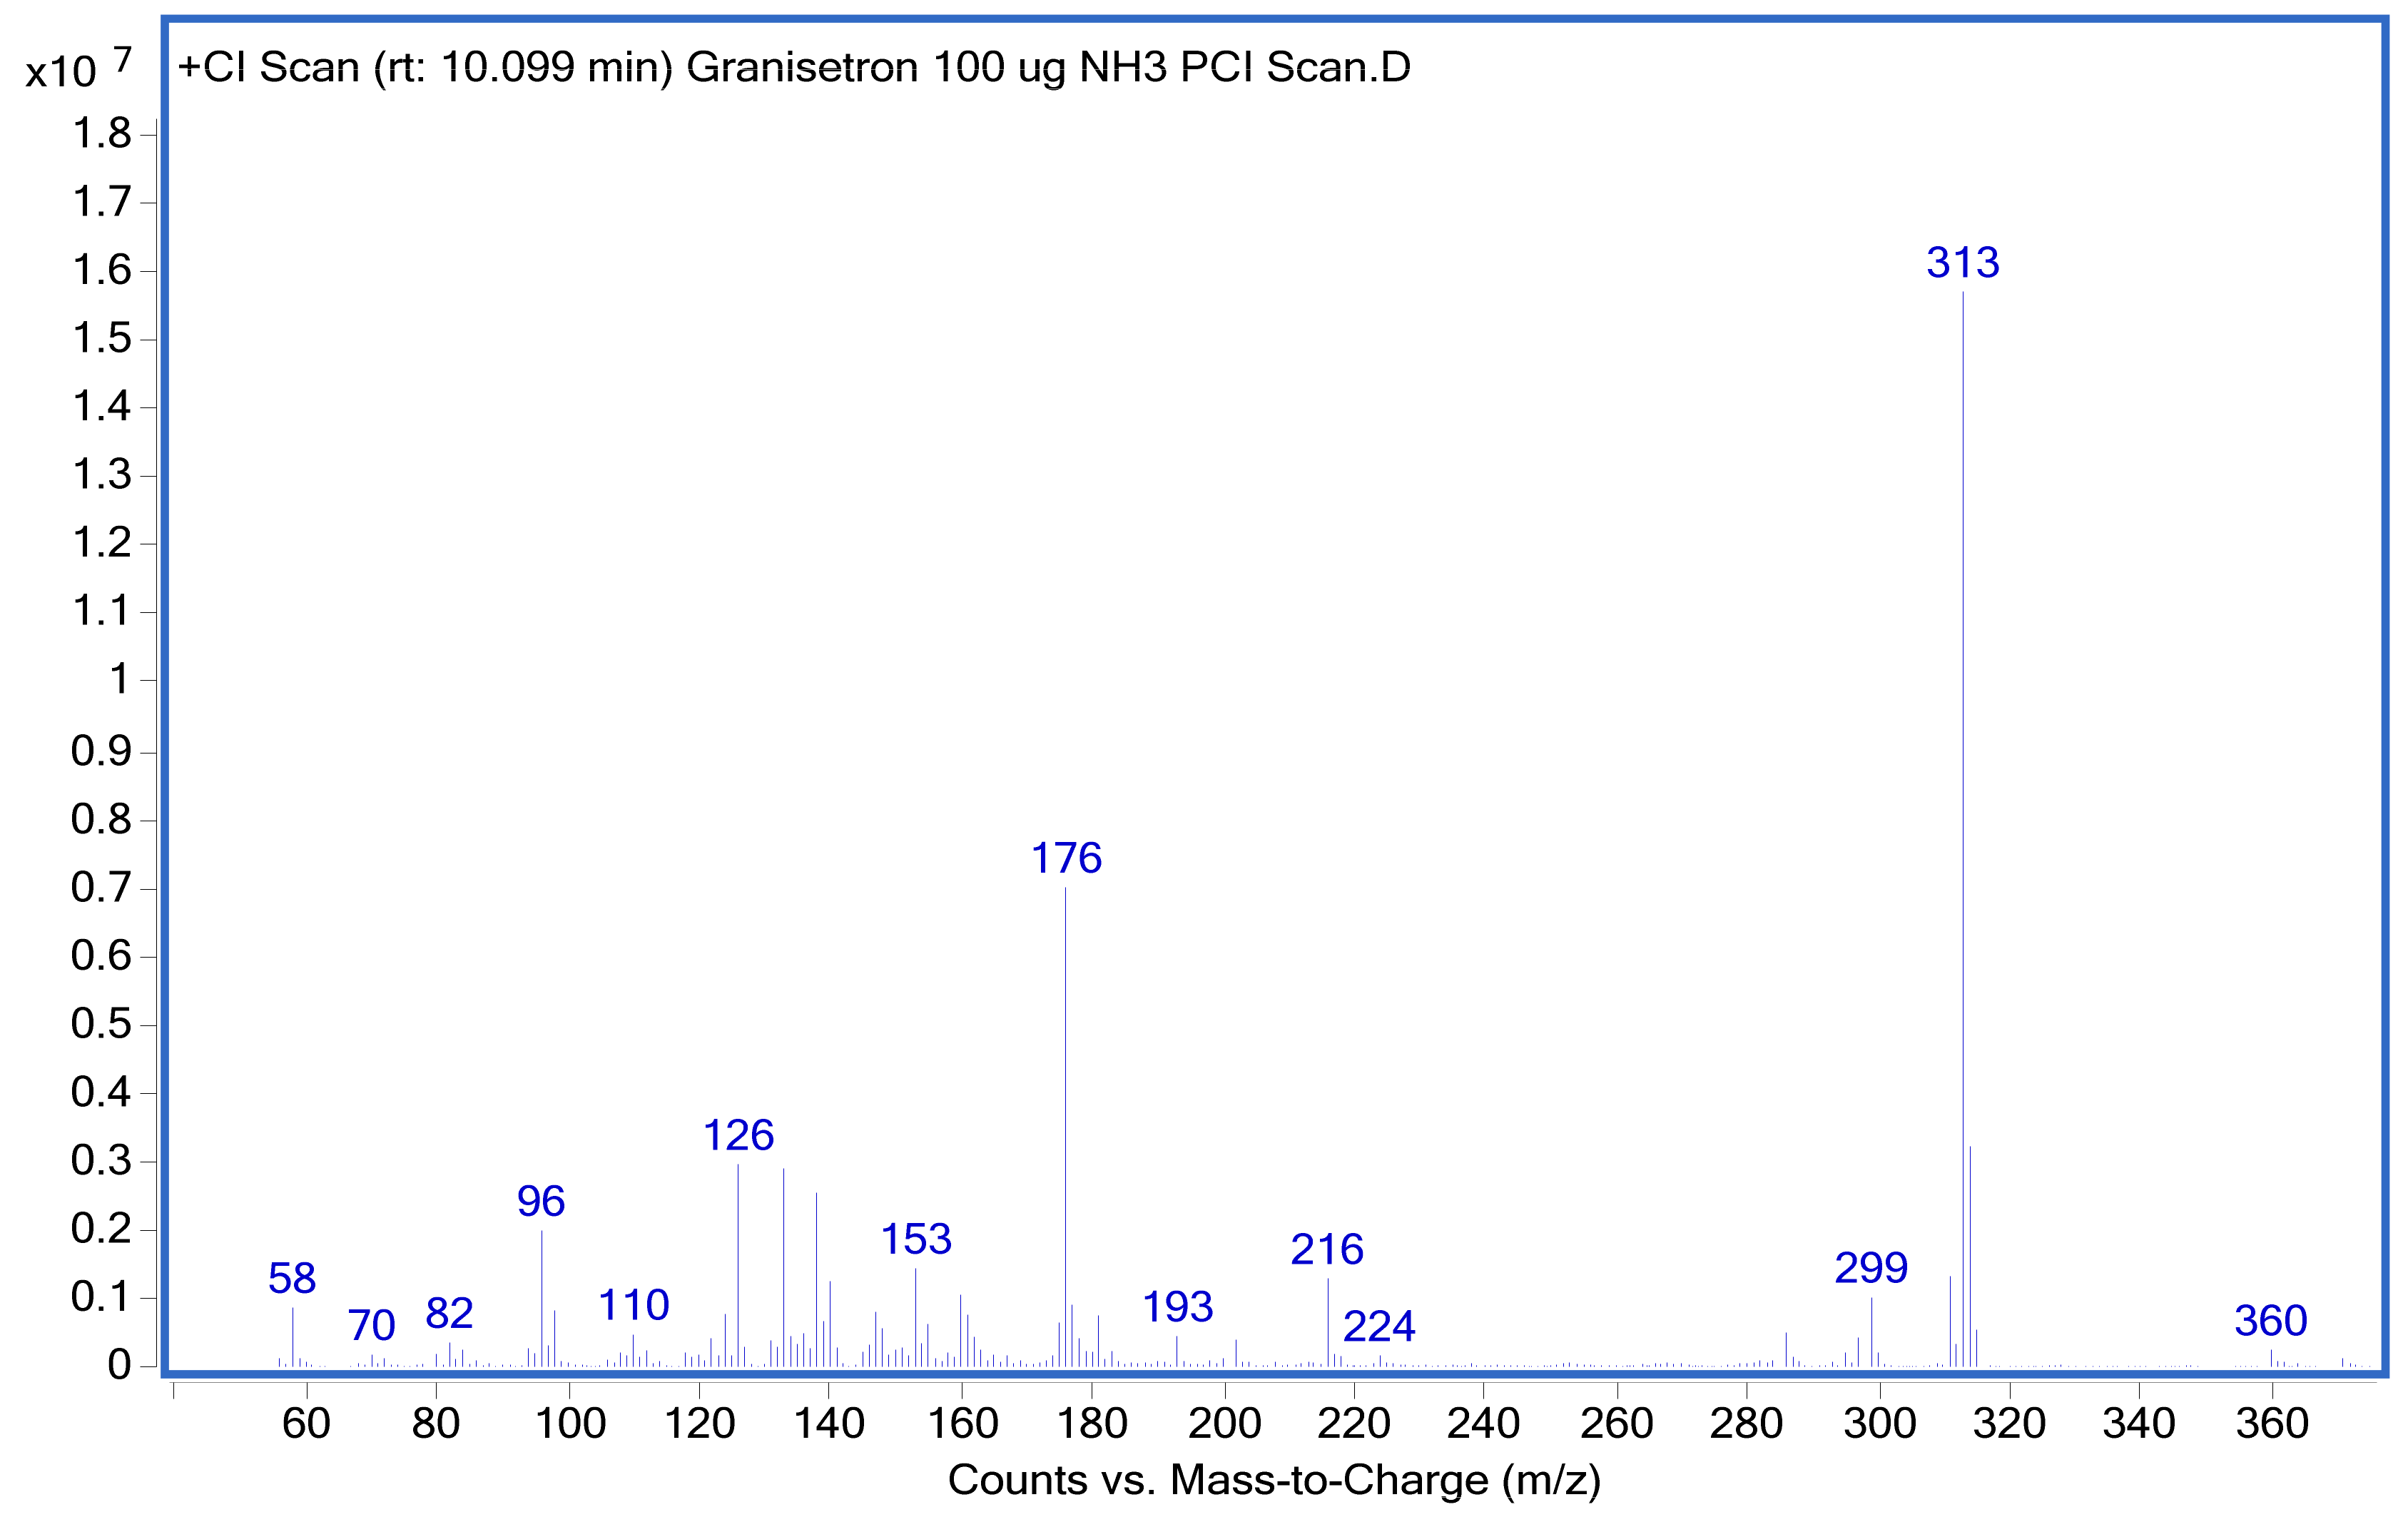
| Granisetron (IS) | 9.550 | 313 | 176 | 12 | 313 | 126 | 12 |
| 313 | 96 | ||||||
| Plasma Concentration (ng/mL) | Mean Recovery Concentration (ng/mL) | SD | RSD% | Bias |
|---|---|---|---|---|
| <15% | ±<15% | |||
| 10 | 9.372 | 0.236 | 2.52 | −6.28 |
| 100 | 95.586 | 2.466 | 2.58 | −4.41 |
| 500 | 498.248 | 8.207 | 1.647 | −0.35 |
| Expected | QC1-10 ng/mL | QC2-100 ng/mL | QC3-500 ng/mL |
|---|---|---|---|
| Day 1 | 9.372 | 95.586 | 498.248 |
| Day 2 | 9.35 | 97.05 | 487.804 |
| Day 3 | 9.62 | 97.742 | 489.66 |
| Mean | 9.447 | 96.793 | 491.904 |
| S.D. | 0.150 | 1.101 | 5.572 |
| RSD% | 1.587 | 1.137 | 1.133 |
| Bias% | −5.527% | −3.207% | −1.619% |
| Post-administration time (hours) | 0.5 (n = 6) | 1 (n = 6) | 2 (n = 6) | 4 (n = 4) | 6 (n = 1) |
| Mean plasma concentration in (ng/kg) for oral administeration of 50 mg/kg of the substance | 23.557 | 28.64 | 41.135 | 87.18 | 110.371 |
| Log10 for dose 50 mg/kg | 1.372 | 1.457 | 1.614 | 1.940 | 2.043 |
| Intercept | 1.3424 |
| Slope | 0.1269 |
| C0 | 21.99885109 ng/kg |
| K | 0.2922507 h−1 |
| Dose | 50,000,000 ng/kg |
| Vd | 2272.85 L |
| t1/2 | 2.371 h. |
| Cl | 664.241 L/h |
| AUC | 75.2739 ng·h/mL |
| Parameters | Control (n = 6) | 4F-MDMB-BUTINACA (1 mg/kg/Day) (n = 6) | 4F-MDMB-BUTINACA (5 mg/kg/Day) (n = 6: 3 Survived, 3 Died) |
|---|---|---|---|
| WBC | 3.8 ± 0.47 | 2.67 ± 0.26 | 2.00 ± 0.32 |
| RBC | 6.82 ± 0.33 | 7.30 ± 0.28 | 7.18 ± 0.38 |
| HGB | 13.17 ± 0.34 | 13.40 ± 0.56 | 13.60 ± 0.32 |
| HCT | 42.93 ± 2.8 | 47.43 ± 2.5 | 43.87 ± 0.58 |
| MCV | 63.07 ± 1.7 | 65.43 ± 6 * | 61.40 ± 2.9 * |
| MCH | 19.33 ± 0.58 | 18.37 ± 0.9 | 19 ± 0.6 |
| MCHC | 30.70 ± 0.41 | 28.50 ± 2.5 * | 31 ± 0.76 * |
| RDW | 18.10 ± 0.5 | 22.17 ± 5.1 * | 19.57 ± 0.9 * |
| PLT | 748.33 ± 49 | 824.67 ± 19 * | 789.67 ± 7.4 * |
| NE | 0.13 ± 0.13 | 0.05 ± 0.001 * | 0.33 ± 0.06 * |
| LY | 2.33 ± 0.3 | 2.30 ± 0.2 | 1.60 ± 0.32 |
| ES | 0.33 ± 0.033 | 0.001 ± 0.011 * | 0.001 ± 0.01 * |
| BA | 0.33 ± 0.033 | 0.001 ± 0.012 * | 0.067 ± 0.66 * |
| Parameters | Control (n = 6) | 4F-MDMB-BUTINACA (1 mg/kg/Day) (n = 6) | 4F-MDMB-BUTINACA (5 mg/kg/Day) (n = 6: 3 Survived, 3 Died) |
|---|---|---|---|
| AST (U/L) | 115.65 ± 2.1 | 145.18 ± 3.3 * | 146.1 ± 1.2 * |
| ALT (U/L) | 64.28 ± 0.43 | 75.8 ± 9.1 * | 78.06 ± 6.7 * |
| GGT (U/L) | 45.6 ± 3.7 | 56.43 ± 2.2 * | 46.18 ± 1.4 * |
| ALP (U/L) | 562.03 ± 16.4 | 623.32 ± 14 | 591.5 ± 17.5 * |
| HDL (mmol/L) | 1.47 ± 0.1 | 1.14 ± 0.04 | 1.21 ± 0.07 |
| LDH (U/L) | 238.4 ± 5.4 | 392.9 ± 57.2 | 204.28 ± 9.1 |
| CHOL (mmol/L) | 2.26 ± 0.2 | 1.85 ± 0.2 | 1.88 ± 0.05 |
| TG (mmol/L) | 0.81 ± 0.07 | 0.93 ± 0.31 * | 0.92 ± 0.2 |
| TBIL (umol/L) | 1.523 ± 0.44 | 2.5 ± 0.02 * | 2.32 ± 0.1 * |
| DBIL (umol/L) | 0.157 ± 0.1 | 0.27 ± 0.03 | 0.5 ± 0.1 |
| TP (g/L) | 61.1 ± 0.31 | 55.21 ± 1.4 * | 60.7 ± 0.5 * |
| ALB (g/L) | 32.3 ± 0.14 | 29.51 ± 1.2 * | 32.75 ± 0.92 * |
| UREA (mmol/L) | 5.84 ± 0.5 | 5.36 ± 0.6 | 8.95 ± 0.26 * |
| Na (mmol/L) | 140.9 ± 0.2 | 139.88 ± 0.52 | 142.4 ± 0.75 |
| K (mmol/L) | 5.36 ± 0.14 | 5.12 ± 0.5 | 4.76 ± 0.17 |
| CL (mmol/L) | 99.03 ± 0.9 | 97.24 ± 1.8 | 101.33 ± 1 |
| PHOS (mmol/L) | 3.24 ± 0.8 | 3.147 ± 0.1 | 2.5 ± 0.3 |
| IRON (umol/L) | 43.5 ± 6.5 | 33.38 ± 5.8 | 58.15 ± 18 |
| Ca (mmol/L) | 3.057 ± 0.05 | 3.1 ± 0.05 | 2.73 ± 0.6 |
Disclaimer/Publisher’s Note: The statements, opinions and data contained in all publications are solely those of the individual author(s) and contributor(s) and not of MDPI and/or the editor(s). MDPI and/or the editor(s) disclaim responsibility for any injury to people or property resulting from any ideas, methods, instructions or products referred to in the content. |
© 2024 by the authors. Licensee MDPI, Basel, Switzerland. This article is an open access article distributed under the terms and conditions of the Creative Commons Attribution (CC BY) license (https://creativecommons.org/licenses/by/4.0/).
Share and Cite
Abdelgadir, E.H.; Al-Qudsi, J.; Abu-Nukhaa, E.S.; Alsidrani, D.A. Subacute Toxicity and Pharmacokinetic Evaluation of the Synthetic Cannabinoid 4F-MDMB-BUTINACA in Rats: A Forensic and Toxicological Perspective. Future Pharmacol. 2024, 4, 676-699. https://doi.org/10.3390/futurepharmacol4040036
Abdelgadir EH, Al-Qudsi J, Abu-Nukhaa ES, Alsidrani DA. Subacute Toxicity and Pharmacokinetic Evaluation of the Synthetic Cannabinoid 4F-MDMB-BUTINACA in Rats: A Forensic and Toxicological Perspective. Future Pharmacology. 2024; 4(4):676-699. https://doi.org/10.3390/futurepharmacol4040036
Chicago/Turabian StyleAbdelgadir, Elkhatim Hassan, Jihad Al-Qudsi, Elham S. Abu-Nukhaa, and Dimah A. Alsidrani. 2024. "Subacute Toxicity and Pharmacokinetic Evaluation of the Synthetic Cannabinoid 4F-MDMB-BUTINACA in Rats: A Forensic and Toxicological Perspective" Future Pharmacology 4, no. 4: 676-699. https://doi.org/10.3390/futurepharmacol4040036
APA StyleAbdelgadir, E. H., Al-Qudsi, J., Abu-Nukhaa, E. S., & Alsidrani, D. A. (2024). Subacute Toxicity and Pharmacokinetic Evaluation of the Synthetic Cannabinoid 4F-MDMB-BUTINACA in Rats: A Forensic and Toxicological Perspective. Future Pharmacology, 4(4), 676-699. https://doi.org/10.3390/futurepharmacol4040036