Article

Electron Spin Resonance Spectroscopy Suitability for Investigating the Oxidative Stability of Non-Alcoholic Beers

by
Maria Cristina Porcu
* and
Daniele Sanna
*
Istituto di Chimica Biomolecolare, Consiglio Nazionale delle Ricerche, Traversa la Crucca 3, 07100 Sassari, Italy
*
Authors to whom correspondence should be addressed.
Oxygen 2025, 5(3), 14; https://doi.org/10.3390/oxygen5030014
Submission received: 25 June 2025 / Revised: 11 July 2025 / Accepted: 11 July 2025 / Published: 16 July 2025

Abstract

Seven lager beers and seven non-alcoholic counterparts, marketed by the same producers, were analyzed for their total phenolic content (TPC), radical scavenging activity (RSA) towards the DPPH radical and ThioBarbituric Index (TBI). All beers were also subjected to spin trapping experiments at 60 °C in the presence of PBN. To our knowledge, this is the first time that non-alcoholic beers (NABs) have been subjected to spin trapping experiments coupled with Electron Spin Resonance (ESR) spectroscopy. The evolution of the intensity of the PBN radical adducts during the first 150 min was represented graphically and the intensity at 150 min (I150) and the area under the curve (AUC), were measured. The I150 and the AUC of lagers and NABs are significantly different, whereas the TPC, the EC50 of the DPPH assay, and the TBI of the two groups are superimposed. A relationship, previously proposed by us, to correlate ESR spectroscopy parameters with others obtained from UV-Vis spectrophotometry, was also applied, demonstrating its practicability. Multivariate analysis shows that clustering in two separate groups occurs only if I150 and AUC are included in the model. Based on these results, ESR spectroscopy can be applied to study the oxidative stability of NABs.

1. Introduction

In recent years, a constant growth in non-alcoholic and low-alcoholic drink consumption has been reported [1] and beer is no exception [2,3]. This phenomenon is mostly linked to a greater awareness of health-related aspects but other motivations are often reported as factors affecting the choice of non-alcoholic beers (NABs) [4], reflecting the need to comply with ever more stringent prescriptions in driving laws and the general goal of reducing harmful alcohol consumption [5]. Nonetheless, “regular” alcoholic beers are still, by far, the leaders in production and sales [6], with NABs still facing some skepticism principally due to a perceived lower quality in taste [7,8,9,10], but also influenced by ongoing stereotypes, often gender-related, associated with their consumption [11]. Another feature of NABs that causes particular concern is their reduced shelf life, ascribable to a greater susceptibility to both microbiological spoilage [12] and oxidation, the latter possibly due to the lack of the radical scavenger activity of ethanol [13].
The alcohol range for non-alcoholic and low-alcoholic beers (NABLABs) varies across the world and is not always defined by legislation. An alcohol content by volume (ABV) of 0.5% is a common limit for NAB, with the term “alcohol-free” often limited to 0% ABV, but in many European countries only a content higher than 1.2% has to be declared on the label, and, sometimes, with a content of around 3% beers are still considered low-alcohol [14,15,16,17]. Ethanol content is also related to the technological process used to reach the desired level. The first distinction in the production of NABs can be made between biological and physical methods: each of these approaches has pros and cons, both economically and with respect to the sensorial quality of the final product [9,17,18]. Biological methods consist in the limitation of the fermentation process, by interrupting it before its completion, or by controlling it with low temperatures (cold fermentation) or the use of immobilized yeast [19]. The ethanol production is reduced, and the formation of at least some of the flavoring by-products characteristic of beer is still allowed, albeit not enough to cover the persistent “worty” flavors, whose perception is even enhanced by the presence of residual mono- and disaccharides and by the reduced ethanol content [20]. The first step to improve quality can be the selection of particular yeast strains, incapable of fermenting maltose and maltotriose in wort, but still capable of producing the volatile ingredients that define beer aroma from simple sugars [21,22,23], also in association with worts containing less fermentable sugars [24]. Other approaches may include the introduction of new technological measures, such as the use of selective molecular sieves to absorb and remove the Strecker aldehydes responsible for worty off-flavors [25]. Biological methods, requiring fewer adjustments in the production layouts, are often preferred by small and craft breweries [10], but only physical dealcoholization methods allow the production of near zero-alcohol beers (less than 0.05%) [26]. Physical methods have the advantage of intervening when the production of flavors from fermentation has already occurred, but, on the other hand, they can contribute to their depletion, particularly when high temperature (30–60 °C) steps are involved (thermal methods) [17]. With the aim of improving sensorial quality, mechanical methods utilizing semipermeable membranes, such as reverse osmosis, dialysis, osmotic distillation or pervaporation are being thoroughly studied [26], but the complete retention of the original flavors of beer seems to be virtually impossible [27,28]; therefore, a subsequent addition of flavors, if allowed by national regulations, or an enhanced hop aroma (also through dry hopping) may still be useful to improve the taste [10,26,29].
The aforementioned higher vulnerability of NABLABs to oxidation has been investigated mainly through sensory analysis and standard and chromatographic techniques. Simon and Collin [13] investigated the aging of 11 commercial NABLABs during 1 year of storage at 20 °C, by following the reduction of polyphenols and bitter compounds through spectrophotometric methods and RP-HPLC-UV, and observed a correlation between these variations and the increase in color and chill haze. Bauwens et al. [30], confronting the sensory and chemical profiles of NABs and their lager counterparts after forced aging (90 days at 30 °C), found that, apart from a greater decrease in trans-iso-α-acids observed in NABs, the chemical aging profile was similar in the two groups, but the sensory “overall aging score” was lower in NABs, maybe reflecting the higher initial concentrations of aldehydes responsible for the worty flavor and correlated with aging.
In this work, we examined seven lager beers and seven NABs counterparts marketed by the same producers. For these beers, we determined the radical scavenging activity (RSA) towards the DPPH radical, the total phenolic content (TPC) and the thiobarbituric index (TBI), an indicator of their staling degree [31]. Moreover, these beers were subjected to forced aging by heating at 60 °C, in the presence of N-tert-butyl-α-phenylnitrone (PBN), to trap, identify and quantify the radicals produced during this thermal treatment. To the best of our knowledge, this is the first time that spin-trapping methods, coupled with ESR spectroscopy, have been applied to NABs. This technique, also known as Electron Paramagnetic Resonance (EPR) spectroscopy, has been widely used, during the last three decades, in the study of beer oxidative stability, through the definition of parameters related to the beer’s shelf-life, such as the time in minutes that elapses before a sharp rise in the EPR signal intensity is observed (lag time), the intensity of the PBN adduct at 150 min (I150), and the area under the curve (AUC) representing the intensity of the PBN adduct as a function of time [32,33,34,35,36]. We attempted to relate the ESR parameters measured in both NABs and lagers with those obtained by spectrophotometric methods (RSA, TPC and TBI), analogously to our previous proposal [37]. Finally, multivariate data analysis was applied to all the available measurements to check if it is possible to distinguish alcoholic from NABs from differences in the set of variables examined other than alcohol concentration.

2. Materials and Methods

2.1. Beer Samples

Seven commercially available lager beers were used. These were identified by a letter (in parenthesis the ABV indicated on the label): N (5%), W (4.8%), B (5%), P (5%), M (4.6%), C (4.5%), and H (5%). Furthermore, seven beers, marketed by the same producers, were identified as the non-alcoholic counterparts of the alcoholic ones: N0 (0.0%), W0 (0.0%), B0 (0.3%), P0 (0.0%), M0 (0.0%), C0 (0.0%), and H0 (0.0%). The only differences in ingredients between the two counterparts were the addition of natural flavors in the NABs, with the exception of W0 and B0, and of maize in M. Beers were decarbonated as previously described [37] and stored at  − 20 °C until analysis. At the time of sampling, the average number of days remaining until the expiration date reported on the labels (DTE) calculated for the two groups was not significantly different, being 189 ± 90 and 222 ± 104 for lager and NABs, respectively.

2.2. Chemicals

Gallic acid, sodium carbonate, glacial acetic acid, N-tert-butyl-α-phenylnitrone (PBN), absolute ethanol, 2,2-diphenyl-1-picrylhydrazyl (DPPH), Folin-Ciocalteu′s phenol reagent, and 2-thiobarbituric acid (TBA) were purchased from Sigma-Aldrich (Milan, Italy). Water was deionized prior to use through a Millipore Milli-Q academic purification system.

2.3. ESR Spin-Trapping Experiments

A Bruker EMX spectrometer operating at the X-band (9.40 GHz), equipped with an ER 4111 VT variable temperature unit and with an HP 53150A frequency counter, was used to perform ESR measurements. The instrument was set up with the following parameters: modulation amplitude 1.0 G; modulation frequency 100 kHz; microwave power 20 mW; receiver gain 5 × 10⁵; time constant, and conversion time 163.84 ms. A volume of 5 µL of a 2.5 mM PBN solution in absolute ethanol was dried under nitrogen, then the solid PBN was solubilized in 250 µL of decarbonated beer samples (final PBN concentration of 50 mM). This solution (100 µL) was transferred to capillary tubes and inserted in the ESR cavity, where the sample was heated at 60 °C by a flow of hot nitrogen gas. ESR spectra were acquired every 5 min, for at least 150 min. Three replicates were examined for each sample. According to previous reports [36,37,38], the intensity of the PBN adduct after 150 min (I150) of thermal treatment and the area under the curve (AUC) intensity vs. time were considered, and the lag time was determined whenever possible as described by Porcu et al. [37]. ESR spectra of the radicals were simulated with the software Bruker WINEPR SimFonia (version 1.26 (beta), Bruker Analytik GmbH: Berlin, Germany, 1997).

2.4. DPPH Assay

An amount of 100 µL of a solution 1 mM of DPPH in absolute ethanol was mixed with 150 µL of variably diluted beer samples and with 1.75 mL of absolute ethanol. After 30 min in the dark at room temperature, the absorbance at 517 nm of the centrifuged samples (1210 g for 5 min) was measured with a Perkin Elmer Lambda 35 spectrophotometer.
The % of inhibition was calculated as follows:
% of inhibition =  (ABSblank − ABSsample)/ABSblank × 100
where ABSblank is the absorbance of a sample in which the diluted beer was replaced by 150 µL of water.
The results of the Radical Scavenging Activity (RSA) are reported as EC50 values (expressed as mL beer/mg DPPH corresponding to 50% of inhibition), obtained by fitting the experimental points with a second-order polynomial equation. The goodness of this fit was higher if compared to a straight-line or a sigmoidal four-parameters model applied to a graph representing the % of inhibition as a function of the logarithm of the beer concentration in the samples. The details are given in the Supplementary Materials.

2.5. ThioBarbituric Index (TBI)

To measure the ThioBarbituric Index (TBI), 0.25 mL of beer samples were diluted with 2.25 mL of water and then 1.25 mL of a 0.02 M thiobarbituric acid (TBA) solution in acetic acid 90% were added [37]. After 70 min at 70 °C, this mixture was rapidly cooled in an ice bath and the UV–Vis spectra were measured. The absorption at 445 nm was considered, after correction for the absorbance of the samples having the same composition except for the lack of TBA.

2.6. Data Elaboration and Multivariate Analysis

Curve fittings were carried out with GraphPad Prism 8 (GraphPad Software, San Diego, CA, USA). Principal Component Analysis (PCA) was performed using R 4.5.0 [39].

3. Results and Discussion

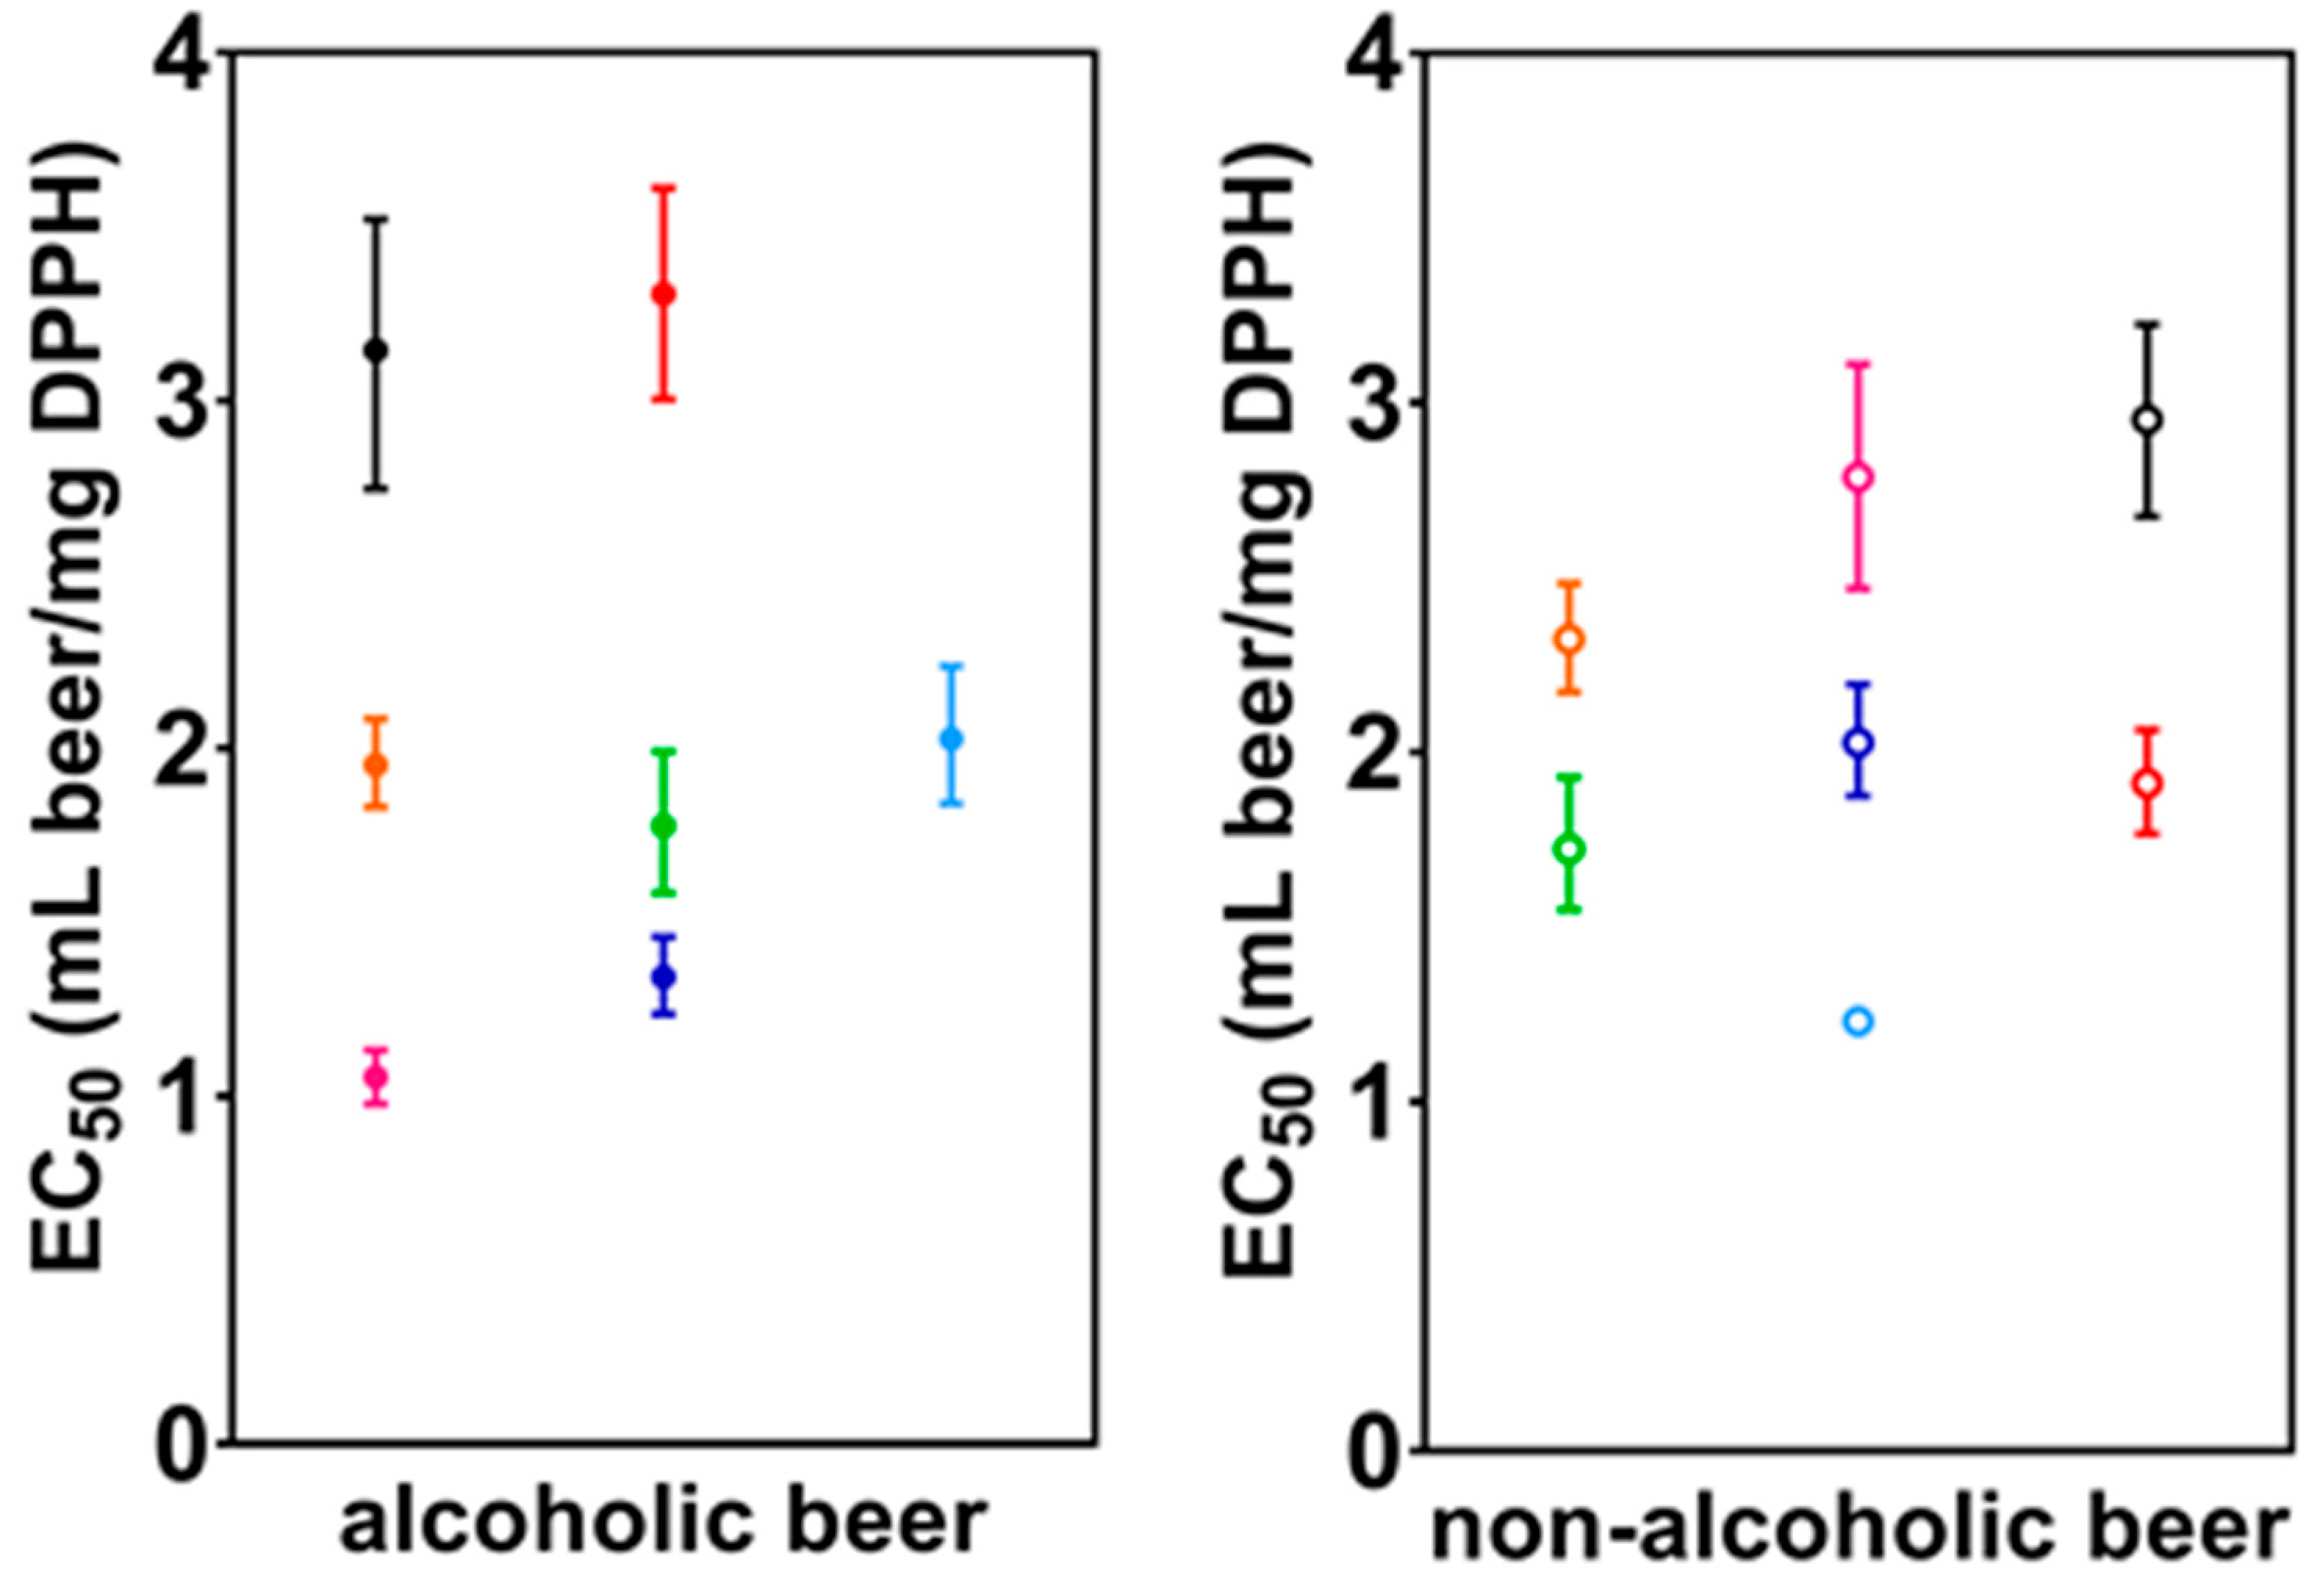
3.1. Radical Scavenging Activity (RSA)

The results of the measurements of the RSA towards the DPPH radical are reported in Table 1 as numerical EC50 values. A comparison of the values obtained for the alcoholic and for the non-alcoholic counterparts is also graphically reported in Figure 1.
As mentioned in the experimental section, in this work we found that the best fit to calculate the EC50 values was obtained by using a second-order polynomial model. The EC50 values, and the corresponding CI 95% and R2, obtained with other fitting models are reported in Tables S1–S3 for comparison.
After examining Figure 1, comparing the alcoholic samples with the non-alcoholic ones, all the possible trends are observed: in some cases, the EC50 values of the alcoholic samples are greater than the corresponding non-alcoholic ones (M, H); in some, others are smaller (N, P, B); finally, in two cases the values are more or less similar (W, C). The EC50 values reported here for alcoholic beers are greater, in two cases, namely for C and M, in comparison with those already published previously by us [37], indicating a lower antioxidant activity. Moreover, since the EC50 values measured for non-alcoholic samples are not systematically greater or smaller in comparison with alcoholic ones, it can be hypothesized that alcohol removal is accompanied in NABs by the depletion or addition of antioxidants according to differences in production processes and recipes.

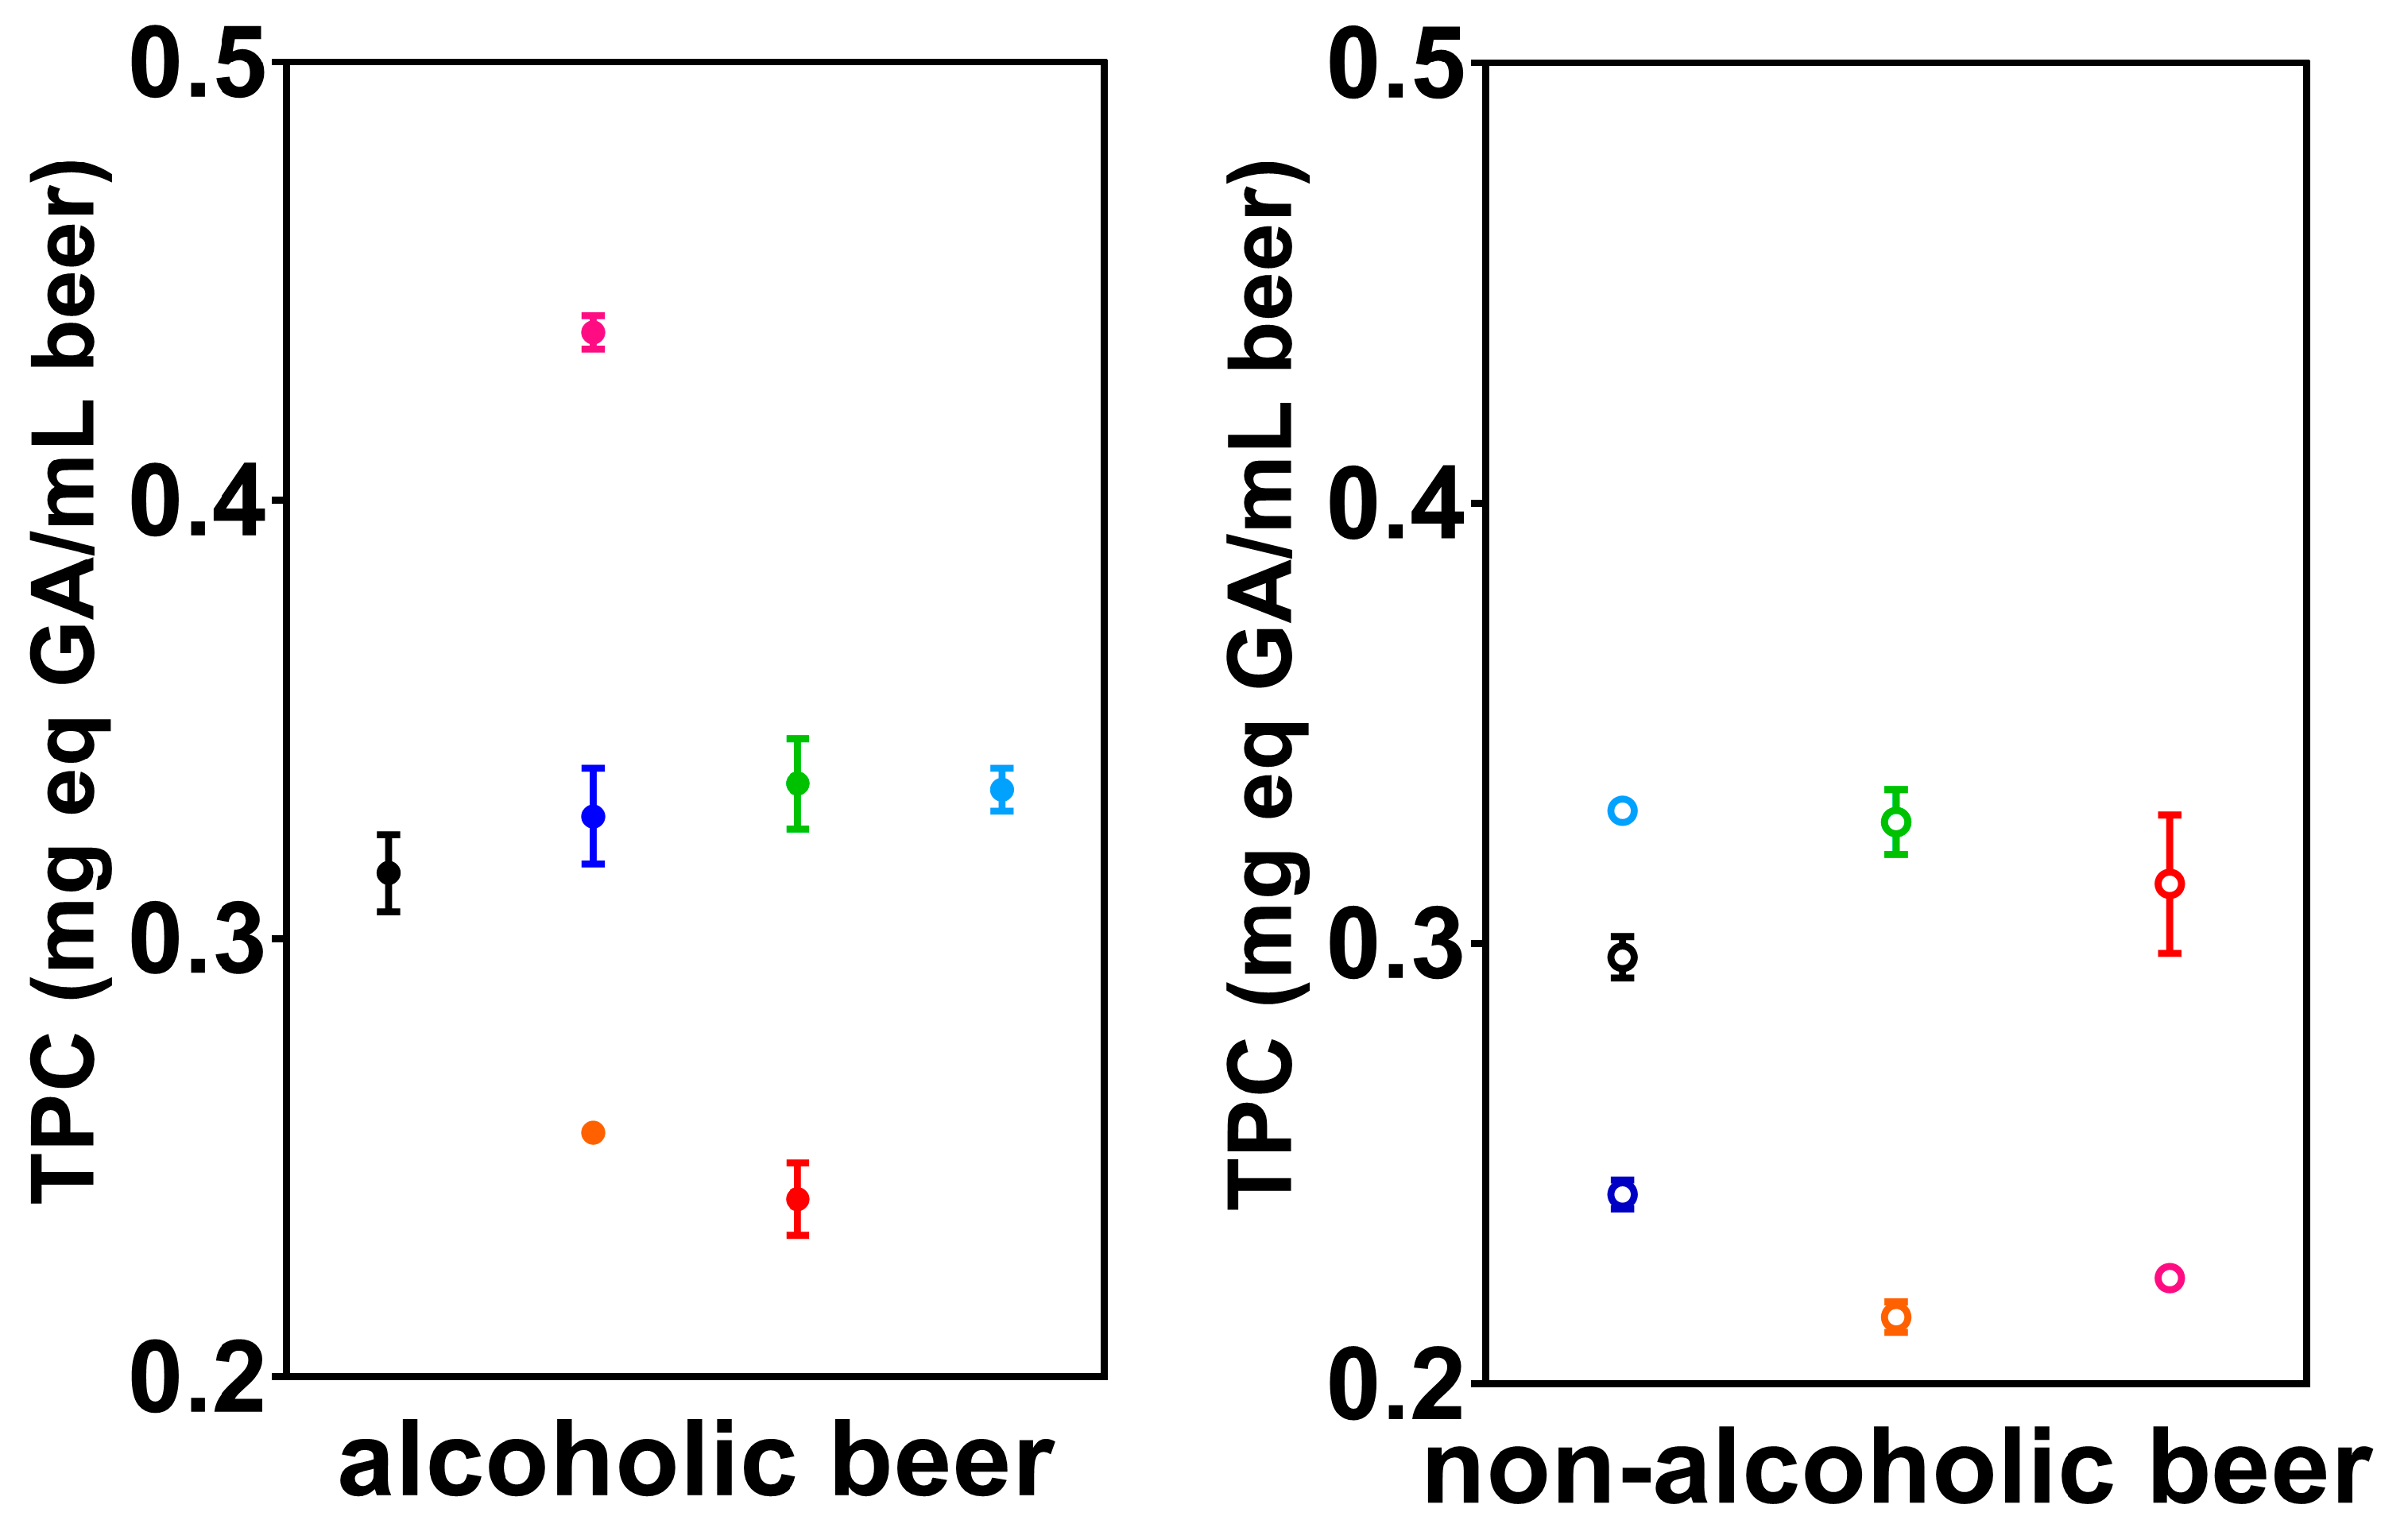
3.2. Total Phenolic Compounds (TPC)

The TPC values measured for lagers and NABs examined in this work are reported in Figure 2 and in Table 1. From Figure 2, it is possible to conclude that there is no relationship between the TPC of alcoholic and non-alcoholic samples: significant differences (t-test, p ≤ 0.05) between the two counterparts can be observed only in N, B, P, and M. Again, we can hypothesize that the dealcoholizing process is not always related to a decrease in TPC, as observed for N, B, and especially for P. In one case (M), the TPC in non-alcoholic samples is greater, the only known difference between this beer and all the others being the presence of maize among its ingredients.
In all the examined beers except B0 and W0, the label indicates the addition of natural flavoring substances, so the increase observed in M0 compared to M can be explained in this way. The decreases observed for TPC and RSA in non-alcoholic beers in comparison with alcoholic ones could be related to the manipulations involved in their production.
A comparison with the TPC values previously published by us [37] with alcoholic beers, shows that the values are comparable. For the previously examined beers, the TPC values ranged from 0.297 to 0.425 mg eq GA/mL beer [37].
There is an acceptable correlation between the phenol content and the radical scavenging activity of the beers, as shown in Figure S1 by comparing the EC50 values obtained with the DPPH assay with the TPC. This can be explained by the fact that phenolic compounds act as antioxidants, and such a correlation has been previously observed by other authors [40,41,42,43].

3.3. ThioBarbituric Index (TBI)

The TBI values obtained for alcoholic and non-alcoholic beers are graphically reported in Figure 3 and in Table 1. As previously observed for TPC and RSA, comparing alcoholic and non-alcoholic beers by the same producer, the TBI values increase, decrease or remain more or less the same. The conclusion is that TBI values cannot be used to discriminate alcoholic beers from non-alcoholic ones, in agreement with previously published results [30,44]. A comparison with previously published values by us [37] for alcoholic beers shows that these are comparable.

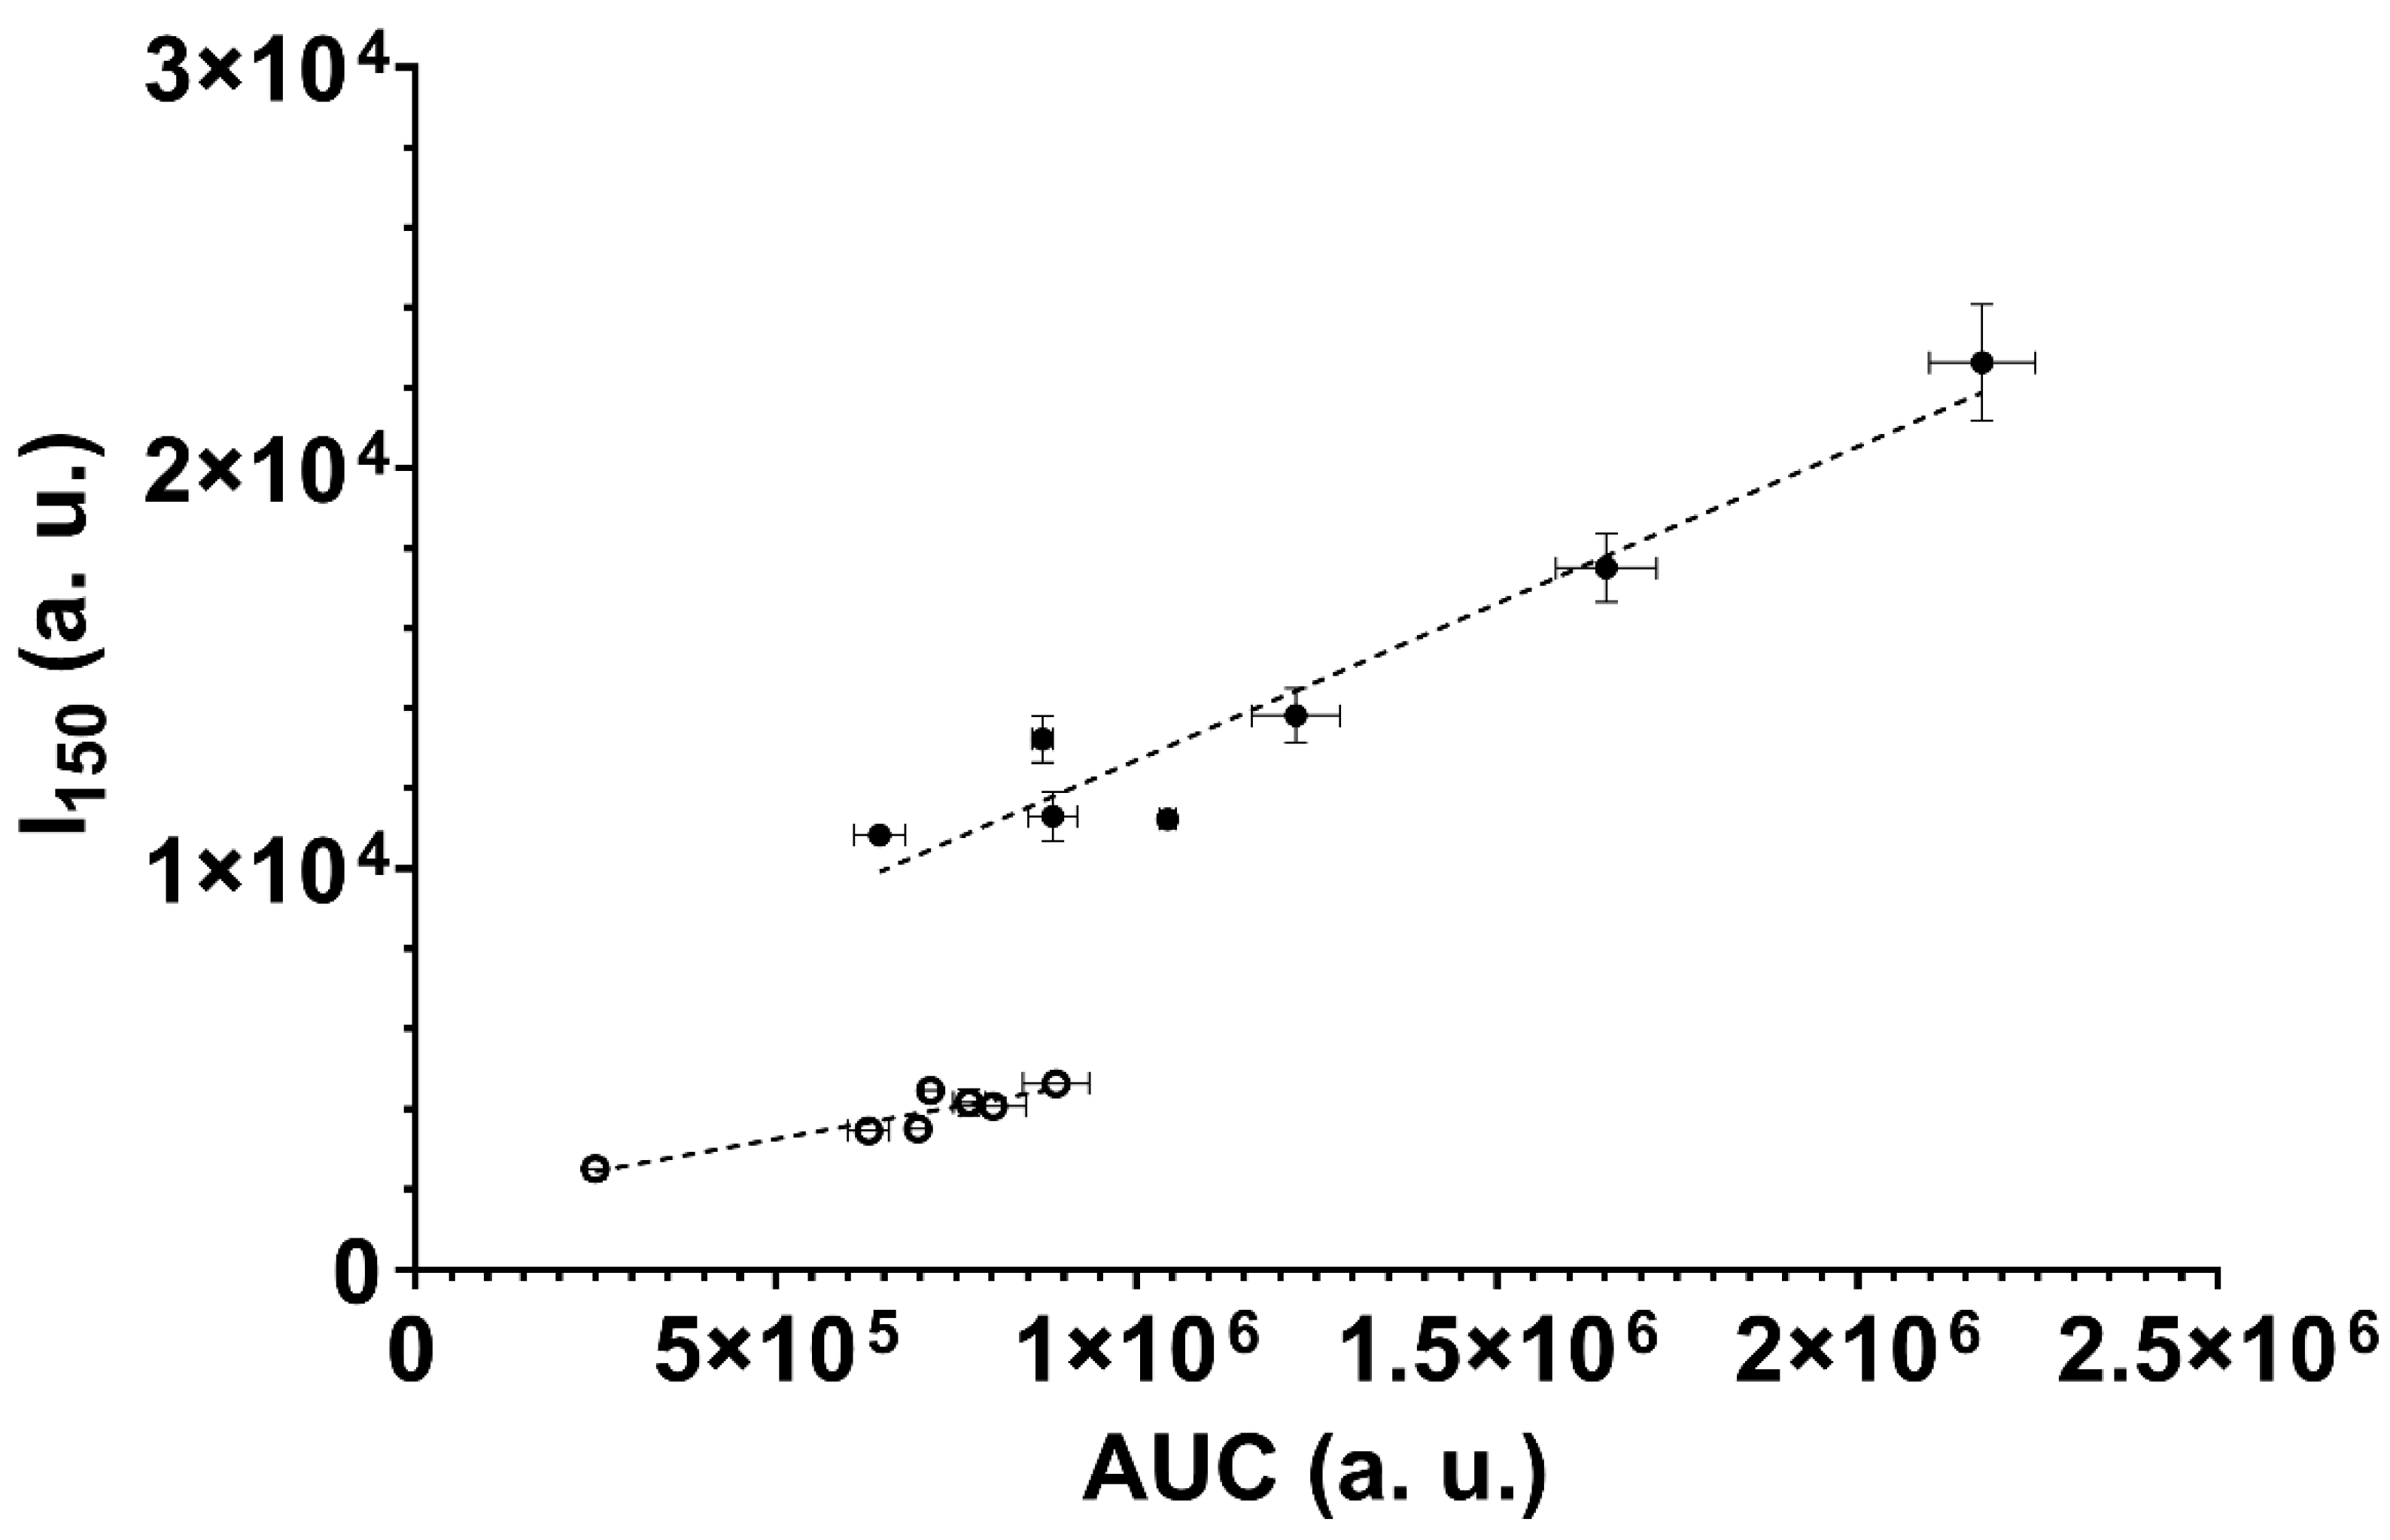
3.4. ESR Spin Trapping Experiments

The kinetic curves representing the evolution of the PBN adduct intensity as a function of time for the beers examined in this work are reported in Figure 4 (lagers) and Figure 5 (NABs). The first two features which stand out are the different intensity of the signals of the PBN adducts and the different shape of the curves. In the case of NABs, the curves reach a maximum of intensity and then decreases, while for alcoholic samples a continuous increase is observed. There is only one exception in the case of NABs given by B0 for which an intensity maximum was not observed. However, this is the non-alcoholic beer sample with the highest ABV, that is 0.3%, while in the other samples it is indicated as being 0.0%. These experiments demonstrate that ESR spin trapping experiments can be applied to non-alcoholic beer samples, but in this case the intensity of the PBN adducts are much lower in comparison with those observed for alcoholic beers. To the best of our knowledge, this is the first time that ESR spectroscopy and spin trapping experiments have been used to characterize the thermal stability of NABs.
The signals detected with ESR spectroscopy are the same as those previously observed [38]; in particular, the PBN adduct of the 1-hydroxyethyl radical and the tert-butyl aminoxyl radical, which derives from the hydrolysis of PBN in acidic environments. The hydrolysis of N-tert-butyl-phenylnitrone gives tert-butyl hydroxylamine, which is oxidized to the tert-butyl aminoxyl radical. The two radicals are reported in Figures S2 and S3 together with the simulated spectra. In the case of alcoholic beers, the largely predominant radical is the PBN adduct of the 1-hydroxyethyl radical, while for non-alcoholic beers the tert-butyl aminoxyl radical becomes more important at the end of the experiment (see Figures S2 and S3 recorded after 150 min of thermal treatment at 60 °C). When alcohol is added to the NABs samples to reach the same % of the corresponding alcoholic beer and these samples are subjected to thermal treatment at 60 °C, the intensity of the signals significantly increases. A comparison of the intensity of the PBN–1-hydroxyethyl radical adduct as a function of time is shown in Figure S4 for the alcoholic H beer, for the non-alcoholic H0, and for the H0 beer added with EtOH to reach the same concentration of H.
A possible explanation for the lower intensity shown by NABs is that once the precursors of the radicals decompose due to the thermal treatment, these can transfer the unpaired electron to ethanol, forming the 1-hydroxyethyl radical, which is trapped by PBN forming a paramagnetic adduct, or are quenched by the antioxidants present in beers. When the alcohol content is low, as for NABs, which are not completely deprived of alcohol, the favored reaction is with antioxidants, while when the alcohol content is high, the favored reaction is with ethanol and higher-intensity signals of the 1-hydroxyethyl adduct are observed. This explanation is confirmed by the type of radicals observed. In fact, the intensity of the tert-butyl aminoxyl radical is comparable between the three samples reported in Figure S5 (2.54 × 10³ a. u. for H, 2.75 × 10³ a. u. for H0, and 2.94 × 10³ a. u. for H0 added with EtOH), while what dramatically changes after 150 min is the intensity of the PBN adduct of the 1-hydroxyethyl radical, as can be clearly seen in Figures S4 and S5. This confirms that the observed intensity of the PBN adduct strongly depends on the alcohol content of the beers, while the intensity of the tert-butyl aminoxyl radical remains comparable between the samples.
In the case of alcoholic beers, a lag time can be measured only in the case of B and C samples (see Figure 4) and the calculated values are 71.3 ± 8.4 and 43.8 ± 3.7 min, respectively.
If a comparison is made between the AUC and I150 of the alcoholic and non-alcoholic beer samples, the graph shown in Figure 6 is obtained. It is evident from this graph that AUC and I150 are almost interchangeable parameters when describing the ESR spin trapping behavior of the beer samples subjected to thermal treatment at 60 °C in the presence of PBN in the first 150 min, which is analogous with what was previously observed for other beer samples [37]. However, it is also evident from Figure 6 that the points derived from NABs samples and those coming from alcoholic ones are not aligned with each other but can be fitted with two different lines. This also reflects the differences in the evolution of the adduct formation, with the shape of the kinetic curves of NABs always showing a maximum usually in the first 30 min, except for B0. (Figure 5). As can be realized after examining the different intensity scales of Figure 4 and Figure 5, the AUC and I150 values of alcoholic and non-alcoholic beers are not comparable, with the former being much greater. Therefore, the relative values of AUC and I150 allow us to distinguish between alcoholic and non-alcoholic beer samples.
Previously [37], we proposed a relationship between the parameters obtainable with spin trapping experiments coupled with ESR spectroscopy (AUC and I150) and those attainable with UV-Vis spectrophotometric measurements (TPC, RSA and TBI). We decided to verify if such a relationship exists when considering also the alcoholic beers examined in this work. The result, shown in Figure 7, demonstrates that the following relationship allows us to correlate oxidative stability (AUC and I150) parameters obtained with ESR spectroscopy with others related to antioxidant activity and the staling degree of beers (RSA, TPC and TBI) obtained with UV-Vis spectrophotometry:
AUC = β0 + β1 × I150 + β2 × TBI + β3 × RSA + β4 × TPC
where β0 = −1,360,033; β1 = 98.15; β2 = 145,075; β3 = 126,688; β4 = 2,608,405.
When the non-alcoholic beers are also considered, it is possible to verify that a similar relationship exists, with the parameters having the following values: β0 = 233,219; β1 = 313.3; β2 = 491,757; β3 = −196,786; β4 = −1,914,738.

3.5. Multivariate Data Analysis

A strong correlation between the considered parameters is observed only in a few cases, such as between AUC and I150 in both groups or, to a lesser extent, between I150 and TBI in NABs, whereas a moderate correlation is mostly registered between the ESR and the spectrophotometric parameter in both lagers and NABs (Table S4). Thus, to better visualize the relationships between samples and variables, a multivariate approach was applied.
Principal Component Analysis (PCA) was conducted using the results obtained through ESR spectrometry and spectrophotometric tests, plus pH and the Refractometric Dry Substance (RDS) expressed as °Bx, and including DTE and ABV as reported on the labels. The pH values, described as being different between alcoholic beers and NABs by some authors [30], are not significantly different in our samples, being 4.43 ± 0.13 for lagers and 4.44 ± 0.24 for NABs, and the RDS values also overlay (4.7 ± 0.9 °Bx for lagers and 4.3 ± 0.9 °Bx for NABs).
PCA highlights a clear separation between the two groups (Figure 8A), which is not as evident when the two ESR parameters (AUC and I150) are excluded, even if ethanol is still accounted for (Figure 8B). This split is still visible, though to a lesser extent, when the ethanol concentration is excluded (Figure S6), but both AUC and I150 must be included in the analysis, once again confirming that, though strictly interrelated and able to separate the two groups (Figure 6), they are not perfectly interchangeable. Thus, even if AUC and I150 are strictly related to ethanol content (see also Figure 4 and Figure 5), they bring with them further information related to the evolution of the signal intensity during the ESR experiment, whose implications need to be further explored in additional studies.

4. Conclusions

Here for the first time, we report the curves representing the evolution of the PBN radical adduct signal intensity, measured with ESR spectroscopy, as a function of time for NABs, demonstrating the possible use of this technique in the study of NABs oxidative stability.
The results show that the AUC and I150 values of these beers are significantly lower in comparison with alcoholic beers, probably because their low alcohol content disfavors the formation of the PBN adduct of the 1-hydroxyethyl radical. On the other hand, other parameters related to antioxidant activity (TPC and RSA) and to the staling degree of beers (TBI) are comparable for alcoholic beers and NABs. Multivariate data analysis shows that a clear separation between lager and NABs can be observed with a simple PCA only when both EPR parameters (AUC and I150) are considered, suggesting that the differences at the basis of the 1-hydroxyethyl radical formation, and its evolution during the experiment, are more complex than the mere ethanol concentration. The correlation between the ESR parameters and those obtained with “classical” spectrophotometric methods, commonly used to describe antioxidant behaviors, is comparable in NABs to that observed in their alcoholic counterparts, further demonstrating the usefulness of ESR spectroscopy for studying the oxidative stability of beers.

Supplementary Materials

The following supporting information can be downloaded at: https://www.mdpi.com/article/10.3390/oxygen5030014/s1, Figure S1: Comparison between the TPC and the EC50 values obtained with the DPPH assay; Figure S2. Experimental (a) and simulated (b) spectra of the PBN–1-hydroxyethyl radical adduct; Figure S3. Experimental (a) and simulated (b) spectra of the tert-butyl aminoxyl radical; Figure S4. Kinetic curves of the intensity of the PBN–1-hydroxyethyl radical adduct as a function of time; Figure S5. Experimental ESR spectra recorder after 150 min for: (a) the H0 plus EtOH; (b) H; and (c) H0; Figure S6. Principal component analysis applied to all the beers studied in this work without considering EtOH concentration; Tables S1–S3. EC50 values of beers obtained with different fitting methods; Table S4. Pearson correlation coefficients between ESR and UV-Vis parameters.

Author Contributions

Conceptualization, methodology, investigation, data curation, writing—original draft preparation, writing—review and editing, M.C.P. and D.S. All authors have read and agreed to the published version of the manuscript.

Funding

D.S. thanks CNR project FOE-2021 NutrAge—code DBA.AD005.225 for financial support.

Institutional Review Board Statement

Not applicable.

Informed Consent Statement

Not applicable.

Data Availability Statement

Data are contained within the article and the Supplementary Materials.

Conflicts of Interest

The authors declare no conflicts of interest.

Abbreviations

The following abbreviations are used in this manuscript:
ABVAlcohol content by Volume
AUCArea Under the Curve
DPPH2,2-Diphenyl-1-picrylhydrazyl
DTEDays to Expiration
EC50Half maximal Effective Concentration
ESRElectron Spin Resonance
I150Intensity at 150 min
NABNon-alcoholic Beer
NABLABNon-alcoholic and Low-alcohol Beer
PCAPrincipal Component Analysis
PBNN-tert-Butyl-α-phenylnitrone
RDSRefractometric Dry Substance
TBIThioBarbituric Index
TPCTotal Phenolic Compounds

References

  1. Waehning, N.; Wells, V.K. Product, individual and environmental factors impacting the consumption of no and low alcoholic drinks: A systematic review and future research agenda. Food Qual. Prefer. 2024, 117, 105163. [Google Scholar] [CrossRef]
  2. Anderson, K. The emergence of lower-alcohol beverages: The case of beer. J. Wine Econ. 2023, 18, 66–86. [Google Scholar] [CrossRef]
  3. Katainen, A.; Uusitalo, L.; Saarijärvi, H.; Erkkola, M.; Rahkonen, O.; Lintonen, T.; Fogelholm, M.; Nevalainen, J. Who buys non-alcoholic beer in Finland? Sociodemographic characteristics and associations with regular beer purchases. Int. J. Drug Policy 2023, 113, 103962. [Google Scholar] [CrossRef] [PubMed]
  4. Gliszczyńska-Świgło, A.; Klimczak, I.; Klensporf-Pawlik, D.; Rybicka, I. Quality characteristics and consumer perception of non-alcoholic beers in the context of responsible alcohol consumption. Sci. Rep. 2025, 15, 7145. [Google Scholar] [CrossRef] [PubMed]
  5. Global Alcohol Action Plan 2022–2030; World Health Organization: Geneva, Switzerland, 2024.
  6. Kokole, D.; Jané Llopis, E.; Anderson, P. Non-alcoholic beer in the European Union and UK: Availability and apparent consumption. Drug Alcohol Rev. 2022, 41, 550–560. [Google Scholar] [CrossRef] [PubMed]
  7. Blackmore, H.; Hidrio, C.; Yeomans, M.R. How sensory and hedonic expectations shape perceived properties of regular and non-alcoholic beer. Food Qual. Prefer. 2022, 99, 104562. [Google Scholar] [CrossRef]
  8. Gernat, D.C.; Brouwer, E.; Ottens, M. Aldehydes as Wort Off-Flavours in Alcohol-Free Beers—Origin and Control. Food Bioprocess Technol. 2020, 13, 195–216. [Google Scholar] [CrossRef]
  9. Ramsey, I.; Yang, Q.; Fisk, I.; Ford, R. Understanding the sensory and physicochemical differences between commercially produced non-alcoholic lagers, and their influence on consumer liking. Food Chem. X 2021, 9, 100114. [Google Scholar] [CrossRef] [PubMed]
  10. Rettberg, N.; Lafontaine, S.; Schubert, C.; Dennenlöhr, J.; Knoke, L.; Diniz Fischer, P.; Fuchs, J.; Thörner, S. Effect of Production Technique on Pilsner-Style Non-Alcoholic Beer (NAB) Chemistry and Flavor. Beverages 2022, 8, 4. [Google Scholar] [CrossRef]
  11. Staub, C.; Contiero, R.; Bosshart, N.; Siegrist, M. You are what you drink: Stereotypes about consumers of alcoholic and non-alcoholic beer. Food Qual. Prefer. 2022, 101, 104633. [Google Scholar] [CrossRef]
  12. Quain, D.E. The enhanced susceptibility of alcohol-free and low alcohol beers to microbiological spoilage: Implications for draught dispense. J. Inst. Brew. 2021, 127, 406–416. [Google Scholar] [CrossRef]
  13. Simon, M.; Collin, S. Why Oxidation Should Be Still More Feared in NABLABs: Fate of Polyphenols and Bitter Compounds. Beverages 2022, 8, 61. [Google Scholar] [CrossRef]
  14. Piornos, J.A.; Koussissi, E.; Balagiannis, D.P.; Brouwer, E.; Parker, J.K. Alcohol-free and low-alcohol beers: Aroma chemistry and sensory characteristics. Compr. Rev. Food Sci. Food Saf. 2023, 22, 233–259. [Google Scholar] [CrossRef] [PubMed]
  15. Salanță, L.C.; Coldea, T.E.; Ignat, M.V.; Pop, C.R.; Tofană, M.; Mudura, E.; Borșa, A.; Pasqualone, A.; Zhao, H. Non-Alcoholic and Craft Beer Production and Challenges. Processes 2020, 8, 1382. [Google Scholar] [CrossRef]
  16. Kozłowski, R.; Dziedziński, M.; Stachowiak, B.; Kobus-Cisowska, J. Non- and low-alcoholic beer—Popularity and manufacturing techniques. Acta Sci. Pol. Technol. Aliment. 2021, 20, 347–357. [Google Scholar] [CrossRef] [PubMed]
  17. Montanari, L.; Marconi, O.; Mayer, H.; Fantozzi, P. 6—Production of Alcohol-Free Beer. In Beer in Health and Disease Prevention; Preedy, V.R., Ed.; Academic Press: San Diego, CA, USA, 2009; pp. 61–75. [Google Scholar]
  18. Muller, C.; Neves, L.E.; Gomes, L.; Guimarães, M.; Ghesti, G. Processes for alcohol-free beer production: A review. Food Sci. Technol. 2020, 40, 273–281. [Google Scholar] [CrossRef]
  19. Pilarski, D.W.; Gerogiorgis, D.I. Progress and modelling of cold contact fermentation for alcohol-free beer production: A review. J. Food Eng. 2020, 273, 109804. [Google Scholar] [CrossRef]
  20. Perpète, P.; Collin, S. Influence of beer ethanol content on the wort flavour perception. Food Chem. 2000, 71, 379–385. [Google Scholar] [CrossRef]
  21. Johansson, L.; Nikulin, J.; Juvonen, R.; Krogerus, K.; Magalhães, F.; Mikkelson, A.; Nuppunen-Puputti, M.; Sohlberg, E.; de Francesco, G.; Perretti, G.; et al. Sourdough cultures as reservoirs of maltose-negative yeasts for low-alcohol beer brewing. Food Microbiol. 2021, 94, 103629. [Google Scholar] [CrossRef] [PubMed]
  22. Myncke, E.; Vanderputten, D.; Laureys, D.; Huys, J.; Schlich, J.; Van Opstaele, F.; Schouteten, J.J.; De Clippeleer, J. Navigating yeast selection for NABLAB production: Comparative study of commercial maltose- and maltotriose-negative strains. Food Chem. 2025, 477, 143486. [Google Scholar] [CrossRef] [PubMed]
  23. Maust, A.; Sen, R.; Lafontaine, S. Exploring Non-traditional Yeast for Flavor Innovation in Non-Alcoholic Beer. ACS Food Sci. Technol. 2025, 5, 2007–2020. [Google Scholar] [CrossRef]
  24. Canonico, L.; Agarbati, A.; Comitini, F.; Ciani, M. Unravelling the potential of non-conventional yeasts and recycled brewers spent grains (BSG) for non-alcoholic and low alcohol beer (NABLAB). LWT 2023, 190, 115528. [Google Scholar] [CrossRef]
  25. Gernat, D.C.; Brouwer, E.R.; Faber-Zirkzee, R.C.; Ottens, M. Flavour-improved alcohol-free beer—Quality traits, ageing and sensory perception. Food Bioprod. Process. 2020, 123, 450–458. [Google Scholar] [CrossRef]
  26. Müller, M.; Bellut, K.; Tippmann, J.; Becker, T. Physical Methods for Dealcoholization of Beverage Matrices and their Impact on Quality Attributes. ChemBioEng Rev. 2017, 4, 310–326. [Google Scholar] [CrossRef]
  27. De Francesco, G.; Marconi, O.; Sileoni, V.; Freeman, G.; Lee, E.G.; Floridi, S.; Perretti, G. Influence of the dealcoholisation by osmotic distillation on the sensory properties of different beer types. J. Food Sci. Technol. 2021, 58, 1488–1498. [Google Scholar] [CrossRef] [PubMed]
  28. Ambrosi, A.; Motke, M.B.; Souza-Silva, É.A.; Zini, C.A.; McCutcheon, J.R.; Cardozo, N.S.M.; Tessaro, I.C. Beer dealcoholization by forward osmosis diafiltration. Innov. Food Sci. Emerg. Technol. 2020, 63, 102371. [Google Scholar] [CrossRef]
  29. Melton, L. Synbio salvages alcohol-free beer. Nat. Biotechnol. 2022, 40, 8. [Google Scholar] [CrossRef] [PubMed]
  30. Bauwens, J.; Van Opstaele, F.; Karatairis, C.; Weiland, F.; Eggermont, L.; Jaskula-Goiris, B.; De Rouck, G.; De Brabanter, J.; Aerts, G.; De Cooman, L. Assessing the ageing process of commercial non-alcoholic beers in comparison to their lager beer counterparts. J. Inst. Brew. 2022, 128, 109–123. [Google Scholar] [CrossRef]
  31. Mizuno, A.; Nomura, Y.; Iwata, H. Sensitive Measurement of Thermal Stress in Beer and Beer-Like Beverages Utilizing the 2-Thiobarbituric Acid (TBA) Reaction. J. Am. Soc. Brew. Chem. 2011, 69, 220–226. [Google Scholar] [CrossRef]
  32. Uchida, M.; Suga, S.; Ono, M. Improvement for Oxidative Flavor Stability of Beer—Rapid Prediction Method for Beer Flavor Stability by Electron Spin Resonance Spectroscopy. J. Am. Soc. Brew. Chem. 1996, 54, 205–211. [Google Scholar] [CrossRef]
  33. Huvaere, K.; Andersen, M.L. 101—Beer and ESR Spin Trapping. In Beer in Health and Disease Prevention; Preedy, V.R., Ed.; Academic Press: San Diego, CA, USA, 2009; pp. 1043–1053. [Google Scholar]
  34. Ferreira, I.M.; Carvalho, D.O.; Guido, L.F. Impact of storage conditions on the oxidative stability of beer. Eur. Food Res. Technol. 2023, 249, 149–156. [Google Scholar] [CrossRef]
  35. Chair, D.B.; Baker, B.; Bosben, S.; Bradshaw, T.; Converse, E.; Daar, A.; Garner, R.; Giarratano, C.; Gonzalez, S.; Hight, H.; et al. Standard Method for Measurement of Oxidative Resistance of Beer by Electron Paramagnetic Resonance. J. Am. Soc. Brew. Chem. 2008, 66, 259–260. [Google Scholar] [CrossRef]
  36. Marques, L.; Hernandez, E.M.; William, A.; Foster Ii, R.T. Advancing Flavor Stability Improvements in Different Beer Types Using Novel Electron Paramagnetic Resonance Area and Forced Beer Aging Methods. J. Am. Soc. Brew. Chem. 2017, 75, 35–40. [Google Scholar] [CrossRef]
  37. Porcu, M.C.; Fadda, A.; Sanna, D. Relationship among EPR oxidative stability and spectrophotometric parameters connected to antioxidant activity in beer samples. Eur. Food Res. Technol. 2024, 250, 2123–2132. [Google Scholar] [CrossRef]
  38. Porcu, M.C.; Fadda, A.; Sanna, D. Lag Time Determinations in Beer Samples. Influence of Alcohol and PBN Concentration in EPR Spin Trapping Experiments. Oxygen 2022, 2, 605–615. [Google Scholar] [CrossRef]
  39. R Core Team. R: A Language and Environment for Statistical Computing; R Foundation for Statistical Computing: Vienna, Austria, 2021. [Google Scholar]
  40. Krofta, K.; Mikyška, A.; Hašková, D. Antioxidant Characteristics of Hops and Hop Products. J. Inst. Brew. 2008, 114, 160–166. [Google Scholar] [CrossRef]
  41. Świeca, M.; Gawlik-Dziki, U.; Kowalczyk, D.; Złotek, U. Impact of germination time and type of illumination on the antioxidant compounds and antioxidant capacity of Lens culinaris sprouts. Sci. Hortic. 2012, 140, 87–95. [Google Scholar] [CrossRef]
  42. Xu, B.J.; Chang, S.K.C. A Comparative Study on Phenolic Profiles and Antioxidant Activities of Legumes as Affected by Extraction Solvents. J. Food Sci. 2007, 72, S159–S166. [Google Scholar] [CrossRef] [PubMed]
  43. Sanna, V.; Pretti, L. Effect of wine barrel ageing or sapa addition on total polyphenol content and antioxidant activities of some Italian craft beers. Int. J. Food Sci. Technol. 2015, 50, 700–707. [Google Scholar] [CrossRef]
  44. Bauwens, J.; Van Opstaele, F.; Eggermont, L.; Weiland, F.; Jaskula-Goiris, B.; De Rouck, G.; De Brabanter, J.; Aerts, G.; De Cooman, L. Comprehensive analytical and sensory profiling of non-alcoholic beers and their pale lager beer counterparts. J. Inst. Brew. 2021, 127, 385–405. [Google Scholar] [CrossRef]
Figure 1. Comparison of the EC50 values of the DPPH assay obtained for the beer samples examined here (for the numerical values see Table 1): W (green); H (pale blue); M (red); N (blue); C (black); B (orange); P (fuchsia). The alcoholic beers are represented by filled circles, while the non-alcoholic counterparts by empty circles.
Oxygen 05 00014 g001
Figure 2. Comparison of the Total Phenolic Content (TPC) obtained for the beer samples examined here (for the numerical values see Table 1): W (green); H (pale blue); M (red); N (blue); C (black); B (orange); P (fuchsia). The alcoholic beers are represented by filled circles, while the non-alcoholic counterparts by empty circles.
Oxygen 05 00014 g002
Figure 3. Comparison of the ThioBarbituric Index (TBI) values obtained for the beer samples examined here (for the numerical values see Table 1): W (green); H (pale blue); M (red); N (blue); C (black); B (orange); P (fuchsia). The alcoholic beers are represented by filled circles, while the non-alcoholic counterparts by empty circles.
Oxygen 05 00014 g003
Figure 4. Kinetic curves of the intensity of the PBN adduct as a function of time for the alcoholic beer samples subjected to thermal treatment at 60 °C.
Oxygen 05 00014 g004
Figure 5. Kinetic curves of the intensity of the PBN adduct as a function of time for the NAB samples subjected to thermal treatment at 60 °C. Please note the different scale of the intensity in comparison with Figure 4.
Oxygen 05 00014 g005
Figure 6. Plot of the intensity of the PBN adduct measured after 150 min (I150) vs. area under the curve (AUC) after the same time interval for the beer samples examined in this work. R2 = 0.93 for the alcoholic beers (filled circles) and R2 = 0.84 for the non-alcoholic samples (empty circles).
Oxygen 05 00014 g006
Figure 7. Comparison between a combination of experimental ESR parameters (AUC and I150) and their calculated values with a combination of spectrophotometric parameters (RSA, TPC and TBI) for alcoholic beers (filled circles) examined in this work and in ref. [37]; the fitting has R2 = 0.9900. The fitting for non-alcoholic beers (empty circles) has R2 = 0.9258.
Oxygen 05 00014 g007
Figure 8. Principal component analysis applied to all the beers studied in this work. Lagers are indicated by green circles, NABs by blue circles. In (A) all the variables are considered while in (B), ESR parameters (AUC and I150) were excluded.
Oxygen 05 00014 g008
Table 1. Parameters obtained for the beers studied in this work with spectroscopic (ESR) and spectrophotometric (UV–Vis) methods.
BeerAUC (a. u.)I150 (a. u.)EC50 (mL Beer/
mg DPPH)
TPC (mg eq GA/
mL Beer)
TBI
N2.17 × 106 ± 7.30 × 1042.26 × 104 ± 1.45 × 1031.343 (1.236–1.458)0.328 ± 0.0110.366 ± 0.001
W8.84 × 105 ± 3.44 × 1041.13 × 104 ± 6.19 × 1021.777 (1.584–1.991)0.335 ± 0.0100.298 ± 0.007
B6.44 × 105 ± 3.54 × 1041.08 × 104 ± 2.63 × 1021.953 (1.831–2.085)0.256 ± 0.0010.253 ± 0.001
P1.65 × 106 ± 6.98 × 1041.75 × 104 ± 8.57 × 1021.055 (0.978–1.133)0.438 ± 0.0040.321 ± 0.020
M1.04 × 106 ± 1.17 × 1041.12 × 104 ± 9.03 × 1013.306 (3.004–3.611)0.240 ± 0.0080.212 ± 0.004
C8.70 × 105 ± 1.48 × 1041.32 × 104 ± 5.87 × 1023.145 (2.746–3.522)0.315 ± 0.0090.425 ± 0.008
H1.22 × 106 ± 6.10 × 1041.38 × 104 ± 6.81 × 1022.028 (1.841–2.237)0.334 ± 0.0050.380 ± 0.006
N08.01 × 105 ± 4.48 × 1044.07 × 103 ± 1.31 × 1022.028 (1.875–2.194)0.243 ± 0.0030.318 ± 0.010
W08.89 × 105 ± 4.59 × 1044.64 × 103 ± 2.42 × 1021.724 (1.550–1.929)0.328 ± 0.0070.328 ± 0.007
B02.50 × 105 ± 1.42 × 1042.52 × 103 ± 9.21 × 1012.323 (2.172–2.483)0.215 ± 0.0030.268 ± 0.012
P06.97 × 105 ± 1.07 × 1043.51 × 103 ± 1.91 × 1022.787 (2.468–3.110)0.224 ± 0.0010.324 ± 0.012
M07.68 × 105 ± 2.19 × 1044.16 × 103 ± 3.22 × 1021.911 (1.767–2.064)0.313 ± 0.0160.323 ± 0.002
C07.15 × 105 ± 9.75 × 1034.47 × 103 ± 1.70 × 1022.952 (2.675–3.224)0.297 ± 0.0050.412 ± 0.010
H06.29 × 105 ± 2.87 × 1043.47 × 103 ± 6.04 × 1011.230 (1.206–1.254)0.330 ± 0.0020.315 ± 0.019
In brackets, after the EC50 values, the CI 95% is indicated.
Disclaimer/Publisher’s Note: The statements, opinions and data contained in all publications are solely those of the individual author(s) and contributor(s) and not of MDPI and/or the editor(s). MDPI and/or the editor(s) disclaim responsibility for any injury to people or property resulting from any ideas, methods, instructions or products referred to in the content.

