Article

Phosphorus-and-Silver-Doped Crystalline Oxide Coatings for Titanium Implant Surfaces

by
Catherine L. Bruni
1,
Haden A. Johnson
1,
Aya Ali
1,
Amisha Parekh
1,
Mary E. Marquart
2,
Amol V. Janorkar
1 and
Michael D. Roach
1,*
1
Department of Biomedical Materials Science, University of Mississippi Medical Center, Jackson, MS 39216, USA
2
Department of Cell and Molecular Biology, School of Medicine, University of Mississippi Medical Center, Jackson, MS 39216, USA
*
Author to whom correspondence should be addressed.
Oxygen 2024, 4(4), 402-420; https://doi.org/10.3390/oxygen4040025
Submission received: 30 July 2024 / Revised: 26 October 2024 / Accepted: 4 November 2024 / Published: 7 November 2024

Abstract

:
Bacteria-related infections remain a leading cause of dental implant failures. Despite the successful history of titanium implants, naturally forming oxides lack antibacterial properties. Crystalline oxides, modified through anodization processes, have shown photocatalytic-induced antibacterial properties when exposed to sufficient energy sources such as UVA light. Chemically doping these oxides with some metallic and non-metallic elements has been shown to enhance their photocatalytic activity (PCA). The present study’s objectives were to assess the relative UVA and violet-light-irradiated PCA levels, bacterial attachment levels, and pre-osteoblast early cell viability levels of phosphorus-doped and phosphorus-and-silver-doped anatase-phase oxides. Each oxide revealed similar surface topographies and surface porosity levels. However, the phosphorus-and-silver-doped oxides exhibited significantly higher PCA levels compared to the phosphorus-doped oxide counterpart after irradiation with 365 nm UVA (p < 0.0001) or 410 nm violet (p = 0.007 and 0.03) light. The phosphorus-doped oxides and phosphorus-and-silver-doped oxides revealed similar Staphylococcus aureus attachment levels after 60 min of UVA irradiation. The phosphorus-and-silver-doped oxides exhibited significantly increased 7-day cell viability compared to their phosphorus-doped oxide counterparts. Thus, it was concluded that the silver doping additions to the oxides show much promise for biomaterials applications and warrant further exploration.

1. Introduction

Dental implants have become more popular in recent years. This is in part due to the advances in implant materials and techniques and an increased demand for support for replacing missing teeth [1]. A total of 100,000 to 300,000 dental implants are placed each year, which is almost equivalent to the number of artificial knee and hip implants placed in the same time period [2,3,4]. With more implants being placed, there also comes an increased importance for understanding and working to prevent peri-implant infections, as this is one of the most common factors of implant failure [5].
Titanium is a popular implant material due to its strength, light weight, and great fatigue resistance. It is considered one of the most biocompatible materials because it can withstand the harsh environment of the oral cavity. This is due to its corrosion resistance, bio-inertness, osseointegration capacity, and high fatigue limit. Its excellent corrosion resistance is largely due to the stability of its naturally forming amorphous oxide layer [6,7]. However, the naturally forming oxide layer lacks any inherent antibacterial properties [8]. Anodization processes have been utilized to modify titanium oxide surfaces by increasing the oxide thickness, crystallizing the oxide layer, incorporating nano-sized surface features, and introducing beneficial oxide dopant chemistries [9,10,11,12,13,14,15].
Anodization processes facilitate crystallizing titanium oxide into anatase or rutile phases. When anatase or rutile phases are exposed to irradiation of sufficient energy, the oxide layers act as photocatalysts. Irradiation of anatase- and rutile-phase oxides forms electron–hole pairs which react with water and oxygen to form reactive oxygen species (ROS), such as hydroxyl radicals or superoxide radical anions [16,17]. The ROS generated have been shown to attack bacteria cell membranes and lead to reduced attachment and sometimes cell death. UVA activation of TiO2 was first shown to kill bacterial cells in 1985 [18]. The exact mechanism behind the cell death was not understood fully until it was later shown that ROS production led to lipid peroxidation in Escherichia coli cell membranes and ultimately cell death [16]. A number of other studies have shown that photoactivated titanium oxides demonstrate antibacterial effects against common bacteria like E. coli, Staphylococcus aureus, and some streptococcus species [14,19,20,21,22]. The photoactivation of TiO2 has also been shown to degrade organic compounds and dyes, and methylene blue degradation assays have become a commonly used laboratory benchtop assessment for the evaluation of the relative photocatalytic activity (PCA) of titanium oxide coatings [23,24,25,26].
Anodization processes also enable titanium oxide layers to be doped with beneficial chemical species which are present in the electrolyte. Chemical doping using certain metal and non-metal dopants has been shown to enhance the PCA [27,28,29,30]. Phosphorus-doped anatase oxide layers have been shown to enhance PCA, reduce Streptococcus sanguinis attachment, and improve the mineralization of pre-osteoblast cells compared to un-anodized titanium control specimens when illuminated with 365 nm UVA irradiation [13,14].
Silver is commonly used as an antimicrobial agent in hospital bandages, to destroy microbes on catheters, and to combat antibiotic-resistant pathogens. Silver has the advantages of having a wide antibacterial spectrum against both Gram-positive and Gram-negative bacteria and the ability to control its release [31]. In addition, silver has a low toxicity to humans but has shown toxicity to bacteria, algae, and fungi [32]. The antibacterial behavior of titanium oxide has been shown to improve as the result of the silver addition [21,33,34]. A few recent studies have shown an interest in additions of silver doping into titanium oxide layers through hydrothermal treatments, anodization methods, and the deposition of silver compounds or nanoparticles onto oxides [21,31,32,33,34,35,36,37,38,39]. Silver doping has previously been suggested to improve the PCA by introducing an intermediate band energy [40,41,42]. Electrons from titanium oxide transfer to the silver particles, become trapped, and thus prolong PCA by hindering the recombination of the electron–hole pairs [40]. Previous studies on nanocomposites formed from silver particle deposition onto titanium oxides have also shown increased PCA under sunlight and 455 nm visible light irradiation [35,41]. In addition, titanium incorporated with biofunctionalized silver nanoparticles was shown to prevent the adhesion of S. aureus while maintaining healthy osteoblast cellular activity [43].
The goal of the present study was to explore whether or not the anodization of TiO2 layers doped with combinations of phosphorus and silver could further improve PCA and potentially further reduce bacterial attachment on the oxide surfaces without negatively affecting the viability of pre-osteoblasts cultured on these surfaces. The primary objective was to compare the relative PCA and S. aureus attachment results from the phosphorus-and-silver-doped oxides to those of their counterpart oxides doped with only phosphorus. Two silver compounds, silver acetate and silver nitrate, were evaluated as potential silver-doping electrolyte additives. A secondary objective of this study was to compare and contrast the effectiveness of silver nitrate and silver acetate as electrolyte silver-doping additives.

2. Materials and Methods

2.1. Sample Preparation

Commercially pure titanium grade 4 (CPTi) disk specimens were cut from 12.7 mm diameter bar stock into 2 mm thick disks under the constant flow of cooling fluid. Cut specimens were wet-ground with 320 grit SiC paper to remove any rough edges and then ultrasonically cleaned using laboratory detergent (Alconox®, White Plains, NY, USA), rinsed with distilled water, and air-dried. Prior to anodization, ground disk specimens were etched in a 10:1 ratio of nitric acid/hydrofluoric acid solution (TURCO NITRADD, Henkel Corporation, Madison Heights, MI, USA) for 30 s to activate the titanium surfaces, rinsed with distilled water, and air-dried.

2.2. Anodization

A mixed-acid electrolyte containing combinations of sulfuric acid (ACS, 95–98%, Fisher Scientific, Waltham, MA, USA), o-phosphoric acid (ACS, 85%, Fisher Scientific, Waltham, MA, USA), hydrogen peroxide (30%, Fisher Scientific, Waltham, MA, USA), and oxalic acid (ACS, 99.5–102.5%, Alfa Aesar, Haverhill, MA, USA) components was used as a control oxide electrolyte in this study. This electrolyte has been previously shown to produce anatase-phase oxide surfaces [11,12,14]. For the combination-doped oxide groups, silver acetate (99%, Acros Organics, Verona, Veneto, Italy) or silver nitrate (99.85%, Thermo Fisher Scientific, Waltham, MA, USA) additions were added to the control’s electrolyte chemistry. The resulting chemistries of the control and the phosphorus-and-silver-doped electrolytes used in this study are compiled in Table 1. Anodization was carried out in 500 mL of each electrolyte using a DC rectifier (350 V, 10 A, Dynatronix, Amery, WI, USA) with two commercially pure titanium strip counter electrodes. The anodization waveform was applied in potentiostatic 12 V with 10 s steps to a final forming voltage of 144 V. The anodization process for the phosphorus-doped control oxides was designated as A144, while the anodization processes for the phosphorus-and-silver-doped oxides using the electrolytes containing the silver acetate or silver nitrate additions were designated as B144 and C144, respectively. Each anodization process started at room temperature, and the temperature was allowed to increase throughout the process. This final forming voltage of 144 V was selected due to the formation of the phosphorus-doped anatase-phase oxide layers on CPTi in previous studies [12,44]. After anodization, the specimens were rinsed in distilled water and dried using laboratory forced air.

2.3. Oxide Characterization

Thin-film X-ray diffraction (Scintag Inc., Waltham, MA, USA, XDS2000) was used to determine the crystalline phases present in the anodized oxide layers of each anodized group. Test specimens were rotated 1° away from the copper X-ray source (1.54 A° Cu-Ka) to enhance the X-ray interaction volume with the anodized surface layer. X-ray diffraction scans were conducted at two-theta angles ranging from 20° to 90° at a continuous scan rate of 2°/min. Jade software (Jade 9, MDI, Livermore, CA, USA) was used to identify diffraction peaks and to perform a relative intensity ratio (RIR) quant analysis on the phases determined to be present in the scans. Scanning electron microscopy (SEM, Supra 40, Zeiss, Oberkochen, Germany) was used to determine the surface morphology on the anodization oxides on the specimens using a 3 kV accelerating voltage. The surface porosity produced on each of the oxide surfaces was evaluated through an image analysis of the SEM images using image analysis software (Vision PE 8.1.690, Clemex, Montreal, QC, Canada). Five representative oxide surface images were utilized in order to quantify the surface porosity present on each oxide group. The total oxide surface area examined for each group was approximately 800 µm2. Percent surface porosity was calculated as the sum of individual pore areas divided by the total scanned area of each SEM image, and pore density was calculated by dividing the total number of pores from each SEM image by the total scanned area of the image. Additionally, size distribution analyses were performed on the anodized layer surface pores found on each oxide by separating surface pores into true nanometer pores with diameters of less than 100 nm, sub-micron pores with diameters of between 100 nm and 1 µm, and micro-porosity with pore diameters greater than 1 µm.
Surface roughness values for the oxides were determined using atomic force microscopy (AFM, Bruker, Santa Barbara, CA, USA, Bioscope Catalyst) in ScanAssyst mode (0.592 Hz, and 512 samples/line). Three selected 100 µm × 100 µm areas were scanned for each oxide group. The roughness average (Ra) and the average maximum height (Rz) were calculated for each oxide group using Gwyddion software (Version 2.58, Department of Nanometrology, Czech Metrology Institute, Okružní Brno, Czechia). Electron dispersive spectroscopy (EDS, TEAM V4.1.0 Microanalysis System Software Suite, EDAX, Mahwah, NJ, USA) was utilized to determine the resulting anodized oxide chemistries. EDS spectra were collected using a 15 kV accelerating voltage from multiple specimens (n = 3) from each oxide group. EDS spot analyses were also performed at an SEM magnification of 50,000× with a 9 kV accelerating voltage in order to determine the compositions of surface particles determined to be present on the silver-doped oxide surfaces. Additionally, one representative specimen from each oxide group was cross-sectioned, mounted in conductive media (Polyfast, Struers, Cleveland, OH, USA), and polished to a 0.02 µm surface finish by using a combination of rotary and vibratory polishing techniques. Cross-sectional SEM images were then acquired using the same 3 kV accelerating voltage in order to determine thickness values for the oxide layers. Five individual oxide thickness measurements were performed on each of the five representative cross-sectional images, resulting in a total of 25 oxide thickness measurements per oxide group.

2.4. Oxide Photocatalytic Activity

The photocatalytic activity of the oxide surfaces was measured using a methylene blue (MB) degradation assay. In order to determine the MB removal efficiencies of the anodized oxides without irradiation, one set of experiments was performed under dark conditions. In order to determine the MB removal efficiencies under different light sources, the photocatalytic activity experiments were also performed under UVA (365 nm peak wavelength, 8 mW/cm2, 10 W, Chanzon Technology, Shenzhen, China) irradiation and under violet light (410 nm peak wavelength, 0.4 mW/cm2, 10 W, Chanzon Technology, Shenzhen, China) irradiation. Stock MB solution (1% aqueous, LabChem, Zelienope, PA, USA) was diluted to a 0.001% concentration with distilled water for the degradation assays. For each experiment, oxide specimens were placed in a 24-well plate. The first portion of each experiment was soaking the porous oxides in 2 mL of MB solution overnight. This step allowed the porous oxide surfaces to become saturated with the MB and prevented any false MB degradation readings that could be associated with absorption by the porous surface samples, as shown in previous similar studies [26,45]. After the soaking period, the MB solution was removed and replaced with 2 mL of fresh MB solution to start the experiment. The MB solution without an oxide specimen was placed in additional (n = 4) wells of the 24-well plate to evaluate the MB removal efficiencies without the presence of a crystallized oxide catalyst under each dark or irradiated condition. The A144, B144, and C144 oxide specimens and an MB control solution group were then exposed to either dark conditions, 365 nm UVA irradiation, or 410 nm violet light irradiation (n = 4) for a period of 4 h in order to compare their relative MB removal efficiencies. Three 50 µL aliquots of the MB solution were transferred from each specimen into a 96-well plate, and the 660 nm absorbance of the aliquots was measured using a ELX800 Universal Microplate Reader (BioTek Instruments, Winooski, VT, USA). MB degradation measurements were taken from the overnight presoak solution and at a number of timepoints, including at 0, 15, 30, 60, 90, 120, 180, and 240 min. The resulting photocatalytic activity was then calculated as a percentage using the following equation [26,46]:
Photocatalytic activity (%) = [(c0 − c)/c0] × [c1/c0] × 100
where c0 is the concentration of the MB solution before irradiation, c is the concentration of the MB solution after irradiation at each of the timepoints, and c1 is the concentration of the MB solution after the overnight soak [26,46].

2.5. Oxide Bacterial Attachment Efficiency

Bacterial cultures were prepared by inoculating tryptic soy broth (TSB) with isolated cultures of Staphylococcus aureus strain 11-14697 (kindly provided by Darlene Miller, Bascom Palmer Eye Institute, Miami, FL, USA), which were streaked onto tryptic soy agar (TSA) and incubated at 37 °C overnight. A single colony from the TSA was then used to inoculate 10 mL of tryptic soy broth (TSB) and incubated for 16–20 h at 37 °C with shaking. The bacteria were diluted to a 1:100 ratio in 20 mL of sterile TSB and grown to OD600, yielding a concentration of 108 colony-forming units per ml. The bacteria were then centrifuged at 2025× g RCF for 30 min, and the resulting pellet was suspended in 20 mL of phosphate-buffered saline (PBS). Anodized specimens from each oxide group were placed in a 24-well polystyrene cell culture plate and inoculated with 1 mL of bacterial suspension. Bacterial attachment was only evaluated against the 365 nm UVA light in this study due to the reduced PCA levels shown with the 410 nm violet light. Half of the specimens (n = 4) with bacteria attached were exposed to 365 nm UVA irradiation for 1 h, while the other half (n = 4) were covered in foil and kept in the dark for the same duration to serve as the control. Oxide specimens were then washed twice with PBS by pipetting, and 1 mL of sterile PBS was added to each specimen. The 24-well plate containing the specimens was then sonicated to remove attached bacteria. The released bacteria were then serially diluted and plated on TSA and incubated overnight at 37 °C. On the following day, colony-forming units (CFU) were counted, and CFU/mL levels were calculated.

2.6. Pre-Osteoblast Cell Culture

Mouse pre-osteoblastic cells (MC3T3-E1, Subclone 4; American Type Culture Collection, Manassas, VA, USA) were cultured and maintained in alpha modified Eagle’s minimum essential medium with 10% fetal bovine serum and 1% penicillin-streptomycin at 37 °C and 5% CO2. Specimens from each oxide group were autoclaved and seeded with approximately 50,000 cells/cm2. The media were changed every 48 h for up to 7 days.

2.7. Cell Viability

Cell viability of the oxide groups was first assessed using a live/dead TM viability/cytotoxicity assay kit (Invitrogen, Carlsbad, CA, USA) on representative specimens of each oxide on day 7. Images were captured using an epifluorescence microscope (IX81, Olympus, Hachioji, Tokyo, Japan) with image analysis software (OLYMPUS cellSens Dimension 3.2Slidebook 4.2.0.10, Olympus, Center Valley, PA, USA). For cell viability quantification, an MTT assay was conducted on day 7 as described previously [38]. On day 7, the medium was removed, replaced with MTT solution (Invitrogen, Carlsbad, CA, USA), and incubated at 37 °C for 4 h. Wells with cell culture medium and MTT solution but no pre-osteoblastic cells present were used as controls. After a 4 h incubation period, the medium was removed, and DMSO (Sigma Aldrich, St. Louis, MO, USA) was added and incubated for 10 min. The contents for each well were collected, and three replicates of each oxide group were then plated in a 96-well plate and read using an ELx800 plate reader (Biotek, Winooski, VT, USA) at 540 nm.

2.8. Statistical Analyses

Welch’s one-way ANOVA (α = 0.05) with a post hoc Games–Howell analyses were utilized to determine significant differences in oxide surface porosity variables, including the total surface pore count, the percent porosity, and the pore density values for each oxide group. One-way ANOVA (α = 0.05) analyses were used in the present study to determine differences in the oxide layer thickness, average oxide surface roughness (Ra), average oxide maximum height surface roughness (Rz), 365 nm UVA PCA, 410 nm violet light PCA, and cell viability. Differences in the bacterial attachment under 365 nm UVA irradiated or dark conditions were evaluated using a two-way ANOVA (α = 0.05). If significance was found, an appropriate post hoc analysis was used to differentiate significantly different groups.

3. Results

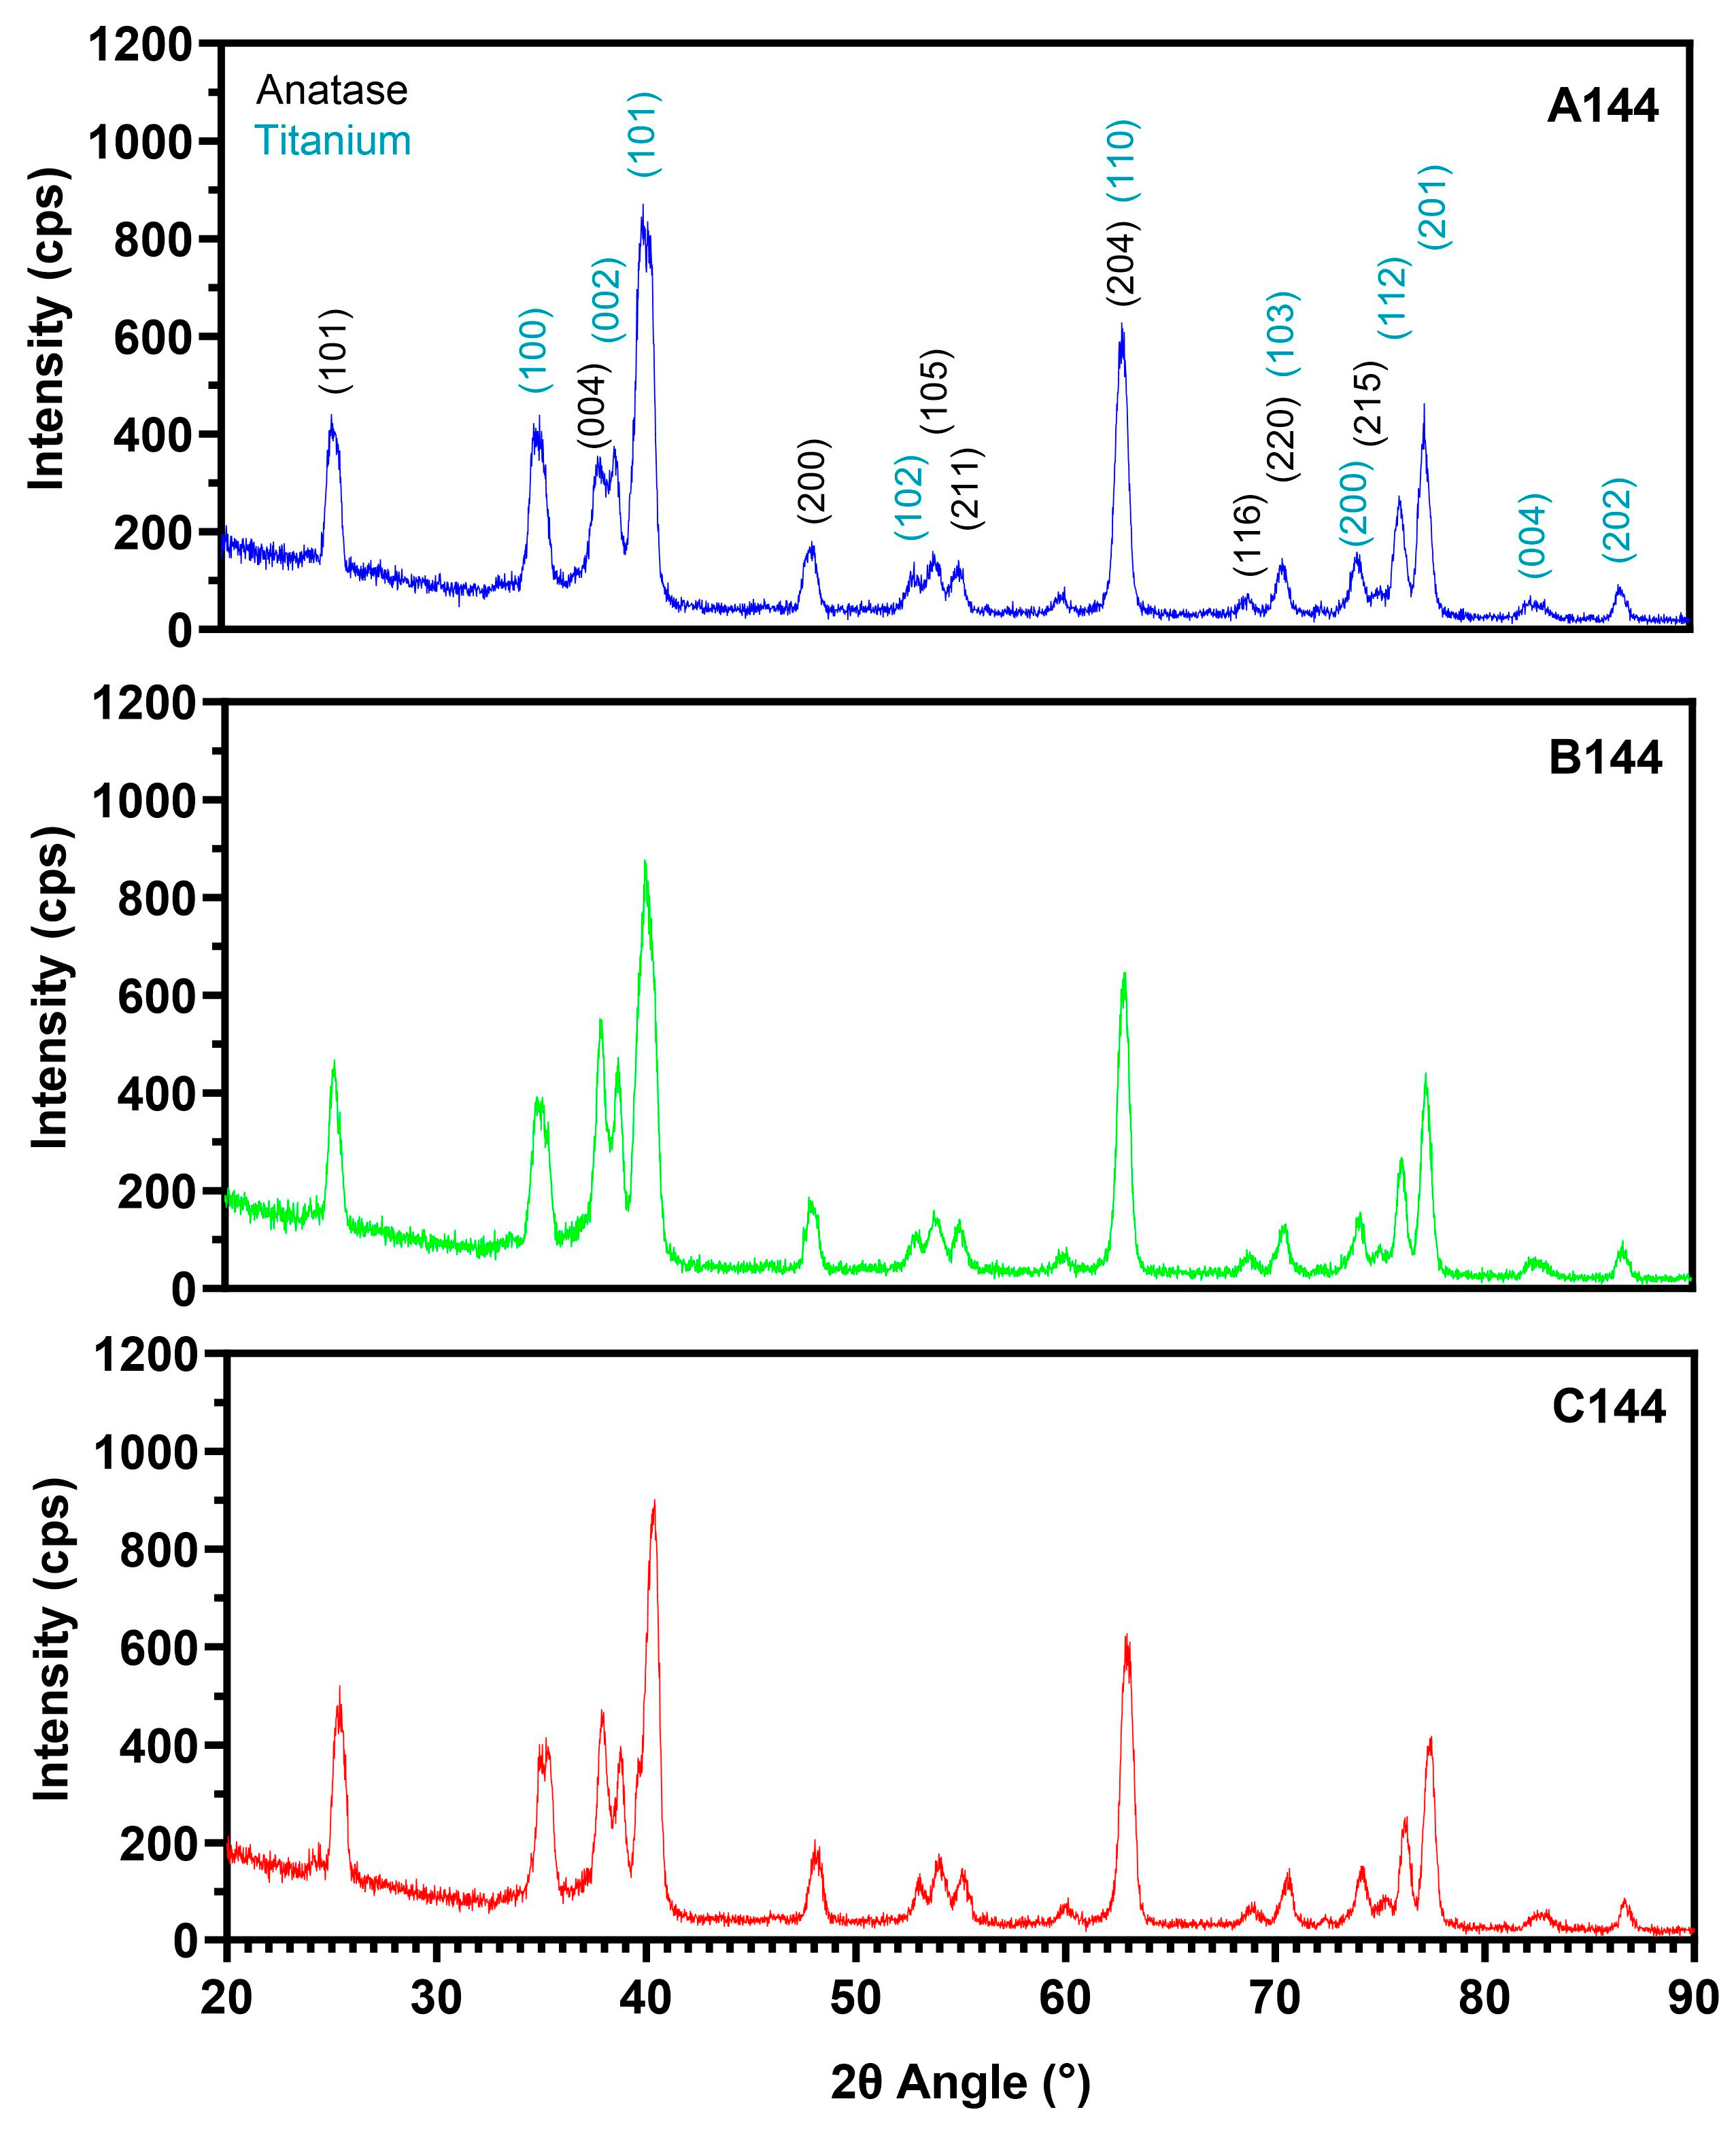
3.1. Oxide Characterization

Two-theta XRD scans were acquired between 20° and 90° for each oxide group, and the results are compiled in Figure 1. Each oxide revealed anatase-phase crystallinity and alpha-phase titanium. No evidence of the rutile phase was shown for any of the oxides. An RIR pattern fitting assessment of the anatase phase and alpha titanium phases revealed the A144 oxide to contain 38.9% anatase phase, the B144 oxide to contain 25.8% anatase phase, and the C144 oxide to contain 43.2% anatase phase.
The SEM images reveal that the surfaces from each oxide group exhibited extensive surface porosity, as shown in Figure 2A–C. The oxide surface porosity shown in the SEM images was formed by sparking occurring during the anodization process when the applied forming voltages exceeded the dielectric constant of the growing oxide layers. More information on porosity formation may be found in our previous anodization studies [10,11,12]. In addition to surface porosity formation, nano-sized white particles were also present across the oxide surfaces of the B144 and C144 phosphorus-and-silver-doped oxide surfaces, as shown in the higher-magnification inset SEM images included in the upper right corners of Figure 2B,C.
Image analyses were performed on five representative images from each oxide group in order to quantify and compare the oxide surface porosity distributions formed during anodization. The oxide surface porosity comparisons are provided in Table 2. The total surface area of each oxide examined was approximately 800 µm2. The A144 phosphorus-doped oxide exhibited approximately 45% nanometer and 55% sub-micron surface porosity. The B144 oxide exhibited approximately 40% nanometer, 59% sub-micron, and 1% micrometer surface porosity. The C144 oxide revealed a similar surface porosity distribution to the B144 oxide, consisting of approximately 46% nanometer, 54% sub-micron, and 0.5% micrometer porosity. Thus, the additions of silver doping into the B144 and C144 oxides may have contributed to the formation of some larger surface pores. Additionally, the B144 phosphorus-and-silver-doped oxide revealed a lower average total pore count than the A144 phosphorus-doped oxide, but it showed equivalent pore density and percent porosity values. The C144 phosphorus-and-silver-doped oxide revealed significantly higher pore density and percent porosity values compared to the B144 oxide.
Two-dimensional 100 µm × 100 µm AFM scans of representative oxide surfaces from each group are shown in Figure 3A–C. A bar chart is also included in Figure 3D compiling the relative average surface roughness, Ra, and average maximum height, with the Rz values shown for each oxide. The Ra values were shown to range from 0.25 µm to 0.70 µm, while the Rz values were shown to range from 2.50 µm to 6.25 µm. No statistical differences were shown between the Ra or Rz values for any of the oxides.
The EDS spectra from representative oxide surfaces of each oxide are shown in Figure 4, and the corresponding semi-quantitative surface chemistries (wt.%) are listed in Table 3. In the top row of Figure 4, the left side shows the entire EDS spectra for each oxide, and the right side shows a magnified view of the EDS spectra near the known Ag peak binding energy range. Each oxide exhibited similar levels of phosphorus uptake into the anodized oxide layers. The phosphorus-and-silver-doped oxide groups (B144 and C144) revealed small silver peaks and showed similar levels of silver dopant uptake into the oxides. Furthermore, EDS spot analyses were performed to attempt to identify the compositions of the white nano-sized particles shown on the surfaces of the Ag-doped oxides. EDS spot analyses performed at 50,000× magnifications showed high concentrations of silver to be present in the largest of the white nanoparticles on the silver acetate-doped and silver nitrate-doped oxide surfaces, as shown in the middle and bottom rows of Figure 4. The B144 oxide nanoparticle revealed a concentration of 42.6 wt.% silver, and the C144 oxide nanoparticle revealed a concentration of 61.4 wt.% silver. It is also interesting that evidence of chlorine also appeared in the spot scan spectra of the nanoparticles on both the B144 and C144 silver-doped oxides.
Representative cross-sectional SEM images of each oxide are shown in Figure 5A–C. A bar chart comparing the oxide thickness values is included in Figure 5D. An ANOVA analysis of the oxide thickness values revealed the addition of silver doping into the phosphorus-and-silver-doped B144 and C144 oxides to significantly increase the oxide thickness values compared to the A144 control oxide that was only doped with phosphorus (p = 0.0002). The B144 oxide doped with silver acetate also revealed a significantly thicker average oxide layer compared to the C144 group doped with silver nitrate (p = 0.0262). For each oxide group, the cross-sectional examination showed the anodized layer porosity to extend from the outermost surface down to the CPTi substrate material.

3.2. Oxide Photocatalytic Activity

The methylene blue degradation assay results under dark conditions are compiled in Figure 6. Under dark conditions, little MB degradation was shown for the MB control solution or any of the oxide groups. After 60 min under dark conditions, the MB control solution showed higher degradation compared to the C144 oxide. Additionally, the B144 oxide revealed higher MB degradation compared to the A144 (p = 0.0166) and C144 (p = 0.0099 oxides at the 60 min timepoint. For the longer 90, 120, and 240 min timepoints, no statistically significant differences in MB degradation were shown between any of the oxide groups compared to the MB control solutions under dark conditions.
The methylene blue degradation assay PCA results generated from the 365 nm UVA irradiation are compiled in Figure 7. After 60 min of 365 nm UVA exposure, the phosphorus-and-silver-doped B144 and C144 oxides showed significantly higher MB degradation compared to the phosphorus-doped A144 control oxide as shown in the left snapshot in the bottom row in Figure 7 (p = 0.0008 and p = 0.0007). However, no significant differences in PCA were shown between the B144 and C144 oxides (p = 0.984). The increased UVA-generated PCA for the phosphorus-and-silver-doped oxides continued throughout the remainder of the four-hour experiment, as illustrated in the 90, 120, and 240 min PCA timepoint snapshots in the bottom row of Figure 7. The largest differences in PCA were shown for the phosphorus-and-silver-doped oxides at the 90 and 120 min timepoints. Overall, the A144 phosphorus-doped oxide revealed statistically similar MB degradation to the MB control solution throughout the course of the UVA experiment. However, a trend of increasing PCA levels generated by the phosphorus-doped A144 oxide was noted at the final 240 min timepoint.
The methylene blue degradation assay PCA results generated from the 410 nm violet light irradiation are compiled in Figure 8. A general trend of increased PCA was shown for the B144 and C144 oxides compared to the A144 phosphorus-doped control oxide and the MB control solution. After 90 min of violet light irradiation, both the B144 and C144 oxides exhibited significantly increased PCA compared to the phosphorus-doped A144 oxide counterpart (p = 0.03 and 0.007). The C144 oxide maintained the significantly increased PCA levels at the 120 min timepoint (p = 0.02). These findings indicate that the addition of silver doping significantly increased PCA even with irradiation wavelengths above 400 nm. By the 240 min timepoint, the A144 oxide also showed significant differences in MB degradation compared to the MB control solution (p = 0.0005). Additionally, none of the oxide catalysts showed differences in MB degradation at the 240 min timepoint.

3.3. Oxide Bacteria Attachment

The S. aureus attachment study was only performed on the 365 nm UVA irradiated oxide groups. S. aureus attachment results (n = 4) under dark conditions and after one hour of 365 nm UVA irradiation are compiled for each oxide in Figure 9. A two-way ANOVA analysis (α = 0.05) revealed no significant interaction between the light and the oxide type on the bacterial attachment levels (p = 0.890). A subsequent simple main effects analysis showed that the oxide type did not exhibit a significant effect on bacterial attachment (p = 0.975). However, the light condition exhibited a significant effect on bacteria attachment. Nonetheless, the post hoc Tukey tests revealed no significant differences between the S. aureus attachment to each oxide group under the UVA-irradiated and dark conditions.

3.4. Pre-Osteoblast Testing

Figure 10 shows the results of the oxide pre-osteoblast cell culture assessments. The live/dead assay indicated a high number of live cells (green) and very few dead cells (red) present on the surfaces of each oxide group after 7 days of culture, as shown in Figure 10A–C. The summarized results of the MTT assay in Figure 10D reveal that both the B144 and C144 phosphorus-and-silver-doped oxide groups showed significantly higher cell viability levels than the phosphorus-doped A144 oxide on day 7 (p < 0.0001 and p = 0.0053). Additionally, the B144 oxide group doped with silver acetate revealed a significantly higher cell viability compared to the C144 oxide doped with silver nitrate (p = 0.007).

4. Discussion

While titanium and its alloys are commonly used materials for bone implants, the naturally forming amorphous oxide layer does not provide an ideal surface for osseointegration and lacks inherent antibacterial properties. Anodization is an effective methodology to modify titanium oxide layers by increasing the oxide thickness, crystallizing the oxide layer, incorporating nano-sized surface features, and introducing beneficial chemical dopants into the oxide layer [9,10,11,12,13,14,15,47]. Crystallizing oxide layers into anatase or rutile phases enables the surface oxide layer to act as a photocatalyst and produce ROS when irradiated with a sufficient energy source [16,17]. The generated ROS have been shown to attack certain bacteria cell membranes and lead to reduced attachment and sometimes bacteria cell death. Anatase-phase oxides have been previously shown to exhibit a higher PCA response compared to rutile-phase oxides due to the existence of a larger band gap between the valence and conduction bands of the titanium oxide semiconductor [48]. The band gap of the anatase phase is 3.2 eV, while the band gap of the rutile phase is 3.0 eV [26,49]. The presence of this larger band gap for anatase has been shown to delay the recombination of electron hole pairs and thus increase the lifetime for ROS generation [50].
The chemical doping of titanium oxides has been shown to further enhance PCA. Phosphorus-doped anatase-phase oxides on a variety of titanium implant alloy substrates have shown enhanced PCA when compared to un-anodized titanium control specimens with naturally forming amorphous oxides [15,44]. Phosphorous dopants were reported to enhance the PCA of anatase-phase powders by reducing the band gap energies and shift the absorption edge to allow for activation under visible light wavelengths [51,52]. Phosphorus-doped anatase powders that were calcinated to 500 °C exhibited a band gap energy of 2.94 eV [52]. Silver doping has also previously been shown to improve the PCA by introducing an intermediate band energy and reducing the band gap [40,41,42]. One study, by mixing silver and anatase powders, showed that adding 90 mg of pure silver powder to 50 mg of anatase powder lowered the band gap energy from 3.11 eV to 2.73 eV [35]. Another study, by mixing anatase powders and silver nanoparticles, revealed that the band gap energy decreases by up to 1.6 eV in optical band gaps for silver–TiO2 composites [53]. Silver dopant incorporation has also been noted to hinder the recombination of electrons and holes due to the presence of a Schottky barrier at the interface between titanium oxide and silver [40]. Additionally, the silver doping of semiconductors has been reported to create charge density oscillations at the interface through a phenomenon called surface plasmon resonance (SPR) [40,54]. Thus, phosphorus and silver doping have each independently been shown to improve the PCA of titanium oxide.
In the present study, we combined the previously successful phosphorus- and silver-doping strategies to form anatase-phase titanium oxide layers containing phosphorus and silver. Each phosphorus-doped and phosphorus-and-silver-doped oxide group exhibited similar surface morphologies, surface porosity, and surface roughness levels. The addition of silver dopants to the anodization processes for the B144 and C144 oxide groups did not significantly alter the general surface morphology compared to the counterpart A144 oxides aside from distributing nano-scaled white particles into and onto the porous oxide surfaces. High-magnification EDS spot analyses confirmed these particles to contain high concentrations of silver. Similar nano-scale silver-containing particles have been reported in other silver-doped oxide studies [21,34,55]. The silver doping additions significantly increased the oxide thickness values of the B144 and C144 oxides compared to the phosphorus-doped A144 control oxides. However, the XRD RIR analyses did not reveal a consistent trend of increases in the anatase phase with the thicker silver-doped oxide layers. The B144 oxide doped with silver acetate revealed less anatase phases to be present compared to the A144 phosphorus-doped control oxide. Given that the B144 oxide was also shown to be significantly thicker than the A144 oxide, this likely indicates that some of the thicker B144 oxide layer was still amorphous-phase TiO2. In contrast, the C144 oxide doped with silver nitrate revealed more anatase phases to be present compared to the A144 oxide.
The EDS analyses revealed that approximately 5 wt.% of phosphorus was incorporated into each oxide group (Table 3), whereas the silver uptake into the B144 and C144 oxides was comparatively much lower at 0.6 wt.% for the SEM full-frame spectra composition (Table 3). Furthermore, EDS surface mapping at similar magnifications showed a relatively even distribution of silver across the oxide surfaces in similar concentrations to the spectra quantifications. However, higher-magnification EDS spot analyses of the nano-sized particles revealed much higher localized silver concentrations to be present. It is unknown how much of the overall silver present on these oxide surfaces can be attributed to the presence of these concentrated nanoparticles and how much was incorporated into the general oxide layers. The EDS spot analyses of the nanoparticles using a 9 kV accelerating voltage to produce L-shell binding energy peaks for silver was challenging due to the interaction volume of the electron beam generated within the oxide surfaces. Therefore, only the largest nanoparticles on the oxide surfaces could be analyzed using this methodology.
Under dark conditions, the B144 silver-and-phosphorus-doped oxide showed significantly higher early MB degradation at the 60 min timepoint compared to the C144 and A144 oxides. This finding may be due to a difference in the adsorption potential of the B144 oxide compared to its A144 and C144 oxide counterparts as a result of the lower surface total pore count values shown (Table 2). Nevertheless, at each later timepoint under dark conditions, no significant differences were shown between the MB degradation of the oxides and the MB control solution. This finding is in good agreement with another study on silver-coated TiO2 films containing anatase and rutile phases. The silver-coated TiO2 films showed no MB degradation under dark conditions [41].
Under 365 nm UVA irradiation, each oxide exhibited PCA-induced methylene blue degradation that continued to increase over the four-hour experiment. The B144 and C144 oxides exhibited significantly higher PCA compared to the phosphorus-doped A144 control oxide for all timepoints of at least 60 min. However, no significant differences in PCA were shown between the silver acetate-doped (B144) and the silver nitrate-doped (C144) oxide groups. In other words, the UVA-irradiated PCA generating abilities for both silver doping additives was shown to be statistically similar. Overall, this finding is in good agreement with other studies involving oxides doped with silver only, which revealed increased PCA under UVA irradiation [40,41,56].
Under 410 nm violet light irradiation, the B144 and C144 oxides showed general trends of increased PCA compared to the phosphorus-doped A144 oxide. Moreover, at the 90 and 120 min timepoints, at least one of the phosphorus-and-silver-doped oxides was still shown to have significantly increased PCA compared to the phosphorus-doped oxide. This was an exciting result since the longer 410 nm violet light wavelength has a lower energy than what has previously been reported to be needed to activate anatase-phase oxides [26,57]. These results agree well with another recent study which demonstrated that the visible light photocatalytic activity of silver-doped nanotube arrays increased with silver-containing nanoparticles with smaller diameters [52]. As shown in the SEM inset high-magnification images in Figure 2, many of the surface nanoparticles on the B144 and C144 oxides exhibit diameters less than 50 nanometers. Another study on titanium oxide nanotubes doped with silver nanoparticles noted that the Schottky barrier was formed at the metal and oxide interface, but the other SPR mechanism creating the charge density oscillations did not appear to be active under visible light wavelengths [40].
S. aureus can adhere to titanium implant surfaces and is one of the first bacterial colonizers that causes peri-implant mucositis and may lead to peri-implantitis [5]. In this study, we examined the relative S. aureus attachment levels after one hour of 365 nm UVA irradiation as an additional measure of photocatalytic activity. Unfortunately, even with the promising UVA irradiation-generated PCA levels shown for the B144 and C144 oxides, no further reductions in S. aureus attachment were shown compared to the control oxide doped only with phosphorus. This finding agrees well with another recently published study from our laboratory that anodized CPTi specimens in the same mixed-acid electrolyte but to a higher final forming voltage of 180 V [58]. In this previous study, the addition of silver doping to the 180 V anodized specimens did not significantly reduce S. aureus attachment compared to the counterpart oxides containing only phosphorus doping. A direct comparison of the 180 V oxides from the previous study and the 144 V group A oxides in the present study revealed the 180 V specimens to show lower surface roughness levels but larger surface pores and higher anatase phase intensities [58]. Chemically, the silver-doped 180 V oxide surfaces also showed slightly lower oxide surface phosphorus dopant levels but slightly higher silver dopant incorporation levels compared to the A144 phosphorus-doped oxides in the present study [58]. It should also be noted that even though no significant reductions in S. aureus attachment were shown in the previous or present study due to the addition of silver doping, the same phosphorus-doped control oxides from both studies were previously shown to reduce S. sanguinis attachment compared to un-anodized titanium [14]. Therefore, these anodization coatings have still been shown to be effective against other common clinically acquired bacteria.
Furthermore, other recent studies depositing silver compounds or nanoparticles onto titanium oxide surfaces in higher concentrations than those used in the present anodization study have shown reduced S. aureus attachment. Anatase-phase titanium nanotube surfaces that were soaked in silver nitrate solutions of concentrations ranging from 0.5 to 2 M showed reduced S. aureus attachment when compared to a titanium nanotube control group [36]. Crystalline titanium thin films consisting of approximately 80% anatase and 20% rutile mixed-phase oxides were coated onto glass substrates and soaked in 1 mM silver nitrate solutions and were shown to reduce S. aureus attachment by 20% after 60 min of direct sunlight irradiation [41]. Additionally, titanium thin films with silver nitrate generated nanoparticle deposits that were irradiated under 365 nm UVA for 60 min showed the ability to completely kill E. coli bacteria after 60 min and S. aureus bacteria after 30 min [55]. Several of these previous silver doping studies also used substantially lower initial bacteria seeding levels compared to the robust 108 colony-forming unit S. aureus seeding levels used in the present study. In the future, changing the electrolyte chemistries to increase the silver nitrate or silver acetate concentrations may increase silver particle deposition onto or into the oxide group surfaces and thus further increase PCA and reduce S. aureus attachment. Additionally, the effectiveness of the phosphorus-and-silver-doped oxides against other commonly encountered bacterial species warrants further exploration.
A small cell culture study was also performed to assess the cytocompatibility of the silver levels in the phosphorus-and-silver-doped oxides. The silver doping levels in the B144 and C144 oxides were shown to be approximately 0.6 wt.% (Table 3). The live/dead images showed that after 7 days, there were similar confluency levels on the B144 and C144 phosphorus-and-silver-doped oxides and the phosphorus-doped A144 oxide, as shown in Figure 10A–C. The 7-day MTT results reveal significantly increased cell viability for both phosphorus-and-silver-doped oxides containing silver additions. This result agrees well with previous studies using the same phosphorus doping anodization processes to higher final forming voltages that contained even higher phosphorus dopant levels [12,13]. The phosphorus-doped anatase oxides exhibited earlier cell differentiation and maturation and higher mineralization compared to non-phosphorus-containing oxides [13]. Previous silver doping studies on titanium using even higher average silver dopant concentrations have also shown little to no cytotoxicity [21,59]. Anodized titanium disks with silver depositions of up to 2.8 at.%, which converts to 16.1 wt.% based on the XPS oxide compositions listed in the study, showed similar human fibroblast cytocompatibility compared to control titanium surfaces without silver deposition [21]. Titanium nanotubes embedded with up to 1.62 at.% silver, which converts to 8.25 wt.% silver based on the XPS surface analysis in the study, showed almost no cytotoxicity to 3T3-E1 pre-osteoblasts after 5 days [59]. These previous findings, combined with the 7-day cell confluency levels and MTT assay results shown for the B144 and C144 oxides in the present study, suggest no issues with the cytotoxicity of these oxides at these phosphorus and silver dopant levels.
Although in the present study, the phosphorus-and-silver-doped oxides did not achieve a significant reduction in S. aureus attachment compared to the phosphorus-doped control oxides with only phosphorus doping, significantly enhanced PCA levels under both 365 nm UVA and 410 nm violet light irradiation sources were shown. Moreover, the phosphorus-and-silver-doped oxides also exhibited significantly higher early pre-osteoblast viability levels as a result of the addition of silver doping into the oxides. This combination of improved PCA and cell viability shown for the phosphorus-and-silver-doped oxides warrants further exploration.

5. Conclusions

The present study investigated the relative PCA, bacterial attachment levels, and cell viability levels of phosphorus-doped and phosphorus-and-silver-doped anatase-phase anodized oxides on implant-grade titanium. The phosphorus-and-silver-doped oxides, with the additions of silver dopants, exhibited significantly increased PCA induced by 365 nm UVA, as evidenced with methylene blue degradation. General trends of increased PCA were also shown for the phosphorus-and-silver-doped oxides under 410 nm violet light irradiation, though significant increases in PCA were only shown at the 90 and 120 min timepoints. Even with the enhanced PCA levels, the UVA-irradiated phosphorus-and-silver-doped oxides still exhibited statistically similar S. aureus attachment levels compared to the oxide counterparts doped only with phosphorus. However, the phosphorus-and-silver-doped oxides also revealed significantly enhanced early cell viability levels compared to the oxides doped only with phosphorus. These significant increases in 365 nm irradiated and 410 nm violet light irradiated PCA and the enhanced early cell viability shown for the phosphorus-and-silver-doped oxides warrant further exploration. Future studies in our laboratories will explore different electrolyte chemistries to increase the silver dopant concentrations in the oxide surfaces and hopefully improve the antibacterial potential of these promising oxide surfaces.

Author Contributions

Conceptualization, C.L.B. and M.D.R.; methodology, M.D.R.; investigation, C.L.B., H.A.J., A.A. and A.P.; writing—original draft preparation, C.L.B.; writing—review and editing, A.V.J., M.E.M. and M.D.R.; visualization, C.L.B. and M.D.R.; supervision, M.D.R. All authors have read and agreed to the published version of the manuscript.

Funding

This research received no external funding.

Institutional Review Board Statement

Not applicable.

Informed Consent Statement

Not applicable.

Data Availability Statement

The data that support the findings of this study are available from the corresponding author upon reasonable request.

Acknowledgments

The authors would like to thank Fort Wayne Metals for the donation of the CPTi grade 4 bar materials used to make the disk specimens for this study.

Conflicts of Interest

The authors declare no conflicts of interest.

References

  1. Gaviria, L.; Salcido, J.P.; Guda, T.; Ong, J.L. Current trends in dental implants. J. Korean Assoc. Oral Maxillofac. Surg. 2014, 40, 50–60. [Google Scholar] [CrossRef] [PubMed]
  2. Gupta, A.; Dhanraj, M.; Sivagami, G. Status of surface treatment in endosseous implant: A literary overview. Indian J. Dent. Res. Off. Publ. Indian Soc. Dent. Res. 2010, 21, 433–438. [Google Scholar] [CrossRef] [PubMed]
  3. Dunlap, J. Implants: Implications for general dentists. Dent. Econ. 1988, 78, 101. [Google Scholar] [PubMed]
  4. Graves, E.G.; Gillum, B.S. Detailed diagnoses and procedures, National Hospital Discharge Survey. Vital Health Stat. 1997, 130, 1–146. [Google Scholar] [PubMed]
  5. Pye, A.; Lockhart, D.; Dawson, M.; Murray, C.; Smith, A. A review of dental implants and infection. J. Hosp. Infect. 2009, 72, 104–110. [Google Scholar] [CrossRef]
  6. Sul, Y.-T. The significance of the surface properties of oxidized titanium to the bone response: Special emphasis on potential biochemical bonding of oxidized titanium implant. Biomaterials 2003, 24, 3893–3907. [Google Scholar] [CrossRef]
  7. Sul, Y.-T.; Johansson, C.B.; Jeong, Y.; Albrektsson, T. The electrochemical oxide growth behaviour on titanium in acid and alkaline electrolytes. Med. Eng. Phys. 2001, 23, 329–346. [Google Scholar] [CrossRef]
  8. Liu, J.; Liu, J.; Attarilar, S.; Wang, C.; Tamaddon, M.; Yang, C.; Xie, K.; Yao, J.; Wang, L.; Liu, C.; et al. Nano-Modified Titanium Implant Materials: A Way Toward Improved Antibacterial Properties. Front. Bioeng. Biotechnol. 2020, 8, 576969. [Google Scholar] [CrossRef]
  9. Williamson, R.; Disegi, J.; Janorkar, A.; Griggs, J.; Roach, M.D. Effect of duty cycle on the crystallinity, pore size, surface roughness and corrosion resistance of the anodized surface on titanium. Surf. Coat. Technol. 2015, 277, 278–288. [Google Scholar] [CrossRef]
  10. Williamson, R.S.; Disegi, J.; Griggs, J.A.; Roach, M.D. Nanopore formation on the surface oxide of commercially pure titanium grade 4 using a pulsed anodization method in sulfuric acid. J. Mater. Sci. Mater. Med. 2013, 24, 2327–2335. [Google Scholar] [CrossRef]
  11. Roach, M.D.; Williamson, R.; Blakely, I.; Didier, L. Tuning anatase and rutile phase ratios and nanoscale surface features by anodization processing onto titanium substrate surfaces. Mater. Sci. Eng. C 2016, 58, 213–223. [Google Scholar] [CrossRef] [PubMed]
  12. Jain, S.; Williamson, R.S.; Roach, M.D. Surface characterization, shear strength, and bioactivity of anodized titanium prepared in mixed-acid electrolytes. Surf. Coatings Technol. 2017, 325, 594–603. [Google Scholar] [CrossRef]
  13. Jain, S.; Williamson, R.S.; Janorkar, A.V.; Griggs, J.A.; Roach, M.D. Osteoblast response to nanostructured and phosphorus-enhanced titanium anodization surfaces. J. Biomater. Appl. 2019, 34, 419–430. [Google Scholar] [CrossRef] [PubMed]
  14. Jain, S.; Williamson, R.S.; Marquart, M.; Janorkar, A.V.; Griggs, J.A.; Roach, M.D. Photofunctionalization of anodized titanium surfaces using UVA or UVC light and its effects against Streptococcus sanguinis. J. Biomed. Mater. Res. Part B Appl. Biomater. 2017, 106, 2284–2294. [Google Scholar] [CrossRef]
  15. Johnson, H.A.; Williamson, R.S.; Marquart, M.; Bumgardner, J.D.; Janorkar, A.V.; Roach, M.D. Photocatalytic activity and antibacterial efficacy of UVA-treated titanium oxides. J. Biomater. Appl. 2020, 35, 500–514. [Google Scholar] [CrossRef]
  16. Maness, P.-C.; Smolinski, S.; Blake, D.M.; Huang, Z.; Wolfrum, E.J.; Jacoby, W.A. Bactericidal Activity of Photocatalytic TiO 2 Reaction: Toward an Understanding of Its Killing Mechanism. Appl. Environ. Microbiol. 1999, 65, 4094–4098. [Google Scholar] [CrossRef]
  17. Suketa, N.; Sawase, T.; Kitaura, H.; Naito, M.; Baba, K.; Nakayama, K.; Wennerberg, A.; Atsuta, M. An Antibacterial Surface on Dental Implants, Based on the Photocatalytic Bactericidal Effect. Clin. Implant. Dent. Relat. Res. 2005, 7, 105–111. [Google Scholar] [CrossRef]
  18. Matsunaga, T.; Tomoda, R.; Nakajima, T.; Wake, H. Photoelectrochemical sterilization of microbial cells by semiconductor powders. FEMS Microbiol. Lett. 1985, 29, 211–214. [Google Scholar] [CrossRef]
  19. Choi, J.Y.; Chung, C.J.; Oh, K.T.; Choi, Y.J.; Kim, K.H. Photocatalytic Antibacterial Effect of TiO2 Film of TiAg on Streptococcus mutans. Angle Orthod. 2009, 79, 528–532. [Google Scholar] [CrossRef]
  20. Foster, H.A.; Ditta, I.B.; Varghese, S.; Steele, A. Photocatalytic disinfection using titanium dioxide: Spectrum and mechanism of antimicrobial activity. Appl. Microbiol. Biotechnol. 2011, 90, 1847–1868. [Google Scholar] [CrossRef]
  21. Godoy-Gallardo, M.; Rodríguez-Hernández, A.G.; Delgado, L.M.; Manero, J.M.; Javier Gil, F.; Rodríguez, D. Silver deposition on titanium surface by electrochemical anodizing process reduces bacterial adhesion of Streptococcus sanguinis and Lactobacillus salivarius. Clin. Oral Impl. Res. 2015, 26, 1170–1179. [Google Scholar] [CrossRef] [PubMed]
  22. Moriarty, T.F.; Kuehl, R.; Coenye, T.; Metsemakers, W.-J.; Morgenstern, M.; Schwarz, E.M.; Riool, M.; Zaat, S.A.; Khana, N.; Kates, S.L.; et al. Orthopaedic device-related infection: Current and future interventions for improved prevention and treatment. EFORT Open Rev. 2016, 1, 89–99. [Google Scholar] [CrossRef] [PubMed]
  23. Rupp, F.; Haupt, M.; Klostermann, H.; Kim, H.-S.; Eichler, M.; Peetsch, A.; Scheideler, L.; Doering, C.; Oehr, C.; Wendel, H.; et al. Multifunctional nature of UV-irradiated nanocrystalline anatase thin films for biomedical applications. Acta Biomater. 2010, 6, 4566–4577. [Google Scholar] [CrossRef] [PubMed]
  24. Mills, A.; Le Hunte, S. An overview of semiconductor photocatalysis. J. Photochem. Photobiol. A Chem. 1997, 108, 1–35. [Google Scholar] [CrossRef]
  25. Al-Shamali, S.S. Photocatalytic Degradation of Methylene Blue in the Presence of TiO2 Catalyst Assisted Solar Radiation. Aust. J. Basic Appl. Sci. 2013, 7, 172–176. [Google Scholar]
  26. Pantaroto, H.N.; Ricomini-Filho, A.P.; Bertolini, M.M.; da Silva, J.H.D.; Neto, N.F.A.; Sukotjo, C.; Rangel, E.C.; Barão, V.A. Antibacterial photocatalytic activity of different crystalline TiO2 phases in oral multispecies biofilm. Dent. Mater. 2018, 34, e182–e195. [Google Scholar] [CrossRef]
  27. Zhu, J.; Zheng, W.; He, B.; Zhang, J.; Anpo, M. Characterization of Fe–TiO2 photocatalysts synthesized by hydrothermal method and their photocatalytic reactivity for photodegradation of XRG dye diluted in water. J. Mol. Catal. A Chem. 2004, 216, 35–43. [Google Scholar] [CrossRef]
  28. Tada, H.; Ishida, T.; Takao, A.; Ito, S. Drastic Enhancement of TiO2-Photocatalyzed Reduction of Nitrobenzene by Loading Ag Clusters. Langmuir 2004, 20, 7898–7900. [Google Scholar] [CrossRef]
  29. Dawson, A.; Kamat, P.V. Semiconductor−Metal Nanocomposites. Photoinduced Fusion and Photocatalysis of Gold-Capped TiO2 (TiO2/Gold) Nanoparticles. J. Phys. Chem. B 2001, 105, 960–966. [Google Scholar] [CrossRef]
  30. Nasirian, M.; Lin, Y.P.; Bustillo-Lecompte, C.F.; Mehrvar, M. Enhancement of photocatalytic activity of titanium dioxide using non-metal doping methods under visible light: A review. Int. J. Environ. Sci. Technol. 2018, 15, 2009–2032. [Google Scholar] [CrossRef]
  31. Zhao, L.; Chu, P.K.; Zhang, Y.; Wu, Z. Antibacterial coatings on titanium implants. J. Biomed. Mater. Res. Part B Appl. Biomater. 2009, 91B, 470–480. [Google Scholar] [CrossRef] [PubMed]
  32. Lansdown, A.B. Silver in health care: Antimicrobial effects and safety in use. Curr. Probl. Dermatol. 2006, 33, 17–34. [Google Scholar] [PubMed]
  33. van Hengel, I.; Putra, N.; Tierolf, M.; Minneboo, M.; Fluit, A.; Fratila-Apachitei, L.; Apachitei, I.; Zadpoor, A. Biofunctionalization of selective laser melted porous titanium using silver and zinc nanoparticles to prevent infections by antibiotic-resistant bacteria. Acta Biomater. 2020, 107, 325–337. [Google Scholar] [CrossRef] [PubMed]
  34. Lan, M.-Y.; Liu, C.-P.; Huang, H.-H.; Lee, S.-W. Both Enhanced Biocompatibility and Antibacterial Activity in Ag-Decorated TiO2 Nanotubes. PLoS ONE 2013, 8, e75364. [Google Scholar] [CrossRef] [PubMed]
  35. Ibukun, O.; Jeong, H.K. Tailoring titanium dioxide by silver particles for photocatalysis. Curr. Appl. Phys. 2020, 20, 23–28. [Google Scholar] [CrossRef]
  36. Zhao, L.; Wang, H.; Huo, K.; Cui, L.; Zhang, W.; Ni, H.; Zhang, Y.; Wu, Z.; Chu, P.K. Antibacterial nano-structured titania coating incorporated with silver nanoparticles. Biomaterials 2011, 32, 5706–5716. [Google Scholar] [CrossRef]
  37. Croes, M.; Bakhshandeh, S.; van Hengel, I.; Lietaert, K.; van Kessel, K.; Pouran, B.; van der Wal, B.; Vogely, H.; Van Hecke, W.; Fluit, A.; et al. Antibacterial and immunogenic behavior of silver coatings on additively manufactured porous titanium. Acta Biomater. 2018, 81, 315–327. [Google Scholar] [CrossRef]
  38. Rai, M.; Yadav, A.; Gade, A. Silver nanoparticles as a new generation of antimicrobials. Biotechnol. Adv. 2009, 27, 76–83. [Google Scholar] [CrossRef]
  39. Cheng, H.; Li, Y.; Huo, K.; Gao, B.; Xiong, W. Long-lasting in vivo and in vitro antibacterial ability of nanostructured titania coating incorporated with silver nanoparticles. J. Biomed. Mater. Res. Part A 2014, 102, 3488–3499. [Google Scholar] [CrossRef]
  40. Syrek, K.; Grudzień, J.; Sennik-Kubiec, A.; Brudzisz, A.; Sulka, G.D. Anodic Titanium Oxide Layers Modified with Gold, Silver, and Copper Nanoparticles. J. Nanomater. 2019, 2019, 9208734. [Google Scholar] [CrossRef]
  41. Ibrahim, H.M.M. Photocatalytic degradation of methylene blue and inactivation of pathogenic bacteria using silver nanoparticles modified titanium dioxide thin films. World J. Microbiol. Biotechnol. 2015, 31, 1049–1060. [Google Scholar] [CrossRef] [PubMed]
  42. Moma, J.; Baloyi, J. Modified Titanium Dioxide for Photocatalytic Applications. In Photocatalysts—Applications and Attributes; Sher Bahadar, K., Kalsoom, A., Eds.; IntechOpen: Rijeka, Croatia, 2019; Chapter 3; pp. 37–56. [Google Scholar] [CrossRef]
  43. Li, P.; Tong, Z.; Huo, L.; Yang, F.; Su, W. Antibacterial and biological properties of biofunctionalized nanocomposites on titanium for implant application. J. Biomater. Appl. 2016, 31, 205–214. [Google Scholar] [CrossRef] [PubMed]
  44. Hardman, C.T.; Johnson, H.A.; Doukas, M.; Pettit, C.C.; Janorkar, A.V.; Williamson, R.S.; Roach, M.D. Photocatalytic, phosphorus-doped, anatase oxide layers applicable to titanium implant alloys. Surf. Interface Anal. 2022, 54, 619–630. [Google Scholar] [CrossRef]
  45. Joo, H.-C.; Lim, Y.-J.; Kim, M.-J.; Kwon, H.-B.; Han, J.-H. Characterization on titanium surfaces and its effect on photocatalytic bactericidal activity. Appl. Surf. Sci. 2010, 257, 741–746. [Google Scholar] [CrossRef]
  46. Loncar, E.; Radeka, M.; Petrovic, S.; Skapin, A.; Rudic, O.; Ranogajec, J. Determination of the photocatalytic activity of TiO2 coatings on clay roofing tile substrates methylene blue as model pollutant. Acta Period. Technol. 2009, 40, 125–133. [Google Scholar] [CrossRef]
  47. İzmir, M.; Ercan, B. Anodization of titanium alloys for orthopedic applications. Front. Chem. Sci. Eng. 2019, 13, 28–45. [Google Scholar] [CrossRef]
  48. Hurum, D.C.; Agrios, A.G.; Gray, K.A.; Rajh, T.; Thurnauer, M.C. Explaining the Enhanced Photocatalytic Activity of Degussa P25 Mixed-Phase TiO2 Using EPR. J. Phys. Chem. B 2003, 107, 4545–4549. [Google Scholar] [CrossRef]
  49. Mo, S.-D.; Ching, W.Y. Electronic and optical properties of three phases of titanium dioxide: Rutile, anatase, and brookite. Phys. Rev. B 1995, 51, 13023–13032. [Google Scholar] [CrossRef]
  50. Luttrell, T.; Halpegamage, S.; Tao, J.; Kramer, A.; Sutter, E.; Batzill, M. Why is anatase a better photocatalyst than rutile?—Model studies on epitaxial TiO2 films. Sci. Rep. 2014, 4, 4043. [Google Scholar] [CrossRef]
  51. Gopal, N.O.; Lo, H.-H.; Ke, T.-F.; Lee, C.-H.; Chou, C.-C.; Wu, J.-D.; Sheu, S.-C.; Ke, S.-C. Visible Light Active Phosphorus-Doped TiO2 Nanoparticles: An EPR Evidence for the Enhanced Charge Separation. J. Phys. Chem. C 2012, 116, 16191–16197. [Google Scholar] [CrossRef]
  52. Iwase, M.; Yamada, K.; Kurisaki, T.; Prieto-Mahaney, O.O.; Ohtani, B.; Wakita, H. Visible-light photocatalysis with phosphorus-doped titanium(IV) oxide particles prepared using a phosphide compound. Appl. Catal. B Environ. 2013, 132–133, 39–44. [Google Scholar] [CrossRef]
  53. Barone, P.; Stranges, F.; Barberio, M.; Renzelli, D.; Bonanno, A.; Xu, F. Study of Band Gap of Silver Nanoparticles—Titanium Dioxide Nanocomposites. J. Chem. 2014, 2014, 589707. [Google Scholar] [CrossRef]
  54. Jiang, Z.; Ouyang, Q.; Peng, B.; Zhang, Y.; Zan, L. Ag size-dependent visible-light-responsive photoactivity of Ag–TiO2 nanostructure based on surface plasmon resonance. J. Mater. Chem. A 2014, 2, 19861–19866. [Google Scholar] [CrossRef]
  55. Deshmukh, S.P.; Mullani, S.B.; Koli, V.B.; Patil, S.M.; Kasabe, P.J.; Dandge, P.B.; Pawar, S.A.; Delekar, S.D. Ag Nanoparticles Connected to the Surface of TiO2 Electrostatically for Antibacterial Photoinactivation Studies. Photochem. Photobiol. 2018, 94, 1249–1262. [Google Scholar] [CrossRef]
  56. Chen, K.; Feng, X.; Tian, H.; Li, Y.; Xie, K.; Hu, R.; Cai, Y.; Gu, H. Silver-decorated titanium dioxide nanotube arrays with improved photocatalytic activity for visible light irradiation. J. Mater. Res. 2014, 29, 1302–1308. [Google Scholar] [CrossRef]
  57. Gopal, J.; George, R.; Muraleedharan, P.; Khatak, H. Photocatalytic Inhibition of Microbial Adhesion by Anodized Titanium. Biofouling 2004, 20, 167–175. [Google Scholar] [CrossRef]
  58. Ali, A.; Polepalli, L.; Chowdhury, S.; Carr, M.A.; Janorkar, A.V.; Marquart, M.E.; Griggs, J.A.; Bumgardner, J.D.; Roach, M.D. Silver-Doped Titanium Oxide Layers for Improved Photocatalytic Activity and Antibacterial Properties of Titanium Implants. J. Funct. Biomater. 2024, 15, 163. [Google Scholar] [CrossRef]
  59. Gao, A.; Hang, R.; Huang, X.; Zhao, L.; Zhang, X.; Wang, L.; Tang, B.; Ma, S.; Chu, P.K. The effects of titania nanotubes with embedded silver oxide nanoparticles on bacteria and osteoblasts. Biomaterials 2014, 35, 4223–4235. [Google Scholar] [CrossRef]
Figure 1. Representative XRD scans of each oxide group showing anatase phase formation. The RIR pattern fitting quant analyses revealed the A144 oxide to contain 38.9% anatase phase, the B144 oxide to contain 25.4% anatase oxide, and the C144 oxide to contain 43.2% anatase phase.
Oxygen 04 00025 g001
Figure 2. Representative SEM surface images of each oxide: (A) A144, (B) B144, and (C) C144.
Oxygen 04 00025 g002
Figure 3. AFM 2D surface images of each oxide: (A) A144, (B) B144, and (C) C144. (D) Oxide surface roughness comparison. Similar Ra and Rz values are shown for each oxide group.
Oxygen 04 00025 g003
Figure 4. (Top Left) Representative EDS spectra for each oxide. (Top Right) A magnified view of the binding energy range surrounding the Ag peak positions within the representative oxide EDS spectra. Both phosphorus-and-silver-doped oxide groups revealed small silver peaks (Lα = 2.983 keV and Lβ = 3.149 keV) within the EDS spectra. (Middle Row) A representative high-magnification SEM image of the nanoparticle on the B144 oxide surface (arrow) and the corresponding EDS spot analyses. (Bottom Row) A representative high-magnification SEM image of the nanoparticle on the C144 oxide surface (arrow) and the corresponding EDS spot analyses.
Oxygen 04 00025 g004
Figure 5. Representative cross-sectional oxide thickness images and oxide thickness values for each group: (A) A144 cross-sectional image, (B) B144 cross-sectional image, (C) C144 cross-sectional image, and (D) oxide thickness comparison. Both phosphorus-and-silver-doped oxides revealed significant increases in oxide thickness compared to phosphorus-doped control oxide.
Oxygen 04 00025 g005
Figure 6. The methylene blue degradation assay results under dark conditions. (Top) MB degradation over the four-hour experiment. (Bottom Row) A snapshot of the MB degradation results at the 60, 90, 120 and 240 min timepoints. At the 60 min timepoint, the B144 oxide revealed significantly higher MB degradation compared to the counterpart A144 and C144 oxides. At longer timepoints, no significant MB degradation differences were shown between any of the oxides or the MB control solution.
Oxygen 04 00025 g006
Figure 7. The methylene blue degradation assay results of each oxide under 365 nm UVA irradiation. (Top) Relative 365 nm UVA light induced MB degradation over the four-hour experiment. (Bottom Row) A snapshot of the 365 nm UVA irradiation results at the 60, 90, 120 and 240 min timepoints. Both the B144 and C144 oxides exhibited significantly increased PCA levels when compared to the phosphorus-doped A144 counterpart oxide and the MB control solution from the 60 min timepoint until the end of the experiment. The phosphorus-doped A144 oxide showed similar MB degradation to the MB control solution throughout all experimental timepoints.
Oxygen 04 00025 g007
Figure 8. The methylene blue degradation assay results of each oxide under 410 nm violet light irradiation. (Top) Relative 410 nm violet light induced MB degradation over the four-hour experiment. (Bottom Row) A snapshot of 410 nm violet light irradiation results at the 60, 90, 120 and 240 min timepoints. Both phosphorus-and-silver-doped oxides exhibited significantly increased PCA levels when compared to the phosphorus-doped counterpart oxide at the 90 min timepoint. The C144 oxide still exhibited significantly higher PCA levels at the 120 min timepoint.
Oxygen 04 00025 g008
Figure 9. Relative S. aureus attachment to each oxide group under dark and illuminated conditions.
Oxygen 04 00025 g009
Figure 10. Pre-osteoblast cell culture assessment for each oxide group. (A) Representative live/dead image of A144 oxide, (B) representative live/dead image of B144 oxide, and (C) representative live/dead image of C144 oxide. For each image, live cells are shown in green, and dead cells are shown in red. (D) Summary of relative 7-day cell viability levels on each oxide. Both B144 and C144 phosphorus-and-silver-doped oxides exhibited higher cell viability levels compared to A144 phosphorus-doped oxide.
Oxygen 04 00025 g010
Table 1. Anodization electrolyte compositions for each oxide group.
Oxide
Group
Sulfuric
Acid (M)
Phosphoric
Acid (M)
Oxalic
Acid (M)
Hydrogen
Peroxide (M)
Silver
Acetate (M)
Silver
Nitrate (M)
A1443.50.190.250.75
B1443.50.190.250.750.05
C1443.50.190.250.75 0.05
Table 2. Surface porosity analysis of oxides.
Oxide GroupTotal Pore
Count 1
Pore
Density 1
Percent
Porosity 1
(%)
Pore Size Distribution (%)
<100 nm100 nm–1 µm>1 µm
A144267 ± 21 A1.7 ± 0.1 AB9.9 ± 0.4 AB45.1 ± 3.954.9 ± 3.9-
B144211 ± 20 B1.3 ± 0.1 B9.6 ± 0.5 B40.3 ± 2.659.0 ± 3.00.7 ± 0.9
C144285 ± 56 AB1.8 ± 0.3 A10.6 ± 0.6 A46.1 ± 3.153.5 ± 3.00.4 ± 0.4
1 Oxides with the same superscript letters are not statistically different.
Table 3. EDS surface chemistry of each oxide group.
Oxide
Group
Titanium (wt.%)Oxygen
(wt.%)
Phosphorus (wt.%)Sulfur
(wt.%)
Silver
(wt.%)
A14456.2 ± 0.338.6 ± 0.04.7 ± 0.20.5 ± 0.1-
B14454.4 ± 0.639.6 ± 0.35.0 ± 0.30.4 ± 0.10.6 ± 0.1
C14454.6 ± 0.239.4 ± 0.24.9 ± 0.20.6 ± 0.10.6 ± 0.1
Disclaimer/Publisher’s Note: The statements, opinions and data contained in all publications are solely those of the individual author(s) and contributor(s) and not of MDPI and/or the editor(s). MDPI and/or the editor(s) disclaim responsibility for any injury to people or property resulting from any ideas, methods, instructions or products referred to in the content.

