Article

Antioxidant-Rich Extracts from Lemon Verbena (Aloysia citrodora L.) Leaves through Response Surface Methodology

by
Vassilis Athanasiadis
,
Theodoros Chatzimitakos
*,
Ioannis Makrygiannis
,
Dimitrios Kalompatsios
,
Eleni Bozinou
and
Stavros I. Lalas
Department of Food Science and Nutrition, University of Thessaly, Terma N. Temponera Str., 43100 Karditsa, Greece
*
Author to whom correspondence should be addressed.
Oxygen 2024, 4(1), 1-19; https://doi.org/10.3390/oxygen4010001
Submission received: 23 December 2023 / Revised: 17 January 2024 / Accepted: 18 January 2024 / Published: 22 January 2024

Abstract

:
A member of the Verbenaceae family, Aloysia citrodora, or lemon verbena, is a medicinal herb with antioxidant compounds. The aim of this study was to develop a green, optimized method for the bioactive compound (carotenoids, ascorbic acid, and polyphenols) extraction from lemon verbena leaves through response surface methodology (RSM). The bioactive compound recovery was shown to be significantly affected by the extraction technique (both with pulsed electric field and ultrasound-assisted extraction), along with an extraction solvent, based on partial least squares analysis. Consequently, the maximum polyphenol yield required a double-assisted extraction with a relatively low extraction duration (60 min) at a high temperature (80 °C), with a moderate-polarity extraction solvent (50% v/v ethanol). With the optimized method, the total polyphenol content (TPC) was measured at 175.03 mg gallic acid equivalents/g, whereas chromatographic analysis revealed that verbascoside was the most prevalent polyphenol (132.61 mg/g). The optimum extract provided a high antioxidant capacity through the measurements of FRAP (1462.17 μmol ascorbic acid equivalents (AAE)/g), DPPH (1108.91 μmol AAE/g), and H2O2 (1662.93 μmol AAE/g). Total carotenoids were measured at 499.61 μg/g, with ascorbic acid at 8.36 μg/g. Correlation analyses revealed a negative correlation of the latter compound with color coordinates. This study highlights the potential of lemon verbena leaves to be used in pharmaceutical and food industries.

1. Introduction

Medicinal plants are a significant source of compounds that exhibit bioactivities, rendering them valuable molecules for therapeutic, cosmetic, and food-related products [1]. Phenolic compounds are major bioactive compounds found in plants [2]. They offer notable therapeutic properties and function as natural antioxidants and preservatives [3]. The efficacy of plant extracts, in terms of a specific activity, is dependent on their chemical composition, which can exhibit variations due to environmental factors [4,5] (such as temperature, altitude, soil type, etc.) under which the plant was grown [6], as well as due to variations between different plant species [7]. As such, the efficacy of plant extracts rich in polyphenols can vary, due to the factors mentioned above [8]. Considering their beneficial health effects and antioxidant activity, polyphenols are among the most heavily researched classes of bioactive molecules [9]. They may promote human health when consumed daily, significantly including inhibitory activity against a variety of serious chronic diseases, including cancer, diabetes, and others [10,11]. Owing to the fact that polyphenols are molecules that stand out due to their antioxidant properties, much effort is being placed to produce polyphenol-rich extracts from various plants. This is necessitated by the high demand for natural antioxidants that can be used to substitute their synthesized analogues in various products [12]. Furthermore, extensive research has been conducted on the antimicrobial properties of polyphenols found in medicinal plants, targeting a diverse array of microorganisms. Particular attention has been drawn to tannins and flavonols as a result of their broad antimicrobial activity compared to other polyphenols. The majority of these compounds interfere with a variety of microbial virulence factors including the inhibition of biofilm formation and neutralization of bacterial toxins, whereas they demonstrate synergistic effects when combined with antibiotics [13]. The food industry is willing to use these compounds as natural preservatives since they increase the shelf life of numerous products [14]. For instance, antioxidant activity in cottage cheese has been boosted by Rosmarinus officinalis extract, whereas polyphenol and flavonoid concentration in extruded corn snack and bacterial content have all been improved by herbal mixtures containing Laurus nobilis, and Curcuma longa [15].
The Verbenaceae family includes approximately 2000 species and more than 100 genera, grown over a broad geographic range that covers tropical, subtropical, and temperate regions across the globe [16]. Since ancient times, aromatic species in this family have been utilized as flavorings in foods and beverages [17]. Moreover, they have been used in traditional medicinal remedies. Lemon verbena (Aloysia citrodora) is a member of the Verbenaceae family that originated in South America but, nowadays, grows throughout North Africa, Southern Europe, and parts of Iran. Lemon verbena is a well-known aromatic species that is rich in antioxidant compounds with high antioxidant activity, such as polyphenols, ascorbic acid, and carotenoids [18,19,20]. Its extracts are widely applicable in the fields of aromatherapy and perfumery. In traditional medicine, its extracts have been employed to treat several digestive issues including flatulence, indigestion, and acidity [21]. Antibacterial, antifungal, anti-inflammatory, and antioxidant properties have been attributed to lemon verbena water infusions [22]. The high content of verbascoside, also known as acteoside, in lemon verbena leaf extract is well acknowledged. It has substantial biological properties such as anxiolytic, antioxidant, anticancer, neuroprotective, antimicrobial, anesthetic, and sedative effects [19,23]. It is also reported that lemon verbena leaf extract contains a high concentration of other polyphenols, tannins, and flavonoids [24].
Green extraction techniques could be used either as pretreatment or as sole extraction techniques for the sustainable recovery of several bioactive compounds from plant sources [25]. These are environmentally friendly techniques as they lack the use of organic solvents and demand lower extraction time and energy consumption [26]. Despite the several human benefits associated with the intake of A. citrodora, there is a scarcity of research related to the green manufacturing of extracts abundant in antioxidant polyphenols. The object of this study was to optimize a green extraction process to prepare extracts, rich in antioxidant compounds (i.e., polyphenols, ascorbic acid, and carotenoids), that could potentially be used by food and pharmaceutical industries. To do so, a response surface methodology (RSM) was employed to optimize the extraction procedure. More specifically, green solvent mixtures consisting of water and ethanol, along with the temperature and the duration of the extraction process, were studied. To further enhance this process, green sample pretreatment techniques (i.e., pulsed electric field (PEF) and ultrasonication (US)) were implemented to assist conventional extraction (stirring). The optimum conditions were determined with a partial least squares (PLS) model.

2. Materials and Methods

2.1. Chemicals and Reagents

Hydrochloric acid, methanol, L-ascorbic acid, phosphate buffer solution, aluminum chloride, 2,2-diphenyl-1-picrylhydrazyl (DPPH) 2,4,6-tris(2-pyridyl)-s-triazine (TPTZ), trichloroacetic acid, β-carotene analytical standard, and all chemical standards for the HPLC determination of polyphenols were obtained from Sigma-Aldrich (Darmstadt, Germany). Ethanol, gallic acid, and the Folin–Ciocalteu reagent were bought from Panreac Co. (Barcelona, Spain). From Merck (Darmstadt, Germany), iron (III) chloride was purchased. Anhydrous sodium carbonate was purchased from Penta (Prague, Czech Republic). Hydrogen peroxide (35% v/v) was purchased from Chemco (Malsch, Germany). Deionized water was used for all conducted experiments.

2.2. Lemon Verbena Leaves Material

For all experiments, lemon verbena leaves were gathered from a local market in Karditsa, Greece. The leaves were rinsed extensively with distilled water and dried with paper towels. The sample underwent freeze-drying using a Biobase BK-FD10P freeze-dryer (Jinan, China). The dried lemon verbena plant was then ground to a fine powder (<400 μm diameter) using a blender. Finally, until further analysis, the powder was preserved at −40 °C.

2.3. Extraction Process

To identify the optimal conditions for the recovery of antioxidant compounds from lemon verbena, different combinations of extraction with other pre-treatment techniques were used. In all cases, 1 g of dried powder was mixed with 20 mL of solvent. The solvents employed were 0–100% v/v ethanol in water. PEF and US techniques were used to further assist the conventional extraction (stirring) process. In the case that these techniques were employed, the leaves powder was hydrated by adding the corresponding solvent and left for 10 min. After that, the sample was treated either with PEF or with US for 20 min, whereas when the two techniques were combined, a 20 min PEF treatment was followed by a 20 min treatment with US. Finally, all samples underwent an extraction step under stirring. During the PEF process of the samples, a digital oscilloscope (Rigol DS1052E, Beaverton, OR, USA), two custom stainless-steel chambers (Val-Electronic, Athens, Greece), a mode/arbitrary waveform generator (UPG100, ELV Elektronik AG, Leer, Germany), and a high-voltage power generator (Leybold, LD Didactic GmbH, Huerth, Germany) were used. An electric field strength of 1.0 kV/cm was chosen, with a pulse period of 1 ms (frequency: 1 kHz) and a pulse length of 10 μs. An Elmasonic P machine (Elma Schmidbauer GmbH, Singen, Germany) was used for US treatment and maintained a temperature of 30 °C while operating at 37 kHz.
For the stirring process, the powder–solvent mixtures were transferred to screw-capped glass bottles and heated at 20–80 °C for 30–150 min, under continuous stirring at 500 rpm. After the extraction was completed, the samples were centrifuged at 10,000× g in a NEYA 16R centrifuge (Remi Elektrotechnik Ltd., Palghar, India) for 10 min. Finally, the supernatants were collected and stored at −40 °C until further analysis. The extraction took place in various combinations of the examined parameters with the coded levels shown in Table 1.

2.4. Optimization with Response Surface Methodology (RSM) and Experimental Design

To assess the antioxidant activity of lemon verbena extracts and to isolate bioactive compounds as efficiently as possible, the RSM technique was used. Thus, efficiently maximizing the levels of these values was the primary goal of the design. This was accomplished by initially optimizing the extraction technique, along with the solvent concentration (C, % v/v of ethanol), extraction time (t, min), and extraction temperature (T, °C). Based on an experiment that used a Box–Behnken design with a main impact screening arrangement, the optimization of the extraction process was determined. On the basis of optimization, an experiment was conducted with a main effect screening design and 20 design points. The experimental design required setting up the process variables at five different levels. Table 1 displays the coded and observed levels. The overall significance of the model (R2, p) and the significance of the model coefficients (equations) were determined using analysis of variance (ANOVA) and summary-of-fit tests, with a minimum level of 95%. In addition, the response variable was predicted as a function of the examined independent factors using a quadratic (second-order) polynomial model, as illustrated in Equation (1):
Y k = β 0 + i = 1 2 β i X i + i = 1 2 β i i X i 2 + i = 1 2 j = i + 1 3 β i j X i X j
where Xi and Xj represent the independent variables, and Yk defines the predicted response variable. The model linear, quadratic, and interaction terms are represented by the intercept and regression coefficients, β0, βi, βii, and βij, respectively.
The RSM was used to identify the largest peak area and evaluate the impact of a significant independent variable on the response. To visually depict the model equation, the creation of three-dimensional surface response graphs occurred.

2.5. Bioactive Compounds Determination

2.5.1. Total Polyphenol Content (TPC)

A previously established methodology [27] was applied to determine TPC. Briefly, 200 μL of the sample was mixed with 200 μL of Folin–Ciocalteu reagent, and after 2 min, 1600 μL of 5% w/v aqueous sodium carbonate solution was added in a 2 mL Eppendorf tube. The mixture was incubated at 40 °C for 20 min, and the absorbance was recorded at 740 nm in a Shimadzu UV-1700 PharmaSpec Spectrophotometer (Kyoto, Japan). The total polyphenol concentration (CTP) was calculated from a gallic acid calibration curve from 10–100 mg gallic acid/L. The total polyphenol yield (YTP) was determined as mg gallic acid equivalents (GAE) per g of dry weight (dw), using the following Equation (2):
TPC   ( mg   GAE / g   dw ) = C T P   ×   V w
where the volume of the extraction medium is indicated with V (expressed in L) and the dry weight of the sample as w (expressed in g).

2.5.2. HPLC Quantification of Polyphenolic Compounds

High-Performance Liquid Chromatography (HPLC) was used to detect and quantify individual polyphenols from the sample extracts, as established in our previous research [27]. A Shimadzu CBM-20A liquid chromatograph and a Shimadzu SPD-M20A diode array detector (DAD) (both purchased from Shimadzu Europa GmbH, Duisburg, Germany) were employed for the analysis of lemon verbena extracts. A volume of 20 μL of properly diluted extracts was injected into the system. The compounds were separated into a Phenomenex Luna C18(2) column from Phenomenex Inc. in Torrance, CA, USA, and kept at 40 °C (100 Å, 5 μm, 4.6 mm × 250 mm). The mobile phase included 0.5% aqueous formic acid (A) and 0.5% formic acid in acetonitrile/water (6:4) (B). The gradient program was as follows: from 0 to 40%, B for 40 min; then to 50%, B for 10 min; and to 70%, B for another 10 min and then constant for 10 min. The total chromatographic analysis lasted 70 min. The flow rate of the mobile phase was set at 1 mL/min. Scanning was conducted in the wavelength range of 190–800 nm. The compounds were identified by comparing the absorbance spectrum and retention time to those of pure standards and then quantified through calibration curves (0–50 μg/mL). The results were given in mg/g dw.

2.5.3. Ascorbic Acid (AA) Content

Ascorbic acid (AA) concentration was evaluated using a previously established method [28]. A quantity of 100 μL sample extract along with 500 μL of 10% (v/v) Folin–Ciocalteu reagent was mixed with 900 μL of 10% (w/v) trichloroacetic acid in an Eppendorf tube. The absorbance was measured at 760 nm after 10 min. Ascorbic acid was used as the calibration standard.

2.5.4. Total Carotenoids (TC) Determination

A slightly modified method introduced by Ayour et al. [29] was employed to determine the total carotenoid (TC) content of the extracts. Briefly, a ten-fold dilution was used in the samples during their preparation, and therefore, the absorbance was recorded at 450 nm. The TC content was expressed as mg of β-carotene equivalents per gram of dried weight, using a calibration curve based on β-carotene.

2.6. Antioxidant Capacity of the Extracts

2.6.1. Ferric-Reducing Antioxidant Power (FRAP) Assay

An established technique by Shehata et al. [30] was used for the evaluation of FRAP. In a 2 mL Eppendorf tube, 100 μL of properly diluted sample was mixed with 100 μL of FeCl3 solution (4 mM in 0.05 M HCl). The mixture was incubated at 37 °C for 30 min, with 1800 μL of TPTZ solution (1 mM in 0.05 M HCl) being immediately added right after, and the absorbance was measured after 5 min at 620 nm. The ferric-reducing power (PR) was calculated using an ascorbic acid calibration curve (CAA) in 0.05 M HCl with ranging values (0.05–0.5 mM). The PR was calculated as mmol of ascorbic acid equivalents (AAE) per kilogram of fw, using Equation (3):
P R   ( μ mol   AAE / g   f w ) = C A A   ×   V w
where V is represented (in L) as the entire volume of the extraction medium, and w (in g) represents the dried weight of the material.

2.6.2. DPPH Antiradical Activity Assay

The extracted polyphenols from the dried material were evaluated for their antiradical activity (AAR) using a slightly modified DPPH method, as previously established by Shehata et al. [30]. In brief, 50 μL of the sample was mixed with a quantity of 1950 μL of a 100 μM DPPH solution in methanol, with the solution being kept at room temperature for 30 min in the dark right after. Following that, the absorbance was measured at 515 nm. Moreover, a blank sample was used instead of the sample, including DPPH solution and methanol, with the absorbance immediately being measured. To calculate the percentage of scavenging, Equation (4) was employed:
%   Scavenging = A control A sample A control × 100
An ascorbic acid calibration curve in Equation (5) was used to evaluate antiradical activity (AAR), which was expressed as μmol AAE per gram of dw:
A AR   ( μ mol   AAE / g   f w ) = C A A   ×   V w

2.6.3. Hydrogen Peroxide (H2O2) Scavenging Assay

A previously mentioned method [28] was applied for the H2O2 scavenging assay. A quantity of 600 μL of a H2O2 solution (40 mM, made in phosphate buffer, pH 7.4) was mixed with 400 μL of the extract in an Eppendorf tube. The absorbance was then measured after 10 min at 230 nm. Equation (6) describes the scavenging capacity of the H2O2:
%   Scavenging   of   H 2 O 2 = A o ( A A A ) A o   ×   100
where the absorbances of the blank solution, the extract solution in the absence of hydrogen peroxide, and the sample are denoted by Ao, Ac, and A, respectively.
The concentration of ascorbic acid ranged in the calibration curve (CAA, 50–500 μmol/L in 0.05 M HCl), and the following Equation (7) was used to determine the anti-hydrogen peroxide activity (AAHP) as μmol AAE per g of dw:
A AHP   ( μ mol   AAE / g   f w ) = C A A   ×   V w
where V denotes the volume of the extraction medium (in L), and w is the dry weight of the sample.

2.7. Color Determination of the Extracts

The CIELAB color of the lemon verbena extracts was measured by using a previously established methodology [31] using a colorimeter (Lovibond CAM-System 500, The Tintometer Ltd., Amesbury, UK), where the CIELAB parameters (L*, a*, and b*) measured the aqueous extracts. Three parameters were fundamental to measure the color of the extracts: the L* value denotes the lightness of a color, ranging from 0 (representing black) to 100 (representing white); the a* value specifies the degree of redness (negative values) or greenness (positive values) in a color; similarly, the b* value measures the extent of yellowness (negative values) or blueness (positive values) in a color. The measure of color intensity is denoted by Cab* or C* (chroma, saturation). The hue angle (hab or H) and psychological coordinate chroma were measured using the following equations:
C a b * = ( a * ) 2 + ( b * ) 2
h a b o = arctan b * a *

2.8. Statistical Analysis

The statistical analysis related to response surface methodology and distribution analysis, which were applicable through JMP® Pro 16.2 software (SAS, Cary, NC, USA). The quantitative analysis was performed in triplicate, and the extraction procedures were repeated at least twice for each batch of lemon verbena extract. The results were represented in the form of means and standard deviations. Principal component analysis (PCA), multivariate correlation analysis (MCA), and partial least squares (PLS) analysis were conducted through JMP® Pro 16.2 software (SAS, Cary, NC, USA).

3. Results and Discussion

To maximize effectiveness and guarantee a more environmentally friendly extraction process, extraction parameter optimization was essential [32,33]. In this context, the composition of the solvent is crucial, since the solvent characteristics have a significant effect on compound extraction [34]. As an example, moderately polar molecules like polyphenols are difficult to extract with highly polar solvents like water. Consequently, organic solvents are commonly employed to enhance the extraction procedure. Specifically, ethanol could be combined with water to produce an extraction solvent suitable for use in the food industry [35]. The main purpose of this study was to enhance the extraction of polyphenols from lemon verbena. RSM was used to investigate the aforementioned conditions and extraction technique combinations to determine the most efficient model for producing extracts rich in bioactive compounds (i.e., polyphenols, ascorbic acid) as well as extracts with high antioxidant activity. For the most effective extraction of polyphenols, a moderate concentration of ethanol in the extraction solvent was required, according to the findings of the present study (vide infra). It has also been demonstrated that the efficiency could be increased by combining the two green extraction methods (PEF and US) with conventional extraction (stirring). The desired compounds can be more easily extracted using these techniques, which induce cellular membrane disruption [36]. Prior research has also proved that utilizing PEF and US with the extraction procedure could increase its efficacy [37].

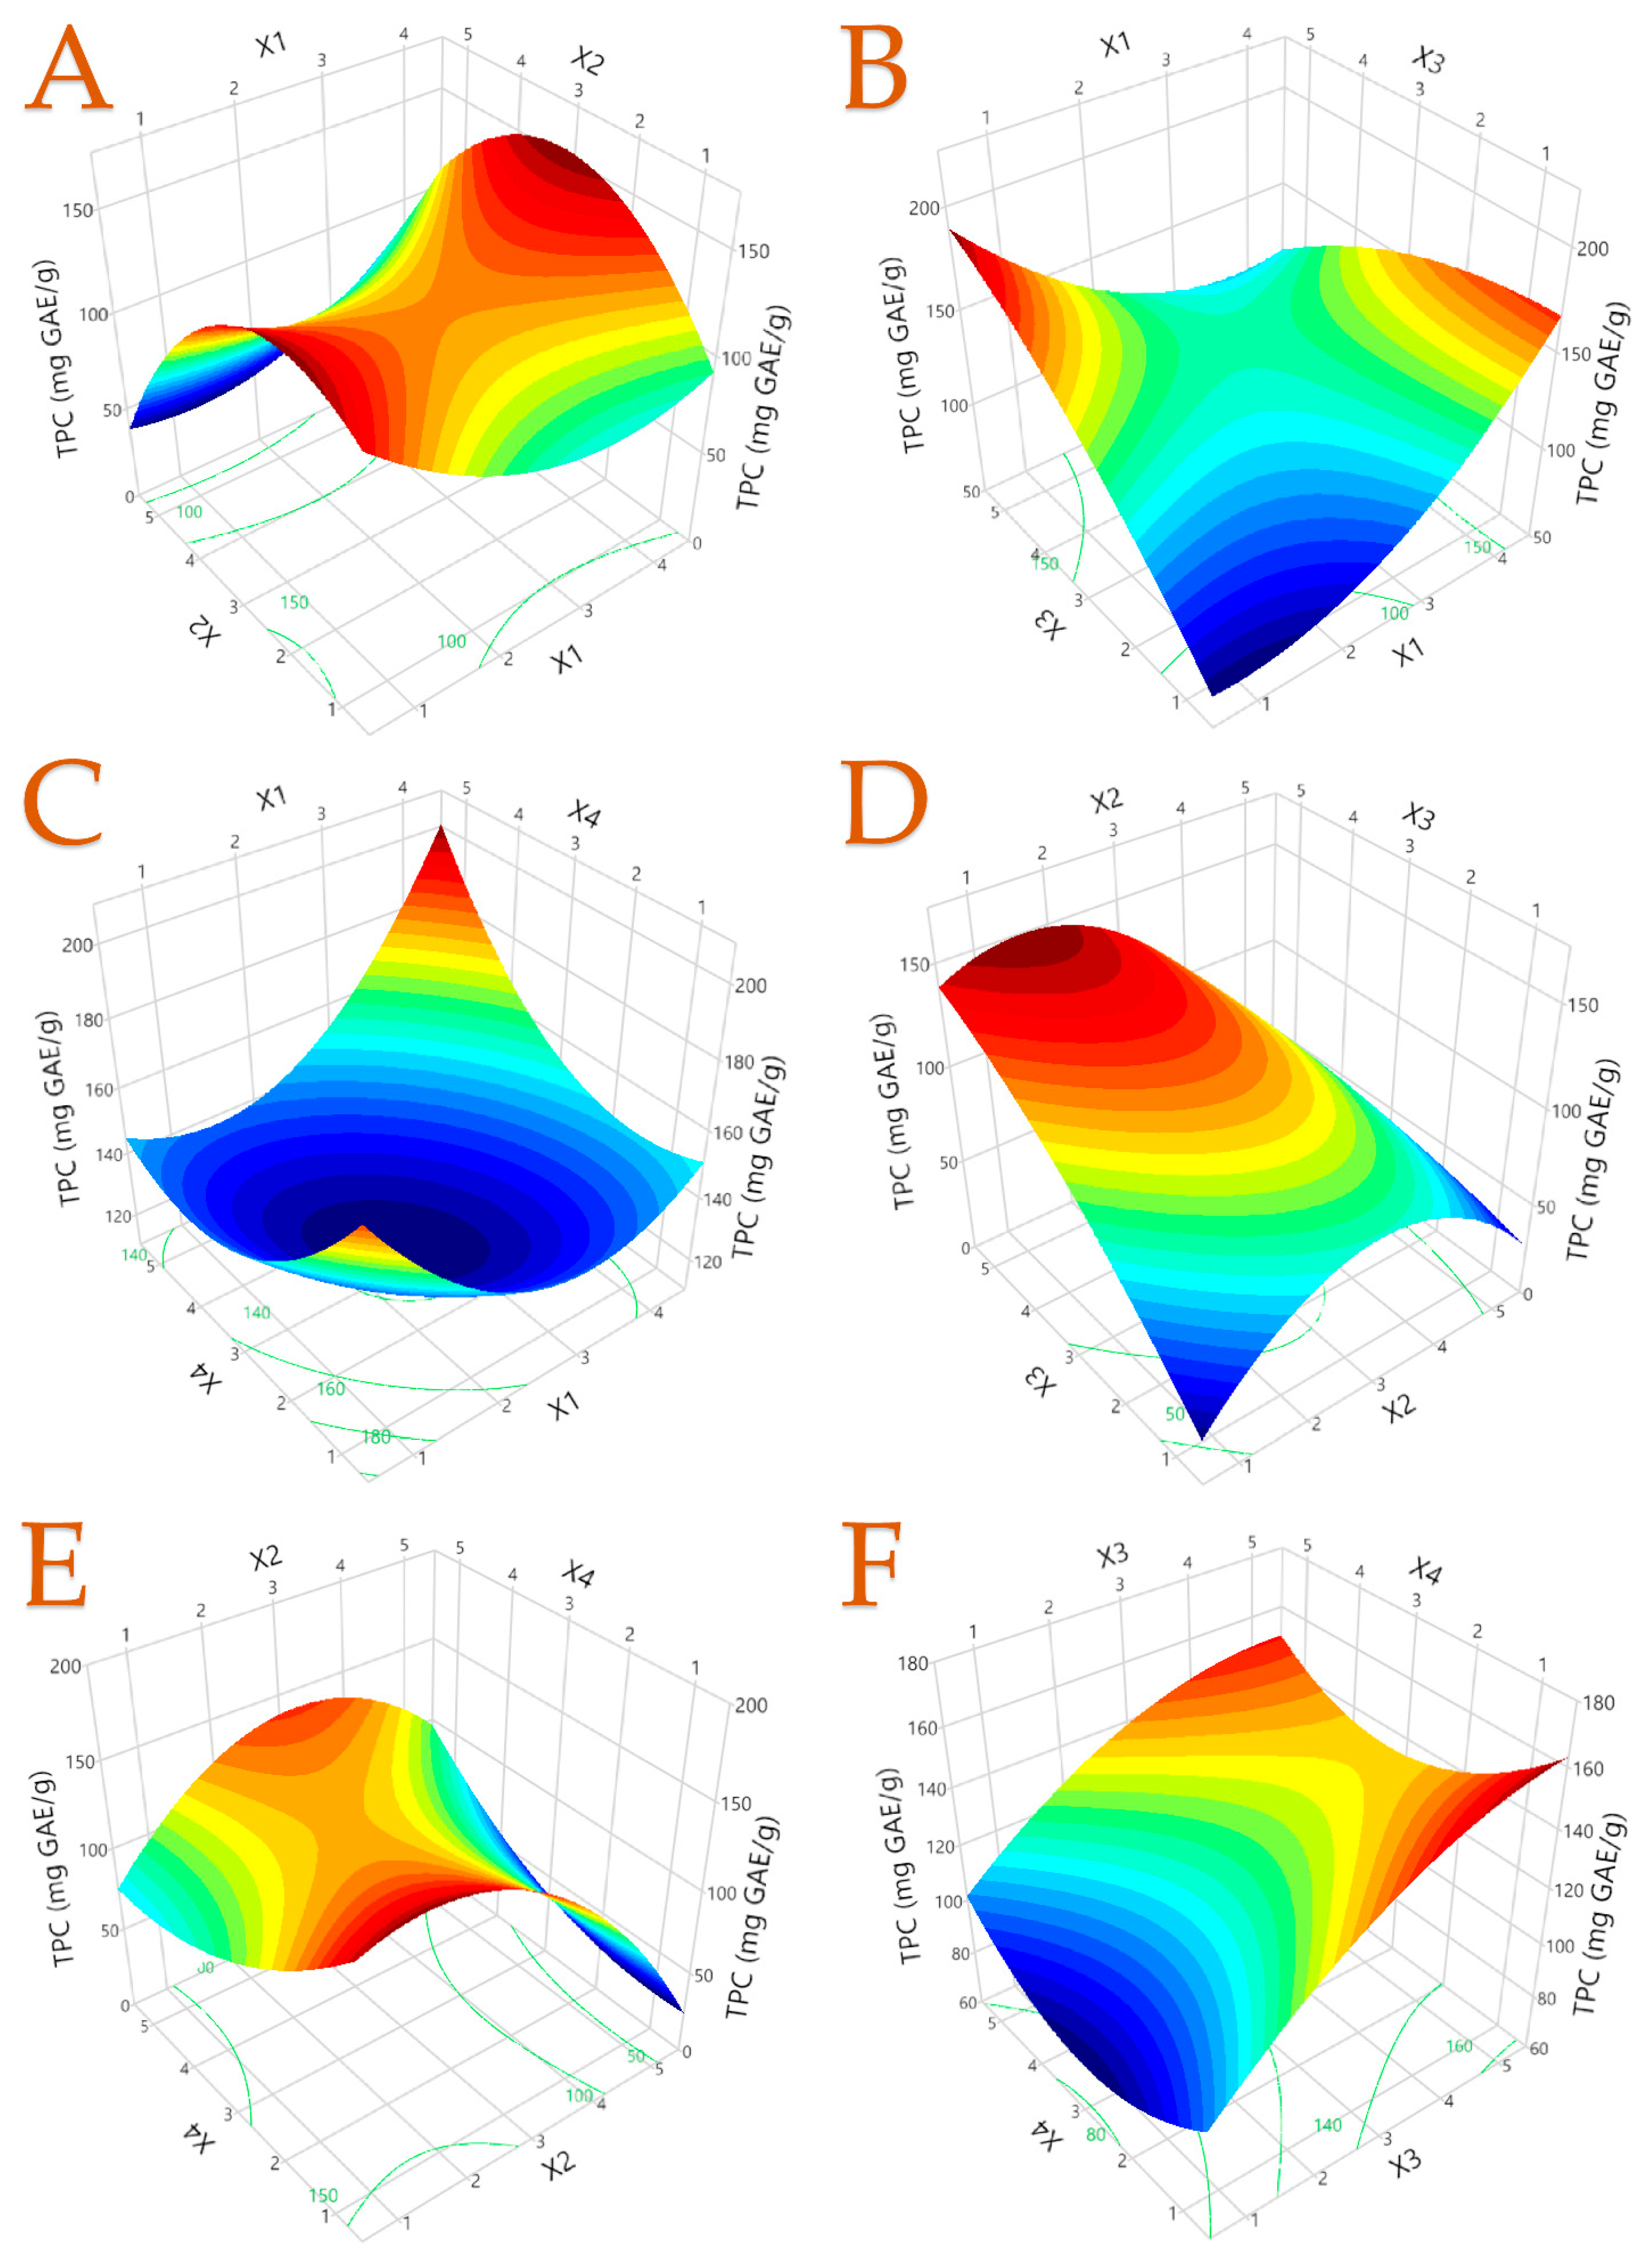
3.1. Total Polyphenol Content and Antioxidant Activity of the Extracts

The results obtained from the FRAP, DPPH, and H2O2 assays, in addition to the measured and predicted responses for TPC, are provided in Table 2. It appeared that the outcomes for TPC varied considerably between the samples. Specifically, TPC varied between 40.66 and 163.71 mg GAE/g, with design point samples 10 and 12 representing the lowest and highest values, respectively, with the samples exhibiting a four-fold difference in the TPC. In a study conducted by Rashid et al. [38], lemon verbena extracts were analyzed using different solvents, recording comparable results. TPC recorded ~120 mg GAE/g when ethanol was the extraction solvent, whereas half the value was measured when water was the extraction solvent. In our case, water recorded ~90–113 mg GAE/g, and pure ethanol yielded ~40–100 mg GAE/g of polyphenols.
Regarding the antioxidant assays, the data revealed considerable variance as well. For example, the range for the FRAP assay was 576.19–1326.45 μmol AAE/g, the range for the DPPH assay was 438.94–958.98 μmol AAE/g, which corresponds to a two-fold increase, and the range for the H2O2 assay was 350.44–1579.52 μmol AAE/g, which represents a nearly five-fold increase. A previous study suggested that the antioxidant capacity of an extract is influenced by both the quantity of polyphenols present and the characteristics of the antioxidant compounds [39]. The implementation of ethanol led to hydroethanolic extracts that were not only potent scavengers against the DPPH radical but also in the other two antioxidant capacity assays. The reason for this could lie in the moderate-polarity polyphenols yielded compared to pure water [40]. As demonstrated on TPC, it was found that these extracts contained a higher concentration of polyphenols.
Table 3 displays the concentrations of the main polyphenols that have been identified using HPLC-DAD, whereas a representative chromatogram is illustrated in Figure 1. Phenolic acids (vanillic acid, p-coumaric acid, and ferulic acid) cumulated to form a combined 0.5–8.94 mg/g, whereas flavonoids (rutin, quercetin 3-D-galactoside, verbascoside, narirutin, and kaempferol 3-glucoside) had a total sum of 22.77–163.38 mg/g. The beneficial properties of these polyphenols should be highlighted. Firstly, p-coumaric was found to reduce basal oxidative stress more efficiently than vitamin E in animal models. It also possesses anti-inflammatory, antimicrobial, and chemopreventive properties [41,42]. In addition, the hydrophilic biomolecule verbascoside, which was found to be the major polyphenol, exhibits antitumor, antidepressant, neuroprotective, anti-inflammatory, and antioxidant properties [43]. Naturally occurring flavanone narirutin possesses several health-promoting properties, such as antioxidant, anti-inflammatory, and anticancer activities. As previously stated, the combination of techniques observed in sample 12 appeared to be advantageous in terms of extracting a substantial amount of verbascoside (147.21 mg/g), marking ~91% of the quantified polyphenols from the specific sample. However, variance in the concentration of polyphenolic compounds extracted using different techniques was noticeable. Therefore, it is evident that an extraction model incorporating the aforementioned parameters was imperative for the optimal extraction of polyphenols.

3.2. Other Bioactive Compounds, Biological and Physicochemical Determination of Extracts

There is a robust relationship between color characteristics and carotenoids, which are pigments present in many plant species. Since they affect the product appearance, carotenoids quantification is an important quality indicator [44,45]. Table 4 shows the results of the analysis of the parameters affecting the color of the samples (L*, C*, H, and carotenoids) as well as their ascorbic acid content. TC concentration ranged from 287.89 to 602.56 μg CtE/g. Since carotenoids are known lipophilic compounds, the highest concentrations of total carotenoids appear to be in samples containing ethanol which lowers the polarity of the extraction solvent, such as design points 4, 6, 12, and 14. Regarding color analysis, the L* coordinate had little variance (32.6–47.6) compared to the C* coordinate (4–29.2). An even greater variance was observed for H (14.5–124.5) which marked an approximately nine-fold difference between samples 11 and 15. It could be concluded that the implementation of ethanol as a solvent resulted in a brighter and more vivid color, as observed in design points 5 and 10, compared to water which led to darker and blurry extracts (i.e., design points 1 and 11). A small variance was observed in AA concentration, as a two-fold difference was recorded between design points 10 and 12 (4.26–9.47 mg/g).
Finally, in Table 5, the statistical parameters, quadratic (second-order) polynomial equations (models), and coefficients (coefficients > 0.95) obtained for each model are presented, suggesting a good fit for the developed models. Plots of the actual response versus the predicted response for each examined parameter as well as the desirability functions are given in Figures S1–S4. More statistic details are given in the Supplementary Material. Three-dimensional response plots for TPC are given in Figure 2. In Figure 2A, it can be concluded that TPC is highly affected by X1 (US + ST) and X2 (25% v/v ethanol as solvent), whereas in Figure 2B, it seems that a high extraction time (i.e., X3 variable was optimum for >120 min of extraction) is required for the optimum polyphenol yield. In Figure 2E, a positive correlation is revealed with polyphenol recovery and variable X4, which demands a high extraction temperature (>50 °C). Three-dimensional response plots for the rest of the responses are found in Figures S5–S7, following a similar rationale.

3.3. Optimal Extraction Conditions

To increase efficiency, the extraction parameters must be optimized. Diverse bioactive compound structures may present complications for the extraction process due to solubility and polarity fluctuations [46]. Furthermore, the extraction method and various processing parameters have a major impact on the yield and antioxidant capacity of the extract. Therefore, it becomes critical to optimize this process [47]. In recent years, significant progress has been made toward developing extraction techniques that minimize the use of hazardous and toxic solvents, safeguard human health, and consume little energy. The utilization of an eco-friendly solvent is crucial for the effective implementation of this technique [48]. Water, for instance, is the most affordable and environmentally friendly solvent. It is a highly effective solvent for the extraction of polar molecules. However, to extract less polar compounds, organic solvents like ethanol or methanol could be implanted to solubilize bioactive components such as polyphenols in a more effective way than water [49]. To that end, binary solvents may yield greater efficiency, and more specifically, ethanol and water could be a unique combination due to their food-grade capability [50]. To minimize energy consumption during the extraction process, it is crucial to further optimize the extraction duration and temperature. Since earlier research has proven the efficacy of both short [51] and long [52] extraction durations, a comprehensive evaluation is required to identify the effect of time on extraction. High temperatures are also known to improve extraction processes by making solutes more soluble and diffusion coefficients stronger. Nevertheless, since polyphenols are thermolabile compounds, it is essential to consider that they could decompose beyond a certain point [53]. Typically, the optimal temperature range for traditional extraction methods to achieve the highest polyphenol recovery is 50–80 °C [54,55]. It is worth mentioning that the matrix composition is also one of key factors that inevitably affect the efficiency of the extraction process. The diverse structures of bioactive components, along with their varying polarities and solubilities, can make the extraction process more complicated.
To this end, the desirability function was applied to determine the highest expected levels of antioxidant activity (as measured by FRAP, DPPH, and H2O2) and TPC. The maximum values of the assays were obtained by employing various extraction conditions. To effectively measure TPC from lemon verbena at a predicted value of 168.85 mg GAE/g dw, a 150 min extraction with 25% v/v was demanded at 80 °C using a conventional stirring technique. The same conditions were also required for the maximum predicted response of 1342 μmol AAE/g for the FRAP assay. Table 6 provides additional details regarding the optimal conditions for extraction.

3.4. Principal Component Analysis (PCA) and Multivariate Correlation Analysis (MCA)

Το obtain further details from the variables and perform a more comprehensive data analysis, PCA was utilized. The objective of this analysis was to determine whether TPC and antioxidant compounds (specifically, ascorbic acid and individual polyphenols), antioxidant assays (including FRAP, DPPH, and H2O2), color coordinates, and carotenoids exhibited any correlation between them. In order to select the two principal components depicted in Figure 3, eigenvalues >1 were considered. These components accounted for a combined 61.6% of the variance. The results revealed a positive or negative correlation between the parameters. For example, a much-anticipated result was the positive correlation between antioxidant assays with TPC and verbascoside. As a result, it can be noticed that they are discriminated and properly grouped. On the other hand, discrimination was also observed between color coordinates, as they were influenced by the same parameters, such as solvent concentration.
Additionally, an MCA was conducted to provide additional insight into the correlation between the variables under investigation. One significant benefit of this analysis in comparison to the previous one is its ability to quantify the degree of positive or negative correlation between the variables. The color scale utilized in this particular context represents correlation values between −1 and 1, as explained in the corresponding caption. The outcomes of this analysis are illustrated in Figure 4. AA was positively correlated with the majority of individual polyphenols (>0.6), but it could be observed that it was negatively correlated with color coordinates. Specifically, this correlation was found strong (>0.6), which would be caused by the different extraction solvent. It was previously revealed that the incorporation of ethanol as an extraction solvent led to brighter and more colorful extracts. However, it was additionally shown that the higher the presence of ethanol, the more decreased the concentration of AA.

3.5. Partial Least Squares (PLS) Analysis

A PLS model was used to assess the significance of the extraction parameters (X1, X2, X3, and X4). Figure 5 depicts the application of the PLS model to create a correlation loading plot, which visually displays the impact of extraction conditions of lemon verbena. A higher projection factor, especially over 0.8, indicates a bigger contribution from this variable. It can be concluded that in the X1 variable, solely stirring was not enough to yield maximum polyphenols; however, this was possible through the PEF-assisted, US-assisted, or combined PEF- and US-assisted extractions. In the X2 parameter, it was observed that a moderate-polarity solvent (i.e., 50% v/v) was found to be optimum in all assays. Extraction duration (i.e., parameter X3) did not have a significant impact, though it was noticed that 60 min of extraction was the most beneficial. Finally, in all cases, it was observed that a high temperature (X4 parameter at 80 °C) was required for the most favorable outcomes.
When the values from the experimental analysis are compared with those from the PLS model, a correlation of 0.9991 can be observed, yet there are no deviations between the two sets of data (p = 0.0005). Table 7 represents the PLS-predicted values with the corresponding experimental values of TPC and antioxidant assays, in which the optimum technique was found to be PEF + US + ST, requiring extraction with 50% v/v of ethanol for 60 min at 80 °C. Table 8 shows the values of several individual antioxidant compounds and color properties in these optimum extraction conditions.
Following optimization, TPC showed a slight increase from the initial RSM results, leading to 175.03 mg GAE/g, whereas major polyphenols, verbascoside, narirutin, and p-coumaric acid were measured at 132.61, 5.27, and 1.49 mg/g, respectively. The total sum of the measured polyphenols was 148.42 mg/g, a value not far from the TPC. In a study by Polumackanycz et al. [56], the chemical composition of lemon verbena extracts was evaluated with infusion, decoction, and hydromethanolic extraction. Rutin concentration ranged from 3.32 to 7.79 mg/g dw, leading to comparable results with our study. However, p-coumaric acid was found significantly lower than our optimal sample by up to ten-fold. Regarding other bioactive compounds, TC was measured at 499.61 μg CtE/g, whereas AA was quantified at 8.36 mg/g. Guimarães et al. [57] explored the antioxidant properties of four medicinal plants, including lemon verbena. They used decoction and infusion extraction techniques, in which TPC was measured at 221.90 and 445.04 mg GAE/g, respectively. The ascorbic acid concentration was comparable to our extracts as it was quantified at 6.80 and 8.05 mg/g, respectively. Antioxidant assays were also further increased from their corresponding RSM values from 5 to 16%, verifying the importance of the PLS model. Regarding the DPPH assay, our optimum sample reached 1108.91 μmol AAE/g, indicating a vast antioxidant capacity. For comparison, Portmann et al. [58] investigated the bioactive compounds and antioxidant capacity from two species of aqueous lemon verbena extracts through infusion and decoction techniques. They found that DPPH ranged from 57 to 232 μmol AAE/g dw, indicating a significant difference from our sample.

4. Conclusions

Through the extensive investigation and optimization of different conditions, this study aimed to determine the optimal extraction method for bioactive components recovered from lemon verbena. The experiments were conducted using water and ethanol mixtures and eco-friendly and food-grade solvents with adjustable polarity. While the PLS model revealed which parameters were most important for extraction, RSM allowed for the fine-tuning of those parameters. It was revealed that the implementation of PEF and US in conventional extraction was of high importance. However, it should be noted that further green techniques or extraction conditions could have been investigated for the effective recovery of bioactive compounds. In addition, by using a moderate-polarity mixture (50% v/v ethanol), increasing the extraction temperature (80 °C) within a moderate extraction duration (60 min) improved the effectiveness of the extraction of bioactive compounds. The application of MCA and PCA revealed a strong negative correlation between AA and color coordinates, which would be primarily due to solvent polarity. The considerably high TPC which was measured (175.03 mg GAE/g dw), along with other compounds such as AA and TC render lemon verbena leave extracts capable of providing pharmaceutical and food industries with plenty of health-promoting bioactive compounds.

Supplementary Materials

The following supporting information can be downloaded at: https://www.mdpi.com/article/10.3390/oxygen4010001/s1, Figures S1–S4 comprise plots that illustrate the comparison between the actual response and the predicted response for each parameter under examination, accompanied by the desirability functions. Figures S5–S7 present three-dimensional response plots for the remaining responses.

Author Contributions

Conceptualization, V.A., T.C. and S.I.L.; methodology, V.A., T.C. and S.I.L.; software, V.A. and T.C.; validation, V.A., T.C., D.K., I.M. and E.B.; formal analysis, V.A. and T.C.; investigation, V.A. and T.C.; resources, S.I.L.; data curation, V.A., T.C. and S.I.L.; writing—original draft preparation, V.A. and D.K.; writing—review and editing, V.A., T.C., D.K., I.M., E.B. and S.I.L.; visualization, V.A. and T.C.; supervision, S.I.L.; project administration, S.I.L. All authors have read and agreed to the published version of the manuscript.

Funding

This research received no external funding.

Institutional Review Board Statement

Not applicable.

Informed Consent Statement

Not applicable.

Data Availability Statement

All related data and methods are presented in this paper. Additional inquiries should be addressed to the corresponding author.

Conflicts of Interest

The authors declare no conflict of interest.

References

  1. Kumar, S.; Saini, R.; Suthar, P.; Kumar, V.; Sharma, R. Plant Secondary Metabolites: Their Food and Therapeutic Importance. In Plant Secondary Metabolites: Physico-Chemical Properties and Therapeutic Applications; Sharma, A.K., Sharma, A., Eds.; Springer Nature: Singapore, 2022; pp. 371–413. ISBN 9789811647796. [Google Scholar]
  2. Ali, A.; Cottrell, J.J.; Dunshea, F.R. Characterization, Antioxidant Potential, and Pharmacokinetics Properties of Phenolic Compounds from Native Australian Herbs and Fruits. Plants 2023, 12, 993. [Google Scholar] [CrossRef] [PubMed]
  3. Guimarães, R.; Sousa, M.J.; Ferreira, I.C.F.R. Contribution of Essential Oils and Phenolics to the Antioxidant Properties of Aromatic Plants. Ind. Crops Prod. 2010, 32, 152–156. [Google Scholar] [CrossRef]
  4. Liu, W.; Yin, D.; Li, N.; Hou, X.; Wang, D.; Li, D.; Liu, J. Influence of Environmental Factors on the Active Substance Production and Antioxidant Activity in Potentilla Fruticosa L. and Its Quality Assessment. Sci. Rep. 2016, 6, 28591. [Google Scholar] [CrossRef] [PubMed]
  5. Kumar, S.; Yadav, A.; Yadav, M.; Yadav, J.P. Effect of Climate Change on Phytochemical Diversity, Total Phenolic Content and in Vitro Antioxidant Activity of Aloe Vera (L.) Burm.f. BMC Res. Notes 2017, 10, 60. [Google Scholar] [CrossRef]
  6. Li, Y.; Kong, D.; Fu, Y.; Sussman, M.R.; Wu, H. The Effect of Developmental and Environmental Factors on Secondary Metabolites in Medicinal Plants. Plant Physiol. Biochem. 2020, 148, 80–89. [Google Scholar] [CrossRef] [PubMed]
  7. Giovanoudis, I.; Athanasiadis, V.; Chatzimitakos, T.; Kalompatsios, D.; Bozinou, E.; Gortzi, O.; Nanos, G.D.; Lalas, S.I. Isolation of Polyphenols from Two Waste Streams of Clingstone Peach Canneries Utilizing the Cloud Point Extraction Method. Biomass 2023, 3, 291–305. [Google Scholar] [CrossRef]
  8. Belgacem, I.; Li Destri Nicosia, M.G.; Pangallo, S.; Abdelfattah, A.; Benuzzi, M.; Agosteo, G.E.; Schena, L. Pomegranate Peel Extracts as Safe Natural Treatments to Control Plant Diseases and Increase the Shelf-Life and Safety of Fresh Fruits and Vegetables. Plants 2021, 10, 453. [Google Scholar] [CrossRef] [PubMed]
  9. Rahman, M.M.; Rahaman, M.S.; Islam, M.R.; Rahman, F.; Mithi, F.M.; Alqahtani, T.; Almikhlafi, M.A.; Alghamdi, S.Q.; Alruwaili, A.S.; Hossain, M.S.; et al. Role of Phenolic Compounds in Human Disease: Current Knowledge and Future Prospects. Molecules 2021, 27, 233. [Google Scholar] [CrossRef]
  10. Colizzi, C. The Protective Effects of Polyphenols on Alzheimer’s Disease: A Systematic Review. Alzheimers Dement. Transl. Res. Clin. Interv. 2018, 5, 184–196. [Google Scholar] [CrossRef]
  11. Ali, A.; Cottrell, J.J.; Dunshea, F.R. Identification and Characterization of Anthocyanins and Non-Anthocyanin Phenolics from Australian Native Fruits and Their Antioxidant, Antidiabetic, and Anti-Alzheimer Potential. Food Res. Int. 2022, 162, 111951. [Google Scholar] [CrossRef]
  12. Shahidi, F.; Ambigaipalan, P. Phenolics and Polyphenolics in Foods, Beverages and Spices: Antioxidant Activity and Health Effects—A Review. J. Funct. Foods 2015, 18, 820–897. [Google Scholar] [CrossRef]
  13. Daglia, M. Polyphenols as Antimicrobial Agents. Curr. Opin. Biotechnol. 2012, 23, 174–181. [Google Scholar] [CrossRef] [PubMed]
  14. Aguiar Campolina, G.; das Graças Cardoso, M.; Rodrigues-Silva-Caetano, A.; Lee Nelson, D.; Mendes Ramos, E. Essential Oil and Plant Extracts as Preservatives and Natural Antioxidants Applied to Meat and Meat Products: A Review. Food Technol. Biotechnol. 2023, 61, 212–225. [Google Scholar] [CrossRef]
  15. Amer, S.A.; Rizk, A.E. Production and Evaluation of Novel Functional Extruded Corn Snacks Fortified with Ginger, Bay Leaves and Turmeric Powder. Food Prod. Process. Nutr. 2022, 4, 4. [Google Scholar] [CrossRef]
  16. Polumackanycz, M.; Petropoulos, S.A.; Añibarro-Ortega, M.; Pinela, J.; Barros, L.; Plenis, A.; Viapiana, A. Chemical Composition and Antioxidant Properties of Common and Lemon Verbena. Antioxidants 2022, 11, 2247. [Google Scholar] [CrossRef]
  17. Miara, M.D.; Bendif, H.; Rebbas, K.; Rabah, B.; Hammou, M.A.; Maggi, F. Medicinal Plants and Their Traditional Uses in the Highland Region of Bordj Bou Arreridj (Northeast Algeria). J. Herb. Med. 2019, 16, 100262. [Google Scholar] [CrossRef]
  18. Gil, A.; Van Baren, C.M.; Di Leo Lira, P.M.; Bandoni, A.L. Identification of the Genotype from the Content and Composition of the Essential Oil of Lemon Verbena (Aloysia Citriodora Palau). J. Agric. Food Chem. 2007, 55, 8664–8669. [Google Scholar] [CrossRef]
  19. Tammar, S.; Salem, N.; Aidi Wannes, W.; Limam, H.; Bourgou, S.; Fares, N.; Dakhlaoui, S.; Hammami, M.; Khammassi, S.; Re, G.D.; et al. Chemometric Profiling and Bioactivity of Verbena (Aloysia Citrodora) Methanolic Extract from Four Localities in Tunisia. Foods 2021, 10, 2912. [Google Scholar] [CrossRef]
  20. Hosseini, M.S.; Samsampour, D.; Zahedi, S.M.; Zamanian, K.; Rahman, M.M.; Mostofa, M.G.; Tran, L.-S.P. Melatonin Alleviates Drought Impact on Growth and Essential Oil Yield of Lemon Verbena by Enhancing Antioxidant Responses, Mineral Balance, and Abscisic Acid Content. Physiol. Plant. 2021, 172, 1363–1375. [Google Scholar] [CrossRef]
  21. Bahramsoltani, R.; Rostamiasrabadi, P.; Shahpiri, Z.; Marques, A.M.; Rahimi, R.; Farzaei, M.H. Aloysia Citrodora Paláu (Lemon Verbena): A Review of Phytochemistry and Pharmacology. J. Ethnopharmacol. 2018, 222, 34–51. [Google Scholar] [CrossRef]
  22. Peixoto, J.A.B.; Álvarez-Rivera, G.; Costa, A.S.G.; Machado, S.; Cifuentes, A.; Ibáñez, E.; Oliveira, M.B.P.P.; Alves, R.C. Contribution of Phenolics and Free Amino Acids on the Antioxidant Profile of Commercial Lemon Verbena Infusions. Antioxidants 2023, 12, 251. [Google Scholar] [CrossRef] [PubMed]
  23. Martínez-Rodríguez, A.; Martínez-Olcina, M.; Mora, J.; Navarro, P.; Caturla, N.; Jones, J. Anxiolytic Effect and Improved Sleep Quality in Individuals Taking Lippia Citriodora Extract. Nutrients 2022, 14, 218. [Google Scholar] [CrossRef]
  24. Leyva-Jiménez, F.J.; Lozano-Sánchez, J.; Fernández-Ochoa, Á.; de la Cádiz-Gurrea, M.L.; Arráez-Román, D.; Segura-Carretero, A. Optimized Extraction of Phenylpropanoids and Flavonoids from Lemon Verbena Leaves by Supercritical Fluid System Using Response Surface Methodology. Foods 2020, 9, 931. [Google Scholar] [CrossRef] [PubMed]
  25. Carpentieri, S.; Soltanipour, F.; Ferrari, G.; Pataro, G.; Donsì, F. Emerging Green Techniques for the Extraction of Antioxidants from Agri-Food By-Products as Promising Ingredients for the Food Industry. Antioxidants 2021, 10, 1417. [Google Scholar] [CrossRef]
  26. Chatzimitakos, T.; Athanasiadis, V.; Kalompatsios, D.; Kotsou, K.; Mantiniotou, M.; Bozinou, E.; Lalas, S.I. Sustainable Valorization of Sour Cherry (Prunus Cerasus) By-Products: Extraction of Antioxidant Compounds. Sustainability 2024, 16, 32. [Google Scholar] [CrossRef]
  27. Chatzimitakos, T.; Athanasiadis, V.; Makrygiannis, I.; Kalompatsios, D.; Bozinou, E.; Lalas, S.I. An Investigation into Crithmum Maritimum L. Leaves as a Source of Antioxidant Polyphenols. Compounds 2023, 3, 532–551. [Google Scholar] [CrossRef]
  28. Chatzimitakos, T.; Athanasiadis, V.; Kotsou, K.; Bozinou, E.; Lalas, S.I. Response Surface Optimization for the Enhancement of the Extraction of Bioactive Compounds from Citrus Limon Peel. Antioxidants 2023, 12, 1605. [Google Scholar] [CrossRef]
  29. Ayour, J.; Alahyane, A.; Harrak, H.; Neffa, M.; Taourirte, M.; Benichou, M. Assessment of Nutritional, Technological, and Commercial Apricot Quality Criteria of the Moroccan Cultivar “Maoui” Compared to Introduced Spanish Cultivars “Canino” and “Delpatriarca” towards Suitable Valorization. J. Food Qual. 2021, 2021, e6679128. [Google Scholar] [CrossRef]
  30. Shehata, E.; Grigorakis, S.; Loupassaki, S.; Makris, D.P. Extraction Optimisation Using Water/Glycerol for the Efficient Recovery of Polyphenolic Antioxidants from Two Artemisia Species. Sep. Purif. Technol. 2015, 149, 462–469. [Google Scholar] [CrossRef]
  31. Cesa, S.; Carradori, S.; Bellagamba, G.; Locatelli, M.; Casadei, M.A.; Masci, A.; Paolicelli, P. Evaluation of Processing Effects on Anthocyanin Content and Colour Modifications of Blueberry (Vaccinium Spp.) Extracts: Comparison between HPLC-DAD and CIELAB Analyses. Food Chem. 2017, 232, 114–123. [Google Scholar] [CrossRef]
  32. Chemat, F.; Rombaut, N.; Sicaire, A.-G.; Meullemiestre, A.; Fabiano-Tixier, A.-S.; Abert-Vian, M. Ultrasound Assisted Extraction of Food and Natural Products. Mechanisms, Techniques, Combinations, Protocols and Applications. A Review. Ultrason. Sonochem. 2017, 34, 540–560. [Google Scholar] [CrossRef]
  33. Frosi, I.; Montagna, I.; Colombo, R.; Milanese, C.; Papetti, A. Recovery of Chlorogenic Acids from Agri-Food Wastes: Updates on Green Extraction Techniques. Molecules 2021, 26, 4515. [Google Scholar] [CrossRef]
  34. Dirar, A.I.; Alsaadi, D.H.M.; Wada, M.; Mohamed, M.A.; Watanabe, T.; Devkota, H.P. Effects of Extraction Solvents on Total Phenolic and Flavonoid Contents and Biological Activities of Extracts from Sudanese Medicinal Plants. S. Afr. J. Bot. 2019, 120, 261–267. [Google Scholar] [CrossRef]
  35. Chemat, F.; Rombaut, N.; Meullemiestre, A.; Turk, M.; Perino, S.; Fabiano-Tixier, A.-S.; Abert-Vian, M. Review of Green Food Processing Techniques. Preservation, Transformation, and Extraction. Innov. Food Sci. Emerg. Technol. 2017, 41, 357–377. [Google Scholar] [CrossRef]
  36. Chatzimitakos, T.; Athanasiadis, V.; Kalompatsios, D.; Mantiniotou, M.; Bozinou, E.; Lalas, S.I. Pulsed Electric Field Applications for the Extraction of Bioactive Compounds from Food Waste and By-Products: A Critical Review. Biomass 2023, 3, 367–401. [Google Scholar] [CrossRef]
  37. Jintawiwat, R.; Punamorntarakul, N.; Hirunyasiri, R.; Jarupoom, P.; Pankasemsuk, T.; Supasin, S.; Kawee-ai, A. Testing the Efficacy of a Prototype That Combines Ultrasound and Pulsed Electric Field for Extracting Valuable Compounds from Mitragyna Speciosa Leaves. AgriEngineering 2023, 5, 1879–1892. [Google Scholar] [CrossRef]
  38. Rashid, H.M.; Mahmod, A.I.; Afifi, F.U.; Talib, W.H. Antioxidant and Antiproliferation Activities of Lemon Verbena (Aloysia Citrodora): An In Vitro and In Vivo Study. Plants 2022, 11, 785. [Google Scholar] [CrossRef]
  39. Zargoosh, Z.; Ghavam, M.; Bacchetta, G.; Tavili, A. Effects of Ecological Factors on the Antioxidant Potential and Total Phenol Content of Scrophularia Striata Boiss. Sci. Rep. 2019, 9, 16021. [Google Scholar] [CrossRef]
  40. Gil-Martín, E.; Forbes-Hernández, T.; Romero, A.; Cianciosi, D.; Giampieri, F.; Battino, M. Influence of the Extraction Method on the Recovery of Bioactive Phenolic Compounds from Food Industry By-Products. Food Chem. 2022, 378, 131918. [Google Scholar] [CrossRef]
  41. Boo, Y.C. P-Coumaric Acid as An Active Ingredient in Cosmetics: A Review Focusing on Its Antimelanogenic Effects. Antioxidants 2019, 8, 275. [Google Scholar] [CrossRef]
  42. Boz, H. P-Coumaric Acid in Cereals: Presence, Antioxidant and Antimicrobial Effects. Int. J. Food Sci. Technol. 2015, 50, 2323–2328. [Google Scholar] [CrossRef]
  43. Lei, P.; Lü, J.; Yao, T.; Zhang, P.; Chai, X.; Wang, Y.; Jiang, M. Verbascoside Exerts an Anti-Atherosclerotic Effect by Regulating Liver Glycerophospholipid Metabolism. Food Sci. Hum. Wellness 2023, 12, 2314–2323. [Google Scholar] [CrossRef]
  44. Swapnil, P.; Meena, M.; Singh, S.K.; Dhuldhaj, U.P.; Harish; Marwal, A. Vital Roles of Carotenoids in Plants and Humans to Deteriorate Stress with Its Structure, Biosynthesis, Metabolic Engineering and Functional Aspects. Curr. Plant Biol. 2021, 26, 100203. [Google Scholar] [CrossRef]
  45. Maoka, T. Carotenoids as Natural Functional Pigments. J. Nat. Med. 2020, 74, 1–16. [Google Scholar] [CrossRef]
  46. Thoo, Y.; Ng, S.Y.; Khoo, M.; Mustapha, W.; Ho, C. A Binary Solvent Extraction System for Phenolic Antioxidants and Its Application to the Estimation of Antioxidant Capacity in Andrographis Paniculata Extracts. Int. Food Res. J. 2013, 20, 1103. [Google Scholar]
  47. Awad, A.M.; Kumar, P.; Ismail-Fitry, M.R.; Jusoh, S.; Ab Aziz, M.F.; Sazili, A.Q. Green Extraction of Bioactive Compounds from Plant Biomass and Their Application in Meat as Natural Antioxidant. Antioxidants 2021, 10, 1465. [Google Scholar] [CrossRef]
  48. Sik, B.; Hanczné, E.L.; Kapcsándi, V.; Ajtony, Z. Conventional and Nonconventional Extraction Techniques for Optimal Extraction Processes of Rosmarinic Acid from Six Lamiaceae Plants as Determined by HPLC-DAD Measurement. J. Pharm. Biomed. Anal. 2020, 184, 113173. [Google Scholar] [CrossRef]
  49. Plaskova, A.; Mlcek, J. New Insights of the Application of Water or Ethanol-Water Plant Extract Rich in Active Compounds in Food. Front. Nutr. 2023, 10, 1118761. [Google Scholar] [CrossRef]
  50. Monroy, Y.M.; Rodrigues, R.A.F.; Sartoratto, A.; Cabral, F.A. Influence of Ethanol, Water, and Their Mixtures as Co-Solvents of the Supercritical Carbon Dioxide in the Extraction of Phenolics from Purple Corn Cob (Zea Mays L.). J. Supercrit. Fluids 2016, 118, 11–18. [Google Scholar] [CrossRef]
  51. Yilmaz, Y.; Toledo, R.T. Oxygen Radical Absorbance Capacities of Grape/Wine Industry Byproducts and Effect of Solvent Type on Extraction of Grape Seed Polyphenols. J. Food Compos. Anal. 2006, 19, 41–48. [Google Scholar] [CrossRef]
  52. Lapornik, B.; Prošek, M.; Golc Wondra, A. Comparison of Extracts Prepared from Plant By-Products Using Different Solvents and Extraction Time. J. Food Eng. 2005, 71, 214–222. [Google Scholar] [CrossRef]
  53. Antony, A.; Farid, M. Effect of Temperatures on Polyphenols during Extraction. Appl. Sci. 2022, 12, 2107. [Google Scholar] [CrossRef]
  54. Siddiqui, S.A.; Ali Redha, A.; Salauddin, M.; Harahap, I.A.; Rupasinghe, H.P.V. Factors Affecting the Extraction of (Poly)Phenols from Natural Resources Using Deep Eutectic Solvents Combined with Ultrasound-Assisted Extraction. Crit. Rev. Anal. Chem. 2023, 1–22. [Google Scholar] [CrossRef]
  55. Osorio-Tobón, J.F. Recent Advances and Comparisons of Conventional and Alternative Extraction Techniques of Phenolic Compounds. J. Food Sci. Technol. 2020, 57, 4299–4315. [Google Scholar] [CrossRef]
  56. Ferrante, C.; Recinella, L.; Ronci, M.; Menghini, L.; Brunetti, L.; Chiavaroli, A.; Leone, S.; Di Iorio, L.; Carradori, S.; Tirillini, B.; et al. Multiple Pharmacognostic Characterization on Hemp Commercial Cultivars: Focus on Inflorescence Water Extract Activity. Food Chem. Toxicol. 2019, 125, 452–461. [Google Scholar] [CrossRef]
  57. Guimarães, R.; Barreira, J.C.M.; Barros, L.; Carvalho, A.M.; Ferreira, I.C.F.R. Effects of Oral Dosage Form and Storage Period on the Antioxidant Properties of Four Species Used in Traditional Herbal Medicine. Phytother. Res. 2011, 25, 484–492. [Google Scholar] [CrossRef]
  58. Portmann, E.; Nigro, M.M.L.; Reides, C.G.; Llesuy, S.; Ricco, R.A.; Wagner, M.L.; Gurni, A.A.; Carballo, M.A. Aqueous Extracts of Lippia Turbinata and Aloysia Citriodora (Verbenaceae): Assessment of Antioxidant Capacity and DNA Damage. Int. J. Toxicol. 2012, 31, 192–202. [Google Scholar] [CrossRef]
Figure 1. Exemplary HPLC chromatogram at 280, 320, and 360 nm of lemon verbena extract demonstrating polyphenolic compounds that were identified. 1: Vanillic acid; 2: p-Coumaric acid; 3: Ferulic acid; 4: Rutin; 5: Quercetin 3-D-galactoside; 6: Verbascoside; 7: Narirutin; 8: Kaempferol 3-glucoside.
Oxygen 04 00001 g001
Figure 2. The optimal extraction of lemon verbena extracts is shown in 3D graphs that show the impact of the process variables considered in the response (total polyphenol content—TPC, mg GAE/g). Plot (A), covariation of X1 and X2; plot (B), covariation of X1 and X3; plot (C), covariation of X1 and X4; plot (D), covariation of X2 and X3; plot (E), covariation of X2 and X4; plot (F), covariation of X3 and X4.
Oxygen 04 00001 g002
Figure 3. Principal component analysis (PCA) for the measured variables.
Oxygen 04 00001 g003
Figure 4. Multivariate correlation analysis of measured variables.
Oxygen 04 00001 g004
Figure 5. Partial least squares (PLS) prediction profiler of each variable and desirability function with extrapolation control for the optimization of lemon verbena extracts.
Oxygen 04 00001 g005
Table 1. The actual and coded levels of the independent variables were used to optimize the process.
Independent VariablesCode UnitsCoded Variable Level
12345
TechniqueX1ST 1PEF 2 + STUS 3 + STPEF + US + ST
C (% ethanol in water, v/v)X20255075100
t (min)X3306090120150
T (°C)X42035506580
1 ST: stirring, 2 PEF: pulsed electric field, 3 US: ultrasound.
Table 2. Experimental findings for the three independent variables under investigation and the dependent variable’s responses.
Design PointIndependent VariablesResponses
TPC
(mg GAE/g)
FRAP
(μmol AAE/g)
DPPH
(μmol AAE/g)
Hydrogen Peroxide
(μmol AAE/g)
X1X2X3X4ActualPredictedActualPredictedActualPredictedActualPredicted
1313490.7993.721006.24979.75644.16614.36464.60455.58
23213104.6996.841145.261134.95818.78796.75537.46560.86
32343137.66128.441145.771158.92876.98872.691110.671079.76
42454112.12111.651102.591082.75811.47821.07814.02785.12
5354252.9556.58576.19616.29438.94467.04441.47395.83
64145113.29109.051062.391064.93797.22804.01819.28829.54
74231145.38141.771131.381114.51823.26814.261425.101398.20
81332146.63140.001103.471095.68916.73883.511445.651425.62
91441132.12132.55989.12970.74747.02741.831103.301119.77
10151440.6644.28630.85639.32477.72484.86411.12392.76
111123104.8699.95886.66881.56533.61547.39718.37717.05
121255163.71168.851326.451342.51958.98962.971579.521581.80
134324139.61155.731265.941332.61896.30948.871418.191416.07
143425150.96143.151272.401234.30937.16910.021320.311261.63
152535100.2599.85834.32843.55617.24620.13755.40828.63
16211197.1998.06864.21886.87577.51582.23350.44311.01
17222298.45114.711068.681063.70790.31817.87841.65930.57
183351126.37128.411121.961136.56770.65781.03837.94864.99
194412138.85133.651161.421138.35767.30755.601140.691158.81
20455366.7666.03712.20689.67530.45505.30459.21480.83
Table 3. Coded values of the four independent variables under investigation, and the actual concentration of polyphenolic compounds, represented in mg/g dw.
Design PointIndependent VariablesResponses
X1X2X3X4VAp-CAFARTQ3GVBNRTKG
131340.535.651.861.641.9036.036.361.84
232130.535.900.481.431.8259.223.051.72
323430.225.251.791.431.77115.783.281.79
424540.170.070.531.461.7688.673.122.89
535420.010.010.501.430.0121.770.581.86
641450.245.561.831.992.0798.210.912.59
742310.216.251.763.251.78122.680.232.10
813320.205.751.793.411.79130.981.011.81
914410.141.000.921.441.75119.801.903.48
1015140.010.070.510.011.7621.020.681.87
1111230.285.131.901.481.7660.130.881.92
1212550.275.452.131.952.17147.410.522.23
1343240.445.151.861.371.79125.210.311.81
1434250.331.950.721.441.80125.140.432.12
1525350.010.020.521.461.7758.091.311.95
1621110.235.121.811.412.3684.580.291.90
1722220.255.441.771.432.7281.250.011.90
1833510.195.511.841.451.7885.420.211.83
1944120.561.281.041.251.78128.250.052.11
2045530.050.010.520.010.0129.150.011.91
VA: Vanillic acid; p-CA: p-Coumaric acid; FA: Ferulic acid; RT: Rutin; Q3G: Quercetin 3-D-galactoside; VB: Verbascoside; NRT: Narirutin; KG: Kaempferol 3-glucoside.
Table 4. Coded values of the four independent variables under investigation, and the actual concentration of total carotenoids, ascorbic acid content, and coordinates of color analysis.
Design PointIndependent VariablesResponses
X1X2X3X4Carotenoids (μg CtE/g)Ascorbic Acid (mg/g)L*C*Hue
13134599.337.4134.94.034.6
23213379.607.3040.619.348.8
32343506.487.0135.89.743.7
42454540.315.9236.110.9124.4
53542451.574.5244.629.2100.1
64145557.959.4135.67.954.6
74231327.257.3239.517.736.4
81332316.527.3339.313.943.6
91441403.375.8541.320.5102.1
101514383.594.2647.626.5121.2
111123472.516.8532.69.914.5
121255593.259.4734.49.450.7
134324443.836.2437.712.752.5
143425602.567.6837.28.9116.9
152535473.674.9541.023.3124.5
162111287.896.4344.620.453.2
172222334.447.4543.423.340.9
183351543.606.9633.613.028.4
194412452.696.7140.916.9104.7
204553441.584.5445.123.0123.4
Table 5. Mathematical models created using RSM were used to optimize the extraction of lemon verbena. The models contained only significant terms.
ResponsesSecond-Order Polynomial Equations (Models)R2
Predicted
R2
Adjusted
p-ValueEq.
TPCY = 115.38 − 37.27X1 + 22.92X2 + 57.33X3 − 48.54X4 + 7.14X12 − 8.47X22 − 2.11X32 + 3.58X42 + 5.88X1X2 − 8.87X1X3 + 4.46X1X4 − 4.67X2X3 + 6.25X2X4 − 0.59X3X40.95580.83220.0169(10)
FRAPY = 555.9 − 3.4X1 + 347.79X2 + 127.21X3 − 106.27X4 + 9.4X12 − 77.88X22 + 7.66X32 + 10.63X42 + 16.88X1X2 − 36.84X1X3 + 16.43X1X4 − 16.72X2X3 + 19.82X2X4 − 5.13X3X40.98580.94600.0011(11)
DPPHY = 300.72 − 54.29X1 + 628.91X2 − 76.72X3 − 131.07X4 + 1.98X12 − 103.17X22 − 11.73X32 + 24.91X42 − 1.41X1X2 + 18.3X1X3 + 0.29X1X4 + 7.88X2X3 − 12.61X2X4 + 21.45X3X40.98150.92960.0022(12)
Hydrogen PeroxideY = 321.24 − 776.65X1 + 1041.24X2 + 479.02X3 − 397.71X4 + 136.8X12 − 184.79X22 − 89.51X32 + 69.27X42 + 54.16X1X2 + 0.57X1X3 − 23.9X1X4 − 15.65X2X3 − 0.58X2X4 + 33.12X3X40.99120.96650.0004(13)
Table 6. Maximum predicted responses and optimum extraction conditions for the dependent variables; coded variable levels are given in parentheses.
ResponsesOptimal Conditions
Maximum Predicted ResponseTechnique
(X1)
C (%, v/v)
(X2)
t (min)
(X3)
T (°C)
(X4)
TPC (mg GAE/g)168.85 ± 33.33ST (1)25 (2)150 (5)80 (5)
FRAP (μmol AAE/g)1342.51 ± 119.04ST (1)25 (2)150 (5)80 (5)
DPPH (μmol AAE/g)996.11 ± 83.47PEF + US + ST (4)50 (3)90 (3)65 (4)
Hydrogen Peroxide (μmol AAE/g)1581.8 ± 177.18ST (1)25 (2)150 (5)80 (5)
Table 7. Maximum desirability for all variables using the partial least squares (PLS) prediction profiler under the optimal extraction conditions (X1:4, X2:3, X3:2, X4:5).
VariablesPLS Model ValuesExperimental Values
TPC (mg GAE/g)174.83175.03 ± 11.9
FRAP (μmol AAE/g)1436.931462.17 ± 30.71
DPPH (μmol AAE/g)1048.191108.91 ± 42.14
Hydrogen Peroxide (μmol AAE/g)1610.241662.93 ± 68.18
Table 8. Different parameters and polyphenolic compounds analysis under optimal extraction conditions (X1:4, X2:3, X3:2, X4:5).
ParametersOptimal Extract
Carotenoids (μg CtE/g)499.61 ± 32.47
Ascorbic acid (mg/g)8.36 ± 0.28
L*36.67 ± 0.2
C*12.9 ± 0.6
Hue55.1 ± 2.6
Polyphenolic compounds (mg/g)
Vanillic acid0.37 ± 0.02
p-Coumaric acid5.27 ± 0.11
Ferulic acid1.88 ± 0.04
Rutin2.27 ± 0.13
Quercetin 3-D-galactoside2.23 ± 0.07
Verbascoside132.61 ± 9.81
Narirutin1.49 ± 0.03
Kaempferol 3-glucoside2.3 ± 0.12
Disclaimer/Publisher’s Note: The statements, opinions and data contained in all publications are solely those of the individual author(s) and contributor(s) and not of MDPI and/or the editor(s). MDPI and/or the editor(s) disclaim responsibility for any injury to people or property resulting from any ideas, methods, instructions or products referred to in the content.

