Review

Solid and Liquid Oxygen under Ultrahigh Magnetic Fields

by
Toshihiro Nomura
1,*,
Yasuhiro H. Matsuda
1 and
Tatsuo C. Kobayashi
2
1
The Institute for Solid State Physics, The University of Tokyo, 5-1-5 Kashiwa, Chiba 277-8581, Japan
2
Department of Physics, Okayama University, Okayama 700-8530, Japan
*
Author to whom correspondence should be addressed.
Oxygen 2022, 2(2), 152-163; https://doi.org/10.3390/oxygen2020013
Submission received: 28 April 2022 / Revised: 20 May 2022 / Accepted: 20 May 2022 / Published: 25 May 2022
(This article belongs to the Special Issue Feature Papers in Oxygen)

Abstract

:
Oxygen is a unique molecule that possesses a spin quantum number S = 1 . In the condensed phases of oxygen, the delicate balance between the antiferromagnetic interaction and van der Waals force results in the various phases with different crystal structures. By applying ultrahigh magnetic fields, the antiferromagnetic coupling between O 2 molecules breaks, and novel high-field phases can appear. We have investigated the physical properties of condensed oxygen under ultrahigh magnetic fields and have found that the stable crystal structure of solid oxygen changes around 100 T. Even in liquid oxygen, we observed a strong acoustic attenuation, which indicates the fluctuation of local molecular arrangements. These results demonstrate that magnetic fields can modulate the packing structure of oxygen through spin-lattice coupling. Our study implies the possibility of controlling oxygen-related (bio-)chemical processes by using an external magnetic field.

1. Introduction

The paramagnetic nature of oxygen was discovered by M. Faraday in 1848, before the dawn of quantum mechanics [1]. He studied the magnetism of bubbles filled with various gases and found that only oxygen is attracted by a permanent magnet (Figure 1a and demonstration video in Supplementary Material). Later on, quantum mechanics provided an explanation of its magnetism; the half-filled π electrons with polarized spins result in the triplet ground state ( 3 Σ g ) with the spin-quantum number S = 1 (Figure 1c). The magnetic susceptibility is enhanced at lower temperatures, following the Curie law, and we can clearly observe the paramagnetism of liquid oxygen (Figure 1b). When the distance between O 2 molecules becomes shorter in a solid state, the exchange interactions between O 2 molecules become relevant for the ground state. By decreasing temperature, three phases of solid oxygen, γ , β , and α phases, appear. Here, we provide an overview of the magnetic properties of these solid and liquid phases (see also reviews [2,3,4,5,6]).
At the boiling point T b = 90.2 K, gaseous oxygen condenses to a liquid state. Liquid oxygen is known as a paramagnetic liquid; however, in reality, a strong antiferromagnetic (AFM) correlation exists. The magnetic susceptibility ( χ ) of liquid oxygen is suppressed at T b by 40% and further deviates from the Curie law towards lower temperatures, indicating the developing AFM interactions [7,8]. The reduction of χ was first proposed to reflect nonmagnetic molecules O 4 [7], and later, singlet O 2 –O 2 dimers formed by dynamical collisions [9,10,11]. The formation of these nonmagnetic species accords with the optical absorption spectra. The light blue color of liquid oxygen is caused by the bimolecular absorption, which is only allowed for singlet ground states [12,13,14,15,16,17]. Liquid oxygen solidifies at the melting point T γ l = 54.4 K, where the γ phase of solid oxygen (space group, P m 3 ¯ m ) appears. The γ phase has an A15-type cubic structure with rotating O 2 molecules, which result in plastic properties. There are two rotating sites in the unit cell: the sphere sites composing the BCC lattice and the disk sites at the surfaces of the unit cell [2,18]. The rotation at the sphere sites is completely random, while O 2 molecules at the disk sites rotate like a propeller, forming a one-dimensional chain along the [100] directions. The magnetism of these sites reflects the rotating manners. The spins at the sphere sites are almost isolated from exchange interactions with other O 2 , while AFM correlation develops along the one-dimensional chain because the π orbital overlap between the disk sites is large [19,20]. Such a one-dimensional chain is proposed to also be in the liquid phase [21]. Indeed, the magnetism and structural properties (density and elasticity) of γ oxygen are closer to liquid oxygen than the α and β phases. The rotational motion of O 2 molecules freezes at the β - γ transition point T β γ = 54.4 K. The β phase has a rhombohedral crystal structure (space group, R 3 ¯ m ), where the molecular axis orders along the c direction. At T β γ , the density discontinuously increases by 4–5%, and the magnetic susceptibility decreases by 60 % [2,22]. The β - γ transition is of the first order with a latent heat larger than the γ -liquid transition [23,24]. The basal plane of this crystal structure is a triangular lattice that inhibits the AFM long-range order because of the geometrical frustration [25,26]. Long-range AFM ordering occurs at T α β = 23.9 K, where the α phase (space group, C 2 / m ) appears. The α - β transition is a spin-driven transition via spin-lattice coupling. With the monoclinic deformation, the geometrical frustration is lifted, and the AFM long-range order is realized. The AFM exchange field is estimated to be ∼ 230 T [19,22]. The order of the α - β transition is a long-lasting problem and is still controversial because of the splitting peaks in heat capacity [27,28]. The α phase of solid oxygen is the only AFM insulator among elemental solids at ambient pressure [29].
In addition to the three solid phases, four high-pressure phases ( δ , ϵ , ζ , and η ) have been discovered so far [30,31,32,33,34,35,36,37,38,39,40,41,42]. With increasing pressure, the AFM interaction is enhanced ( δ phase), and four O 2 molecules form a nonmagnetic O 8 molecular unit ( ϵ phase). Finally, solid oxygen with a metallic bond ( ζ phase) appears. The ζ phase shows a superconductivity below 0.3 K [43]. The η (and η ) phase is a high-temperature and high-pressure phase, whose properties have not been studied in detail [38,39].
In this research, instead of pressure, we have used high magnetic fields in the search for novel phases of oxygen. Because of the competing energy scale between the van der Waals and exchange interactions, spin-lattice coupling plays an important role in solid oxygen. Indeed, solid oxygen is called a “spin-controlled crystal”, where the crystal structure depends on the magnetic ground state [32]. Using non-destructive magnets, the magnetization and optical properties of solid and liquid oxygen have been investigated up to 50 T [15,16,19,22,44,45,46]. However, the exchange field in solid oxygen is even higher than this field range, and no phase transition was detected. When the AFM order is destroyed by extremely high magnetic fields, a novel phase with a new crystal structure may appear. In this paper, we review our exploration for the novel phases of solid and liquid oxygen under ultrahigh magnetic fields [47,48,49,50,51,52,53,54,55,56,57,58].

2. The O 2 -O 2 Dimer

Before discussing the magnetic-field effects on condensed oxygen, we first treat the two-body system, the O 2 -O 2 dimer. Starting from the Heisenberg Hamiltonian,
H = J S 1 · S 2 ,
the energy levels for the quintet ( S tot = S 1 + S 2 = 2 ), triplet ( S tot = 1 ), and singlet ( S tot = 0 ) are obtained as Figure 2a. Here, J is the AFM exchange constant, and S is the spin operator. The gap energies between the singlet-triplet and triplet-quintet states at zero field are D s t = J and D t q = 2 J , respectively. By including the Zeeman term g μ B S z tot H , the degeneracy of these energy states is lifted under magnetic fields. Here, μ B is the Bohr magneton, g is the g factor, S z is the magnetic quantum number, and H is the magnetic field. The level crossings occur at H = J and H = 2 J , leading to the two-step increases of magnetization as shown in Figure 2b.
Such an isolated O 2 -O 2 dimer system can be realized in metal-organic frameworks (MOFs) (Figure 3a) [59,60,61,62,63,64]. This framework (Cu-1,4-cyclohexanedicarboxylic acid, Cu-CHD) has one-dimensional nanochannels, where guest molecules can be physisorbed. When O 2 molecules are physisorbed, they behave as a low-dimensional quantum spin system with S = 1 . The alignments of O 2 molecules are determined as Figure 3b by the synchrotron XRD and Rietveld analysis. O 2 -O 2 dimers are aligned along the 1D chain like a ladder. However, the π -orbital overlap is dominant for the intra-dimer coupling, leading to the effective spin-dimer system. The magnetization curve of this system is shown in Figure 3c [60]. A clear increase of magnetization is observed at 30 T, and the system reaches the saturation of magnetization ( M = 2   μ B ). The observed 1-step magnetization contradicts the expected 2-step magnetization curve [Figure 2b].
The observed magnetization curve indicates that the triplet and quintet energy levels simultaneously cross the singlet state, which is only possible for D t q J. Such a condition, in fact, can be realized by molecular rearrangement in the O 2 -O 2 dimer. The exchange constant J strongly depends on the geometry between the O 2 molecules, not only on the distance. This is because the superexchange interaction depends on the overlap integral of the π orbitals. Theoretical studies suggest that the AFM J takes the maximum for the H geometry (rectangular parallel), where the overlap integral becomes largest, while J becomes even ferromagnetic (FM) for the S (shifted parallel) and X (crossed) geometries (Figure 4) [65,66,67,68]. Importantly, the theories indicate that the most stable molecular arrangement changes from an H to an X or S geometry when the spin state changes from singlet to quintet, because the AFM interaction is not favorable to the polarized spin state [69,70].
The reorientation of the O 2 -O 2 dimer is restricted inside the 1D channel; however, the slight rearrangement can reduce the AFM J to lower the free energy. This means that the spin-gap ratio of the flexible O 2 -O 2 dimer can deviate from the value in the fixed dimer case ( D s t : D t q = 1 : 2 ). Therefore, the one-step magnetization of O 2 -O 2 dimer indicates the field-induced molecular rearrangement via spin-lattice coupling, which is characteristic of O 2 -O 2 coupled by weak van der Waals interactions. If such field-induced molecular rearrangements occur in a condensed phase of oxygen, it would lead to a cooperative rearrangement of the packing structure along with a discontinuous magnetization increase. Indeed, the local structure of condensed oxygen is based on the H-geometry packing, which favors the AFM ground state. Therefore, the analogous discussions on the O 2 -O 2 dimer can be applied to solid and liquid oxygen. This is our motivation to explore such a field-induced phase transition of solid and liquid oxygen under ultrahigh magnetic fields. In the next section, we present the representative data obtained under ultrahigh magnetic fields and discuss the physical properties of the high-field phase.

3. Solid and Liquid Oxygen
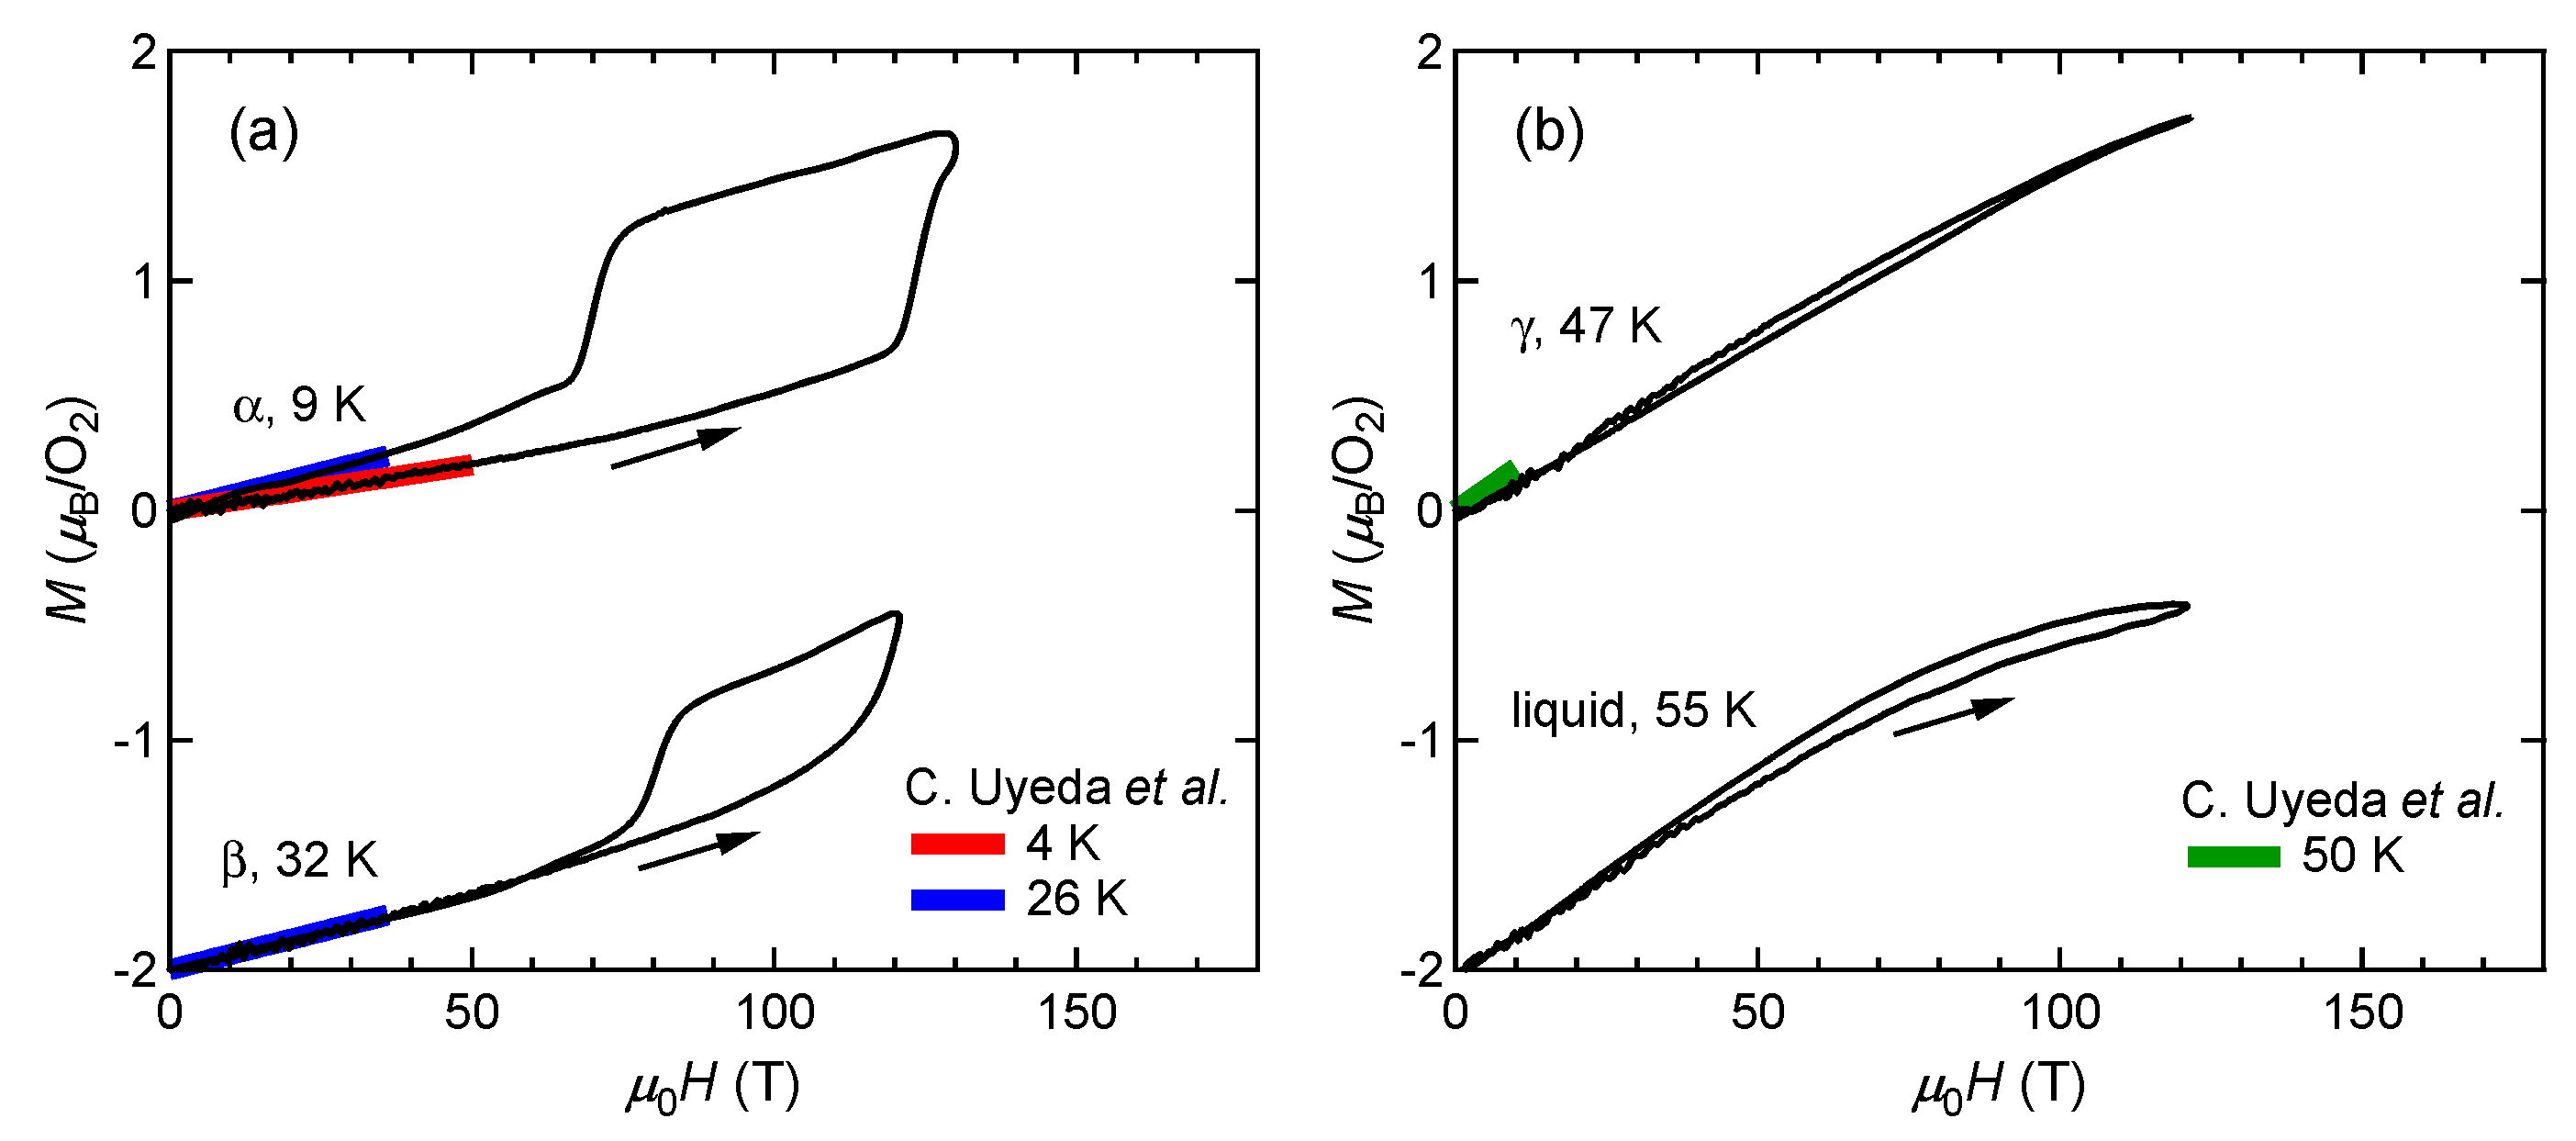
3.1. Magnetization

We have performed magnetization measurements up to the ultrahigh magnetic field of 130 T by using the single-turn coil (STC) technique [47,71]. Figure 5a shows the magnetization curves with the initial temperatures of T 0 = 9 K ( α phase) and 32 K ( β phase). The red and blue lines show the magnetization curves obtained by using a non-destructive magnet [19]. The magnetization linearly increases up to 110 T and suddenly shows a metamagnetic transition at around 120 T. This is a clear sign of a high-field phase of solid oxygen, termed the θ phase. The experimental results show both α - θ and β - θ transitions occur in a similar field range. The magnetization in the field-down sweep shows an anomaly at around 70 T with a large hysteresis loop. The magnetization curve below 70 T follows the slope of the β phase (blue curve), although the initial phase is the α phase (red curve). This probably reflects the temperature increase after the α - θ transition, which causes considerable dissipation as a hysteresis loss [56]. The magnetization of the θ phase depends on the peak value of the magnetic field, which is related to the slow dynamics of the phase transition compared to the magnetic-field duration of ∼6 μ s. To reach the saturation value of 2   μ B , a longer pulse duration above the transition field (∼100 T) is needed.
Figure 5b shows the magnetization curves of the γ and liquid phases. Error ranges of these results are relatively large (∼ ± 0.2   μ B ), because of the challenging temperature control of a He-gas-flow cryostat. Within our experimental accuracy, no phase transition is detected up to 120 T. The slight hysteresis observed in both curves might be due to the magneto-volume effect [58,72,73], which could change the sample-filling condition inside a pickup coil. Therefore, we conclude that the θ phase does not appear in this temperature range above 44 K.

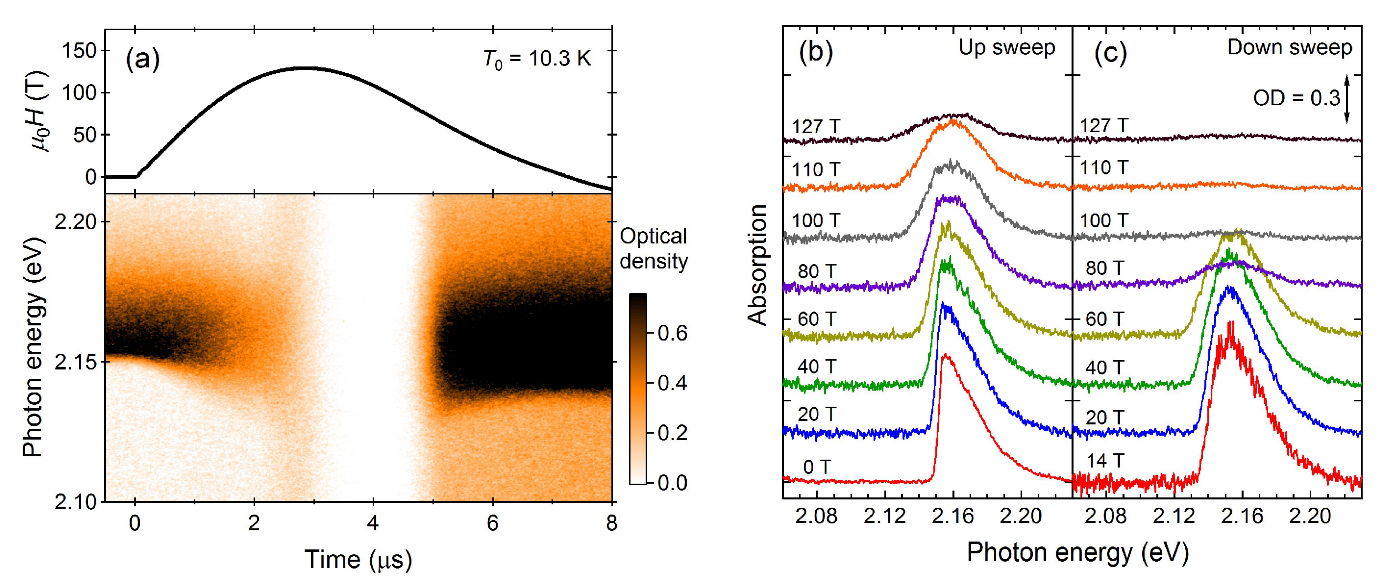
3.2. Optical Absorption

Next, we present the results of the optical-absorption measurements up to 127 T (Figure 6). Optical absorption around 2.16 eV is called as a bimolecular absorption, where two O 2 molecules are simultaneously excited with one photon absorption ( 3 Σ g 3 Σ g 1 Δ g 1 Δ g ) [12,13,14,15,16,17]. As the magnetic field increases, the magnitude, width, and peak position of the bimolecular absorption continuously change. The decrease in the bimolecular absorption intensity reflects the magnetization of solid oxygen. Because of the spin-conservation rule of the electrical dipole transition, only the S tot = 0 pair can participate in the optical transition. Under magnetic fields, the probability of forming singlet pairs decreases, and the optical transition probability also decreases [16]. The broadening of the absorption peak is due to the orbital Zeeman effect of the excited state ( 1 Δ g 1 Δ g ) [44,57,74]. The peak energy shift is considered to reflect the decrease of the exchange field caused by the magnetostriction [58,73].
At the top of the pulsed field (at 3 μ s), the absorption spectra drastically change; the transmitted light intensity increases in all photon energy ranges, and the bimolecular absorption disappears. This clear anomaly corresponds to the α - θ transition of solid oxygen observed in the magnetization curve (Figure 5a). Because of the increased magnetization, the probability of forming a singlet pair becomes almost zero, leading to the disappearance of the bimolecular absorption. The increase of the transmitted light in all photon energy ranges does not reflect the change in the bimolecular absorption, but rather, the light scattering. The samples used in this study are polycrystals of solid oxygen. At the grain boundaries of polycrystalline solid oxygen, strong light scattering occurs because of the refractive-index mismatch. The light scattering is especially strong for the anisotropic phases ( α and β phases), while it is relatively weak in the γ phase because of the isotropic structure. The decrease of the light scattering in the θ phase indicates that this phase also has isotropic optical properties.
We have performed the same measurement at various temperatures and observed the β - θ transition as well [51]. For the γ and liquid phases, we observed no reproducible anomaly up to 150 T. We have to note that the results for these high-temperature phases are quite unstable because of the plasticity and fluidity. Under magnetic fields, we speculate that these phases move inside the sample cell because of the magnetic force and magneto-volume effect, and they disturb the transmitted light signal. Therefore, experiments under stable conditions using a non-destructive magnet are needed for the search for high-field phases in the plastic and liquid phases.

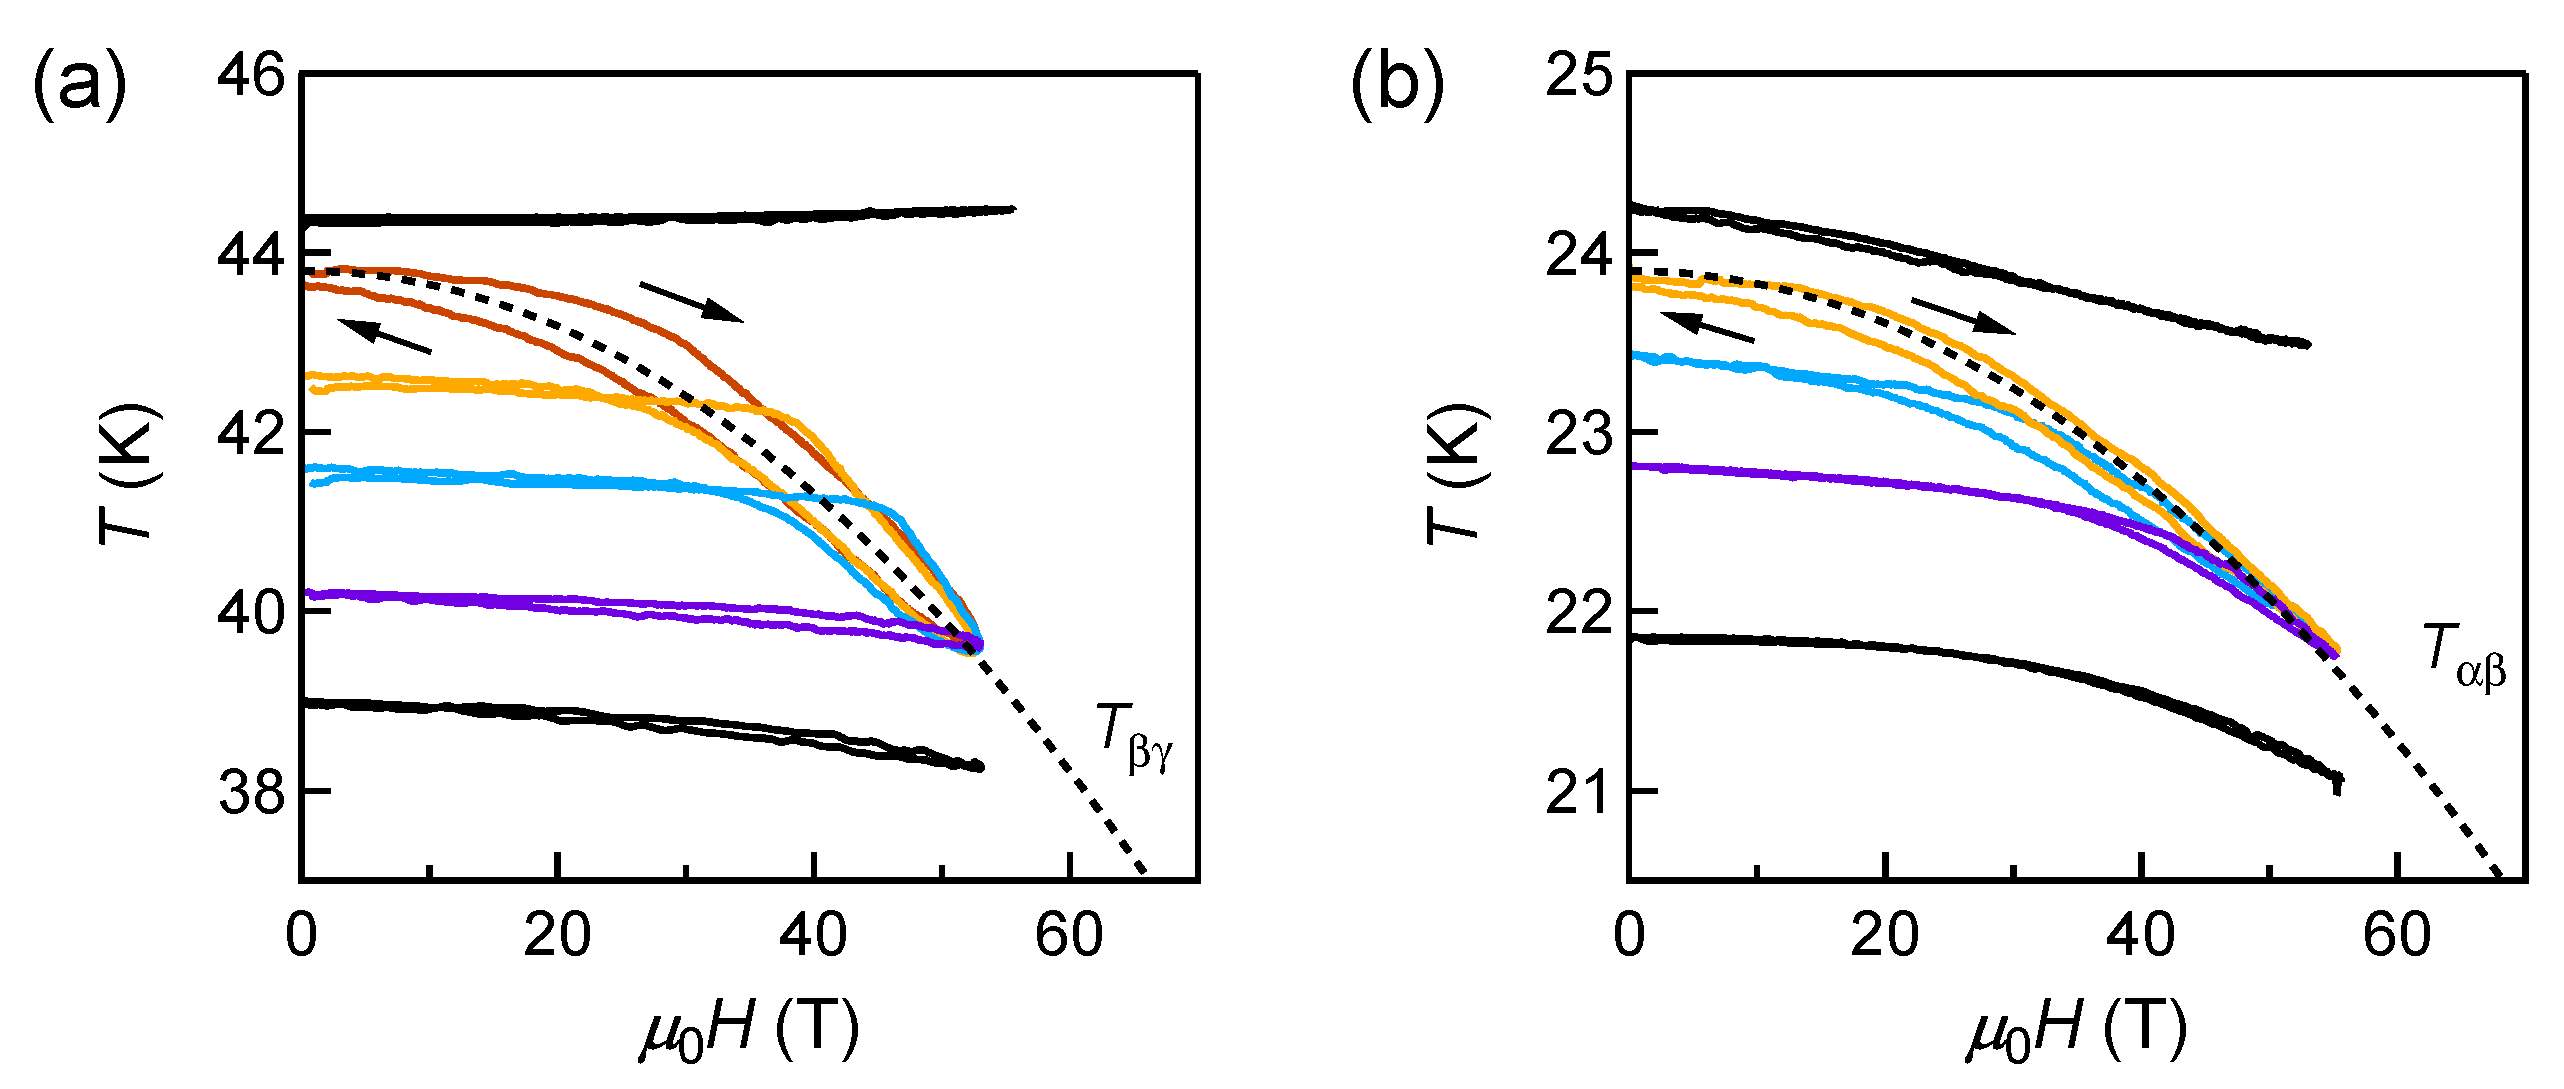
3.3. Magnetocaloric Effect
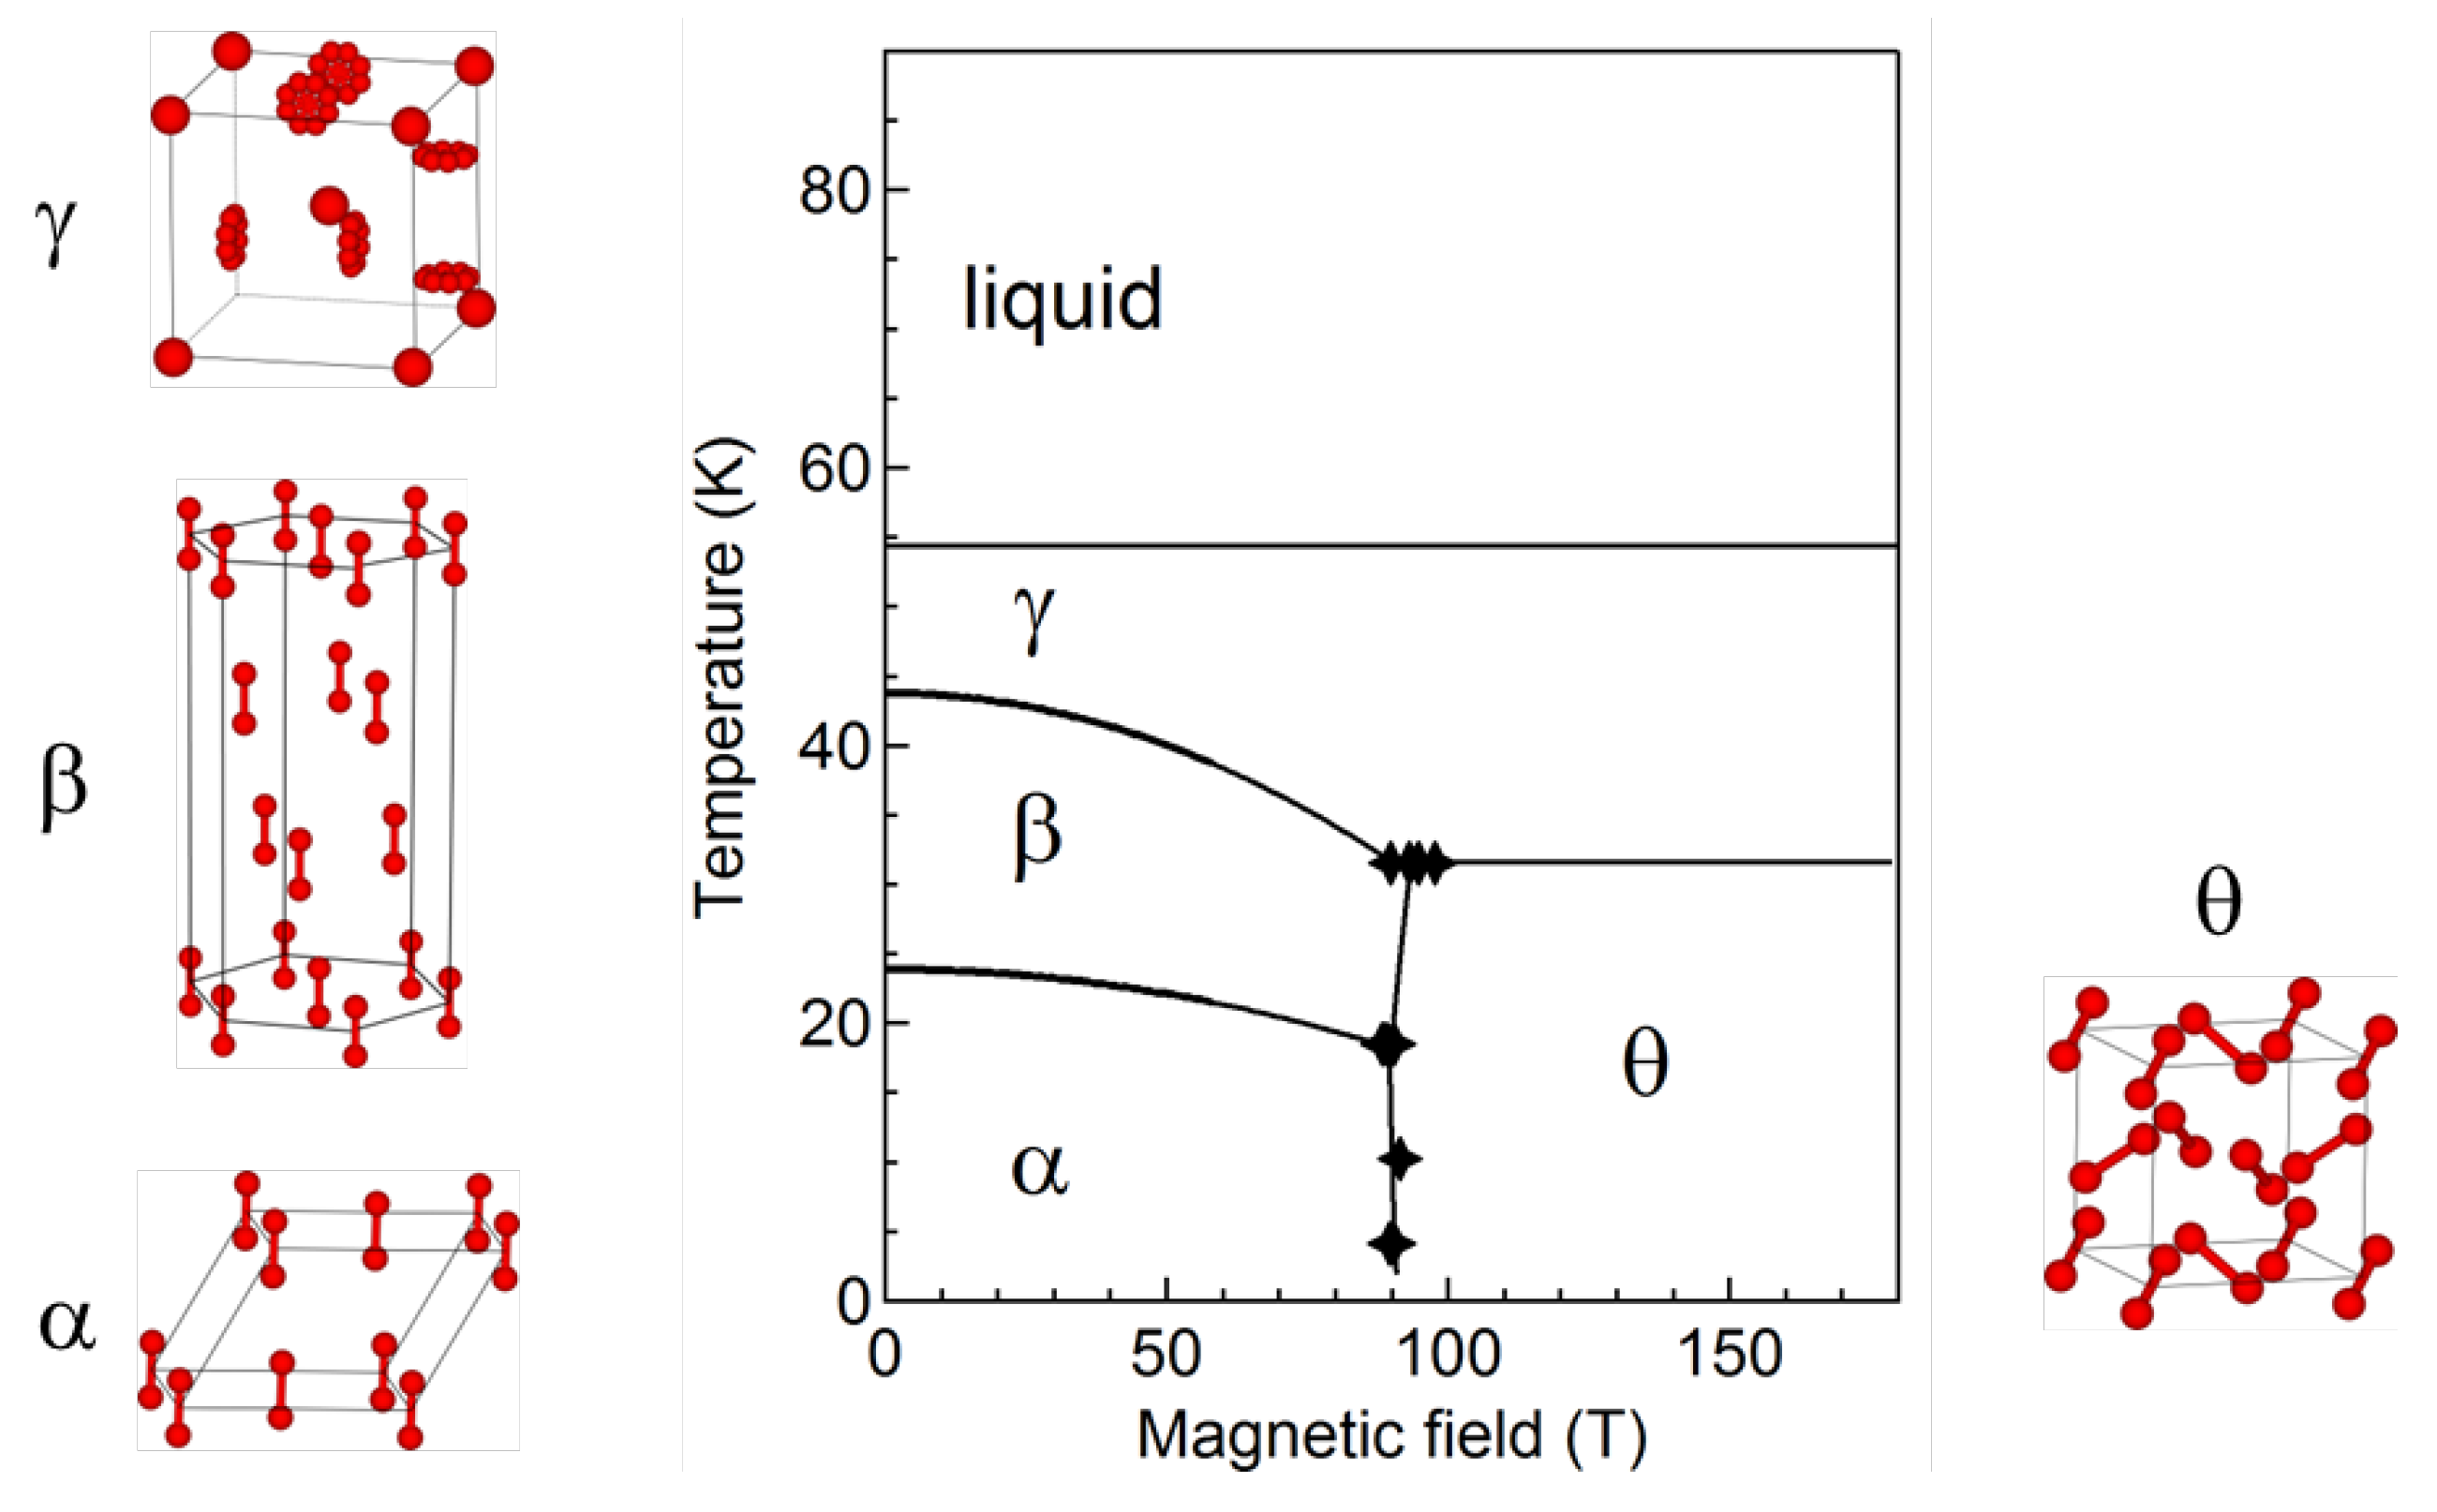
In the above subsections, we focus on the ultrahigh-field properties of solid oxygen and the phase boundary of the θ phase around 100 T. To provide an overview of the H-T phase diagram, the phase boundaries between the low-field phases are also important [75,76]. One of the most powerful tools to reveal the H-T phase diagram of magnetic materials is the adiabatic magnetocaloric effect (MCE) measurement [77]. In this measurement, we trace the temperature of a sample during an adiabatic magnetization process. Because of the adiabatic condition, the entropy of the system is kept constant. Therefore, the temperature traces follow the isentropic curves in the H-T phase diagram.
Figure 7a,b show the MCE curves near the β - γ and α - β phase boundaries ( T β γ and T α β ), respectively. Results at various temperatures from 4 to 90 K are presented in [51]. The temperature traces near T β γ and T α β show larger temperature changes with hysteresis and merge into one line, as shown by the dashed curve, corresponding to the β - γ and α - β phase boundaries under magnetic fields. This is a signature of a first-order phase boundary, separated by a discontinuous entropy change. When a sample is magnetized in an adiabatic condition, the entropy of the system cannot change. This means that, even if the system crosses the first-order phase boundary, the phase transformation does not complete because of the entropy barrier. Instead, the two phases coexist, and the fraction of them changes along the phase boundary to balance the total entropy. Therefore, the merged MCE curves directly reflect the entropy barrier at the β - γ and α - β phase transitions.
These results indicate the important fact that the α - β and β - γ phase transitions do not complete during the adiabatic condition. In particular, the field duration of the STCs is only several μ s, and the results using this technique are obtained in the adiabatic condition (Figure 5 and Figure 6). In this case, the sample temperature can significantly change from the initial temperature along the β - γ and α - β phase boundaries. For constructing the phase diagram using the STC data, the MCE has to be carefully taken into account.

4. Phase Diagram

We propose the phase diagram of solid oxygen as Figure 8 by combining the results of magnetization, optical spectroscopy, and magnetocaloric-effect measurements. For details of the procedures including the corrections for the MCE and hysteresis, see [52]. The presented crystal structures of the α , β , and γ phases are based on [18,25].
The obtained α - θ and β - θ phase boundaries are almost vertical in the H-T plane. The magnetic Clausius–Clapeyron equation,
d T c / d H c = Δ M / Δ S ,
where d T c / d H c is the slope of the phase boundary, Δ M is the magnetization change, and Δ S is the entropy change, suggests that the entropy changes at these phase transitions are rather small. Since the α phase is a low-entropy phase with ordered magnetic structure and molecular alignment, we can conclude that the θ phase is also a low-entropy phase. The low entropy of the θ phase is a clear contrast from the γ phase, which is a high-entropy phase with rotating O 2 molecules, although both phases have isotropic structures.
The above discussions and experimental observations suggest that the θ phase is characterized by the (i) large magnetization, (ii) isotropic crystal structure, and (iii) small entropy. From the theoretical point of view, the first-principle calculations suggest that the P a 3 ¯ cubic structure can have lower energy than the α -phase structure for a polarized spin state [78]. Indeed, this is an FCC-like close-packing structure, which is favored in terms of the van der Waals energy and electric quadrupole interaction, and various molecular solids (CO 2 , N 2 , and N 2 O) take it as a ground state at ambient pressure [79]. In this structure, the nearest neighbor configuration is close to the X geometry rather than the H geometry. Thus, the AFM interaction in this crystal structure is weakened from the α phase. Therefore, we propose that the P a 3 ¯ cubic structure is a promising candidate for the θ phase, satisfying all of the features of this high-field phase.
In this study, we have not detected the γ - θ and γ -liquid phase boundaries. Based on Equation (2), one can estimate the slope of these phase boundaries. Figure 5 suggests that the magnetizations of these phases are very close at around 100 T. Moreover, the entropy differences of these phases are expected to be quite large ( S θ S γ S liq ) based on the heat capacity measurements [23,24] and the low-entropy character of the θ phase. Therefore, the slopes of these phase boundaries are almost zero as shown in Figure 8. This means that these phase boundaries cannot be detected by the field-sweep measurements, which is the case in our experiments.

5. Remaining Issues

5.1. Diffraction Experiment

The proposed crystal structure of the θ phase is based on the indirect experimental observations and the theoretical calculations. To conclude the crystal structure, we need to perform diffraction experiments for the θ phase. Thanks to the recent development combining the free-electron X-ray laser and the portable STC system, diffraction experiments around 100 T are becoming accessible [80,81]. In the near future, the direct determination of the crystal structure of the θ phase might become possible.

5.2. High-Field Plastic and Liquid Phases

We propose the scenario of the field-induced molecular rearrangement of O 2 for all the condensed phases of oxygen because their local structure is an H-type configuration with AFM correlation. However, because of the experimental difficulties, the experiments on the γ and liquid phases have not been precisely performed under ultrahigh magnetic fields. Here, the difficulty mostly comes from the short duration of the field and the large magneto-volume effect [72]. When solid and liquid oxygen expands inside the sample cell, the increased pressure cannot be released in the μ s timescale, leading to the disturbance of the signal. Further technical developments both from the field-generation technique and sample preparation must wait for reliable experiments.
The only reliable results obtained for liquid oxygen are the ultrasound results at 77 K up to 90 T using a non-destructive magnet (Figure 9) [53]. The continuous softening and increasing acoustic attenuation up to 90 T suggest that the local molecular arrangement in liquid oxygen fluctuates under magnetic fields. The observed decrease of sound velocity reaches 8.5% at 90 T, which is quite large compared to other magnetic systems [82]. In addition, the normalized acoustic attenuation coefficient ( α / f 2 ) becomes 20 times larger than the zero-field value. Empirically, the value of α / f 2 = 200 × 10 15 s2/m is extremely large for simple liquids [83]. Since the dissipations due to the viscosity and thermal conductivity cannot explain the observed value, the anomalous acoustic attenuation suggests fluctuations of O 2 molecules. We argue that this fluctuation could be related to the field-induced liquid–liquid transition or crossover, from a small-M to a large-M liquid. We note that magnetic-field-induced liquid–liquid transition has not been reported so far, although many high-pressure studies have been reported [84,85]. Experiments at higher magnetic fields might reveal another fascinating phase of oxygen in the future.

5.3. High-Pressure and High-Field Study

By applying pressure, the magnitude of the exchange interaction and the stable packing structure of solid oxygen easily change [4,5,6]. Here, a question is how the obtained H-T phase diagram changes as a function of pressure. Since four high-pressure phases of solid oxygen have already been reported, introducing a new axis of the magnetic field could lead to a much more fertile phase diagram. However, a lower O 2 –O 2 distance generally results in a stronger AFM exchange interaction. In this case, the phase boundary of the θ phase around 100 T is expected to increase under pressure. Therefore, the experimental exploration of the phase diagram under pressure is an even more challenging project. The 3D phase diagram with the tuning parameters of T, P, and H is left for a future issue.

5.4. Impurity Effect

Another possible direction is to see the effect of nonmagnetic impurity, which breaks the AFM exchange interaction in solid oxygen. In this approach, the exchange interaction is weakened, and the transition field is expected to decrease. The pressure–temperature phase diagrams for O 2 -Ar and O 2 -N 2 systems have been well studied [86,87,88,89]. Notably, the composition of O 2 :N 2 1 : 1 leads to another crystal structure with a kagome lattice of oxygen, which is not stable for pure solid O 2 and N 2 [90]. The magnetic-field effect on these systems is intriguing both from the physics of cryocrystal and frustrated magnetism.

6. Conclusions

In this paper, we review the ultrahigh-field study on condensed oxygen and how this research has been initiated. Our hypothesis, the field-induced reorientation of O 2 in the condensed phase, is demonstrated by the discovery of the θ phase. From high-temperature phases ( γ and liquid), no clear signature of a field-induced phase was detected, although a strong fluctuation is suggested for liquid oxygen at 90 T. To conclude more about the high-temperature region of the H-T phase diagram, further experimental developments are needed.
Our study indicates that the molecular alignment of O 2 can be tuned by applying magnetic fields. Since oxygen is an important element for various (bio-)chemical reactions, the reorientation of O 2 molecules is an attractive mechanism for controlling the reactivity. Indeed, there are several experiments demonstrating that the reactivity of oxygen can be controlled via its magnetism [91,92,93]. Using future technologies, magnetic fields have the potential to catalyze various oxygen-related reactions.

Supplementary Materials

The following are available online at https://www.mdpi.com/article/10.3390/oxygen2020013/s1, Video S1. Gaseous and Liquid Oxygen Attracted by a Magnet.

Author Contributions

Conceptualization, T.C.K. and Y.H.M.; methodology, T.N. and Y.H.M.; investigation, T.N.; writing—original draft preparation, T.N., Y.H.M. and T.C.K.; writing—review and editing, T.N.; supervision, Y.H.M. and T.C.K. All authors have read and agreed to the published version of the manuscript.

Funding

This work was partly supported by JSPS KAKENHI, Grant-in-Aid for Scientific Research (Nos. 16H04009, 19K23421, and 20K14403), and JSPS Bilateral Joint Research Projects (JPJSBP120193507). T.N. was supported by a Grant-in-Aid for JSPS Fellows.

Acknowledgments

We acknowledge S. Takeyama, Y. Kohama, and A. Ikeda for fruitful discussions and collaborations. Crystal structure figures were created using the visualization software VESTA [94].

Conflicts of Interest

The authors declare that there is no conflict of interest.

References

  1. Faraday, M. Experimental Researches in Electricity, Vol. 3, Series XXV; Cambridge University Press: Cambridge, UK, 1848. [Google Scholar]
  2. DeFotis, G.C. Magnetism of solid oxygen. Phys. Rev. B 1981, 23, 4714–4740. [Google Scholar] [CrossRef]
  3. Freiman, Y.A.; Jodl, H.J. Elementary excitations in solid oxygen (Review). Low Temp. Phys. 2002, 28, 491–504. [Google Scholar] [CrossRef]
  4. Freiman, Y.; Jodl, H. Solid oxygen. Phys. Rep. 2004, 401, 1–228. [Google Scholar] [CrossRef]
  5. Freiman, Y.A. Magnetic properties of solid oxygen under pressure (Review Article). Low Temp. Phys. 2015, 41, 847–857. [Google Scholar] [CrossRef]
  6. Freiman, Y.; Jodl, H.; Crespo, Y. Solid oxygen revisited. Phys. Rep. 2018, 743, 1–55. [Google Scholar] [CrossRef]
  7. Lewis, G.N. The Magnetism of Oxygen and the Molecule O4. J. Am. Chem. Soc. 1924, 46, 2027–2032. [Google Scholar] [CrossRef]
  8. Kratky, K.W. Explanation of the magnetic behaviour of oxygen in the liquid state. Acta Phys. Acad. Sci. Hung. 1975, 39, 15–21. [Google Scholar] [CrossRef]
  9. Fernandez-Alonso, F.; Bermejo, F.J.; Bustinduy, I.; Adams, M.A.; Taylor, J.W. Spin dynamics in liquid and rotationally disordered solid oxygen. Phys. Rev. B 2008, 78, 104303. [Google Scholar] [CrossRef] [Green Version]
  10. Oda, T.; Pasquarello, A. Noncollinear magnetism in liquid oxygen: A first-principles molecular dynamics study. Phys. Rev. B 2004, 70, 134402. [Google Scholar] [CrossRef]
  11. Oda, T.; Pasquarello, A. Ab Initio Molecular Dynamics Investigation of the Structure and the Noncollinear Magnetism in Liquid Oxygen: Occurrence of O4 Molecular Units. Phys. Rev. Lett. 2002, 89, 197204. [Google Scholar] [CrossRef]
  12. Gaididei, Y.B.; Loktev, V.M.; Prikhotko, A.F.; Shanskii, L.I. α-Oxygen doublets. I. Theory. Phys. Status Solidi B 1975, 72, 795–806. [Google Scholar] [CrossRef]
  13. Gaididei, Y.B.; Loktev, V.M.; Prikhotko, A.F.; Shanskii, L.I. α-Oxygen Doublets II. Experiment. Phys. Status Solidi B 1976, 73, 415–425. [Google Scholar] [CrossRef]
  14. Litvinenko, Y.G.; Eremenko, V.V.; Garber, T.I. Antiferromagnetic Ordering Effect on the Light Absorption Spectrum by Crystalline Oxygen. Phys. Status Solidi B 1968, 30, 49–60. [Google Scholar] [CrossRef]
  15. Uyeda, C.; Yamagishi, A.; Date, M. Field-Induced Transparency in Liquid Oxygen by High Magnetic Field. J. Phys. Soc. Jpn. 1986, 55, 468–470. [Google Scholar] [CrossRef]
  16. Uyeda, C.; Yamagishi, A.; Date, M. Liquid Oxygen under High Magnetic Field. J. Phys. Soc. Jpn. 1988, 57, 3954–3960. [Google Scholar] [CrossRef]
  17. Fujiwara, T. Optical Absorptions in Solid Oxygen. J. Phys. Soc. Jpn. 1974, 36, 1530–1541. [Google Scholar] [CrossRef]
  18. Cox, D.E.; Samuelsen, E.J.; Beckurts, K.H. Neutron-Diffraction Determination of the Crystal Structure and Magnetic Form Factor of γ-Oxygen. Phys. Rev. B 1973, 7, 3102–3111. [Google Scholar] [CrossRef]
  19. Uyeda, C.; Sugiyama, K.; Date, M. High Field Magnetization of Solid Oxygen. J. Phys. Soc. Jpn. 1985, 54, 1107–1115. [Google Scholar] [CrossRef]
  20. Brodynaskii, A.P.; Freiman, Y.A. γ-oxygen, a quasi-one-dimensional magnetic material. Sov. J. Low Temp. Phys. 1985, 11, 714. [Google Scholar]
  21. Brodyanskii, A.P.; Freiman, Y.A.; Jezowski, A. The magnetic properties of γ-phase and liquid oxygen. J. Phys. Condens. Matter 1989, 1, 999–1004. [Google Scholar] [CrossRef]
  22. Meier, R.J.; Schinkel, C.J.; de Visser, A. Magnetisation of condensed oxygen under high pressures and in strong magnetic fields. J. Phys. C: Solid State Phys. 1982, 15, 1015–1024. [Google Scholar] [CrossRef] [Green Version]
  23. Giauque, W.F.; Johnston, H.L. The Heat Capacity of Oxygen from 12 °K. to its Boiling Point and its Heat of Vaporization. The Entropy from Spectroscopic Data. J. Am. Chem. Soc. 1929, 51, 2300–2321. [Google Scholar] [CrossRef]
  24. Fagerstroem, C.H.; Hollis Hallett, A.C. The specific heat of solid oxygen. J. Low Temp. Phys. 1969, 1, 3–12. [Google Scholar] [CrossRef]
  25. Meier, R.J.; Helmholdt, R.B. Neutron-diffraction study of α- and β-oxygen. Phys. Rev. B 1984, 29, 1387–1393. [Google Scholar] [CrossRef] [Green Version]
  26. Stephens, P.W.; Majkrzak, C.F. Magnetic structure and dynamics in the alpha and β phases of solid oxygen. Phys. Rev. B 1986, 33, 1–13. [Google Scholar] [CrossRef] [PubMed]
  27. Lipinski, L.; Szmyrka-Grzebyk, A.; Manuszkiewicz, H. Hysteresis effect in the α-β transition of solid oxygen. Cryogenics 1996, 36, 921–924. [Google Scholar] [CrossRef]
  28. Steur, P.; Pavese, F. On the double heat capacity peak of oxygen solid-to-solid transition near 23.8 K. Chem. Phys. Lett. 2022, 797, 139598. [Google Scholar] [CrossRef]
  29. Bhandari, R.; Falicov, L.M. Theory of antiferromagnetism and light absorption in solid oxygen. J. Phys. C: Solid State Phys. 1973, 6, 479–494. [Google Scholar] [CrossRef]
  30. Nicol, M.; Hirsch, K.; Holzapfel, W.B. Oxygen phase equilibria near 298 K. Chem. Phys. Lett. 1979, 68, 49–52. [Google Scholar] [CrossRef]
  31. Schiferl, D.; Cromer, D.T.; Schwalbe, L.A.; Mills, R.L. Structure of ‘orange’ 18O2 at 9.6 GPa and 297 K. Acta Crystallogr. B 1983, 39, 153–157. [Google Scholar] [CrossRef]
  32. Goncharenko, I.N.; Makarova, O.L.; Ulivi, L. Direct Determination of the Magnetic Structure of the Delta Phase of Oxygen. Phys. Rev. Lett. 2004, 93, 055502. [Google Scholar] [CrossRef] [PubMed]
  33. Klotz, S.; Strässle, T.; Cornelius, A.L.; Philippe, J.; Hansen, T. Magnetic Ordering in Solid Oxygen up to Room Temperature. Phys. Rev. Lett. 2010, 104, 115501. [Google Scholar] [CrossRef] [PubMed] [Green Version]
  34. Desgreniers, S.; Vohra, Y.K.; Ruoff, A.L. Optical response of very high density solid oxygen to 132 GPa. J. Phys. Chem. 1990, 94, 1117–1122. [Google Scholar] [CrossRef]
  35. Akahama, Y.; Kawamura, H.; Häusermann, D.; Hanfland, M.; Shimomura, O. New High-Pressure Structural Transition of Oxygen at 96 GPa Associated with Metallization in a Molecular Solid. Phys. Rev. Lett. 1995, 74, 4690–4693. [Google Scholar] [CrossRef] [PubMed]
  36. Fujihisa, H.; Akahama, Y.; Kawamura, H.; Ohishi, Y.; Shimomura, O.; Yamawaki, H.; Sakashita, M.; Gotoh, Y.; Takeya, S.; Honda, K. O8 Cluster Structure of the Epsilon Phase of Solid Oxygen. Phys. Rev. Lett. 2006, 97, 085503. [Google Scholar] [CrossRef]
  37. Lundegaard, L.F.; Weck, G.; McMahon, M.I.; Desgreniers, S.; Loubeyre, P. Observation of an O8 molecular lattice in the ϵ phase of solid oxygen. Nature 2006, 443, 201–204. [Google Scholar] [CrossRef]
  38. Santoro, M.; Gregoryanz, E.; Mao, H.k.; Hemley, R.J. New Phase Diagram of Oxygen at High Pressures and Temperatures. Phys. Rev. Lett. 2004, 93, 265701. [Google Scholar] [CrossRef] [Green Version]
  39. Goncharov, A.F.; Subramanian, N.; Ravindran, T.R.; Somayazulu, M.; Prakapenka, V.B.; Hemley, R.J. Polymorphism of dense, hot oxygen. J. Chem. Phys. 2011, 135, 084512. [Google Scholar] [CrossRef]
  40. Crespo, Y.; Fabrizio, M.; Scandolo, S.; Tosatti, E. Collective spin 1 singlet phase in high-pressure oxygen. Proc. Natl. Acad. Sci. USA 2014, 111, 10427–10432. [Google Scholar] [CrossRef] [Green Version]
  41. Klotz, S. Magnetism in Solid Oxygen Studied by High-Pressure Neutron Diffraction. J. Low Temp. Phys. 2018, 192, 1–18. [Google Scholar] [CrossRef]
  42. Katzke, H.; Tolédano, P. Theory of the mechanisms of pressure-induced phase transitions in oxygen. Phys. Rev. B 2009, 79, 140101. [Google Scholar] [CrossRef]
  43. Shimizu, K.; Suhara, K.; Ikumo, M.; Eremets, M.I.; Amaya, K. Superconductivity in oxygen. Nature 1998, 393, 767–769. [Google Scholar] [CrossRef]
  44. Eremenko, V.V.; Litvinenko, Y.V. Spectrum of Alpha Oxygen in a Strong Magnetic Field. Sov. Phys. JETP 1968, 26, 350–353. [Google Scholar]
  45. Kimura, S.; Kindo, K. High field ESR measurements on molecular oxygen. In EPR in the 21st Century; Kawamori, A., Yamauchi, J., Ohta, H., Eds.; Elsevier Science B.V.: Amsterdam, The Netherlands, 2002; pp. 799–802. [Google Scholar] [CrossRef]
  46. Kimura, S.; Kindo, K.; Narumi, Y.; Hagiwara, M.; Kikuchi, H.; Ajiro, Y. High Field/High Frequency ESR in Osaka University. J. Phys. Soc. Jpn. 2003, 72, 99–108. [Google Scholar] [CrossRef] [Green Version]
  47. Nomura, T.; Matsuda, Y.H.; Takeyama, S.; Matsuo, A.; Kindo, K.; Her, J.L.; Kobayashi, T.C. Novel Phase of Solid Oxygen Induced by Ultrahigh Magnetic Fields. Phys. Rev. Lett. 2014, 112, 247201. [Google Scholar] [CrossRef] [Green Version]
  48. Kobayashi, T.C.; Nomura, T.; Matsuda, Y.H.; Her, J.L.; Takeyama, S.; Matsuo, A.; Kindo, K. Emergence of novel phase of solid oxygen in ultrahigh magnetic Held. J. Phys. Conf. Ser. 2014, 568, 042018. [Google Scholar] [CrossRef] [Green Version]
  49. Nomura, T.; Matsuda, Y.H.; Her, J.L.; Takeyama, S.; Matsuo, A.; Kindo, K.; Kobayashi, T.C. Magneto-Absorption in the α Phase of Solid Oxygen at Megagauss Magnetic Fields. J. Low Temp. Phys. 2013, 170, 372–376. [Google Scholar] [CrossRef]
  50. Nomura, T.; Matsuda, Y.H.; Takeyama, S.; Matsuo, A.; Kindo, K.; Kobayashi, T.C. Phase boundary of θ phase of solid oxygen in ultrahigh magnetic fields. Phys. Rev. B 2015, 92, 064109. [Google Scholar] [CrossRef]
  51. Nomura, T.; Kohama, Y.; Matsuda, Y.H.; Kindo, K.; Kobayashi, T.C. α-β and β-γ phase boundaries of solid oxygen observed by adiabatic magnetocaloric effect. Phys. Rev. B 2017, 95, 104420. [Google Scholar] [CrossRef] [Green Version]
  52. Nomura, T.; Matsuda, Y.H.; Kobayashi, T.C. H-T phase diagram of solid oxygen. Phys. Rev. B 2017, 96, 054439. [Google Scholar] [CrossRef] [Green Version]
  53. Nomura, T.; Ikeda, A.; Gen, M.; Matsuo, A.; Kindo, K.; Kohama, Y.; Matsuda, Y.H.; Zherlitsyn, S.; Wosnitza, J.; Tsuda, H.; et al. Physical properties of liquid oxygen under ultrahigh magnetic fields. Phys. Rev. B 2021, 104, 224423. [Google Scholar] [CrossRef]
  54. Nomura, T.; Hauspurg, A.; Gorbunov, D.I.; Miyata, A.; Schulze, E.; Zvyagin, S.A.; Tsurkan, V.; Matsuda, Y.H.; Kohama, Y.; Zherlitsyn, S. Ultrasound measurement technique for the single-turn-coil magnets. Rev. Sci. Instrum. 2021, 92, 063902. [Google Scholar] [CrossRef] [PubMed]
  55. Nomura, T.; Zherlitsyn, S.; Kohama, Y.; Wosnitza, J. Viscosity measurements in pulsed magnetic fields by using a quartz-crystal microbalance. Rev. Sci. Instrum. 2019, 90, 065101. [Google Scholar] [CrossRef] [PubMed]
  56. Nomura, T.; Matsuda, Y.H.; Takeyama, S.; Kobayashi, T.C. Irreversible Heating Measurement with Microsecond Pulse Magnet: Example of the αθ Phase Transition of Solid Oxygen. J. Phys. Soc. Jpn. 2016, 85, 094601. [Google Scholar] [CrossRef] [Green Version]
  57. Nomura, T.; Matsuda, Y.H.; Takeyama, S.; Matsuo, A.; Kindo, K.; Kobayashi, T.C. Orbital Zeeman Effect of Liquid Oxygen in High Magnetic Fields. In Proceedings of the International Conference on Strongly Correlated Electron Systems (SCES2013), Tokyo, Japan, 3–5 August 2013. [Google Scholar] [CrossRef] [Green Version]
  58. Matsuda, Y.H.; Shimizu, A.; Ikeda, A.; Nomura, T.; Yajima, T.; Inami, T.; Takahashi, K.; Kobayashi, T.C. High magnetic field X-ray diffraction study of the α phase of solid oxygen: Absence of giant magnetostriction. Phys. Rev. B 2019, 100, 214105. [Google Scholar] [CrossRef]
  59. Kitaura, R.; Kitagawa, S.; Kubota, Y.; Kobayashi, T.C.; Kindo, K.; Mita, Y.; Matsuo, A.; Kobayashi, M.; Chang, H.C.; Ozawa, T.C.; et al. Formation of a One-Dimensional Array of Oxygen in a Microporous Metal-Organic Solid. Science 2002, 298, 2358–2361. [Google Scholar] [CrossRef] [Green Version]
  60. Hori, A.C.; Kobayashi, T.; Kubota, Y.; Matsuo, A.; Kindo, K.; Kim, J.; Kato, K.; Takata, M.; Sakamoto, H.; Matsuda, R.; et al. Spin-Dependent Molecular Orientation of O2–O2 Dimer Formed in the Nanoporous Coordination Polymer. J. Phys. Soc. Jpn. 2013, 82, 084703. [Google Scholar] [CrossRef]
  61. Kobayashi, T.C.; Matsuo, A.; Suzuki, M.; Kindo, K.; Kitaura, R.; Matsuda, R.; Kitagawa, S. Magnetic Properties of Molecular Oxygen Adsorbed in Micro-Porous Metal-Organic Solids. Prog. Theor. Phys. Suppl. 2005, 159, 271–279. [Google Scholar] [CrossRef] [Green Version]
  62. Mori, W.; Kobayashi, T.C.; Kurobe, J.; Amaya, K.; Narumi, Y.; Kumada, T.; Kindo, K.; Katori, H.A.; Goto, T.; Miura, N.; et al. Magnetic Properties of Oxygen Physisorbed in Cu-Trans-1,4-Cyclohexanedicarboxylic Acid. Mol. Cryst. Liq. Cryst. Sci. Technol. Sect. A Mol. Cryst. Liq. Cryst. 1997, 306, 1–7. [Google Scholar] [CrossRef]
  63. Hori, A.; Kobayashi, T.C.; Matsuo, A.; Kindo, K.; Matsuda, R.; Kitagawa, S. High-field magnetization process of O2 adsorbed in a microporous coordination polymer CPL-1 at various temperatures. J. Phys. Conf. Ser. 2010, 200, 022018. [Google Scholar] [CrossRef] [Green Version]
  64. Soda, M.; Honma, Y.; Takamizawa, S.; Ohira-Kawamura, S.; Nakajima, K.; Masuda, T. Spin Model of O2-Based Magnet in a Nanoporous Metal Complex. J. Phys. Soc. Jpn. 2016, 85, 034717. [Google Scholar] [CrossRef] [Green Version]
  65. Bussery, B.; Umanskii, S.Y.; Aubert-Frécon, M.; Bouty, O. Exchange interaction between two O2 molecules using the asymptotic method. J. Chem. Phys. 1994, 101, 416–423. [Google Scholar] [CrossRef]
  66. van Hemert, M.C.; Wormer, P.E.S.; van der Avoird, A. Ab Initio Calculation of the Heisenberg Exchange Interaction between O2 Molecules. Phys. Rev. Lett. 1983, 51, 1167–1170. [Google Scholar] [CrossRef]
  67. Wormer, P.E.S.; van der Avoird, A. (Heisenberg) exchange and electrostatic interactions between O2 molecules: An ab initio study. J. Chem. Phys. 1984, 81, 1929–1939. [Google Scholar] [CrossRef]
  68. Bartolomei, M.; Hernández, M.I.; Campos-Martínez, J.; Carmona-Novillo, E.; Hernández-Lamoneda, R. The intermolecular potentials of the O2–O2 dimer: A detailed ab initio study of the energy splittings for the three lowest multiplet states. Phys. Chem. Chem. Phys. 2008, 10, 5374–5380. [Google Scholar] [CrossRef]
  69. Bussery, B.; Wormer, P.E.S. A van der Waals intermolecular potential for (O2)2. J. Chem. Phys. 1993, 99, 1230–1239. [Google Scholar] [CrossRef]
  70. Nozawa, K.; Shima, N.; Makoshi, K. Theoretical Study of Structures of Solid Oxygen under High Pressure. J. Phys. Soc. Jpn. 2002, 71, 377–380. [Google Scholar] [CrossRef]
  71. Miura, N.; Osada, T.; Takeyama, S. Research in Super-High Pulsed Magnetic Fields at the Megagauss Laboratory of the University of Tokyo. J. Low Temp. Phys. 2003, 133, 139–158. [Google Scholar] [CrossRef]
  72. Uyeda, C.; Yamagishi, A.; Date, M. Magneto-Volume Effect of Liquid Oxygen. J. Phys. Soc. Jpn. 1987, 56, 3444–3446. [Google Scholar] [CrossRef]
  73. Katsumata, K.; Kimura, S.; Staub, U.; Narumi, Y.; Tanaka, Y.; Shimomura, S.; Nakamura, T.; Lovesey, S.W.; Ishikawa, T.; Kitamura, H. The giant magneto-volume effect in solid oxygen. J. Phys. Condens. Matter 2005, 17, L235–L239. [Google Scholar] [CrossRef]
  74. Prikhot’ko, A.F.; Ptukha, T.P.; Shanskii, L.I. Splitting of Absorption Lines of Oxygen Crystals in a Magnetic Field. JETP Lett. 1967, 5, 328–330. [Google Scholar]
  75. Jansen, A.P.J.; van der Avoird, A. Magnetic coupling and dynamics in solid α and β-O2. I. An ab initio theoretical approach. J. Chem. Phys. 1987, 86, 3583–3596. [Google Scholar] [CrossRef] [Green Version]
  76. Jansen, A.P.J.; van der Avoird, A. Magnetic coupling and dynamics in solid α and β-O2. II. Prediction of magnetic field effects. J. Chem. Phys. 1987, 86, 3597–3601. [Google Scholar] [CrossRef] [Green Version]
  77. Kihara, T.; Kohama, Y.; Hashimoto, Y.; Katsumoto, S.; Tokunaga, M. Adiabatic measurements of magneto-caloric effects in pulsed high magnetic fields up to 55 T. Rev. Sci. Instrum. 2013, 84, 074901. [Google Scholar] [CrossRef] [PubMed]
  78. Kasamatsu, S.; Kato, T.; Sugino, O. First-principles description of van der Waals bonded spin-polarized systems using the vdW-DF+U method: Application to solid oxygen at low pressure. Phys. Rev. B 2017, 95, 235120. [Google Scholar] [CrossRef] [Green Version]
  79. Manzhelii, V.G.; Freiman, Y.A. Physics of Cryocrystals; American Institute of Physics: New York, NY, USA, 1997. [Google Scholar]
  80. Ikeda, A.; Matsuda, Y.H.; Zhou, X.; Yajima, T.; Kubota, Y.; Tono, K.; Yabashi, M. Single shot X-ray diffractometry in SACLA with pulsed magnetic fields up to 16 T. Phys. Rev. Res. 2020, 2, 043175. [Google Scholar] [CrossRef]
  81. Ikeda, A.; Matsuda, Y.H.; Zhou, X.; Peng, S.; Ishii, Y.; Yajima, T.; Kubota, Y.; Inoue, I.; Inubushi, Y.; Tono, K.; et al. Generating 77 T using a portable pulse magnet for single-shot quantum beam experiments. Appl. Phys. Lett. 2022, 120, 142403. [Google Scholar] [CrossRef]
  82. Lüthi, B. Physical Acoustics in the Solid State; Springer: Berlin/Heidelberg, Germany, 2005. [Google Scholar]
  83. Bhatia, B. Ultrasonic Absorption: An Introduction to the Theory of Sound Absorption and Dispersion in Gases, Liquids, and Solids; Oxford University Press: New York, NY, USA, 1986. [Google Scholar]
  84. Tanaka, H. Liquid–liquid transition and polyamorphism. J. Chem. Phys. 2020, 153, 130901. [Google Scholar] [CrossRef]
  85. Anisimov, M.A.; Duška, M.; Caupin, F.; Amrhein, L.E.; Rosenbaum, A.; Sadus, R.J. Thermodynamics of Fluid Polyamorphism. Phys. Rev. X 2018, 8, 011004. [Google Scholar] [CrossRef] [Green Version]
  86. Mori, Y.; Sakakibara, A.; Inokuchi, H. Magnetic Susceptibilities of Solid Oxygen-Argon Mixtures. Bull. Chem. Soc. Jpn. 1973, 46, 2305–2307. [Google Scholar] [CrossRef] [Green Version]
  87. Blocker, T.G.; Simmons, C.L.; West, F.G. Magnetic Properties of the Oxygen Molecule in Solid Oxygen-Argon Mixtures. J. Appl. Phys. 1969, 40, 1154–1155. [Google Scholar] [CrossRef]
  88. Baer, B.J.; Nicol, M. High-pressure binary phase diagram of nitrogen-oxygen at 295 K determined by Raman spectroscopy. J. Phys. Chem. 1990, 94, 1073–1078. [Google Scholar] [CrossRef]
  89. Sihachakr, D.; Loubeyre, P. O2-N2 mixtures under pressure: A structural study of the binary phase diagram at 295 K. Phys. Rev. B 2004, 70, 134105. [Google Scholar] [CrossRef]
  90. Akahama, Y.; Maekawa, T.; Sugimoto, T.; Fujihisa, H.; Hirao, N.; Ohishi, Y. High-pressure phase diagram of O2 and N 2 binary system: Formation of kagome-lattice of O2. J. Phys. Conf. Ser. 2014, 500, 182001. [Google Scholar] [CrossRef]
  91. Kurahashi, M.; Yamauchi, Y. Spin Correlation in O2 Chemisorption on Ni(111). Phys. Rev. Lett. 2015, 114, 016101. [Google Scholar] [CrossRef]
  92. Kitazawa, K.; Ikezoe, Y.; Uetake, H.; Hirota, N. Magnetic field effects on water, air and powders. Phys. B: Condens. Matter 2001, 294–295, 709–714. [Google Scholar] [CrossRef]
  93. Pliss, E.M.; Grobov, A.M.; Kuzaev, A.K.; Buchachenko, A.L. Magnetic field effect on the oxidation of organic substances by molecular oxygen. J. Phys. Org. Chem. 2019, 32, e3915. [Google Scholar] [CrossRef]
  94. Momma, K.; Izumi, F. VESTA: A three-dimensional visualization system for electronic and structural analysis. J. Appl. Crystallogr. 2008, 41, 653–658. [Google Scholar] [CrossRef]
Figure 1. (a) Gaseous and (b) liquid oxygen attracted by a permanent magnet. (c) Electron configuration of the O 2 molecule.
Oxygen 02 00013 g001
Figure 2. (a) Energy levels of the O 2 -O 2 dimer as a function of magnetic fields. (b) Magnetization process of the O 2 -O 2 dimer at T = 0 .
Oxygen 02 00013 g002
Figure 3. (a) Crystal structure of Cu-CHD filled with O 2 molecules (red) [60]. (b) Confined alignment of O 2 molecules in the 1D channel [60]. (c) Magnetization curves of O 2 molecules confined in Cu-CHD [60]. These figures are reproduced with permission from J. Phys. Soc. Jpn. Copyright 2013 The Physical Society of Japan.
Oxygen 02 00013 g003
Figure 4. Typical geometries of a O 2 -O 2 dimer. H: rectangular parallel; S: shifted parallel; X: crossed geometries.
Oxygen 02 00013 g004
Figure 5. Magnetization curves of oxygen. (a) α and β phases. (b) γ and liquid phases. Magnetization curves obtained by using non-destructive magnets are shown for comparison [19]. The results for the β and liquid phases are shifted by 2 for clarity.
Oxygen 02 00013 g005
Figure 6. Results of the magneto-optical measurement on solid oxygen. (a) Magnetic field waveform and absorption spectra as a function of time. Optical density (OD) is shown in the color scale. The initial temperature is 10.3 K. (b,c) Absorption spectra for the (b) field-up sweep and (c) field-down sweeps.
Oxygen 02 00013 g006
Figure 7. Magnetocaloric effect of solid oxygen near the (a) β - γ and (b) α - β phase boundaries.
Oxygen 02 00013 g007
Figure 8. Proposed magnetic-field-temperature phase diagram of oxygen. The crystal structure of each phase is also shown [18,25].
Oxygen 02 00013 g008
Figure 9. Acoustic properties of liquid oxygen at 77 K up to 90 T. (a) Sound velocity and (b) the normalized acoustic-attenuation coefficient. The dotted curve shows the expected value based on the viscosity and thermal conductivity.
Oxygen 02 00013 g009
Publisher’s Note: MDPI stays neutral with regard to jurisdictional claims in published maps and institutional affiliations.

