Article

El Niño-Driven Changes in Zooplankton Community Structure in an Amazonian Tropical Estuarine Ecosystem (Taperaçu, Northern Brazil)

by
Thaynara Raelly da Costa Silva
1,
André Magalhães
2,
Adria Davis Procópio
1,
Marcela Pimentel de Andrade
1,
Luci Cajueiro Carneiro Pereira
3,* and
Rauquírio Marinho da Costa
1,*
1
Laboratory of Plankton and Microalgae Cultivation, Institute of Coastal Studies, Universidade Federal do Pará, Alameda Leandro Ribeiro, sn, Aldeia, Bragança 68600-000, Pará, Brazil
2
Amazonian Coastal and Marine Studies Group, Universidade Federal Rural da Amazônia, Avenida Barão de Capanema, sn, Caixa D’agua, Capanema 68700-665, Pará, Brazil
3
Laboratory of Coastal and Estuarine Oceanography, Institute of Coastal Studies, Universidade Federal do Pará, Alameda Leandro Ribeiro, sn, Aldeia, Bragança 68600-000, Pará, Brazil
*
Authors to whom correspondence should be addressed.
Coasts 2025, 5(4), 39; https://doi.org/10.3390/coasts5040039
Submission received: 5 August 2025 / Revised: 28 September 2025 / Accepted: 1 October 2025 / Published: 8 October 2025

Abstract

Given the high sensitivity of small estuaries to environmental changes, the present study aimed to investigate how climate-induced stressors—particularly rainfall and salinity—affect zooplankton community structure in the Amazonian Taperaçu estuary (northern Brazil), where limited spatial scale amplifies ecological responses. This study evaluated the effects of the extremely dry 2015–2016 El Niño period on hydrological patterns and zooplankton dynamics in this shallow tropical estuary. Eight sampling campaigns were conducted, with water and zooplankton samples analyzed using standard methods. Salinity, dissolved inorganic nutrients, and chlorophyll-a concentrations were affected by the marked decrease in rainfall caused by the El Niño event. These changes significantly impacted zooplankton community dynamics, especially the densities of marine-estuarine species Acartia lilljeborgii, Euterpina acutifrons, and Oikopleura dioica, which peaked during months of highest salinity. High recruitment of copepod larval stages was also observed, with peak densities coinciding with dominant adult forms. In contrast, coastal and estuarine species such as Acartia tonsa, Pseudodiaptomus marshi, Oithona oswaldocruzi, and Oithona hebes were negatively affected by reduced rainfall. Species richness, diversity, and evenness during the El Niño period were relatively high compared to previously reported values under normal conditions in the same ecosystem. Environmental and temporal variables accounted for over half the variance in predominant taxa density, indicating that El Niño–driven changes influenced zooplankton structure over time. This suggests that El Niño may have strong impacts at the secondary trophic level, likely to cascade throughout the estuarine food web, altering its dynamics and the flow of carbon and energy through the system.

1. Introduction

Rainfall levels in the Amazonian region exhibit significant year-to-year variability, leading to periods of drought or flooding primarily driven by fluctuations in Sea Surface Temperature (SST) across the tropical Pacific, which alter atmospheric circulation patterns. This ocean-atmosphere interaction, known as the El Niño–Southern Oscillation (ENSO), causes shifts between elevated (El Niño) and reduced (La Niña) ocean heat levels, typically occurring every 2 to 7 years [1,2], and is a major driver of global climate variability. Each El Niño event is unique, varying in strength, duration, and geographic extent of temperature anomalies at both surface and deeper ocean layers [3]. In the Amazon, El Niño-induced droughts may be intensified by warming in the tropical North Atlantic (positive Atlantic SST dipole), as observed during the austral summer of 2010 [4] and across South America [5]. These extreme events threaten riverine communities [6], disrupt hydrological and carbon dynamics in tropical forests, and generate serious socio-environmental impacts across the region [7,8,9]. Over the past two decades, the Amazon basin has experienced several “once-in-a-century” droughts, including those in 2005 [10] and 2009–2010 [11], along with more recent El Niño events in 2015–2016 [12] and 2023 [9,13], which have had widespread tropical impacts. El Niño typically leads to reduced precipitation in central, northern, western, and eastern Amazon [14,15,16], and northeastern Brazil [17]. Despite these effects, data remain limited on how El Niño influences physicochemical variability in Amazonian coastal waters and its impact on regional plankton communities.
Among the limited documented impacts of extreme climatic events (such as severe droughts) on plankton dynamics in this region is a trend toward decreasing phytoplankton biomass (indicated by chlorophyll-a concentrations), associated with a significant reduction in the input of nitrogenous compounds due to decreased rainfall and freshwater discharge [18]. However, information regarding the impact of El Niño or any other drought event on the dynamics of zooplankton in Amazonian estuaries is still scarce [19,20]. Along the west coast of the Americas, including Chile [21], Mexico [22], and California [23], El Niño events tend to weaken upwelling, reduce nutrient supply into the euphotic layer, and consequently decrease the biomass and productivity of both phytoplankton and zooplankton, with cascading effects on higher trophic levels [24]. Such events often adversely affect the fishing industry along the western coast of America [25], since numerous commercially important fish species have planktonic larval phases. The ecological changes induced by the El Niño may affect recruitment rates and hinder adult migrations [26].
Despite the pivotal role of zooplankton in aquatic ecosystems, the extent and underlying mechanisms of their temporal variation in abundance and diversity are still not well understood in tropical estuaries, especially under the influence of extreme climatic events [27]. Climate-driven changes within the lower trophic levels, such as zooplankton, can have significant implications for biogeochemical cycling [28,29], carbon transfer pathways [30,31], and the ecosystem services provided by estuaries and oceans to humankind [32,33].
Given these considerations, and the potential for increased frequency of extreme events in future climate scenarios, the present study investigates how the 2015–2016 El Niño influenced zooplankton communities, exploring the link between anomalous climatic conditions (marked by reduced rainfall levels), hydrology, and zooplankton in a tropical estuary (Taperaçu, northern Brazil). This estuary has distinct environmental features, receiving no direct river inflow and presenting limited drainage, shallow waters, strong tidal currents, and a substantial mangrove forest, which provides significant amounts of nutrients and organic material to the study area.
Because the Taperaçu is a relatively small estuary—under 30 km long—minor shifts in environmental drivers can have rapid impacts on the estuary’s functioning, owing to the limited area affected [34]. Multiple climate-induced stressors, such as rainfall levels and salinity, can favor certain taxa over others, thereby modulating zooplankton community structure. In this context, we hypothesize that the density of marine-euryhaline zooplankton will increase with the rise in salinity influenced by the El Niño. Conversely, estuarine species adapted to brackish waters are expected to be sensitive to similar salinity increases, leading to population declines. We also believe that food availability, particularly phytoplankton productivity, may play a significant role in this process. Determining the degree of association between zooplankton dynamics and extreme fluctuations in climatic patterns could be valuable for modeling and predicting variations in similar systems across tropical regions worldwide. Small estuaries are increasingly recognized globally for their role in understanding climate change impacts on coastal ecosystems. Similar characteristics observed in other Amazonian estuaries—and in small estuarine systems across the globe—further strengthen the broader relevance of our findings. These results contribute meaningfully to the global discourse on climate-driven transformations in estuarine environments and the ecological dynamics of zooplankton communities.

2. Materials and Methods

2.1. Study Area

The Taperaçu is a small Amazonian estuary (<30 km in length), located approximately 200 km southeast of the Amazon River mouth in Bragança, northern Brazil (Figure 1a,b). This estuary has a water surface area of 21 km2 and a drainage of approximately 40 km2 [35]. With an average depth of 4.2 m, the Taperaçu is a shallow, permanently open estuary marked by high turbidity (378.1 NTU), vertical mixing, and tidal currents peaking at 2.04 m/s [35]. Oligohaline and freshwater inputs into the Taperaçu are primarily derived from the Caeté estuary via the Taici creek during flood tides and from the Tamatateua channel, respectively. This channel conveys freshwater from neighboring marshes that flood during the rainy season [36]. Semidiurnal meso-macro tides dominate the estuary, with tidal ranges around 5 m and peaks reaching up to 6 m during equinoctial spring tides [37].
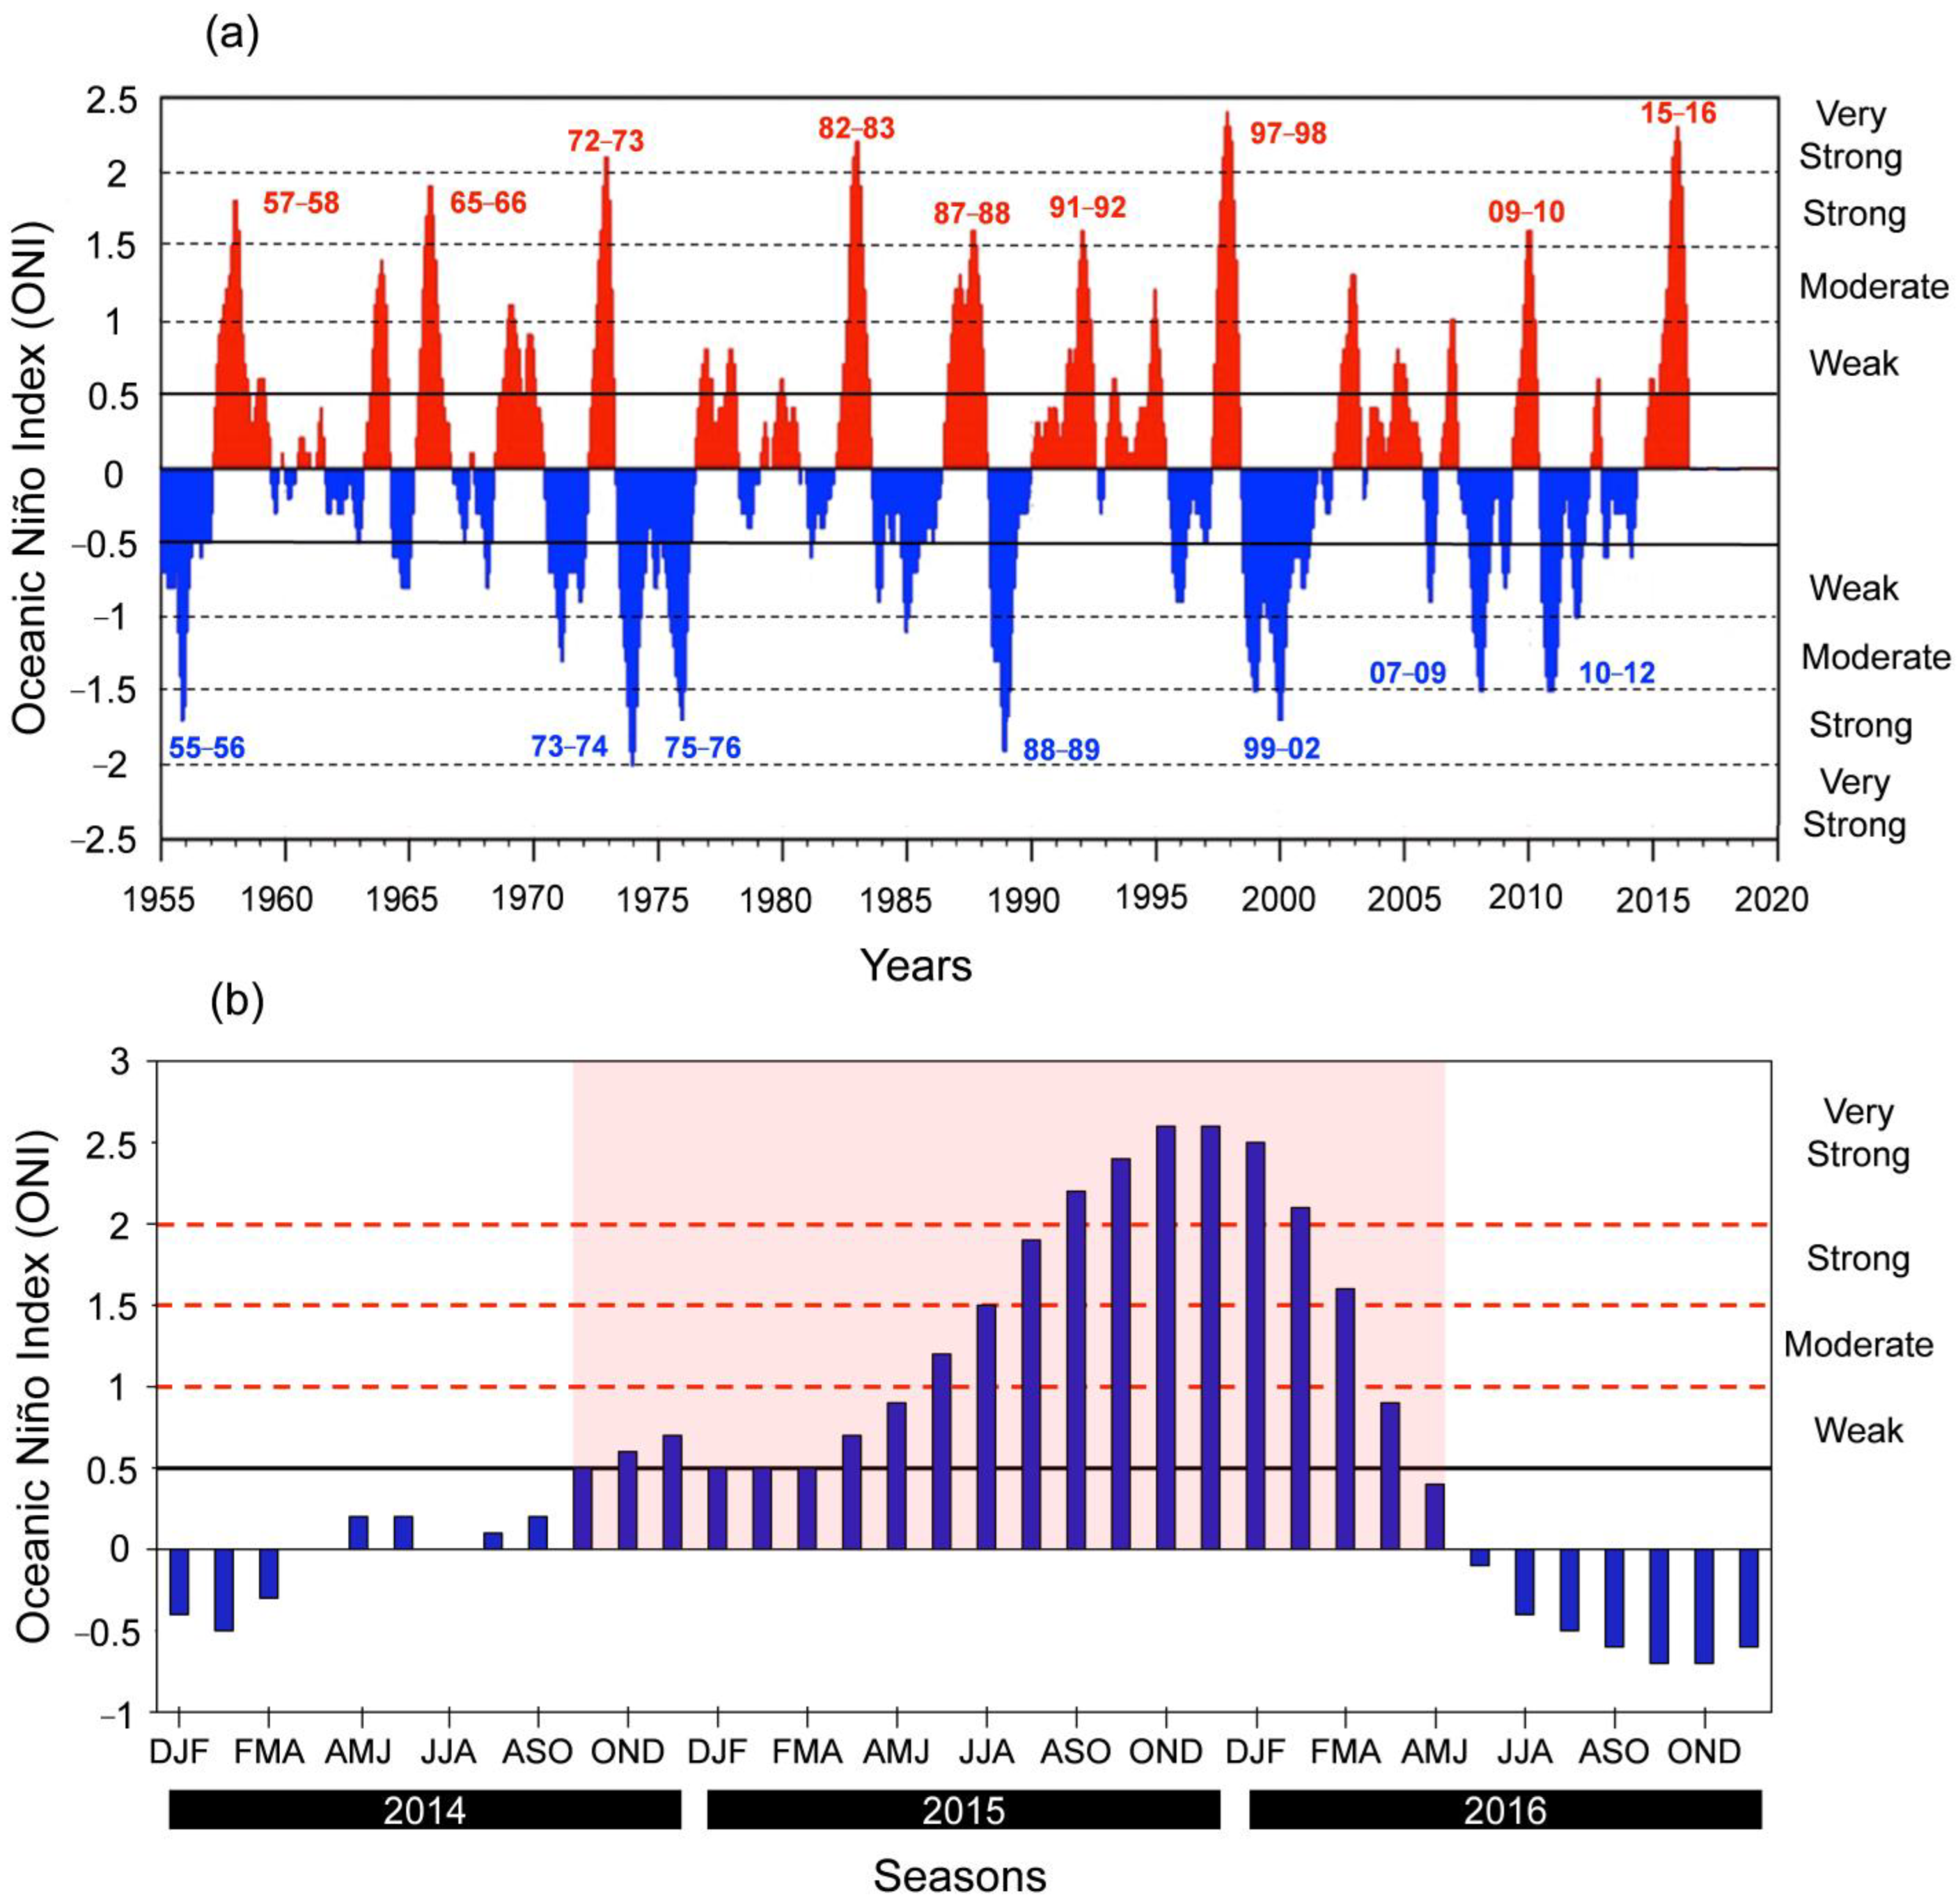
The study region presents a hot and humid equatorial climate, showing an intense rainy season (>2000 mm) and prevailing northeasterly trade winds with a mean velocity of up to 3.0 m s−1 between January and July. Approximately 75–85% of the yearly rainfall occurs during the first six months of the year. In contrast, from August to December (the dry season), rainfall decreases substantially (<100 mm during these months) and strong southeasterly trade winds (>4.0 m s−1) dominate [38]. These rainfall patterns are influenced by climate phenomena such as the El Niño Southern Oscillation (ENSO), which is one of the main factors responsible for interannual climatic extremes in the Amazon region [39] and other tropical regions [40,41,42]. ENSO events are monitored by the Oceanic Niño Index (ONI), with data available for a 61-year period (1955–2016; (Figure 2)). According to the ONI values, the 2015–2016 El Niño was classified as a very strong event [13].

2.2. Sampling and Study Design

Long-term total annual precipitation data (1982–2016) were analyzed, and the occurrence of climatic anomalies such as El Niño, La Niña, and drought periods were presented to provide contextual background for assessing the evolution of these events in the study region. To assess how the 2015–2016 El Niño event impacted local rainfall levels, total monthly precipitation throughout the study period was compared to the mean values from the previous 35 years. These rainfall data were collected hourly each day from January 1982 to December 2016 at the Tracuateua station of the National Meteorological Institute, located at 01°06′ S, 46°87′ W, nearly 15 km from the research location.
The impacts of rainfall anomalies on hydrological variables and zooplankton data were studied over a three-year period (2014–2016). Eight sampling campaigns were conducted during this period, covering both anomalous and neutral climatic conditions: (i) a very strong El Niño event (September and December 2015, and June 2016) and (ii) neutral periods (September and December 2014, March and June 2015, and April 2016). The El Niño event led to a significant decrease in monthly rainfall, averaging approximately 57% below historical means. Sampling periods were grouped into two categories—El Niño-influenced and neutral-based periods—based on Oceanic Niño Index (ONI) values [13] and were analyzed alongside regional rainfall records [38] to identify the years or months most affected by each condition.
Each field campaign was conducted during the spring tide conditions (flood and ebb phases) over a 25 h period. Hydrological and zooplankton sampling was conducted simultaneously at three fixed stations, randomly selected along the Taperaçu estuary to represent distinct salinity zones: oligohaline (lower estuary—St1), intermediate (middle estuary—St2), and more saline (upper estuary—St3) sectors (Figure 1c). Sampling occurred at 3 h intervals, totaling 216 samples (9 samples per station per campaign day). This design reflects environmental variability across the estuarine gradient, allowing assessment of zooplankton responses to changing conditions influenced by climatic and hydrological factors. In situ measurements of salinity, turbidity, and temperature were conducted at approximately 1 m depth using three CTDs (RBRmaestro) equipped with turbidity sensors, recording data at 10 min intervals. Additionally, 500 mL surface water samples were collected at 3 h intervals using 5 L Niskin bottles. Samples were preserved in a cooler at 4 °C for transfer to the laboratory, where pH, dissolved inorganic nutrients (including nitrite, nitrate, orthophosphate, and silicate), and chlorophyll-a concentrations were determined.
Zooplankton samples were collected through 3 min subsurface horizontal hauls performed with conical plankton nets (120 μm mesh, 2 m in length, 0.5 m mouth diameter). The nets were fitted with mechanical flowmeters (General Oceanics 2030R) to estimate the volume of water filtered. These tows were conducted from small power boats at an average speed of 1.5 knots. Immediately after collection, the samples were transferred to 600 mL plastic bottles and preserved in a 4% formalin solution (final concentration) neutralized with sodium tetraborate. Studies conducted in the Taperaçu Estuary [43,44] revealed the estuary’s shallow depth and the homogeneity of its water column, resulting in the absence of vertical migration among local zooplankton. These findings indicate that both biotic and abiotic factors—including nutrient levels and chlorophyll-a concentrations—are evenly distributed, suggesting that sampling at different depths is unnecessary.

2.3. Laboratory Methods

Water samples were vacuum-filtered through glass-fiber filters (Whatman GF/F Ø 47 mm, 0.7 µm). The filtrate and retained material on the filters were subsequently freeze-dried for analysis of nutrient and chlorophyll-a (Chl-a) concentrations. Dissolved inorganic nutrient concentrations were spectrophotometrically determined according to [45] and [46]. Chlorophyll-a was extracted from the filters with 90% acetone (v/v) and determined spectrophotometrically according to the protocols of [47,48]. Nutrient and chlorophyll-a concentrations were analyzed using a Thermo Scientific 220 Evolution UV-Vis spectrophotometer (Waltham, MA, USA), calibrated with deionized water (mixed bed deionizer Q-380M). Detection limits (DL) were established as follows: nitrate (DL = 0.05 μmol L−1), nitrite (DL = 0.01 μmol L−1), silicate (DL = 0.1 μmol L−1), orthophosphate (DL = 0.03 μmol L−1), and chlorophyll-a (DL = 0.02 mg m−3). Quality control was ensured by determining the linearity of the chemical methods (R2 > 0.998) using calibration curves compiled with standard solutions of known concentrations of the respective substances [34]. Due to archival limitations, recovery rates and calibration curve R2 values are not available. Water pH was measured with a tabletop pHmeter (HANNA HI 2221, Hanna Instruments, Woonsocket, RI, USA) with resolution of 0.01.
The preserved zooplankton samples were rinsed to eliminate residual formalin buffer and subsequently partitioned into aliquots using a Folsom splitter, with divisions ranging from one to eleven. Each aliquot was standardized to contain approximately 300 individuals. These subsamples were then examined for identification [49,50,51], taxonomic classification [52], and enumeration in a gridded Petri dish under a stereomicroscope. To estimate the total abundance of each zooplankton taxon, individual counts were multiplied by the corresponding subsampling factor (1–11). Adult specimens were identified to species level or the most precise taxonomic category possible, juveniles to genus, and copepod nauplii were grouped collectively.
For each sample, the quantitative data were analyzed to determine species density (ind m−3), relative abundance, and occurrence frequency (FO). High variability in zooplankton density is common and reflects the spatial and temporal heterogeneity of estuarine environments, driven by patchy distributions, hydrodynamic processes, seasonal freshwater discharge, tidal mixing, and localized nutrient inputs, among other factors. Ecological indices such as species diversity [53], evenness [54], and richness (total number of species per sample) were also computed. The relative frequency of occurrence of a given taxon was expressed as the percentage of samples in which the taxon was present. Diversity and evenness were calculated using PRIMER 6 software, following [55]. Species contributing over 10% of the total individuals in any given month were classified as dominant in this study. To assess how the El Niño (EN) influenced the structure and dynamics of the zooplankton community, abiotic and biotic variables were pooled (mean ± standard deviation) and analyzed across different temporal scales: monthly, seasonal, and interannual.

2.4. Statistical Analyses

Kruskal–Wallis H test was conducted to compare hydrological (salinity, turbidity, pH, temperature, and dissolved inorganic nutrient concentrations) and biological variables (chlorophyll-a, species density, diversity, evenness, and richness) across different temporal scales. When significant differences were identified, Dunn’s post hoc test was used for pairwise mean comparisons [56], without p-value adjustment due to the study’s exploratory nature and the limited number of comparisons. Correlations among environmental variables were assessed through the nonparametric Spearman rank correlation method. All statistical procedures were performed using STATISTICA 8, with a significance level of α = 0.05.
A Redundancy Analysis (RDA) conducted using CANOCO 4.5 [57], was applied to evaluate the effects of two sets of explanatory variables (environmental and temporal) on the fluctuation in the density of the most abundant zooplankton species: Acartia lilljeborgii, Acartia tonsa, Pseudodiaptomus marshi, Euterpina acutifrons, Oithona hebes, Oithona oswaldocruzi, Paracalanus quasimodo and Oikopleura dioica. The environmental matrix included physical, chemical, and biological variables (precipitation, salinity, turbidity, pH, temperature, dissolved silica-DSi, and chlorophyll-a), while the temporal matrix consisted of sampling months and years, which were transformed into dummy variables represented by 1 and 0. Explanatory variables were selected based on their significant association with the observed variation in the density of key zooplankton species, as indicated by a Monte Carlo test with 9999 permutations [58]. A variation partitioning analysis (constrained ordination) visualized with Venn diagrams [59], was applied to assess the relative influence (percentage explanation) of environmental and temporal variables on zooplankton population variability in the Taperaçu estuary. The total variation consisted of four components: two fractions explained purely by environmental (E) and temporal (T) factors, the shared variation (explained by both factors), and the unexplained variation or residuals (R) from the analysis. The overall explained variance was derived from a combination of forward-selected environmental and temporal variables, after which the fraction explained purely by each variable was calculated.

3. Results

Previous studies [34] and references therein, together with preliminary analyses, indicate that no significant spatial heterogeneity was observed in the biological data collected across the three sectors of the Taperaçu estuary. Short-term fluctuations associated with tidal cycles were also minimal and did not substantially influence the results, which justifies the aggregation of data (mean ± standard deviation) for the assessment of monthly and seasonal dynamics.

3.1. Changes in Rainfall Levels and Their Effects on Salinity and Chlorophyll-A Concentrations During Normal and El Niño Periods

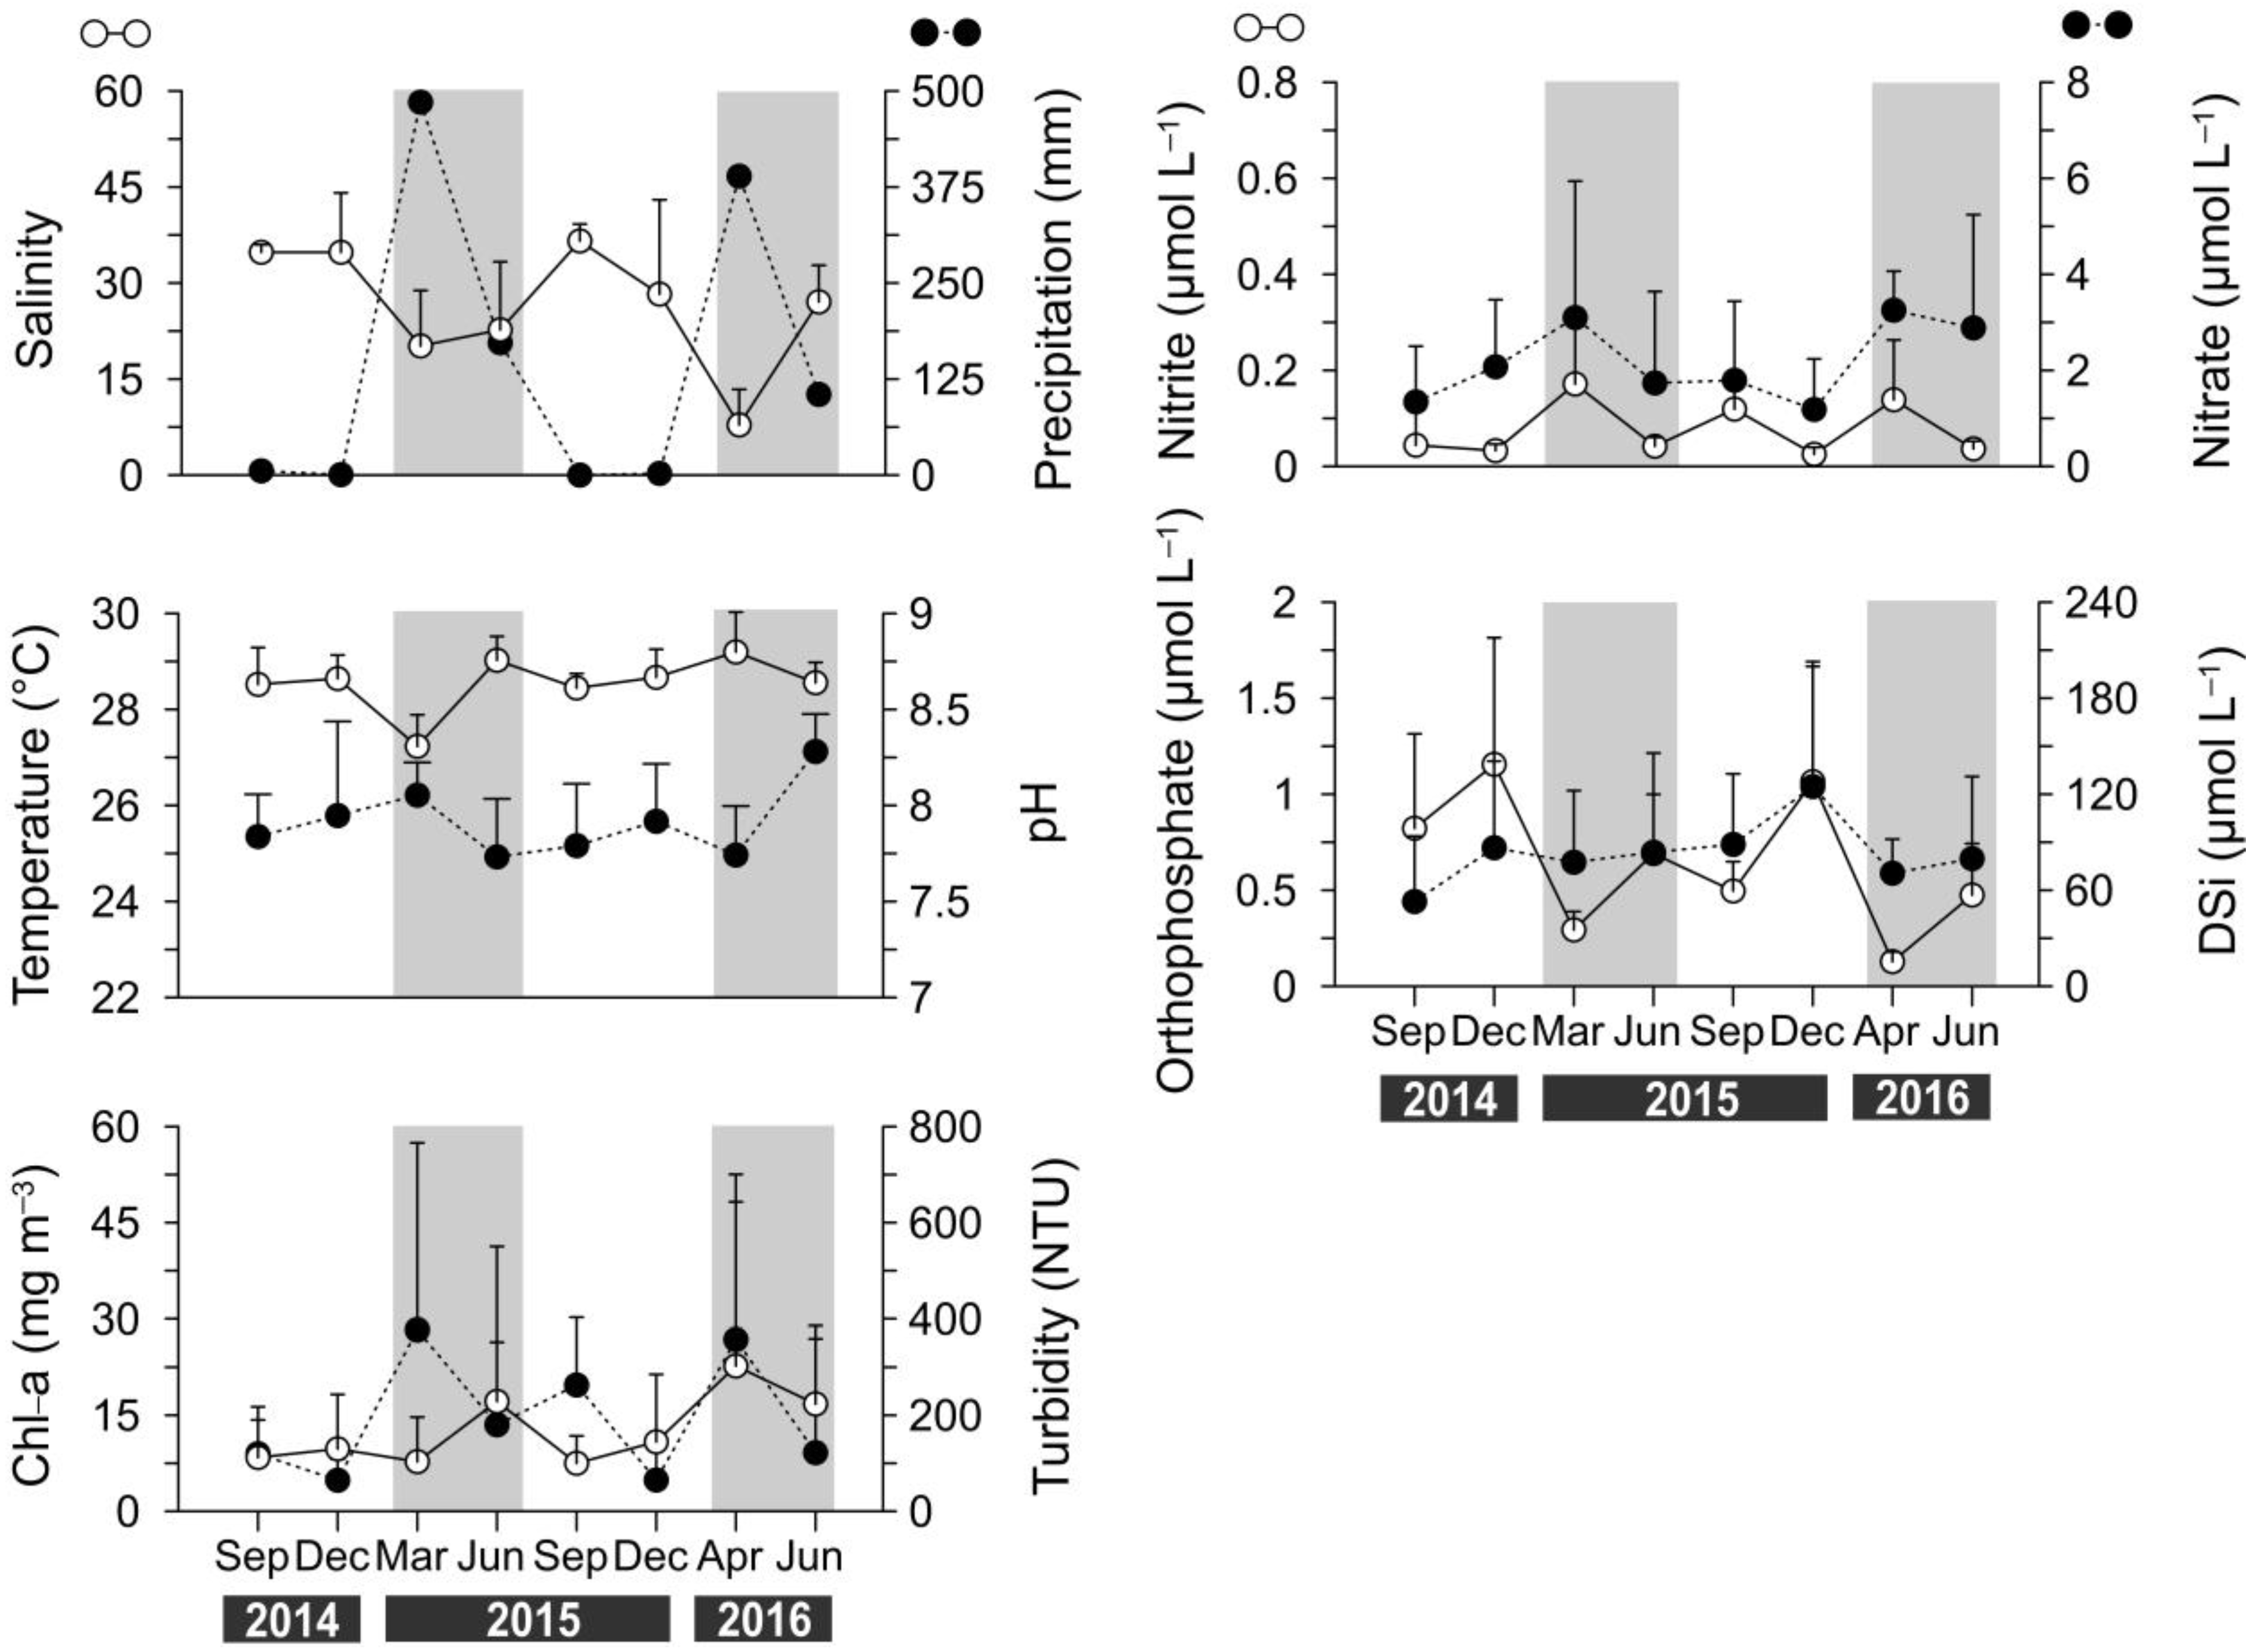
The mean annual rainfall from 1982 to 2016 was 2293 mm, with notable deviations, including those linked to El Niño/La Niña Southern Oscillation (ENSO) events (Figure 3a). During the El Niño event in early 2015 (rainy season), rainfall reductions were pronounced: January precipitation was 89% below the historical mean (1982–2016), 60% lower in February, and 33% lower in May (Figure 3b). The dry season in the latter half of 2015 experienced even steeper declines, particularly in September (100%) and December (96%). In 2016, rainfall levels continued to drop, with reductions of 48% in June, 38% in May, and 28% in January.
Comparing the effects of annual rainfall on water salinity between 2014 and 2016, the reduction of 312–432 mm during the El Niño period (2015–2016) resulted in significantly higher salinity levels (66–72%) relative to the neutral year of 2014. Figure 3c illustrates the impact of rainfall on salinity during El Niño and normal periods, showing that lower rainfall in June 2016 coincided with increased salinity and chlorophyll-a (Chl-a) concentrations (Figure 3d).

3.2. Hydrological Data

Oscillations in hydrological variables were influenced by physical factors, such as precipitation, and biological processes (e.g., photosynthesis) driven by ENSO. A significant negative correlation was found between precipitation and salinity (rs = −0.70, p < 0.0001). The highest mean salinity (36.57 ± 2.64; Kruskal–Wallis, H = 141.91, p < 0.0001) was recorded during the dry season month of September 2015, which was severely affected by the El Niño event (precipitation = 0.0 mm). In contrast, the lowest salinity (7.84 ± 5.55) was recorded in April 2016, one of the wettest months of the study period (Figure 3b and Figure 4). Water temperature showed minimal variation (27.23 ± 0.66 to 29.20 ± 0.83 °C), with a mean interannual amplitude of only 2.0 °C, typical of equatorial environments. Meanwhile, pH remained generally alkaline (7.73 ± 0.30 to 8.28 ± 0.20).
Turbidity and concentrations of nitrite, nitrate, and chlorophyll-a peaked during rainy season months, when neutral ENSO conditions prevailed. Turbidity (377.35 ± 388.66 UNT, p < 0.001) and nitrite concentrations (0.17 ± 0.12 µmol L−1, p < 0.001) peaked in March 2015, while nitrate (3.25 ± 0.81 µmol L−1, p < 0.001) and chlorophyll-a concentrations (22.69 ± 29.84 mg m−3, p < 0.01) were highest in April 2016. These peaks were likely associated with increased rainfall during these periods compared to the El Niño months (Figure 3b and Figure 4). Increased precipitation enhanced the influx of organic matter and particulate inorganic material within the Taperaçu estuary, along with dissolved nitrogen compounds (e.g., nitrate) from surrounding mangroves and the Caeté estuary, transported via the Taici tidal creek during flood tides (see [34]).
The impact of anomalous climatic conditions, including low precipitation, on the estuary’s hydrological parameters is best understood by comparing data from June 2015 and June 2016. In June 2016, during the El Niño event, significant reductions were observed in turbidity (Kruskal–Wallis, H = 69.76, p < 0.01), orthophosphate (Kruskal–Wallis, H = 128.53, p < 0.05), and chlorophyll-a concentrations (Kruskal–Wallis, H = 26.98, p < 0.001) relative to June 2015, when monthly precipitation was approximately 40% higher. A similar trend was observed between September 2014 and September 2015, with the lowest orthophosphate (0.50 ± 0.15 µmol L−1) and chlorophyll-a (7.50 ± 4.27 mg m−3) concentrations recorded in September 2015, further highlighting the influence of the El Niño on hydrological parameters (Figure 3b and Figure 4). Despite these patterns, the highest silicate concentrations were recorded in September and December 2015 (El Niño), coinciding with the lowest chlorophyll-a levels.

3.3. Zooplankton Composition and Temporal Variability

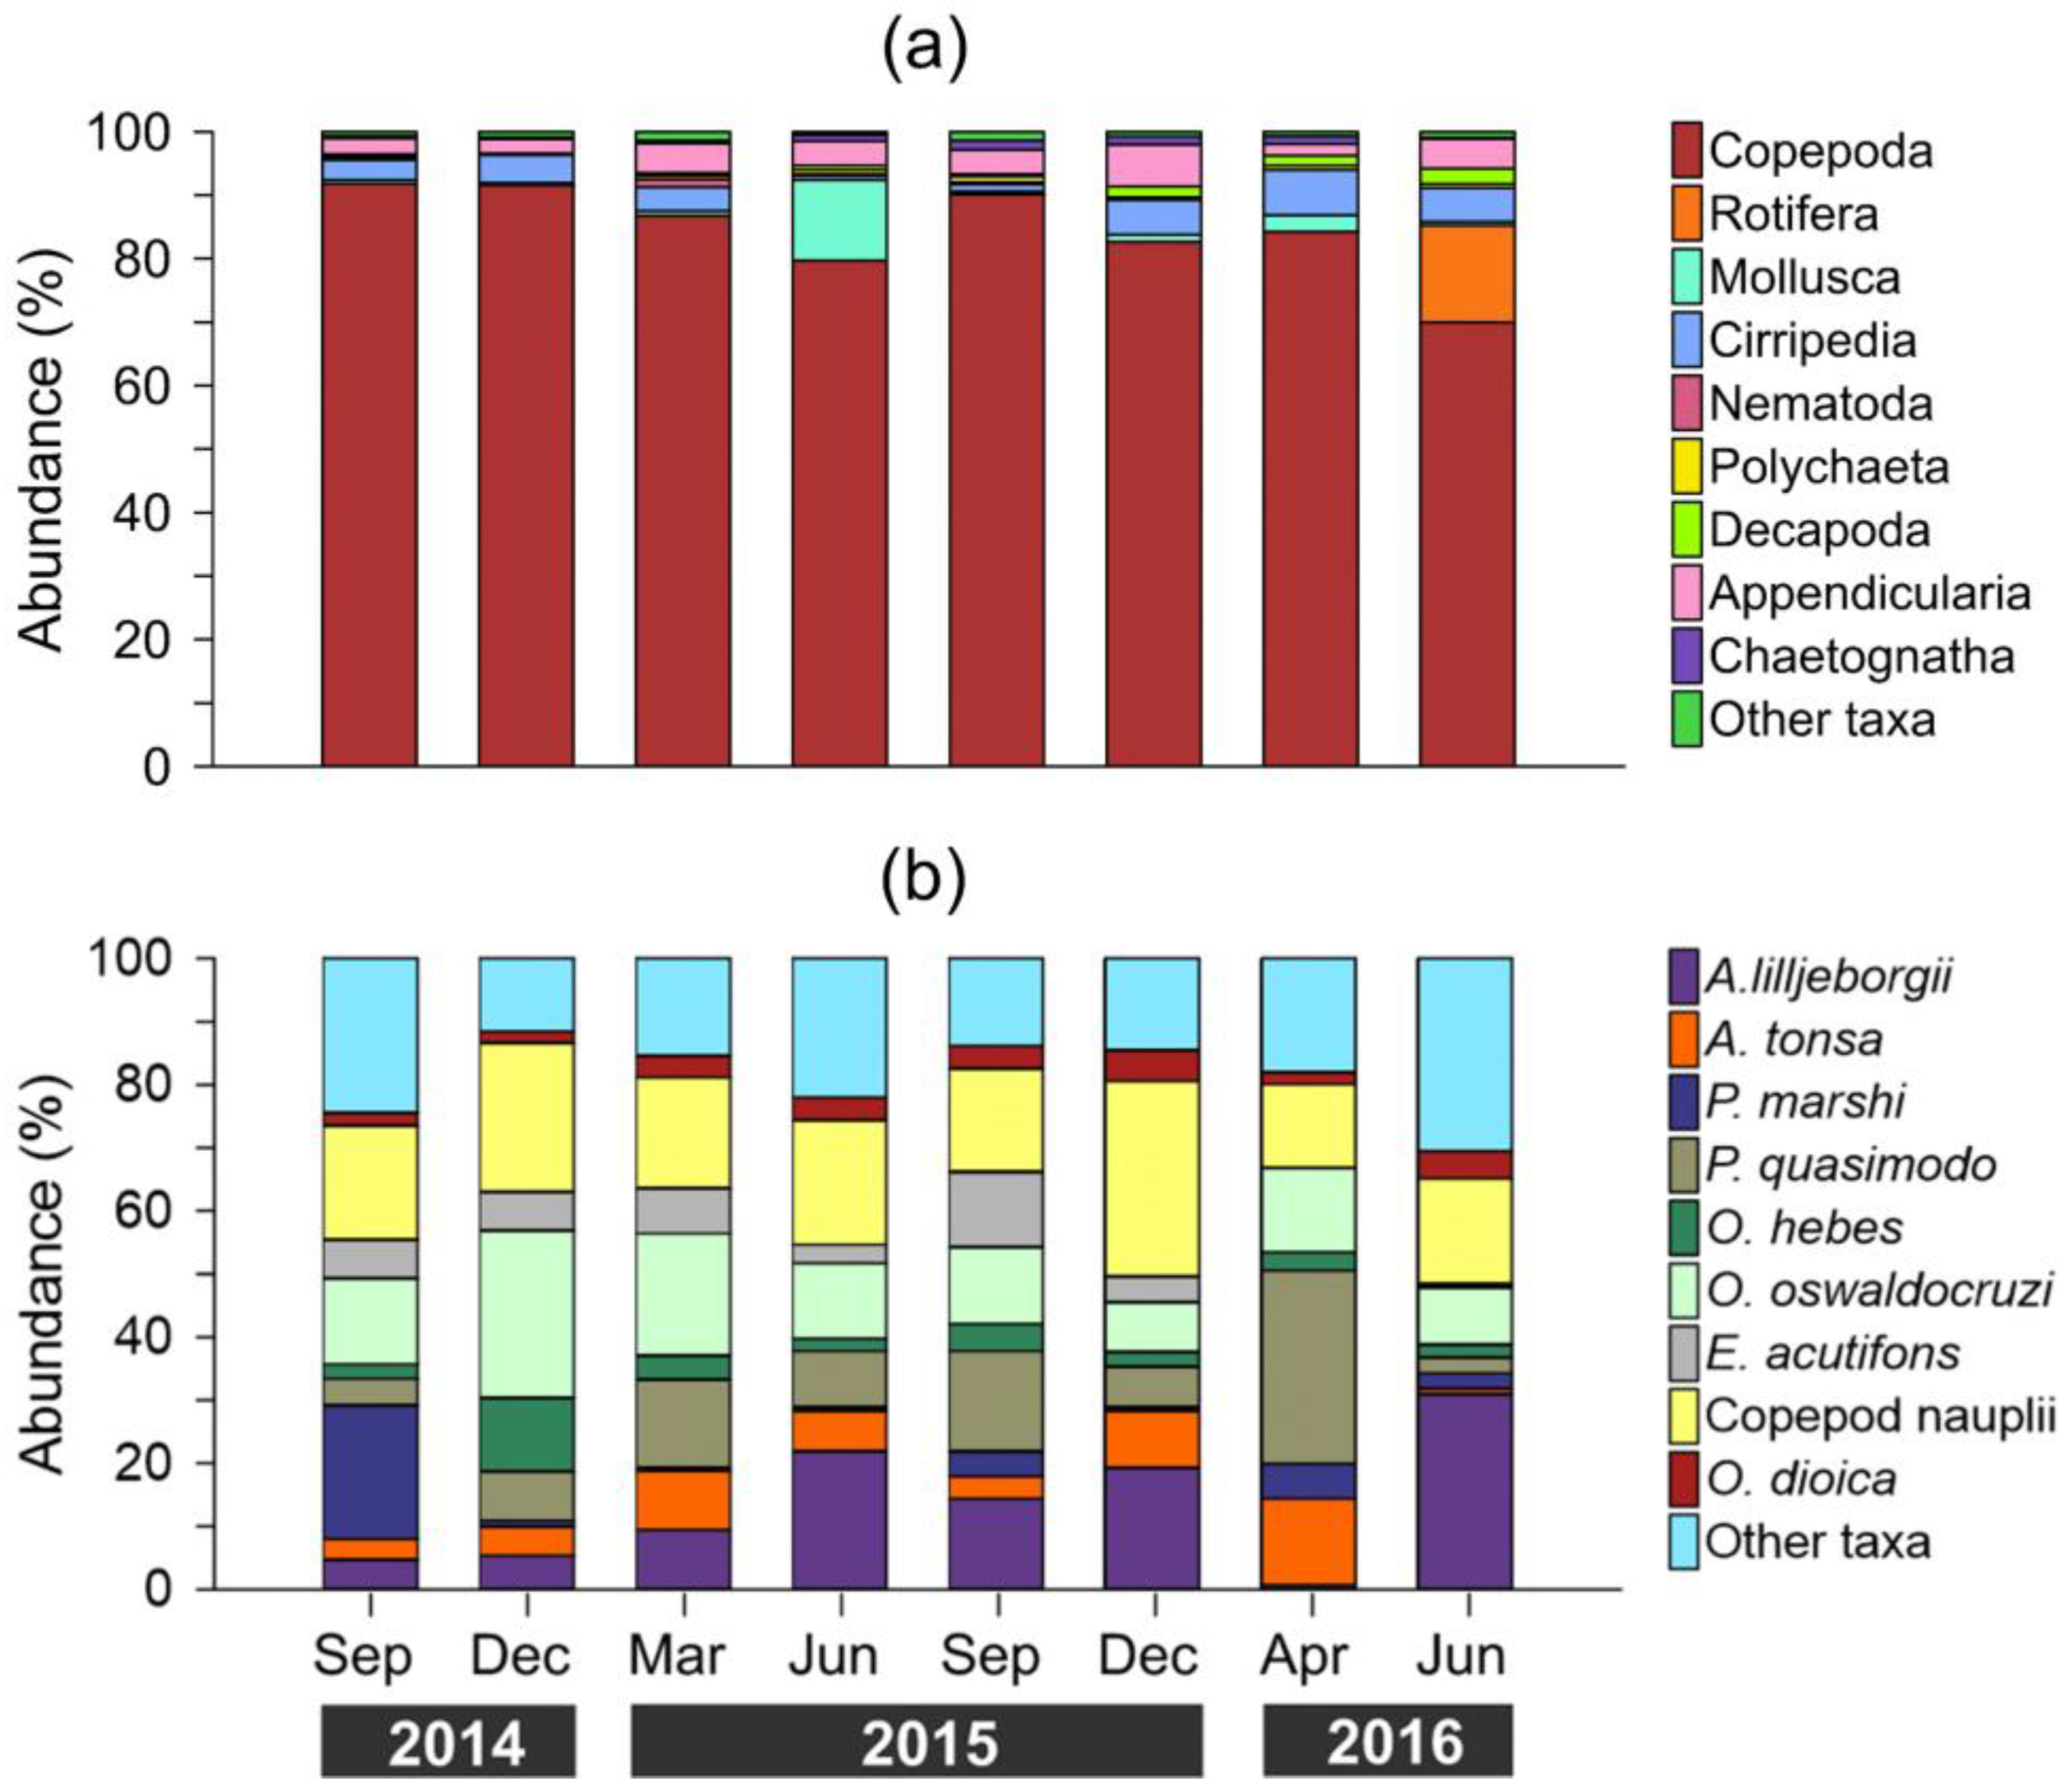
A total of 62 zooplankton taxa were identified during the study, spanning the phyla Ciliophora, Foraminifera, Rotifera, Cnidaria, Platyhelminthes, Annelida, Mollusca, Nematoda, Arthropoda, Echinodermata, Chaetognatha, Bryozoa, Phoronida, and Chordata (Table S1). Copepods dominated the zooplankton community, accounting for a maximum of 92% of overall zooplankton density observed in September and December 2014 (Figure 5a). Among the copepods, 22 species were identified, belonging to three orders: Calanoida, Cyclopoida, and Harpacticoida. The Calanoida was the most abundant and diverse, represented by seven families, 10 genera, and 15 species. Dominant species included Acartia lilljeborgii Giesbrecht, 1889; Acartia tonsa Dana, 1849; Pseudodiaptomus marshi Wright S., 1936; Paracalanus quasimodo Bowman, 1971; along with the cyclopoids Oithona hebes Giesbrecht, 1891 and Oithona oswaldocruzi Oliveira, 1945, and the harpacticoid Euterpina acutifrons (Dana, 1848).
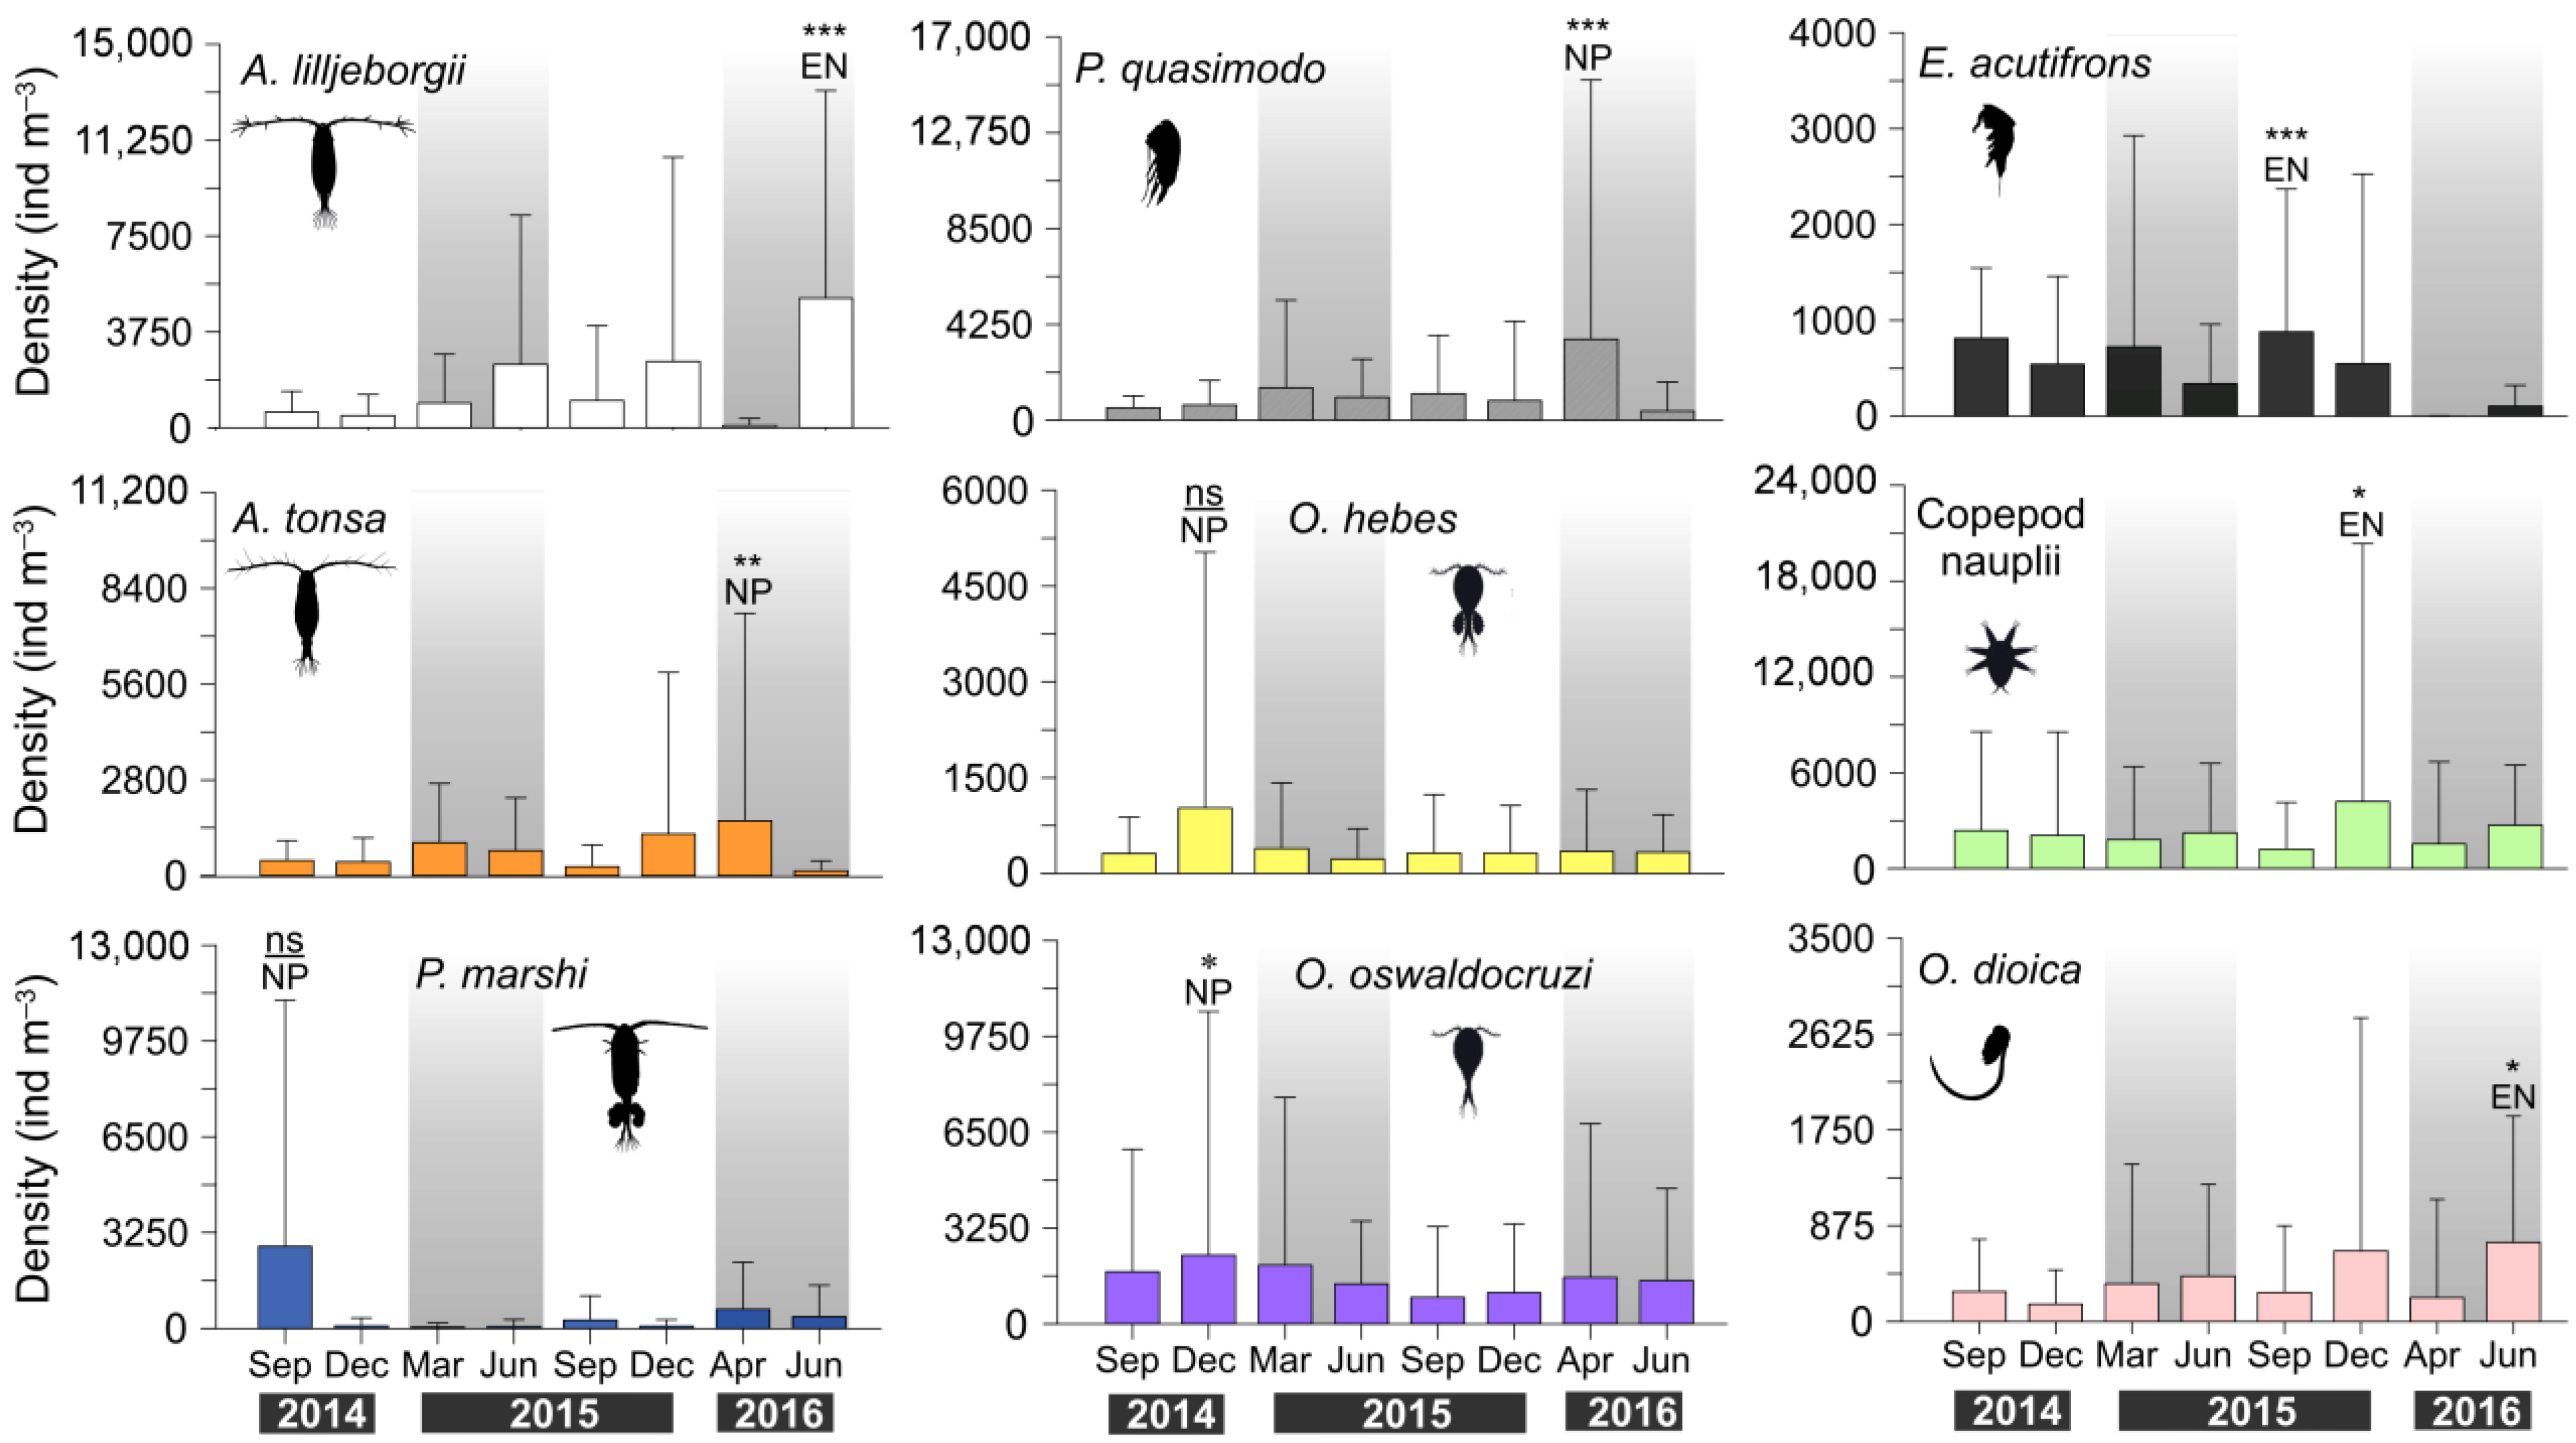
The influence of the El Niño event on species population dynamics was evident on both monthly and seasonal timescales (Supplementary Materials SI, Figure 6). The highest density of A. lilljeborgii (5066 ± 8124 ind m−3; Kruskal–Wallis, H = 60.4, p < 0.0001) was recorded in June 2016 during El Niño, when polihaline conditions prevailed. Accounting for 31% of total zooplankton abundance, this species was a major component of the community (Figure 5b). In contrast, a marked decline in the density of A. lilljeborgii and E. acutifrons was observed during neutral months, with values falling below 100 ind m−3 in April 2016.
Significantly higher densities of A. lilljeborgii were recorded in June 2016 (5066 ± 8124 ind m−3) relative to June 2015 (2483 ± 5833 ind m−3), 2012 (1464 ± 6273 ind m−3; [60]), and 2011 (1.36 ± 1.68 ind m−3; [44]). Rainfall in June 2016 was approximately 39% lower than in 2015 (neutral conditions. This reduction in rainfall during June 2016 led to higher salinity levels, which likely favored Acartia lilljeborgii and contributed to its increase in density. Additionally, when comparing the September samples from 2014 (604.40 ± 821.54 ind m−3) and 2015 (1067 ± 2298 ind m−3), the highest density of A. lilljeborgii was recorded in 2015 (El Niño). A similar pattern was observed for P. quasimodo, although the difference was not significant (p = 0.527). This species demonstrated a high annual frequency of occurrence (≥94%) and exhibited broad salinity tolerance (7.84–36.57). A single density peak was observed in April 2016 (3600 ± 11,494 ind m−3), representing 30.6% of the total zooplankton abundance (Figure 5b).
By contrast, A. tonsa was negatively impacted by the El Niño event, with significany lower density recorded in June 2016 (140.56 ± 292.81 ind m−3; Kruskal–Wallis, H = 20.15, p < 0.01) compared to June 2015 (730.68 ± 1549 ind m−3). The lowest mean density of A. tonsa in September was observed in 2015 (261.96 ± 821.99 ind m−3; Kruskal–Wallis, H = 20.15, p < 0.05; El Niño), whereas the highest density was recorded in 2014 (443.96 ± 578.95 ind m−3; neutral conditions). A comparable trend was observed for Oithona oswaldocruzi and P. marshi in September samples. O. oswaldocruzi and its congener O. hebes exhibited density peaks in December 2014 (Figure 6), contributing 27% and 12%, respectively, to the total zooplankton abundance during this period (Figure 5b).
Zooplankton density comparisons between the Taperaçu estuary and other coastal regions—spanning tropical, subtropical, and temperate zones, under normal and anomalous rainfall conditions, are presented in Table S2 [43,61,62,63,64,65,66,67,68,69,70]. Unidentified copepod nauplii densities were high during the El Niño months of December 2015 and June 2016 (Figure 6), suggesting increased recruitment in some dominant copepod species, particularly A. lilljeborgii. Despite contributing less than 10% to monthly zooplankton abundance, Oikopleura dioica Fol, 1872 was frequently observed throughout the year, with an annual occurrence rate exceeding 76%. Its density fluctuated markedly across months, peaking in June 2016, when it accounted for 4% of the total zooplankton abundance. A significant difference in the density of O. dioica was observed in June between 2015 and 2016 (Kruskal–Wallis, H = 24.67, p < 0.05), with the highest value recorded in the latter year (724.04 ± 1153 ind m−3).
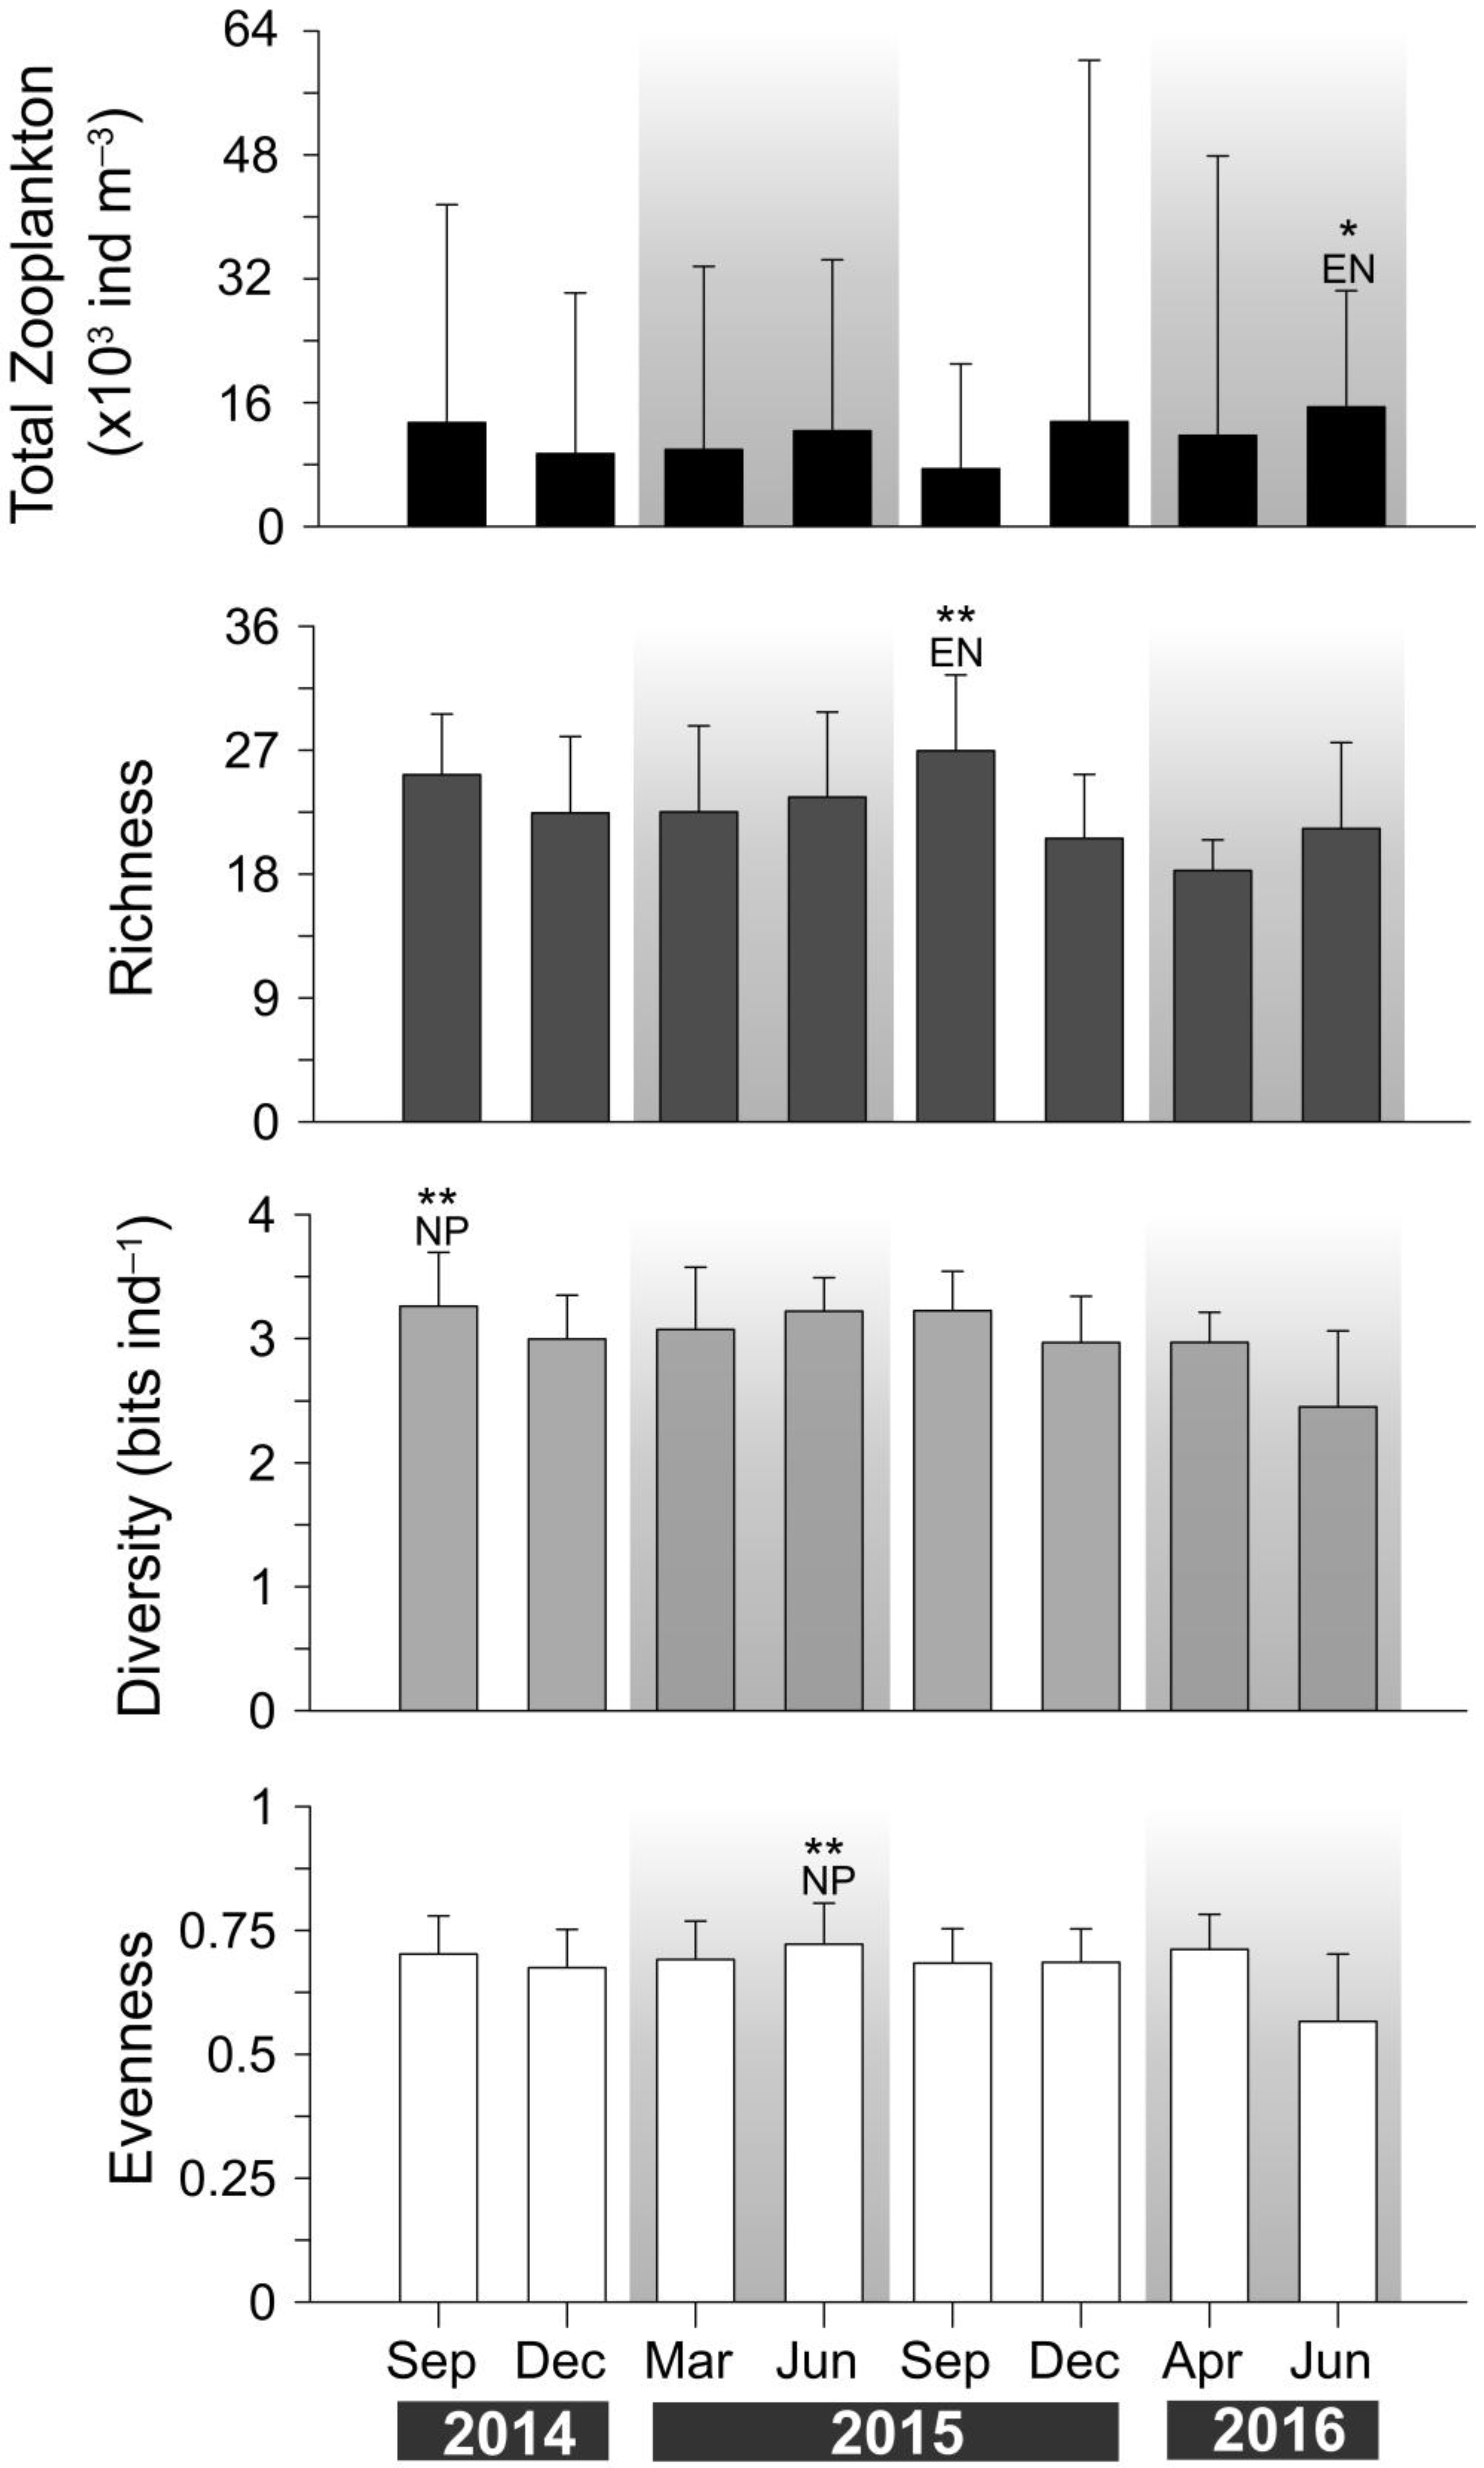
The Taperaçu estuary can be classified as a monthly heterogeneous system with respect to total zooplankton density, with a significant peak (Kruskal–Wallis, H = 37.26, p < 0.05) recorded in June 2016 (15,451 ± 15,014 ind m−3; Figure 7), when densities of several main species increased considerably. Zooplankton species diversity (3.26 ± 0.43 to 2.45 ± 0.61 bits ind−1), evenness (0.72 ± 0.08 to 0.57 ± 0.14), and richness (27 ± 5.50 to 18 ± 2.2) showed significant monthly variation across different study years (Figure 7), the temporal heterogeneity of the Taperaçu estuary in comparison to other tropical estuarine systems worldwide [71,72]. In the resent survey, these tendencies may be linked to the effects of El Niño on the eastern Amazon coastal waters, where decreased rainfall likely led to an increased influx of seawater into the study area, resulting in higher density and prevalence of a small group of coastal and marine species throughout the years (Figure 6 and Supplementary Material SII).
A rise in the proportion of dominant species within the zooplankton community was accompanied by a progressive decrease in both diversity and evenness—a trend that became more pronounced in June 2016 during the El Niño event (Figure 5 and Figure 7). In addition, species richness peaked in September 2015 (26.9 ± 5.50; Kruskal–Wallis, H = 98.96, p < 0.001), coinciding with El Niño.

3.4. Multivariate Analysis

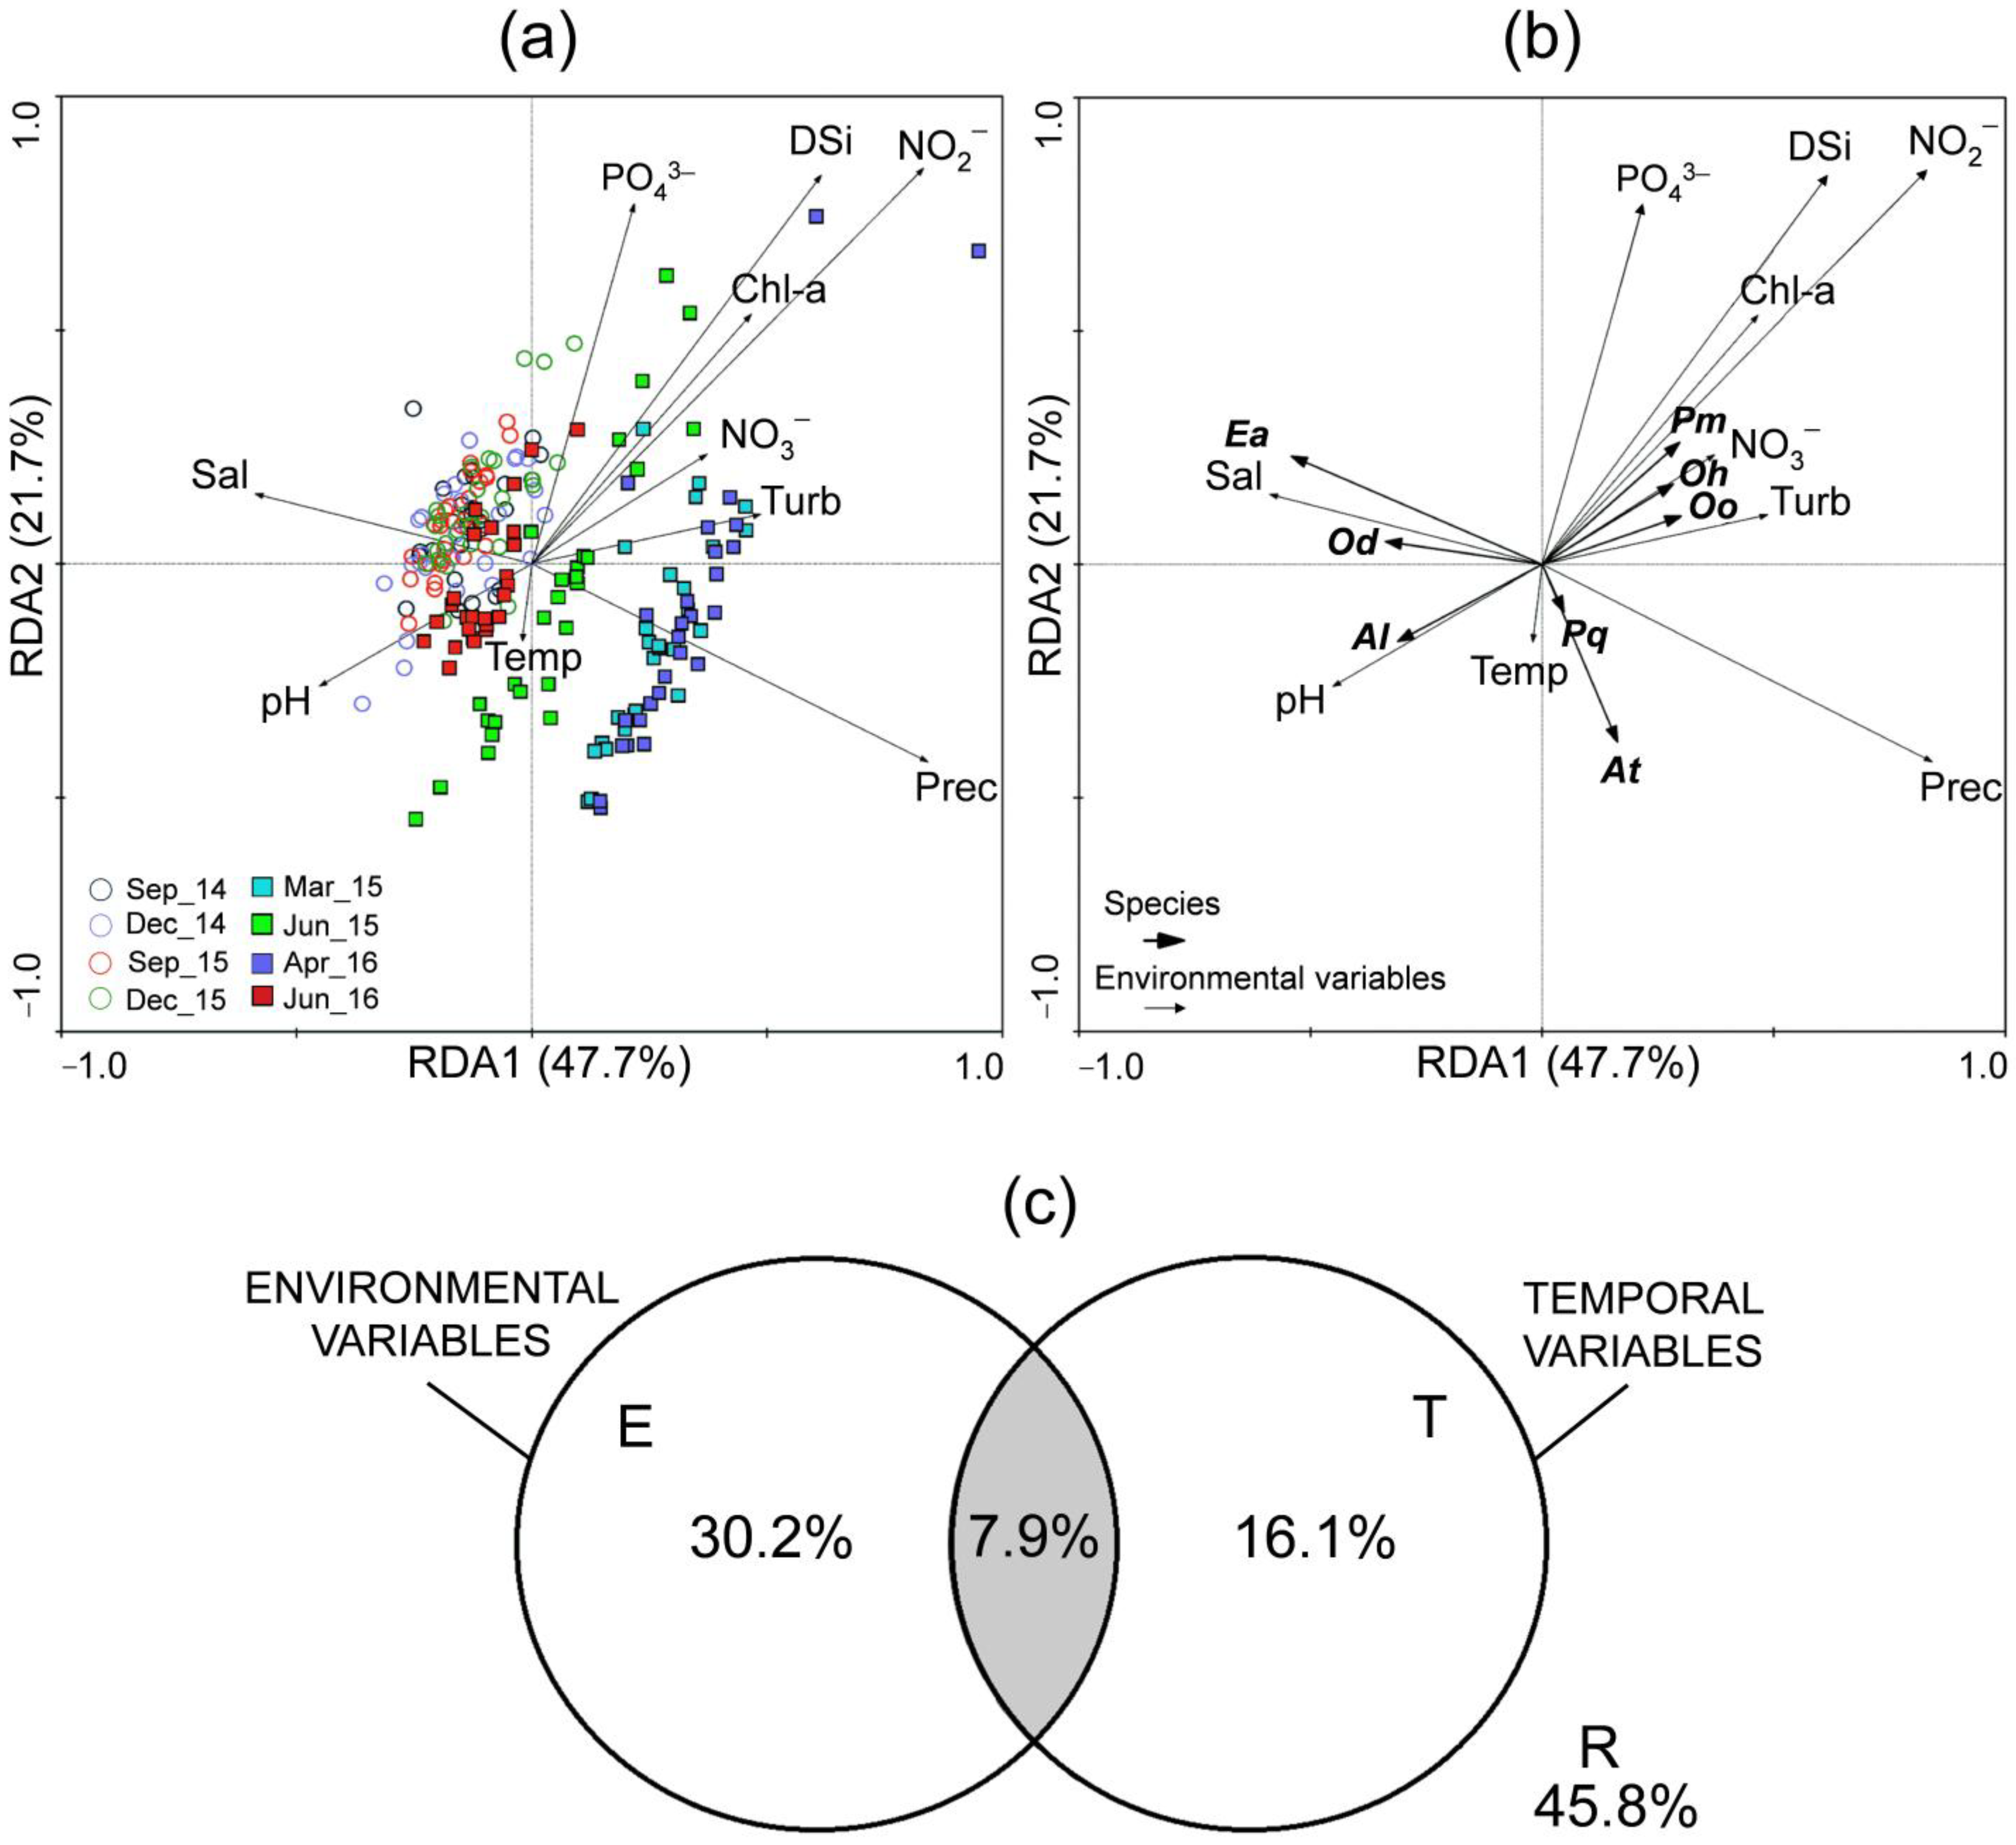
The relationship between the density of the dominant zooplankton species and environmental/temporal variables is illustrated in the RDA biplot ordination diagram (Figure 8a,b). Approximately 69% of the total variation in zooplankton density was explained by these explanatory variables, with the first axis accounting for 47.7% of the variance (λRDA1 = 0.258) and the second axis for 21.7% (λRDA2 = 0.118). While both axes had significant effects (p < 0.001, 9999 permutations), results are presented primarily for RDA1, as this axis explained most of the variance in the density dataset of dominant species.
RDA1 revealed a distinct seasonal gradient: samples collected mostly during the dry months were positioned on the left side of the biplot, characterized by higher salinity and pH. A. lilljeborgii, E. acutifrons, and O. dioica were also positioned on the left, reflecting their higher densities during the dry months. In contrast, samples located on the right side of the RDA biplot were collected during the rainy months and were associated with higher turbidity, concentrations of dissolved inorganic nutrients, and Chl-a. A. tonsa, P. marshi, O. oswaldocruzi, and O. hebes were linked to these rainy-season samples, when salinity was lower. This clear seasonal succession of dominant species underscores their strong association with the first RDA axis.
The variance in the densities of the main zooplankton species explained exclusively by environmental variables (30.2%) was nearly twice that explained by temporal variables (16.1%), while the shared fraction was 7.9% (Figure 8c). This shared variance likely reflects correlations between variables from both categories, such as sampling period and precipitation (Prec) and/or salinity (Sal). However, a large proportion (45.8%) remained unexplained, possibly due to additional factors not considered in this study, such as intra- and interspecific ecological interactions (e.g., competition and predation), which may influence zooplankton population dynamics in the Taperaçu estuary. Based on these analyses, the combined variation in environmental and temporal parameters accounted for more than half (54.2%) of the total variance in the densities of the principal zooplankton species over the study period.

4. Discussion

The 2015–2016 El Niño event was one of the three strongest El Niño events recorded since at least 1950 [73,74], and was associated with unprecedented warming and a more extensive and intense drought in Amazonia [14,75]. The study area exhibits distinctive morphological and morphodynamic features, such as its small size (less than 30 km in length), the absence of direct fluvial discharge, and a highly restricted catchment area. These characteristics contribute to the limited inflow of freshwater into the Taperaçu estuary, a condition that was further aggravated by 2015–2016 El Niño event. This climatic anomaly caused a decline in rainfall, significantly reducing the monthly freshwater input into the estuary. Consequently, hydrological variables were affected leading to changes in the zooplankton community. As previous studies conducted at the same estuary revealed no significant spatial variation in biological and environmental data [34], the current survey focused on temporal variation patterns driven by the effects of a severe drought.
Anomalous climatic events, such as El Niño, are often thought to exert limited influence on zooplankton dynamics in estuarine environments [76,77] due to pronounced seasonal variability and the high adaptability of resident species. Nonetheless, in the present study, the El Niño event resulted in reduced rainfall, triggering both monthly and annual fluctuations in key hydrological variables—including salinity, nutrient concentrations, and phytoplankton biomass (Chl-a). These shifts were accompanied by clear changes in the zooplankton community structure, affecting density, relative abundance, frequency of occurrence, and overall diversity.
A substantial increase in the average density of a small group of species (A. lilljeborgii, E. acutifrons, O. dioica and P. quasimodo) was recorded in the present study when compared to previous studies conducted at the same site. This pattern is also evident across tropical, subtropical, and temperate coastal systems, regardless of whether climatic conditions are typical or anomalous (Supplementary Materials SII). The higher densities of A. lilljeborgii were influenced by the joint effects of high salinity and moderate food availability (phytoplankton biomass), resulting from the pronounced decline in rainfall associated with the El Niño event. The omnivorous copepod Acartia lilljeborgii exhibited a negative correlation with chlorophyll-a concentrations (Figure 8b), indicating a dynamic predator–prey interaction. This pattern suggests that while phytoplankton abundance is shaped by grazing pressure, the population dynamics of A. lilljeborgii are, in turn, influenced by fluctuations in food availability. Future studies incorporating predation rate experiments, however, are essential to validate this hypothesis. A similar trend was reported for E. acutifrons and O. dioica, with the highest densities being recorded during the El Niño months. Despite the relevance of the phytoplankton as a food resource for zooplankton, macrophytic or terrestrial particulate organic carbon (tPOC) can be a vital supplementary food source for estuarine zooplankton, as shown by chemical biomarker analysis and targeted DNA metagenomic studies [78]. These resources play a critical role in sustaining the nutritional needs of micro-, meso-, and macrofaunal grazers within shallow estuarine environments [79], indicating their potential importance within the Taperaçu estuary food web.
In addition to food availability, salinity changes significantly affected the dynamics of the zooplankton community, particularly among its dominant species. A positive monthly trend was observed between salinity and the density of A. lilljeborgii and E. acutifrons, suggesting a preference for more saline conditions by both species. Such conditions may enhance the reproductive capacity of these species throughout both the rainy and dry seasons during El Niño events, leading to density peaks as observed in the present study. In contrast, previous research in the same estuary [44] reported a marked decrease in the density of A. lilljeborgii and E. acutifrons during the La Niña months, when suboptimal salinity conditions likely hindered egg production and hatching success. This behavior is consistent with the findings of [80,81], who observed that during periods of low salinity (<17), the populations of A. lilljeborgii and E. acutifrons exhibited limited reproductive output, which delayed rapid recovery through egg production. Therefore, the monthly variation in species density was influenced not only by reproductive output, but also by external biological and physical factors—particularly salinity—which was influenced by El Niño and La Niña events.
Accordingly, when comparing June across the years 2015 and 2016 (present study), 2013 [63], and 2011 [44] higher densities of A. lilljeborgii were recorded in 2016 (El Niño), when rainfall was lower and salinity was higher than in the other years. When comparing the September samples from 2014 and 2015, significantly higher densities were observed in 2015, the El Niño month with the highest salinity (36.57) recorded during the entire study period. A similar pattern was observed for P. quasimodo, a marine euryhaline species primarily found in highly saline environments across many bays, estuaries, and the continental shelf of South America [67,82,83]. However, the peak in the P. quasimodo density during the rainy season in April 2016, when salinity reached its lowest value (7.84), can be explained by its euryhaline nature, coupled with high phytoplankton productivity. This species is omnivorous [84] but primarily feeds on phytoplankton cells, which may account for its abundance in April when the availability of this resource increased, as indicated by the higher Chl-a concentrations observed. The appendicularian, O. dioica, which thrives in poly-euhaline waters ranging from 26.4 to 32.7 [85], was also positively influenced by salinity and reached the highest densities in the El Niño months (see Figure 6).
The negative effect of the El Niño event on zooplankton density can be observed when comparing the densities of O. oswaldocruzi and P. marshi in the September samples from 2014 and 2015. The lowest densities were recorded in 2015 (El Niño), when salinity was higher than in 2014 (neutral conditions). Although P. marshi may be able to survive and even reproduce in hypersaline waters [86], the anomalous peak in abundance observed in September 2014 at a salinity of 34.81 was unexpected. This finding contrasts with the general pattern previously recorded in the Taperaçu estuary [63] and other systems along the Amazon coast [61], where this species reached high densities during the rainy season months, when salinity ranged from 4 to 15. Given the morphological, morphodynamic, and hydrological features of the Taperaçu estuary, the peak in P. marshi density observed during the dry season—when the system exhibits a distinctly marine character—was likely due to recruitment from the neighboring Caeté estuary, as reported by [43]. The Taperaçu and Caeté estuaries are interconnected via the Taici creek (Figure 1), which channels water from the upper sector of the Caeté to the upper Taperaçu during flood tides [36]. The single annual peak in O. hebes density, a Neotropical species that predominates in the oligo-mesohaline waters of Brazilian estuaries, was recorded during the dry season (December 2014), under euhaline conditions, suggesting that its occurrence in the study area also depended on recruitment from the Caeté estuary. Under experimental conditions, salinities below 6.3 or above 30.0 are lethal to O. hebes [87]. Overall, these results indicate that O. hebes, P. marshi and O. oswaldocruzi, along with other oligo-mesohaline such as P. richardi and freshwater zooplankton taxa (e.g., Diaphanosoma sp.), are not represented by resident populations year-round, or at least not during the dry season, in the Taperaçu estuary.
Another relevant question is whether the impact of the extreme El Niño event on the estuary resulted in significant shifts in zooplankton diversity. Our results indicate that the ecological indices varied as a consequence of changes in community structure. Species richness, diversity, and evenness recorded in the Taperaçu estuary during the 2015–2016 El Niño were relatively high compared to previously reported values under normal rainfall conditions in the same ecosystem [88], based on the same sampling protocol. The increase in these indices observed in the present study was associated with an abnormal decline in regional precipitation and a reduction in fluvial discharge from the Amazon River and 23 adjacent estuaries, which collectively altered the hydrological dynamics along the entire Amazonian coastline. This impact extended to smaller estuarine systems and coastal inlets characterized by limited or intermittent freshwater input, such as the Taperaçu estuary. Consequently, seawater influx increased over the course of the El Niño months, accounting to the temporal heterogeneity of the ecological indices compared to neutral periods. The seawater intrusion into estuarine environments indicates the recruitment of marine organisms, thereby increasing zooplankton diversity. Paradoxically, the lowest mean diversity and evenness were recorded in June 2016 during the El Niño, probably due to the high dominance of A. lilljeborgii and copepod nauplii. Although seawater intrusion is generally associated with increased species diversity due to the influx of marine taxa, the observed decline in Shannon diversity in June 2016 suggests a more complex ecological response. One plausible explanation is that the high salinity during this period may have favored the establishment of a few marine species while simultaneously suppressing estuarine or freshwater taxa adapted to lower salinity conditions. This selective pressure could have led to a temporary reduction in overall species richness and evenness, resulting in lower diversity indices. A reduction in zooplankton diversity often occurs under conditions of species dominance, where one or a few taxa prevail. This decline may also result from the displacement of rare species by more ubiquitous ones, or when the community is composed primarily of fast-reproducing species with limited taxonomic representation. According to [89], such patterns may be associated with increased local environmental constraints (climate, geographical barriers to dispersal, and specific local environmental variables) that act as niche filters or when reduced heterogeneity in habitats and resources allows for the survival of only a few closely related species that share common biological attributes.
In addition to the significant monthly and seasonal variation observed in the ecological indices throughout the three years of the present study, a similar pattern was recorded in the overall zooplankton community density, and in most of its predominant species. The temporal heterogeneity in zooplankton density may be partly attributed to increased salinity fluctuations between drought and neutral months, driven by the ocean–atmosphere El Niño event, which promoted elevated densities of certain species during the study period. This was corroborated by the uni- and multivariate analyses, which showed that the marine-estuarine species (A. lilljeborgii, E. acutifrons, and O. dioica) were dominant in the samples collected during the driest months, such as September 2015 and June 2016 (El Niño event), while the coastal and estuarine species (A. tonsa, P. marshi, O. oswaldocruzi, and O. hebes) predominated in the neutral months (e.g., April 2016). In estuarine waters, population dynamics of zooplankton are controlled primarily by salinity and temperature [90], although the availability and quality of food (bottom-up effects), together with the complex interactions between biotic and abiotic variables also exert a significant influence on this process [91,92]. In the Taperaçu estuary, for example, the combined impact of salinity fluctuations and phytoplankton availability could account for the peaks observed in the density of the copepods A. tonsa (April 2016) and A. lilljeborgii (June 2016).
Environmental and temporal variables accounted for over half of the variance in predominant taxa density, with El Niño–driven environmental changes influencing zooplankton community structure over time. This suggests that El Niño may have strong impacts at the secondary trophic level, which are likely to cascade throughout the estuarine food web, altering food-web dynamics and, consequently, the flow of carbon and energy through the system. As stated above, these events are known to alter salinity, temperature, and nutrient dynamics in estuarine systems, which in turn affect zooplankton abundance and composition [93]. These changes can disrupt trophic interactions and reduce recruitment success for fish populations dependent on specific zooplankton assemblages [94]. Moreover, shifts in zooplankton communities may influence carbon cycling, as variations in grazing pressure and fecal pellet production affect vertical carbon fluxes [95]. In Amazonian estuaries, where environmental variability is already high, El Niño-related anomalies could exacerbate ecological instability, with cascading effects on fisheries productivity and biogeochemical processes.
The considerable residual variance that remained unexplained in the RDA partitioning may have been related to the lack of data on the relevant explanatory factors, such as stochastic processes (dispersal, recruitment, and mortality rates) or predation pressure (top-down effects) [96,97]. Although we did not evaluate dispersal effects, this process may have a fundamental role on the structure of the study community, given that the Taperaçu estuary is not a closed system, and has connections with the Atlantic Ocean, the Maiaú Bay and the Caeté estuary through tidal creeks (Figure 1). In this case, the dispersal of the zooplankton between systems may explain much of the variation not covered by the environmental and temporal factors studied. Although predation may also be an important mechanism of population control in the Amazonian estuaries, its role in the regulation of the density and composition of zooplankton taxa remains poorly understood, and no data are currently available regarding the ecology of pelagic zooplanktivorous fish in the Taperaçu estuary. Previous research on the structure of the larval and adult fish community in the neighboring Caeté estuary [98] identified 48 families, of which the Sciaenidae was the most abundant, with emphasis on the species Stellifer rastrifer (Jordan, 1889) and Stellifer naso (Jordan, 1889). These species are also present in the Taperaçu estuary, and their larval stages predominantly consume A. lilljeborgii and P. marshi copepods as a primary food source [99].
El Niño events have increasingly complex impacts on estuarine and coastal ecosystems, altering precipitation and freshwater discharge regimes, with cascading effects on salinity, nutrient availability, and phytoplankton biomass [34,100,101]. These hydrological changes can lead to the loss of critical habitats, such as seagrass meadows and mangroves [102,103], driven by the increased frequency of heatwaves, more intense storms, extreme droughts, and sea level rise [103]. Such conditions favor episodes of mass mortality among organisms such as mollusks and coral reefs, compromising biodiversity and essential ecosystem services [104,105,106]. In plankton communities, El Niño impacts include (i) suppression of larger trophic components (e.g., diatoms, euphausiids, copepods) in upwelling zones, alongside intensification of smaller components (e.g., flagellates, ciliates) [107]; (ii) significant changes in the population dynamics of key estuarine zooplankton species, such as Acartia spp. [19]; (iii) notable influence on the growth and metabolism of gelatinous zooplankton [108]; and (iv) alterations in the abundance and trophic dynamics of copepods—despite maintained functional diversity—in coastal areas, as observed in the Arvoredo Marine Biological Reserve, associated with increased total suspended solids (TSS+) [109]. These responses of the zooplankton community underscore how the intensification and increased frequency of extreme ENSOs, in the context of climate change, threaten faunal populations, ecosystem resilience, and the carrying capacity of estuarine and coastal systems [110,111], ultimately compromising critical ecosystem services [112,113].
Further insight into zooplankton density and diversity shifts driven by climate-related events may be achieved through studies that include stochastic processes and predator–prey relationships. Severe droughts, such as those triggered by the 2015–2016 El Niño, can produce both short-term and prolonged multiyear impacts on hydrological and biological processes in estuarine ecosystems, providing important clues about future scenarios. Many regions of the world are expected to experience more frequent extreme El Niño events due to greenhouse warming—a pattern already detected across the Amazon region.
In light of increasing climate variability, incorporating an ecological risk assessment of more frequent and extreme ENSO events would significantly enhance the relevance and depth of this study. Recent findings have shown that ENSO-driven anomalies—such as prolonged droughts, altered freshwater discharge, and shifts in salinity and temperature—can profoundly affect the structure, abundance, and trophic dynamics of zooplankton communities in Amazonian estuaries [19,20]. These events may exacerbate habitat fragmentation, disrupt nutrient cycling, and favor opportunistic or tolerant species, leading to reduced biodiversity and altered ecosystem functioning. By integrating a risk assessment framework, this study could better anticipate future ecological scenarios, inform conservation strategies, and contribute to a more robust understanding of how planktonic assemblages respond to compounded climatic stressors in estuarine systems.

Supplementary Materials

The following supporting information can be downloaded at: https://www.mdpi.com/article/10.3390/coasts5040039/s1; Table S1: Zooplankton taxa identified in the Taperaçu estuary, Brazil, showing average density (±SD) and seasonal occurrence under neutral (NP) and El Niño (EN) conditions.; Table S2: Comparison of zooplankton densities for several tropical, subtropical, and temperate estuaries under normal and anomalous rainfall conditions. Abbreviations: EN = El Niño; DE = Drought event; NP = neutral period.

Author Contributions

R.M.d.C. and A.M. designed the study conception. T.R.d.C.S., A.M., and R.M.d.C. drafted the manuscript. T.R.d.C.S., A.M., A.D.P., and M.P.d.A. were responsible for the collection and analyses of the zooplankton and the physical–chemical parameters of the water and conducted data analyses. L.C.C.P. was responsible for the supervision of the physical–chemical analyses in the field and laboratory and provided critical comments in all versions of the manuscript. R.M.d.C. and A.M. were responsible for the general supervision of the zooplankton analyses in the field and laboratory and the final revision of the manuscript. All authors have read and agreed to the published version of the manuscript.

Funding

This research was supported by the Fundação Amazônia de Amparo a Estudos e Pesquisas (FAPESPA, Brazil)—ICAAF: 79/2014; Coordenação de Aperfeiçoamento de Pessoal de Nível Superior (CAPES, Brazil)—Ciências do Mar II 43/2013; Pró-Amazônia 47/2012; and the National Council for Scientific and Technological Development, project “Rede ARMO—Observatório para a Foz do Amazonas (Amazon River Mouth Observatory)”—#445367/2024-5.

Data Availability Statement

The original contributions presented in this study are included in the article/Supplementary Materials. Further inquiries can be directed to the corresponding authors.

Acknowledgments

We thank the Instituto de Estudos Costeiros of the Universidade Federal do Pará and the Grupo de Estudos Marinhos e Costeiros da Amazônia of the Universidade Federal Rural da Amazônia for providing logistical support during the present study. The author Thaynara R.C. Silva is grateful to Coordenação de Aperfeiçoamento de Pessoal de Nível Superior (CAPES, Brazil) for the concession of a master’s scholarship (88882.444892/2019-01). Pereira LCC (#309491/2018-5 and #314037/2021-7) and Costa RM (#314040/2021-8 and #305966/2025-1) would also like to thank the Conselho Nacional de Desenvolvimento Científico e Tecnológico (CNPq, Brazil) for their research grants. Costa RM also acknowledges CAPES for grant #88881.736742/2022-01.

Conflicts of Interest

The authors declare no conflicts of interest.

References

  1. Cai, W.; Santoso, A.; Wang, G.; Yeh, S.-W.; An, S.-I.; Cobb, K.M.; Collins, M.; Guilyardi, E.; Jin, F.-F.; Kug, J.-S.; et al. ENSO and greenhouse warming. Nat. Clim. Chang. 2015, 5, 849–859. [Google Scholar] [CrossRef]
  2. Harari, O.; Garfinkel, C.I.; Ziskin Ziv, S.; Morgenstern, O.; Zeng, G.; Tilmes, S.; Kinnison, D.; Deushi, M.; Jöckel, P.; Pozzer, A.; et al. Influence of Arctic stratospheric ozone on surface climate in CCMI models. Atmos. Chem. Phys. 2019, 19, 9253–9268. [Google Scholar] [CrossRef]
  3. Capotondi, A.; Wittenberg, A.T.; Newman, M.; Di Lorenzo, E.; Yu, J.-Y.; Braconnot, P.; Cole, J.; Dewitte, B.; Giese, B.; Guilyardi, E.; et al. Understanding ENSO diversity. Bull. Am. Meteorol. Soc. 2015, 96, 921–938. [Google Scholar] [CrossRef]
  4. Marengo, J.A.; Alves, L.M.; Soares, W.R.; Rodriguez, D.A.; Camargo, H.; Riveros, M.P.; Pabló, A.D. Two contrasting severe seasonal extremes in tropical South America in 2012: Flood in Amazonia and drought in northeast Brazil. J. Clim. 2013, 26, 9137–9154. [Google Scholar] [CrossRef]
  5. dos Santos, L.O.F.; Machado, N.G.; Querino, C.A.S.; Biudes, M.S. Trends of Climate Extremes and Their Relationships with Tropical Ocean Temperatures in South America. Earth 2024, 5, 844–872. [Google Scholar] [CrossRef]
  6. Marengo, J.A.; Espinoza, J.C. Extreme seasonal droughts and floods in Amazonia: Causes, trends and impacts. Int. J. Climatol. 2016, 36, 1033–1050. [Google Scholar] [CrossRef]
  7. Gloor, M.; Barichivich, J.; Ziv, G.; Brienen, R.; Schöngart, J.; Peylin, P.; Cintra, B.B.L.; Feldpausch, T.; Phillips, O.; Baker, J. Recent Amazon climate as background for possible ongoing and future changes of Amazon humid forests. Glob. Biogeochem. Cycles 2015, 29, 1384–1399. [Google Scholar] [CrossRef]
  8. Pastana, D.N.B.; Modena, É.S.; Wadt, L.H.O.; Neves, E.S.; Martorano, L.G.; Lira-Guedes, A.C.; Souza, R.L.F.; Costa, F.F.; Batista, A.P.B.; Guedes, M.C. Strong El Niño reduces fruit production of Brazil-nut trees in the eastern Amazon. Acta Amaz. 2021, 51, 270–279. [Google Scholar] [CrossRef]
  9. Marengo, J.A.; Cunha, A.P.; Espinoza, J.C.; Fu, R.; Schöngart, J.; Jimenez, J.C.; Zhao, S. The drought of Amazonia in 2023–2024. Am. J. Clim. Chang. 2024, 13, 567–597. [Google Scholar] [CrossRef]
  10. Phillips, O.L.; Aragão, L.E.O.C.; Lewis, S.L.; Fisher, J.B.; Lloyd, J.; López-González, G.; Malhi, Y.; Monteagudo, A.; Peacock, J.; Quesada, C.A.; et al. Drought sensitivity of the Amazon rainforest. Science 2009, 323, 1344–1347. [Google Scholar] [CrossRef]
  11. Lewis, S.L.; Brando, P.M.; Phillips, O.L.; van der Heijden, G.M.F.; Nepstad, D. The 2010 Amazon drought. Science 2011, 331, 554. [Google Scholar] [CrossRef]
  12. Ribeiro, G.G.; Anderson, L.O.; Barretos, N.J.C.; Abreu, R.; Alves, L.; Dong, B.; Lott, F.C.; Tett, S.F.B. Tett. Attributing the 2015/2016 Amazon basin drought to anthropogenic influence. Clim. Resil. Sustain. 2022, 1, e25. [Google Scholar] [CrossRef]
  13. National Oceanic and Atmospheric Administration: NOAA. National Weather Service: Climate Prediction Center. Available online: https://www.cpc.ncep.noaa.gov (accessed on 23 April 2023).
  14. Espinoza, J.C.; Ronchail, J.; Guyot, J.L.; Junquas, C.; Vauchel, P.; Lavado, W.; Drapeau, G.; Pombosa, R. Climate variability and extremes drought in the upper Solimões River (western Amazon Basin): Understanding the exceptional 2010 drought. Geophys. Res. Lett. 2011, 38, L13406. [Google Scholar] [CrossRef]
  15. Andreoli, R.V.; Souza, R.A.F.; Kayano, M.T.; Candido, L.A. Seasonal anomalous rainfall in the central and eastern Amazon and associated anomalous oceanic and atmospheric patterns. Int. J. Clim. 2012, 32, 1193–1205. [Google Scholar] [CrossRef]
  16. Marengo, J.A.; Torres, R.R.; Alves, L.M. Drought in Northeast Brazil-past, present, and future. Theor. Appl. Clim. 2017, 129, 1189–1200. [Google Scholar] [CrossRef]
  17. Marengo, J.A.; Alves, L.M.; Alvala, R.C.S.; Cunha, A.P.; Brito, S.; Moraes, O.L.L. Climatic characteristics of the 2010–2016 drought in the semiarid Northeast Brazil region. Acad. Bras. Cienc. 2018, 90, 1973–1985. [Google Scholar] [CrossRef] [PubMed]
  18. Pereira, L.C.C.; Costa, Á.K.R.; Costa, R.M.; Magalhães, A.; Flores-Montes, M.J.; Jiménez, J.A. Influence of a drought event on hydrological characteristics of a small estuary on the Amazon mangrove coast. Estuar. Coast. 2018, 41, 676–689. [Google Scholar] [CrossRef]
  19. Procópio, A.D.; Costa, R.M.; Magalhaes, A.; Silva, D.C.; Silva, T.R.C.; Fernandes, F.D.S.; Pereira, L.C.C. Effects of the El Niño 2015/2016 event on Acartia tonsa, A. lilljeborgii (Copepoda) production in a Brazilian Amazon estuary. Ecohydrol. Hydrobiol. 2024, 25, 303–314. [Google Scholar] [CrossRef]
  20. de Andrade, M.P.; Magalhães, A.; Sousa, N.D.S.D.S.; Pereira, L.C.C.; da Costa, R.M. Impact of Drought—Induced Hydrological Changes on Copepod Communities in an Amazonian Estuary. Mar. Ecol. 2025, 46, e70027. [Google Scholar] [CrossRef]
  21. Arcos, D.F.; Cubillos, L.A.; Núñez, S.P. The jack mackerel fishery and El Niño 1997–1998 effects off Chile. Prog. Oceanogr. 2001, 49, 597–617. [Google Scholar] [CrossRef]
  22. Jiménez-Quiroz, M.d.C.; Cervantes-Duarte, R.; Funes-Rodríguez, R.; Barón-Campis, S.A.; García-Romero, F.d.J.; Hernández-Trujillo, S.; Hernández-Becerril, D.U.; González-Armas, R.; Martell-Dubois, R.; Cerdeira-Estrada, S.; et al. Impact of “The Blob” and “El Niño” in the SW Baja California Peninsula: Plankton and environmental variability of Bahia Magdalena. Front. Mar. Sci. 2019, 6, 25. [Google Scholar] [CrossRef]
  23. McClatchie, S.; Goericke, R.; Leising, A.; Auth, T.D. State of the California current 2015-16: Comparisons with the 1997-98 El Niño. CalCOFI Rep. 2016, 57, 1–57. [Google Scholar]
  24. Chavez, F.P.; Pennington, J.T.; Castro, C.G.; Ryan, J.P.; Michisaki, R.P.; Schlining, B.; Walz, P.; Buck, K.R.; McFadyen, A.; Collins, C.A. Biological and chemical consequences of the 1997–1998 El Niño in central California waters. Prog. Oceanogr. 2002, 54, 205–232. [Google Scholar] [CrossRef]
  25. Bertrand, A.; Lengaigne, M.; Takahashi, K.; Avadí, A.; Poulain, F.; Harrod, C. El Niño Southern Oscillation (ENSO) Effects on Fisheries and Aquaculture; FAO Fisheries and Aquaculture Technical Paper No. 660; Food and Agriculture Organization of the United Nations: Rome, Italy, 2020. [Google Scholar] [CrossRef]
  26. Romero, F.P. Centro Soberania e Clima. “Sovereignty and Climate Dialogue: Special Issue No. 01—January 2024.” Dialogos-Soberania-e-Clima 3, No. 1 (2024). Available online: https://soberaniaeclima.org.br/wp-content/uploads/2025/04/Dialogos-Soberania-e-Clima-Especial-No_01-Janeiro-2024-English-03-73-84.pdf. (accessed on 28 September 2025).
  27. Mackas, D.L.; Pepin, P.; Verheye, H. Interannual variability of marine zooplankton and their environments: Within- and between-region comparisons. Prog. Oceanogr. 2012, 97, 1–14. [Google Scholar] [CrossRef]
  28. Steinberg, D.K.; Landry, M.R. Zooplankton and the ocean carbon cycle. Ann. Rev. Mar. Sci. 2017, 9, 413–444. [Google Scholar] [CrossRef] [PubMed]
  29. Böckmann, S.; Koch, F.; Meyer, B.; Pausch, F.; Iversen, M.; Driscoll, R.; Laglera, L.M.; Hassler, C.; Trimborn, S. Salp fecal pellets release more bioavailable iron to Southern Ocean phytoplankton than krill fecal pellets. Curr. Biol. 2021, 31, 2737–2746. [Google Scholar] [CrossRef]
  30. Beaugrand, G.; Conversi, A.; Atkinson, A.; Cloern, J.; Chiba, S.; Fonda-Umani, S.; Kirby, R.R.; Greene, C.H.; Goberville, E.; Otto, S.A.; et al. Prediction of unprecedented biological shifts in the global ocean. Nat. Clim. Chang. 2019, 9, 237–243. [Google Scholar] [CrossRef]
  31. Heneghan, R.F.; Everett, J.D.; Blanchard, J.L.; Sykes, P.; Richardson, A.J. Climate-driven zooplankton shifts cause large-scale declines in food quality for fish. Nat. Clim. Chang. 2023, 13, 470–477. [Google Scholar] [CrossRef]
  32. Dam, H.G.; Baumann, H. Climate Change, Zooplankton and Fisheries. In Climate Change Impacts on Fisheries and Aquaculture: A Global Analysis; Phillips, B.F., Pérez-Ramírez, M., Eds.; John Wiley & Sons: Hoboken, NJ, USA, 2017; pp. 851–874. [Google Scholar] [CrossRef]
  33. Ratnarajah, L.; Abu-Alhaija, R.; Atkinson, A.; Batten, S.; Bax, N.J.; Bernard, K.S.; Canonico, G.; Cornils, A.; Everett, J.D.; Grigoratou, M.; et al. Monitoring and modelling marine zooplankton in a changing climate. Nat. Commun. 2023, 14, 564. [Google Scholar] [CrossRef]
  34. Costa, A.K.R.; Pereira, L.C.C.; Jiménez, J.A.; Oliveira, A.R.G.; Flores-Montes, M.J.; Costa, R.M. Effects of Extreme Climatic Events on the Hydrological Parameters of the Estuarine Waters of the Amazon Coast. Estuar. Coast. 2022, 45, 1517–1533. [Google Scholar] [CrossRef]
  35. Asp, N.E.; Schettini, C.A.F.; Siegle, E.; Silva, M.S.; Brito, R.N.B. The dynamics of a frictionally-dominated Amazonic estuary. Braz. J. Oceanogr. 2012, 60, 391–403. [Google Scholar] [CrossRef]
  36. Araújo, W.P.; Asp, N.E. Hydrodynamic connectivity between two macrotidal Amazonian estuaries. J. Coast. Res. Spec. Issue 2013, 65, 1086–1091. [Google Scholar] [CrossRef]
  37. Diretoria de Hidrografia e Navegação: DHN. Tidal Predictions. Available online: http://www.dhn.mar.mil.br/chm/tabuas. (accessed on 28 September 2022).
  38. Instituto Nacional de Meteorologia: INMET. Meteorological Database. Available online: https://portal.inmet.gov.br. (accessed on 21 September 2021).
  39. Jiménez-Muñoz, J.C.; Mattar, C.; Barichivich, J.; Santamaría-Artigas, A.; Takahashi, K.; Malhi, Y.; Sobrino, J.A.; van der Schrier, G. Record-breaking warming and extreme drought in the Amazon rainforest during the course of El Niño 2015–2016. Sci. Rep. 2016, 6, 33130. [Google Scholar] [CrossRef] [PubMed]
  40. Kumar, K.K.; Rajagopalan, B.; Hoerling, M.; Bates, G.; Cane, M. Unraveling the mystery of Indian monsoon failure during El Niño. Science 2006, 314, 115–119. [Google Scholar] [CrossRef] [PubMed]
  41. Wang, G.; Hendon, H.H. Sensitivity of Australian rainfall to inter–El Niño variations. J. Clim. 2007, 20, 4211–4226. [Google Scholar] [CrossRef]
  42. Sekhon, N.; David, C.P.C.; Geronia, M.C.M.; Custado, M.J.G.; Ibarra, D.E. Investigating the response of hydrological processes to El Niño events using a 100-year dataset from the western Pacific Ocean. J. Hydrol. Reg. Stud. 2022, 42, 101174. [Google Scholar] [CrossRef]
  43. Magalhães, A.; Pereira, L.C.C.; Costa, R.M. Relationships between copepod community structure, rainfall regimes, and hydrological variables in a tropical mangrove estuary (Amazon coast, Brazil). Helgol. Mar. Res. 2015, 69, 123–136. [Google Scholar] [CrossRef]
  44. Andrade, M.P.; Magalhães, A.; Pereira, L.C.C.; Flores-Montes, M.J.; Pardal, E.C.; Andrade, T.P.; Costa, R.M. Effects of a La Niña event on hydrological patterns and copepod community structure in a shallow tropical estuary (Taperaçu, Northern Brazil). J. Mar. Syst. 2016, 164, 128–143. [Google Scholar] [CrossRef]
  45. Strickland, J.D.H.; Parsons, T.R. A Practical Handbook of Seawater Analysis; Fisheries Research Board of Canada: Ottawa, ON, Canada, 1972. [Google Scholar]
  46. Grasshoff, K.; Ehrhardt, M.; Kremling, K. Methods of Seawater Analysis; Verlag Chemie: Weinheim, Germany, 1983. [Google Scholar]
  47. Parsons, T.R.; Strickland, J.D.H. Discussion of spectrophotometric determination of marine-plant pigments, with revised equations of ascertaining chlorophylls and carotenoids. J. Mar. Res. 1963, 21, 155–163. [Google Scholar] [CrossRef]
  48. United Nations Educational, Scientific and Cultural Organization (UNESCO). Monographs on Oceanographic Methodology, I. Determination of Photosynthetic Pigments in Sea-Water; UNESCO: Paris, France, 1966. [Google Scholar]
  49. Smith, D.L. A Guide to Marine Coastal Plankton and Marine Invertebrate Larvae; Kendall Hunt Publishing Company: Dubuque, IA, USA, 1977. [Google Scholar]
  50. Boltovskoy, D. Atlas del Zooplancton del Atlántico Sudoccidental y Métodos de Trabajo con el Zooplancton Marino; Instituto Nacional de Investigación y Desarrollo Pesquero (INIDEP): Mar del Plata, Argentina, 1981. [Google Scholar]
  51. Bradford-Grieve, J.M.; Markhaseva, E.L.; Rocha, C.E.F.; Abiahy, B. Copepoda. In South Atlantic Zooplankton; Boltovskoy, D., Ed.; Backhuys Publishers: Leiden, The Netherlands, 1999; pp. 869–1109. [Google Scholar]
  52. World Register of Marine Species: WoRMS. Marine Organisms Database. Available online: https://www.marinespecies.org. (accessed on 7 January 2023).
  53. Shannon, C.E. A mathematical theory of communication. Bell Syst. Tech. J. 1948, 27, 379–423. [Google Scholar] [CrossRef]
  54. Pielou, E.C. Mathematical Ecology; John Wiley & Sons: New York, NY, USA, 1977. [Google Scholar]
  55. Clarke, K.R.; Warwick, R.M. Change in Marine Communities: An Approach to Statistical Analysis and Interpretation; Plymouth Marine Laboratory: Plymouth, UK, 1994. [Google Scholar]
  56. Zar, J.H. Biostatistical Analysis: Pearson New International Edition; Pearson Education: Harlow, UK, 2013. [Google Scholar]
  57. ter Braak, C.J.F.; Šmilauer, P. CANOCO Reference Manual and CanoDraw for Windows User’s Guide: Software for Canonical Community Ordination (Version 4.5); Microcomputer Power: Ithaca, NY, USA, 2002. [Google Scholar]
  58. Legendre, P. Studying beta diversity: Ecological variation partitioning by multiple regression and canonical analysis. J. Plant Ecol. 2008, 1, 3–8. [Google Scholar] [CrossRef]
  59. Borcard, D.; Legendre, P.; Drapeau, P. Partialling out the spatial component of ecological variation. Ecology 1992, 73, 1045–1055. [Google Scholar] [CrossRef]
  60. Leite, N.d.R.; Andrade, T.; Silva, L.; da Costa, Á.K.; Oliveira, A.R.; Magalhães, A.; Flores-Montes, M.; Pereira, L.C.; da Costa, R.M. Secondary production of Acartia tonsa Dana, 1.8.4.9.; A lilljeborgii Giesbrecht, 1889 in an Amazonian estuary (Brazil). Mar. Environ. Res. 2023, 191, 106148. [Google Scholar] [CrossRef] [PubMed]
  61. Barros, F.A.L.; Andrade, M.P.; Silva, T.R.C.; Pereira, L.C.C.; Costa, R.M. Composition and spatio-temporal changes in mesozooplankton diversity and density in an Amazonian estuary (Emboraí Velho, Pará, Brazil). Bol. Mus. Para. Emílio Goeldi-Ciências Nat. 2019, 14, 307–330. [Google Scholar] [CrossRef]
  62. Brugnoli-Olivera, E.; Morales-Ramírez, A. Trophic planktonic dynamics in a tropical estuary, Gulf of Nicoya, Pacific coast of Costa Rica during El Niño 1997 event. Rev. Biol. Mar. Oceanogr. 2008, 43, 75–89. [Google Scholar] [CrossRef]
  63. Leite, N.R.; Magalhães, A.; Silva, L.M.; Andrade, T.P.; Matos, J.B.; Costa, A.K.; Pereira, L.C.C.; Flores-Montes, M.J.; Costa, R.M. Short and medium term variation in the dynamics of the mesozooplankton community of an Amazonian estuary. J. Coast. Res. Spec. Issue 2016, 75, 218–222. [Google Scholar] [CrossRef]
  64. Menéndez, M.C.; Dutto, M.S.; Piccolo, M.C.; Hoffmeyer, M.S. The role of the seasonal and semi-diurnal tidal cycle on mesozooplankton variability in a shallow mixed estuary (Bahía Blanca, Argentina). ICES J. Mar. Sci. 2012, 69, 389–398. [Google Scholar] [CrossRef]
  65. Primo, A.L.; Azeiteiro, U.M.; Marques, S.C.; Martinho, F.; Pardal, M.A. Changes in zooplankton diversity and distribution pattern under varying precipitation regimes in a southern temperate estuary. Estuar. Coast. Shelf Sci. 2009, 82, 341–347. [Google Scholar] [CrossRef]
  66. Sterza, J.M.; Fernandes, L.L. Zooplankton community of the Vitória Bay estuarine system (Southeastern Brazil): Characterization during a three-year study. Braz. J. Oceanogr. 2006, 54, 95–105. [Google Scholar] [CrossRef]
  67. Andrade, M.P.; Magalhães, A.; Pereira, L.C.C.; Costa, R.M. Effects of environmental variables on mesozooplankton dynamics in an Amazonian estuary. Ecohydrol. Hydrobiol. 2022, 22, 511–529. [Google Scholar] [CrossRef]
  68. Rakhesh, M.; Raman, A.V.; Kalavati, C.; Subramanian, B.R.; Sharma, V.S.; Babu, E.S.; Sateesh, N. Zooplankton community structure across an eddy-generated upwelling band close to a tropical bay-mangrove ecosystem. Mar. Biol. 2008, 154, 953–972. [Google Scholar] [CrossRef]
  69. Chew, L.L.; Chong, V.C. Copepod community structure and abundance in a tropical mangrove estuary, with comparisons to coastal waters. Hydrobiologia 2011, 666, 127–143. [Google Scholar] [CrossRef]
  70. Carrasco, N.K.; Perissinotto, R.; Pillay, D. Zooplankton of the St. Lucia Estuary during the current drought cycle: A comparison between open- and closed-mouth conditions. Mar. Ecol. Prog. Ser. 2010, 399, 157–171. [Google Scholar] [CrossRef]
  71. Srichandan, S.; Baliarsingh, S.K.; Lotliker, A.A.; Sahu, B.K.; Roy, R.; Nair, T.B. Unravelling tidal effect on zooplankton community structure in a tropical estuary. Environ. Monit. Assess. 2021, 193, 362. [Google Scholar] [CrossRef]
  72. Rosas, R.S.; Azevedo-Cutrim, A.C.G.; Cutrim, M.V.J.; da Cruz, Q.S.; Souza, D.S.C.; dos Santos Sá, A.K.D.; Santos, T.P. Spatial heterogeneity of zooplankton community in an eutrophicated tropical estuary. Aquat. Sci. 2024, 86, 102. [Google Scholar] [CrossRef]
  73. Huang, B.; L’Heureux, M.; Hu, Z.-Z.; Zhang, H.-M. Ranking the strongest ENSO events while incorporating SST uncertainty. Geophys. Res. Lett. 2016, 43, 9165–9172. [Google Scholar] [CrossRef]
  74. Zhai, P.; Yu, R.; Guo, Y.; Li, Q.; Ren, X.; Wang, Y.; Ding, Y. The strong El Niño of 2015/16 and its dominant impacts on global and China’s climate. J. Meteorol. Res. 2016, 30, 283–297. [Google Scholar] [CrossRef]
  75. Malhi, Y.; Román-Cuesta, R.M. Analysis of lacunarity and scales of spatial homogeneity in IKONOS images of Amazonian tropical forest canopies. Remote Sens. Environ. 2008, 112, 2074–2087. [Google Scholar] [CrossRef]
  76. Morales-Ramírez, A.; Brugnoli-Olivera, E. El Niño 1997–1998 impact on the plankton dynamics in the Gulf of Nicoya, Pacific coast of Costa Rica. Rev. Biol. Trop. 2001, 49, 103–114. [Google Scholar]
  77. Hopcroft, R.R.; Clarke, C.; Chavez, F.P. Copepod communities in Monterey bay during the 1997–1999 El Niño and La Niña. Prog. Oceanogr. 2002, 54, 251–264. [Google Scholar] [CrossRef]
  78. Harfmann, J.; Kurobe, T.; Bergamaschi, B.; Teh, S.; Hernes, P. Plant detritus is selectively consumed by estuarine copepods and can augment their survival. Sci. Rep. 2019, 9, 9076. [Google Scholar] [CrossRef]
  79. Chen, M.; Kim, D.; Liu, H.; Kang, C.-K. Variability in copepod trophic levels and feeding selectivity based on stable isotope analysis in Gwangyang Bay of the southern coast of the Korean Peninsula. Biogeosciences 2018, 15, 2055–2073. [Google Scholar] [CrossRef]
  80. Ara, K. Daily egg production rate of the planktonic calanoid copepod Acartia lilljeborgi Giesbrecht in the Cananéia Lagoon estuarine system, São Paulo, Brazil. Hydrobiologia 2001, 445, 205–215. [Google Scholar] [CrossRef]
  81. Ara, K. Temporal variability and production of Euterpina acutifrons (Copepoda: Harpacticoida) in the Cananéia Lagoon estuarine system, São Paulo, Brazil. Hydrobiologia 2001, 453, 177–187. [Google Scholar] [CrossRef]
  82. Dias, C.d.O.; Bonecker, S.L.C. Inter-annual variability of planktonic copepods in a Tropical Bay in Southeastern Brazil. Braz. Arch. Biol. Technol. 2008, 51, 731–742. [Google Scholar] [CrossRef]
  83. Figueirêdo, L.G.P.; Meloa, P.A.M.C.; Melo Júnior, M.; Silva, T.A.; Moura, R.L.; Thompson, F.L.; Neumann-Leitão, S. Summer micro- and mesozooplankton from the largest reef system of the South Atlantic Ocean (Abrolhos, Brazil): Responses to coast proximity. J. Sea Res. 2018, 141, 37–46. [Google Scholar] [CrossRef]
  84. Sant’anna, E.E.; Björnberg, T.K.S. Conhecimento atual sobre o comportamento alimentar de copépodos Calanoida em ambientes marinhos. Trab. Ocean. Univ. Fed. Pernamb. 2000, 28, 11–20. [Google Scholar] [CrossRef]
  85. Sato, R.; Ishibashi, Y.; Tanaka, Y.; Ishimaru, T.; Dagg, M.J. Productivity and grazing impact of Oikopleura dioica (Tunicata, Appendicularia) in Tokio Bay. J. Plankton Res. 2008, 30, 299–309. [Google Scholar] [CrossRef]
  86. Medeiros, G.F.; Medeiros, L.S.; Henriques, D.M.F.; Carlos, M.T.L.; Faustino, G.V.B.S.; Lopez, R.M. Current distribution of the exotic copepod Pseudodiaptomus trihamatus Wright, 1937 along the northeastern coast of Brazil. Braz. J. Oceanogr. 2006, 54, 241–245. [Google Scholar] [CrossRef]
  87. Tundisi, J.; Tundisi, T.M. Plankton studies in a mangrove environment, V. Salinity tolerances of some planktonic crustaceans. Bol. Inst. Ocean. 1968, 17, 57–65. [Google Scholar] [CrossRef]
  88. Costa, K.G.; Pereira, L.C.C.; Costa, R.M. Short and long-term temporal variation of the zooplankton in a tropical estuary (Amazon region, Brazil). Bol. Mus. Para. Emílio Goeldi Ciências Nat. 2008, 3, 127–141. [Google Scholar] [CrossRef]
  89. Ren, Z.; Jia, X.; Zhang, Y.; Ma, K.; Zhang, C.; Li, X. Biogeography and environmental drivers of zooplankton communities in permafrost-affected lakes on the Qinghai-Tibet Plateau. Glob. Ecol. Conserv. 2022, 38, e02191. [Google Scholar] [CrossRef]
  90. Lucena-Moya, P.; Duggan, I.C. Correspondence between zooplankton assemblages and the Estuary Environment Classification system. Estuar. Coast. Shelf Sci. 2017, 184, 1–9. [Google Scholar] [CrossRef]
  91. Shi, Z.; Liu, K.; Zhang, S.; Xu, H.; Liu, H. Spatial distributions of mesozooplankton biomass, community composition and grazing impact in association with hypoxia in the Pearl River Estuary. Estuar. Coast. Shelf Sci. 2019, 225, 106237. [Google Scholar] [CrossRef]
  92. Bashevkin, S.M.; Hartman, R.; Thomas, M.; Barros, A.; Burdi, C.E.; Hennessy, A.; Tempel, T.; Kayfetz, K. Five decades (1972–2020) of zooplankton monitoring in the upper San Francisco Estuary. PLoS ONE 2022, 17, e0265402. [Google Scholar] [CrossRef]
  93. Escribano, R.; Daneri, G.; Farías, L.; Gallardo, V.A.; González, H.E.; Gutiérrez, D.; Lange, C.B.; Morales, C.E.; Pizarro, O.; Ulloa, O.; et al. Biological and chemical consequences of the 1997–1998 El Niño in the Chilean coastal upwelling system: A synthesis. Deep. Sea Res. Part II Top. Stud. Oceanogr. 2004, 51, 2389–2411. [Google Scholar] [CrossRef]
  94. Checkley, D.M., Jr.; Barth, J.A. Patterns and processes in the California Current System. Prog. Oceanogr. 2009, 83, 49–64. [Google Scholar] [CrossRef]
  95. Darnis, G.; Geoffroy, M.; Daase, M.; Lalande, C.; Søreide, J.E.; Leu, E.; Renaud, P.R.; Berge, J. Zooplankton fecal pellet flux drives the biological carbon pump during the winter–spring transition in a high-Arctic system. Limnol. Oceanogr. 2024, 69, 1481–1493. [Google Scholar] [CrossRef]
  96. Carpenter, S.R.; Kitchell, J.F.; Hodgson, J.R. Cascading Trophic Interactions and Lake Productivity. BioScience 1985, 35, 634–639. [Google Scholar] [CrossRef]
  97. Rogers, T.L.; Bashevkin, S.M.; Burdi, C.E.; Colombano, D.D.; Dudley, P.N.; Mahardja, B.; Mitchell, L.; Perry, S.; Saffarinia, P. Evaluating top-down, bottom-up, and environmental drivers of pelagic food web dynamics along an estuarine gradient. Ecology 2024, 105, e4274. [Google Scholar] [CrossRef]
  98. Marceniuk, A.P.; Caires, R.A.; Rotundo, M.M.; de Alcântara, R.A.K.; Wosiacki, W.B. The icthyofauna (Teleostei) of the Rio Caeté estuary, northeast Pará, Brazil, with a species identification key from northern Brazilian coast. Pan Am. J. Aquat. Sci. 2017, 12, 31–79. [Google Scholar]
  99. Camargo, M.; Isaac, V. Food categories reconstruction and feeding consumption estimates for the Sciaenid Macrodon ancylodon (Bloch & Schneider), and the congeneric fishes Stellifer rastrifer (Jordan) and Stellifer naso (Jordan) (Pisces, Perciformes) in the Caeté Estuary, Northern Coast of Brazil. Rev. Bras. Zool. 2004, 21, 85–89. [Google Scholar] [CrossRef]
  100. Zhong, Y.; Laws, E.A.; Zhuang, J.; Wang, J.; Wang, P.; Zhang, C.; Liu, X.; Huang, B. Responses of phytoplankton communities driven by differences of source water intrusions in the El Niño and La Niña events in the Taiwan Strait during the early spring. Front. Mar. Sci. 2022, 9, 997591. [Google Scholar] [CrossRef]
  101. Wu, Q.; Wang, X.; He, Y.; Zheng, J. The Relationship between Chlorophyll Concentration and ENSO Events and Possible Mechanisms off the Changjiang River Estuary. Remote Sens. 2023, 15, 2384. [Google Scholar] [CrossRef]
  102. Belarmino, E.; de Nobrega, M.F.; Grimm, A.M.; da Silva Copertino, M.; Vieira, J.P.; Garcia, A.M. Long-term trends in the abundance of an estuarine fish and relationships with El Niño climatic impacts and seagrass meadows reduction. Estuar. Coast. Shelf Sci. 2021, 261, 107565. [Google Scholar] [CrossRef]
  103. Wernberg, T.; Thomsen, M.S.; Baum, J.K.; Bishop, M.J.; Bruno, J.F.; Coleman, M.A.; Filbee-Dexter, K.; Gagnon, K.; He, Q.; Murdiyarso, D.; et al. Impacts of climate change on marine foundation species. Annu. Rev. Mar. Sci. 2024, 16, 247–282. [Google Scholar] [CrossRef]
  104. Hughes, T.P.; Kerry, J.T.; Álvarez-Noriega, M.; Álvarez-Romero, J.G.; Anderson, K.D.; Baird, A.H.; Babcock, R.C.; Beger, M.; Bellwood, D.R.; Berkelmans, R.; et al. Global warming and recurrent mass bleaching of corals. Nature 2017, 543, 373–377. [Google Scholar] [CrossRef]
  105. Albano, P.G.; Steger, J.; Bošnjak, M.; Dunne, B.; Guifarro, Z.; Turapova, E.; Hua, Q.; Kaufman, D.S.; Rilov, G.; Zuschin, M. Native biodiversity collapse in the eastern Mediterranean. Proc. R. Soc. B Biol. Sci. 2021, 288, 20202469. [Google Scholar] [CrossRef]
  106. Garrabou, J.; Gómez-Gras, D.; Medrano, A.; Cerrano, C.; Ponti, M.; Schlegel, R.; Bensoussan, N.; Turicchia, E.; Sini, M.; Gerovasileiou, V.; et al. Marine heatwaves drive recurrent mass mortalities in the Mediterranean Sea. Glob. Change Biol. 2022, 28, 5708–5725. [Google Scholar] [CrossRef]
  107. Cordero-Quirós, N.; Miller, A.J.; Pan, Y.; Balitaan, L.; Curchitser, E.; Dussin, R. Physical-Ecological Response of the California Current System to ENSOevents in, ROMS-NEMURO. Ocean Dyn. 2022, 72, 21–36. [Google Scholar] [CrossRef]
  108. Winans, A.K.; Herrmann, B.; Keister, J.E. Spatio-temporal variation in zooplankton community composition in the southern Salish Sea: Changes during the 2015–2016 Pacific marine heatwave. Prog. Oceanogr. 2023, 214, 103022. [Google Scholar] [CrossRef]
  109. Menezes, B.S.; Becker, É.C.; Agnelli, F.B.; Macedo-Soares, L.C.P.D.; Dias, C.D.O.; Freire, A.S. How is copepod functional diversity shaped by 2015–2016 El Niño and seasonal water masses in a coastal ecosystem of Southwest Atlantic? Ocean Coast. Res. 2024, 72 (Suppl. S1), e24006. [Google Scholar] [CrossRef]
  110. Alemany-Rodríguez, E.A.; Hernández-Trujillo, S. Non-predatory mortality assessment of zooplankton in Magdalena Bay, Mexico, during El Niño 2015. Environ. Sci. Pollut. Res. 2025, 32, 3227–3237. [Google Scholar] [CrossRef]
  111. Bates-Góngora, K.V.; Funes-Rodríguez, R.; Saldierna-Martínez, R.J.; Silva-Segundo, C.A.; De Silva-Dávila, R.; González-Rodríguez, E.; Aburto-Oropeza, O.; Ahern, A.L.M.; Gómez-Gutiérrez, J. Ichthyoplankton species assemblages during the 2015–2016 El Niño in the southwest Gulf of California. J. Plankton Res. 2025, 47, fbaf011. [Google Scholar] [CrossRef]
  112. Broughton, J.M.; Codding, B.F.; Faith, J.T.; Mohlenhoff, K.A.; Gruhn, R.; Brenner-Coltrain, J.; Hart, I.A. El Niño frequency threshold controls coastal biotic communities. Science 2022, 377, 1202–1205. [Google Scholar] [CrossRef]
  113. Wang, W.; Chen, G.; Zhao, R.; Gao, C.; Wu, J.; Han, D. Response of estuary ecosystem to El Niño event: A case study in the Yangtze River Estuary. J. Mar. Syst. 2025, 251, 104120. [Google Scholar] [CrossRef]
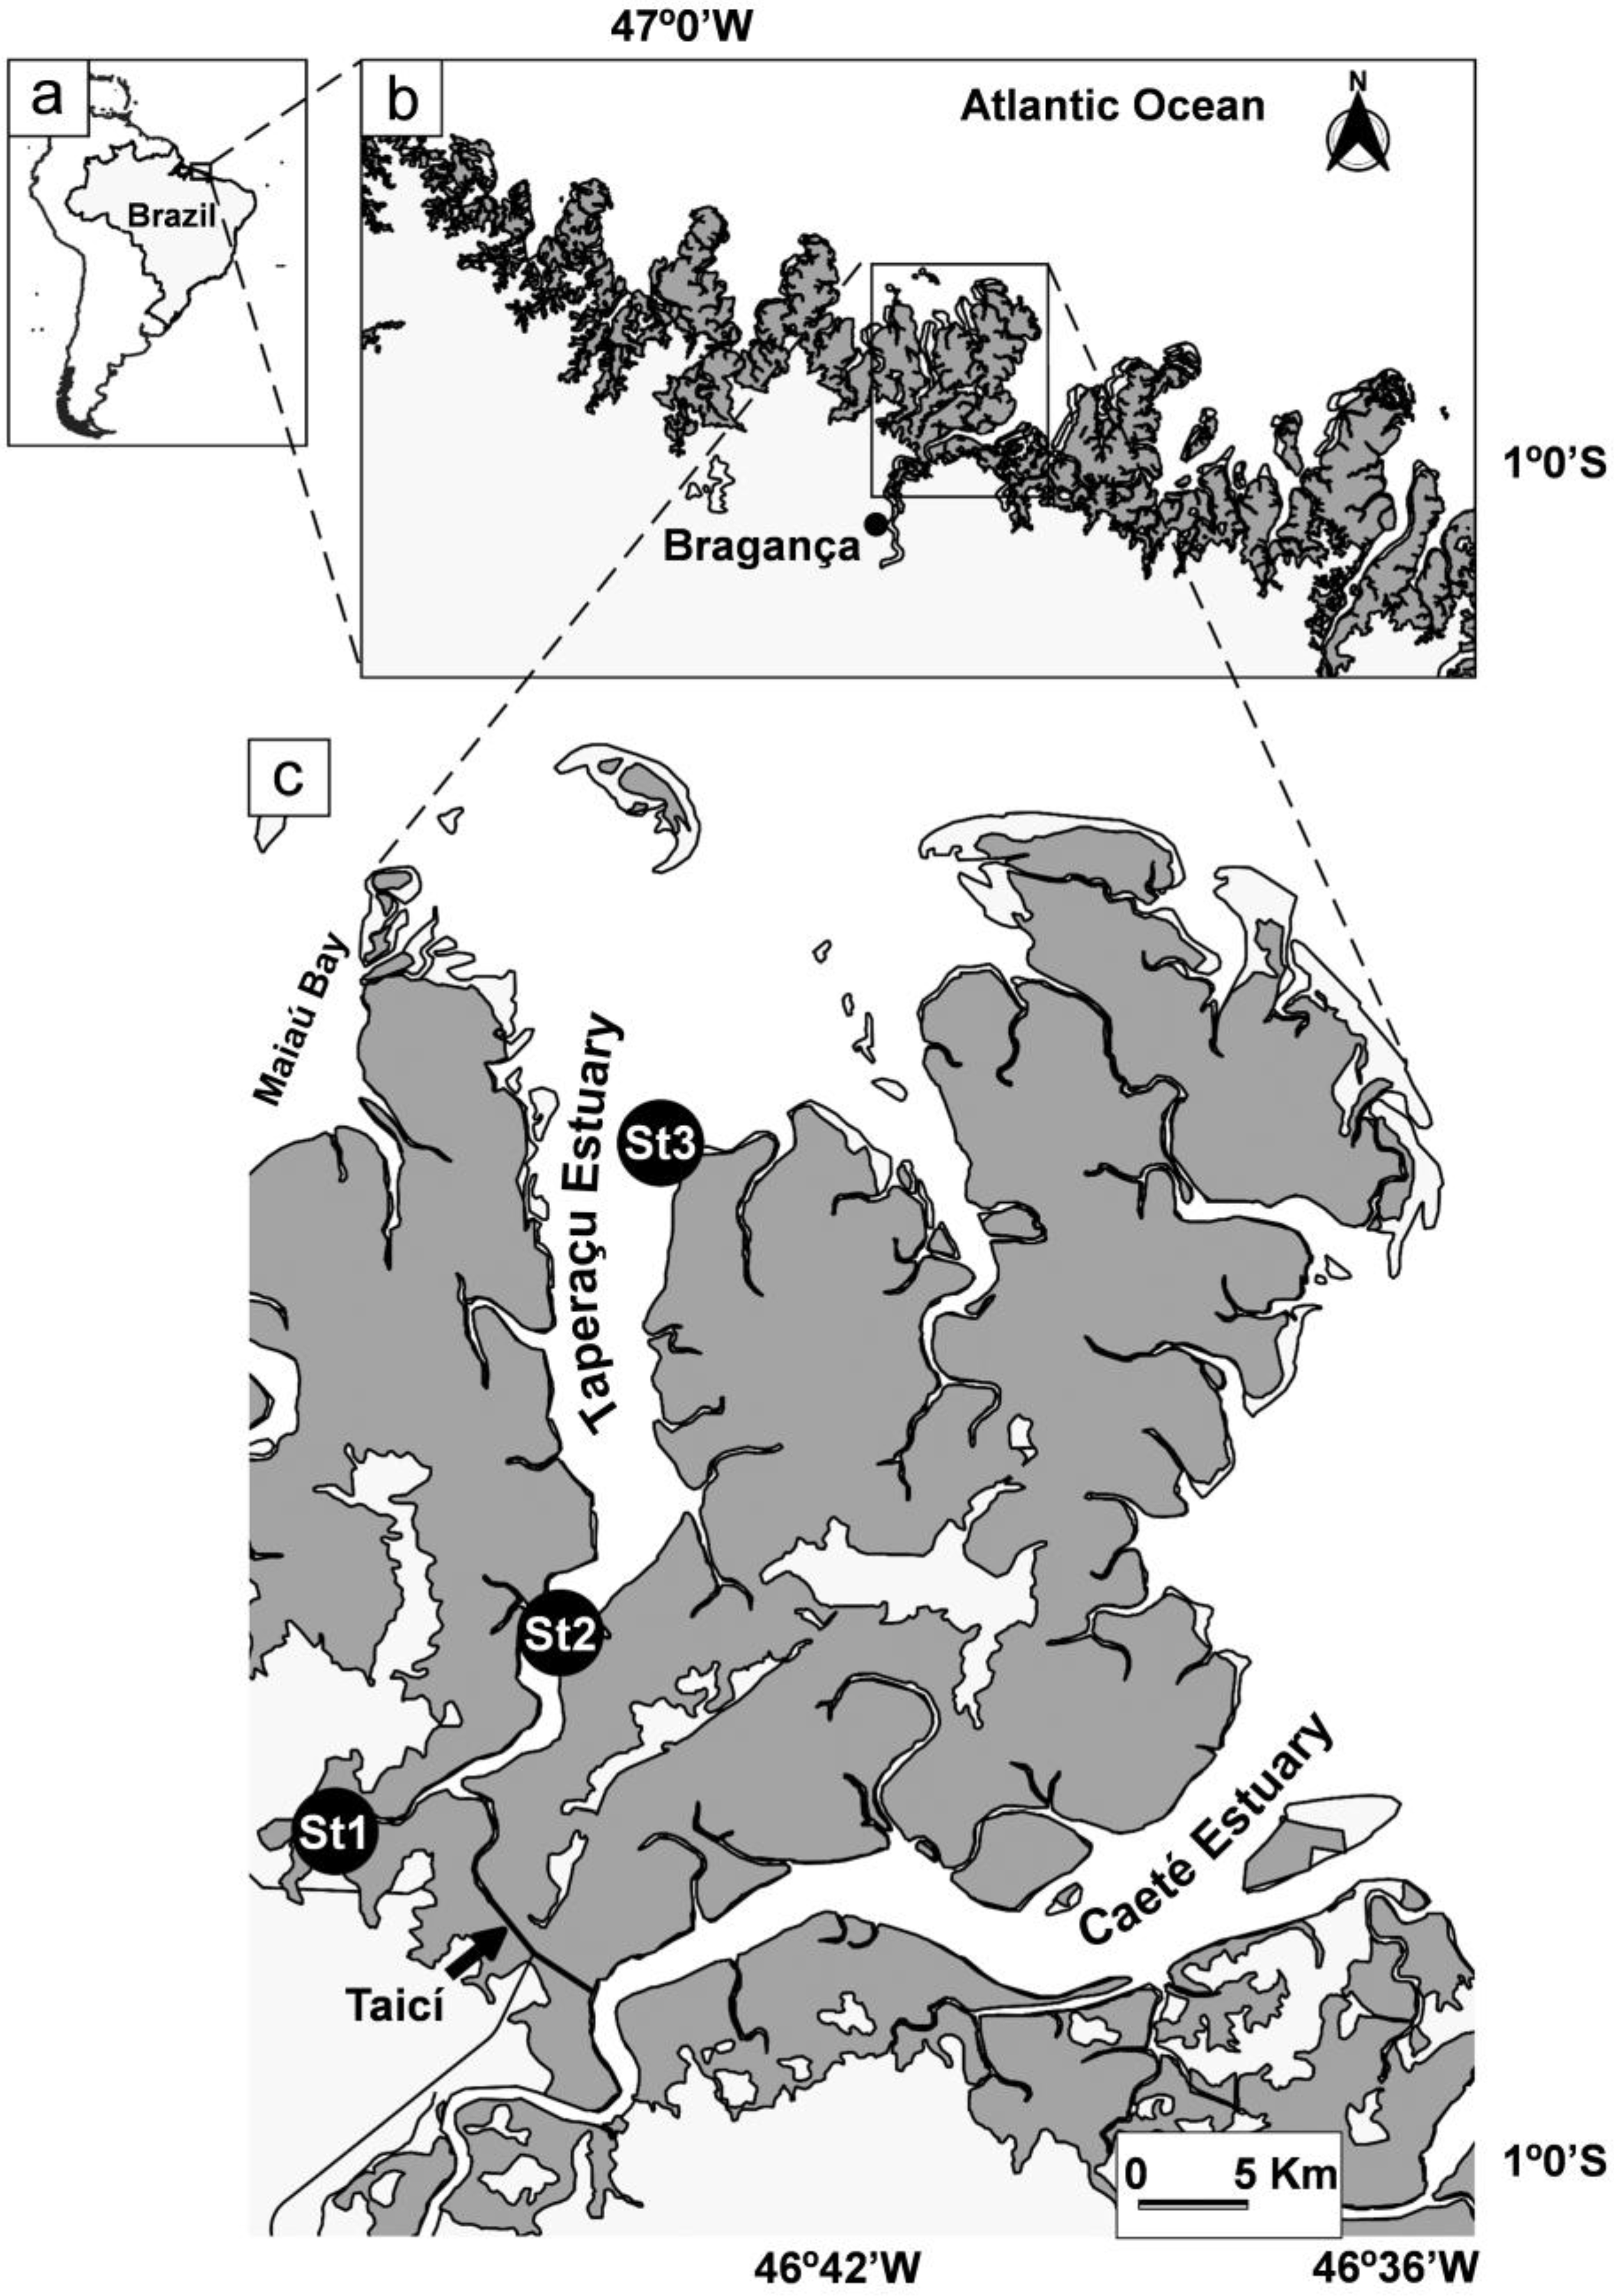
Figure 1. Study area overview: (a) The continent of South America; (b) Geographic position of the Taperaçu estuary along the Amazonian coastline in northern Brazil; (c) Distribution of sampling points within the estuary—St1 in the upper sector, St2 in the middle, and St3 in the lower sector. The Taici creek, shown by the black arrow, serves as a hydrological link between the Taperaçu and Caeté estuaries.
Coasts 05 00039 g001
Figure 2. (a) Warm (red) and cool (blue) conditions based on a threshold of +/− 0.5 °C for the ONI (1955–2016) and their intensities (i.e., weak, moderate, strong, and very strong) in the waters of the tropical Pacific. Large and prolonged El Niño phenomena are indicated by high positive values of this index: note the >+2 values associated with the 1972–1973, 1982–1983, 1997–1998, and (b) recent (2015–2016; present study) very strong El Niño events. Cool (La Niña) anomalies are also shown (modified from [13]).
Coasts 05 00039 g002
Figure 3. (a) Total annual precipitation in the study region between 1982 and 2016 (source: [38]), highlighting the major oscillations in rainfall (EN = El Niño; LN = La Niña; AD = Atlantic SST Dipole; F = Flood event; source: [13]); (b) Monthly average rainfall over the past 34 years, along with total monthly rainfall during the study period (2014–2016); (c) A 25 h salinity time series recorded in the upper estuary during June of each study year; (d) Mean salinity and chlorophyll-a concentrations (±SD) observed under neutral conditions (2014) and El Niño events (2015–2016).
Coasts 05 00039 g003
Figure 4. Mean values (±SD) of environmental variables in the Taperaçu estuary, northern Brazil, during the study period. Gray hatching indicates months corresponding to the rainy season.
Coasts 05 00039 g004
Figure 5. Monthly variation in the relative contribution of (a) all the zooplankton groups and (b) the main zooplankton taxa in the Taperaçu estuary, northern Brazil, during the study period.
Coasts 05 00039 g005
Figure 6. Mean (+SD) density variation in the predominant copepod species recorded in the Taperaçu estuary, in northern Brazil, during the field campaigns conducted during the present study. The gray hatching represents the rainy season months. EN = El Niño; NP = neutral period. The zooplankton peaks are considered ns = not significant; * significant at p < 0.05; ** significant at p < 0.001; *** significant at p < 0.0001.
Coasts 05 00039 g006
Figure 7. Mean (+SD) density of zooplankton (all species) and the ecological indices (species richness, diversity, and evenness) recorded in the Taperaçu estuary, northern Brazil during the field campaigns conducted during the present study. The gray hatching represents the rainy season months. EN = El Niño; NP = neutral period; * significant at p < 0.05; ** significant at p < 0.001.
Coasts 05 00039 g007
Figure 8. RDA ordination diagrams showing (a) biplots of the environmental variables (small arrowheads) and samples (September 2014 through June 2016), and (b) biplots of the environmental parameters (small arrowheads) and the predominant zooplankton species (large arrowheads). Abbreviations: Prec = precipitation; Sal = salinity; pH = hydrogenionic potential; Turb = turbidity; Temp = temperature; Chl-a = chlorophyll-a; NO 2 = nitrite; NO 3 = nitrate; PO 4 3 = orthophosphate; DSi = silicate; Al = Acartia lilljeborgii; At = Acartia tonsa; Pm = Pseudodiaptomus marshi; Ea = Euterpina acutifrons; Oh = Oithona hebes; Oo = Oithona oswaldocruzi; Pq = Paracalanus quasimodo; Od = Oikopleura dioica. The circles denote the dry season months, and the squares, the rainy season months. (c) Venn diagram representing the partitioning of the variation in the density of the predominant zooplankton species between the environmental (left circle) and temporal explanatory variables (right circle). The fractions explained purely by environmental (E) and temporal factors (T), as well as the shared variation, explained by both factors (shaded area) and the residuals of the analysis (R) are shown.
Coasts 05 00039 g008
Disclaimer/Publisher’s Note: The statements, opinions and data contained in all publications are solely those of the individual author(s) and contributor(s) and not of MDPI and/or the editor(s). MDPI and/or the editor(s) disclaim responsibility for any injury to people or property resulting from any ideas, methods, instructions or products referred to in the content.