Article

Hydrodynamic and Climatic Effects on an Amazon Beach Under Unplanned Occupation: A Case Study

by
Remo Luan Marinho da Costa Pereira
1,
Luci Cajueiro Carneiro Pereira
2,* and
Cesar Mosso
3
1
Department of Civil and Environmental Engineering, Civil Engineering School (Campus Nord), Universitat Politècnica de Catalunya BarcelonaTech, c/Jordi Girona 1-3, 08034 Barcelona, Spain
2
Institute of Coastal Studies, Universidade Federal do Pará, Alameda Leandro Ribeiro sn, Aldeia, Braganca 68600-000, PA, Brazil
3
Laboratori d’Enginyeria Marítima, Department of Civil and Environmental Engineering, Civil Engineering School (Campus Nord), Universitat Politècnica de Catalunya BarcelonaTech, c/Jordi Girona 1-3, 08034 Barcelona, Spain
*
Author to whom correspondence should be addressed.
Coasts 2025, 5(3), 29; https://doi.org/10.3390/coasts5030029
Submission received: 1 April 2025 / Revised: 25 July 2025 / Accepted: 2 August 2025 / Published: 8 August 2025

Abstract

This study aimed to evaluate how tidal modulation influences breaking waves on a macrotidal beach along the Amazonian coast under varying climatic conditions. The study utilized medium-term data (2006–2018) from national and international institutions and short-term data (2012–2014) from in situ measurements at Ajuruteua Beach. Offshore winds and waves, predominantly from the northeast, were influenced by severe storms associated with La Niña and El Niño events. During these periods, wave heights exceeded 5 m, with wave periods ranging from 12 to 20 s. Tidal fluctuations (typically 5.0–6.0 m) modulated nearshore wave heights and periods, with variations determined by offshore conditions and climatic influences. Wave heights decreased from 2–5 m offshore to 1–2 m nearshore. At low tide, sandbanks dissipated wave energy, resulting in significantly smaller breaking waves (0.1–0.5 m) compared with high tide (1–1.8 m). The northern part of Ajuruteua Beach experienced a progressive retreat, with a total area loss of 0.15 km2 and a shoreline retreat of 0.360 km between 2007 and 2021. The combination of high hydrodynamic energy and unregulated development led to the destruction of 43 buildings between 2007 and 2013 and an additional 44 houses between 2013 and 2021 within the intertidal zone. Moreover, the absence of coastal management strategies has exacerbated erosion, underscoring the urgent need for planning and regulatory frameworks. Based on the findings of this study, it is recommended that land use be regulated and both short- and long-term physical processes be systematically integrated into future coastal protection planning.

1. Introduction

Coastal processes are governed by various physical drivers, including tides, waves, currents, riverine discharges, winds, and rainfall, operating at local, regional, and global scales [1,2,3]. A standardized understanding of these processes and their variability is essential for recognizing both spatial and temporal changes [4,5,6,7]. At a global scale, studies on these processes have primarily focused on microtidal (tidal range <2.0 m) and, to a lesser extent, mesotidal (tidal range between 2.0 and 4.0 m) beaches [8,9]. However, macrotidal beaches (tidal range >4.0 m) require further investigation, particularly regarding the tidal modulation of wave breaking [10,11].
Throughout the tidal cycle, tides can influence wave breaking when large subtidal or intertidal features, such as sandbanks, mudbanks, flats, or coral reefs, are exposed in the nearshore area [11,12]. During low tide, waves break over these environments, allowing only locally generated short-period wind waves to reach the shoreline. As the tide rises, longer-period offshore waves cross the deeper sandbanks and move toward the shoreline, registering the highest wave heights and periods [13,14].
The Brazilian Amazon coastline is macrotidal and remains protected by nearshore sandbanks during low tide. However, during high tide in spring tidal periods—when the difference between high and low water is at its maximum, following a new or full moon—wave energy (with significant wave heights near 1.8 m) results in the loss of coastal infrastructure and the degradation of dunes and mangrove forests [15,16,17].
Additionally, this coastal region is particularly sensitive to climatic events such as El Niño, La Niña, and drought. These events result in extreme climatic conditions, either causing severe droughts or intense rainfall, driven by variations in sea surface temperatures in the Tropical Atlantic Ocean (drought event causing drier conditions) or the Tropical Pacific Ocean (El Niño event causing drier conditions or a La Niña event leading to increased flooding) [18,19,20,21,22,23].
This situation is particularly concerning given the ecological uniqueness and richness of coastal ecosystems and landscapes, as well as the lack of studies on local coastal dynamics [15,16]. This knowledge gap becomes critical in light of the environmental and socioeconomic challenges faced in the region—such as coastal erosion and climate change—whose impacts extend beyond regional boundaries and carry global significance. Within this context, episodes of coastal erosion have been observed across several Amazonian beaches, primarily in regions affected by unregulated development, driven by the area’s intense hydrodynamic energy and climatic conditions [24,25].
Ajuruteua, one of the most frequented recreational oceanic beaches in the Amazon, has faced documented erosion challenges since the 1990s [26,27,28]. Despite several mitigation initiatives aimed at protecting infrastructure and preserving coastal ecosystems, these efforts have had limited success. One such initiative was the construction of a seawall along the Ajuruteua beachfront in 2021. However, erosion remains a persistent issue, particularly during equinoctial spring tides, with periods of the largest tidal range occurring in March and September when the sun and moon align with the equator. Currently, the study area lacks a formal beach management plan, leaving these issues unresolved.
Based on these findings, this study emphasizes the necessity for governmental authorities to enforce regulations on local territorial occupation to mitigate environmental, social, and economic risks and conflicts. Additionally, it highlights the importance of incorporating physical processes, both short and long term, into future coastal protection and development initiatives. In this context, the primary objective of this study is to assess the effects of tidal modulation on breaking waves at this recreational macrotidal beach, considering different climatic conditions. Given the lack of data on tidal modulation in the region, this study provides valuable insights that can support future beach management plans for Ajuruteua and for other Amazonian beaches with similar characteristics.

2. Materials and Methods

2.1. Study Area

The study area lies in the northeast of the state of Pará, specifically within the municipality of Bragança between Maiáu and Caeté bays (00°46′–1°00′ S and 46°36′–46°44′ W) in the eastern Brazilian Amazon. This coastal stretch encompasses five beaches—Pescadores, Ajuruteua, Farol, Chavascal, and Buiçucanga—located on a coastal island framed by the Caeté River and Taperaçu estuaries. The area features extensive dunes, approximately 25 km of mangrove forest dominated by three mangrove species (Rhizophora mangle L., Avicennia germinans L., and Laguncularia racemosa (L.) C.F. Gaertn) [29,30], salt marshes, and other coastal environments intersected by creeks and tidal channels [31].
The region experiences a humid equatorial climate, with an average annual rainfall of approximately 2500 mm, 75–85% of which occurs during the rainy season, spanning from January to June. The peak rainfall typically occurs between March and May [32]. In contrast, the dry season lasts for the remaining six months, with the driest period falling between September and November. Seasonal variations also affect wind direction and speed. During the dry season, stronger northeasterly winds dominate, with mean monthly speeds ranging from 2.5 to 4.5 m s−1 and peaks reaching 7.0 to 9.5 m s−1. In the rainy season, winds are weaker and come from various directions, with average monthly speeds between 1.5 and 3.0 m s−1, increasing to a maximum of 4.0–7.0 m s−1 [32].
The main local hydrodynamic features include tidal elevations ranging from 4 m (neap tide) to 6 m (spring tide) over semi-diurnal cycles [33]. The macrotidal regime generates strong tidal currents with speeds typically reaching 1.5–2.0 m s−1, following bidirectional flow patterns which depend on the tidal cycle (flood or ebb tide) [34]. Wave heights are attenuated from 3–4 m in deep waters to 1–2 m in nearshore areas, with wave energy modulation influenced by local nearshore sandbanks [11].
Ajuruteua in particular is characterized by a barrier beach ridge that forms an arc along the NW-SE direction (Figure 1) with two distinct sectors: northwestern and southeastern. The beach is sandy (composed of fine to extremely fine sand) with a rather low slope and exposed to high local hydrodynamic energy [15]. The NW sector exhibits more pronounced erosive characteristics. The Caeté-Taperaçu Marine Extractive Reserve encompasses four of Bragança’s beaches; however, Ajuruteua Beach is excluded from the strict protection policies of this sustainable-use conservation unit. There, fishing and tourism constitute the primary economic activities. However, insufficient planning and the absence of effective municipal management have resulted in various environmental and social challenges, such as the destruction of buildings and infrastructure, as well as the degradation of dunes and mangrove ecosystems [15,25].

2.2. Methodology

This study employed two distinct approaches. The first was based on a medium-term data series (2006–2018) obtained from national institutions, including the Brazilian Institute of Meteorology (INMET), the National Waters Agency (ANA), and the Hydrography and Navigation Center of the Brazilian Navy (CHN), as well as from international organizations, such as the National Oceanic and Atmospheric Administration (NOAA). The second approach involved short-term in situ data collection of tides and waves at Ajuruteua Beach conducted between 2012 and 2014. The choice to obtain this data between 2006 and 2018 was due to the occurrence of important climatic events during that period. Another reason for selecting this timeframe was the availability of reliable data from some of the surveyed institutions, as certain stations ceased operating after 2019.
Hourly offshore wind intensities (both average and maximum) and directions, as well as offshore significant wave heights H0s (average height of the highest one-third of all waves measured), periods Tp (defined as the wave period associated with the most energetic waves in the total wave spectrum at a specific point), and directions θ, were obtained from the National Data Buoy Center (NDBC) which holds data from the NOAA (station 41041). Correlations between offshore wind and wave conditions from 2006 to 2018 were analyzed to identify seasonal variations. Additionally, the Oceanic Niño Index (ONI) data, indicating El Niño and La Niña intensities, were acquired from the NOAA for the same period, with events classified according to [22] and government sources [32,35].
Monthly precipitation data from 2006 to 2018 were collected by the INMET from a meteorological station in Tracuateua (1°3′36″ S and 46°52′12″ W), situated 36 m above ground and approximately 17 km west of Bragança. Fluvial discharge records for the Caeté River spanning the same period were sourced from the ANA gauge station (1°25′29″ S and 46°51′2″ W) at Nova Mocajuba, located about 23 km upstream from the upper sector of the Caeté estuary [36].
Tidal elevation corrections were applied based on the reduction level, set at 2.75 m for the Salinópolis station (0°36′53″ S and 47°21′11″ W) according to the Hydrography and Navigation Center of the Brazilian Navy (CHN).
Hydrodynamic data, including the tide elevation, significant wave height (Hs), and wave period (Tp), were gathered in situ during 10 field campaigns conducted between 2012 and 2014. These campaigns lasted between 25 and 168 h and encompassed four distinct scenarios (Table 1). Hydrodynamic data were collected using a bottom-mounted mooring positioned at 0°49′41″ S and 46°36′10″ W at a depth of 4.7 m below the mean water level (MWL), to which wave and tide data loggers (TWR 2050) were attached. Wave sampling was conducted using 512 samples at a burst rate of 4 Hz, with 10-min sampling periods. Tidal water level data were recorded every 2 s, with mean values calculated every 10 min.
Satellite images obtained from DigitalGlobe were extracted using Google Earth (GE) software to monitor coastline changes over different periods (5 June 2007, 28 April 2013, and 7 September 2021). Vegetation, dunes, and built structures were visually interpreted and used as reference markers to define the shoreline in each image. A different color was used for each year to better visualize the differences between them. Polygons were drawn in GE to estimate erosion rates and beach retreat over three time intervals (2007–2013, 2007–2021, and 2013–2021). Colored pins were added to indicate houses that were destroyed in 2007 and 2013 or at risk of destruction in 2021. This information helped further clarify the erosion processes. The available images depict the beach during high tide in 2007 and 2013 and during low tide in 2021.

3. Results

3.1. Forcing Mechanisms

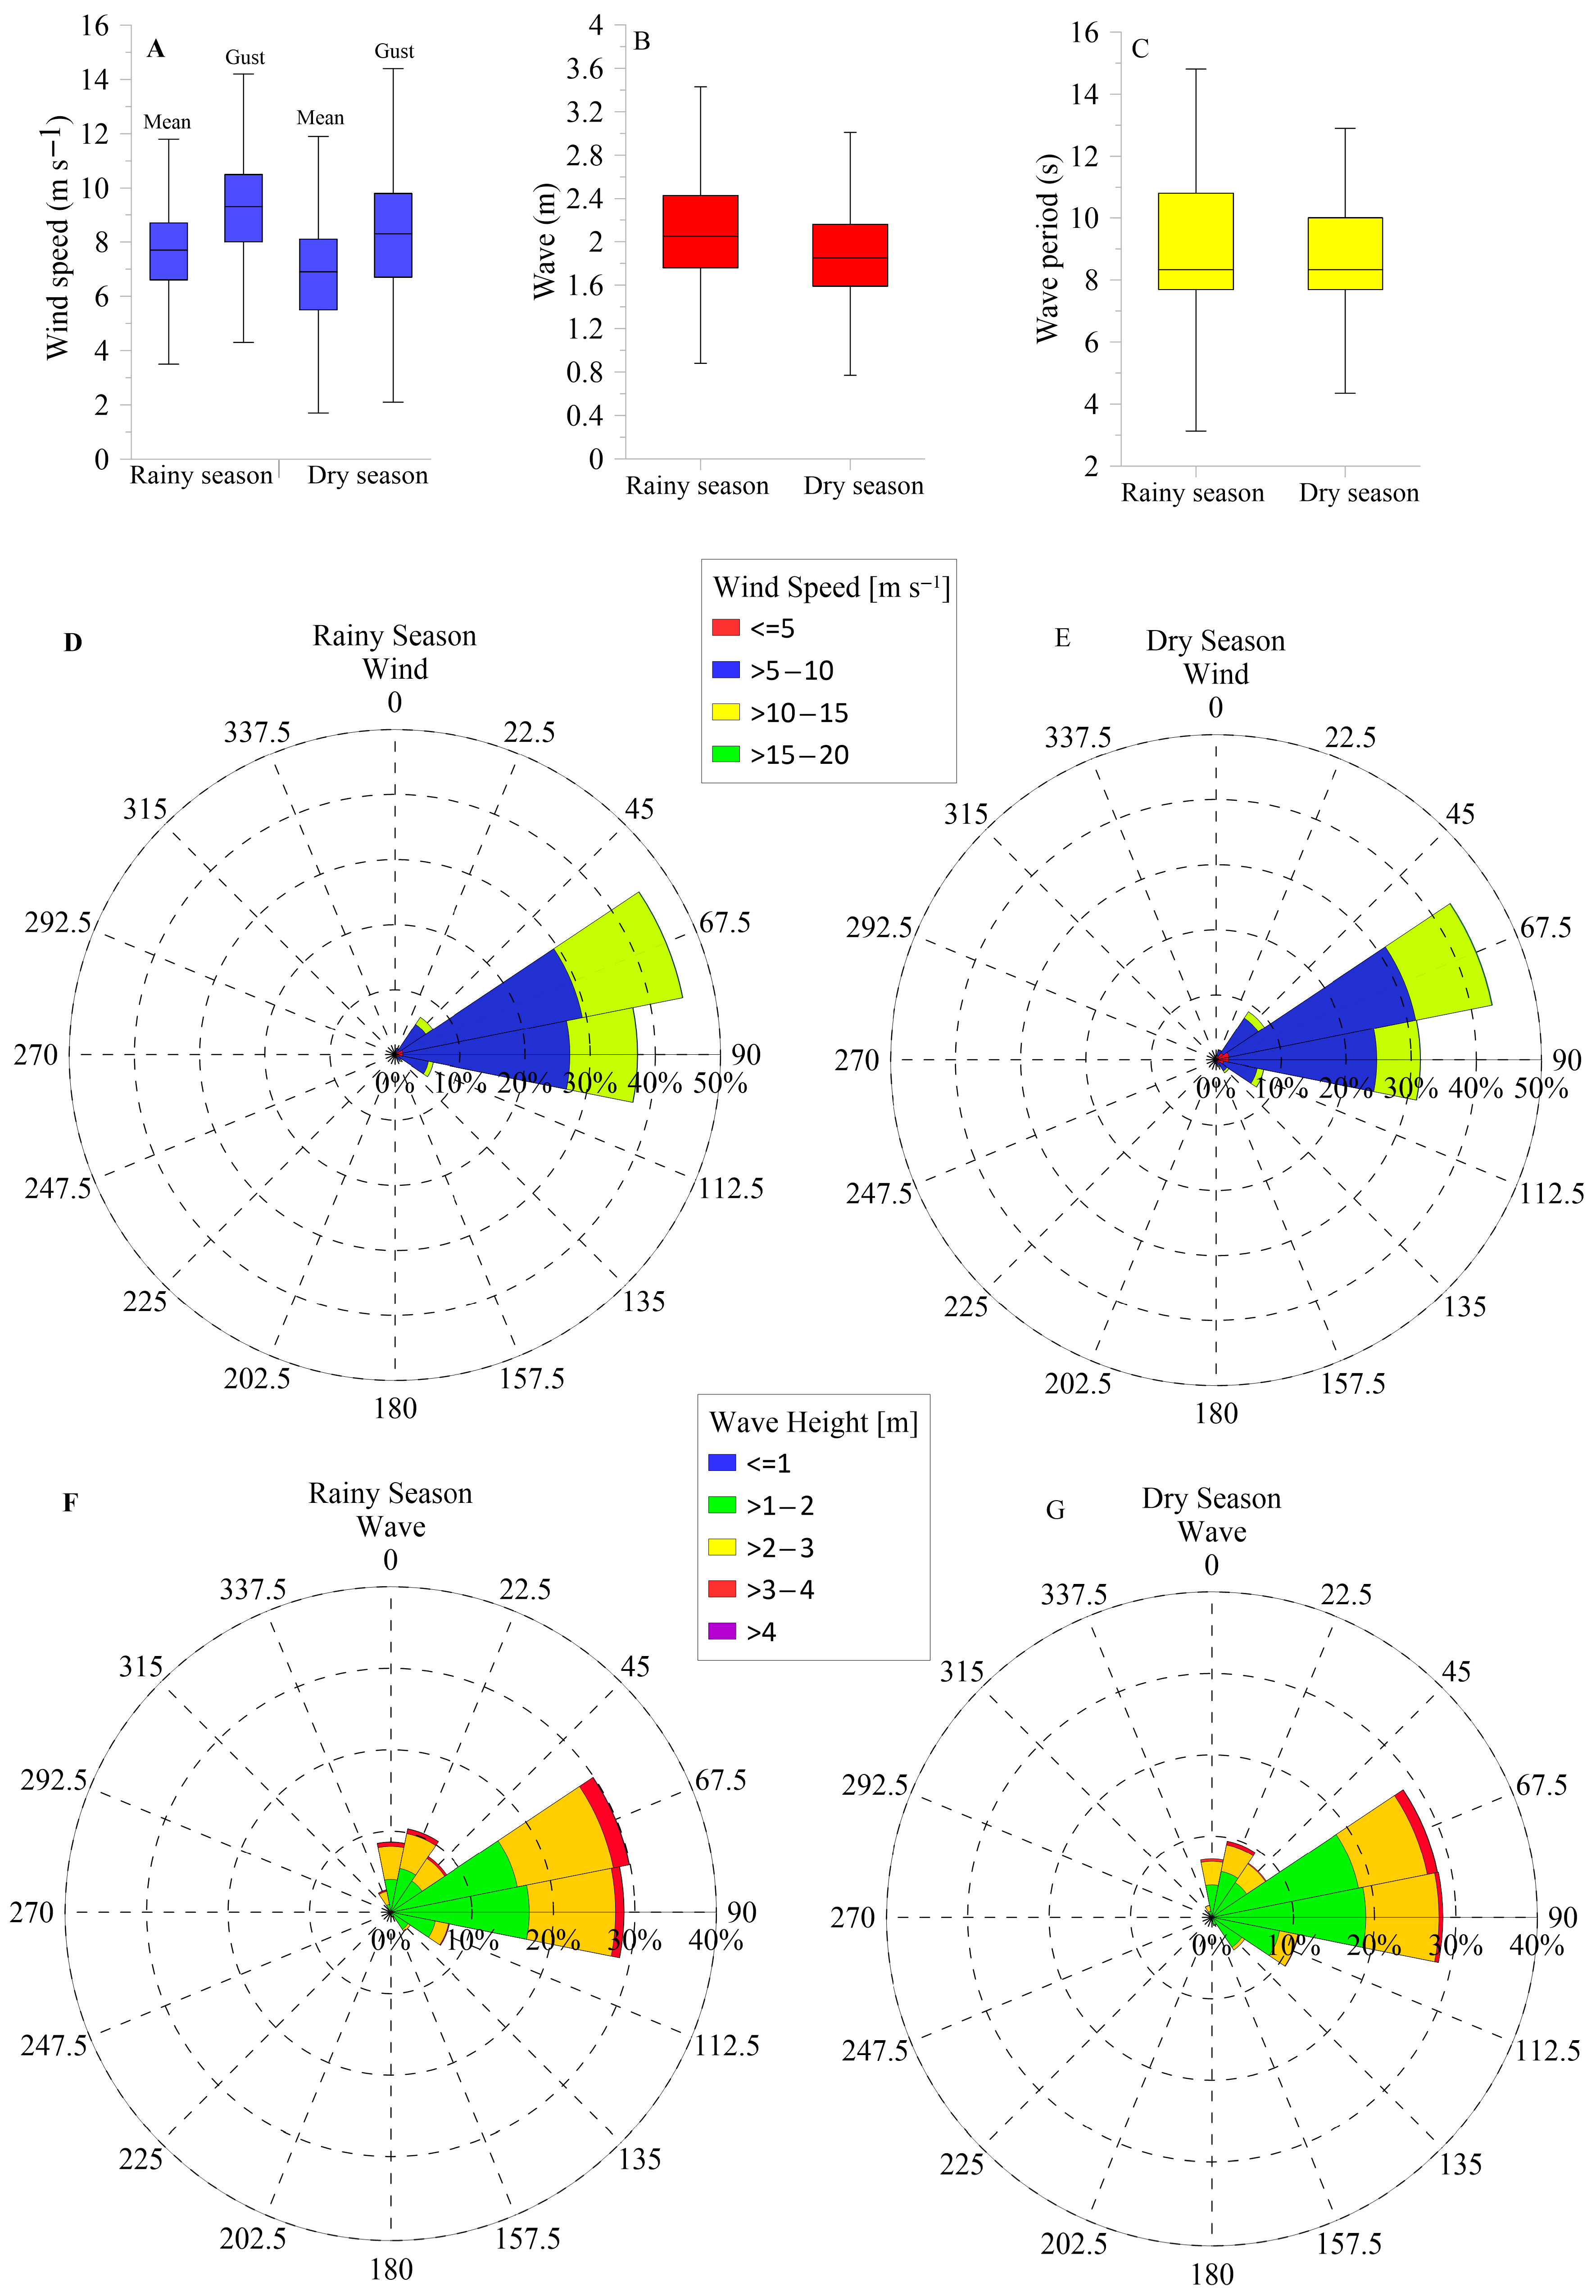
This section provides an analysis of the wind intensities and directions, offshore significant wave heights and periods, rainfall patterns, Oceanic Niño Index (ONI), fluvial discharge rates, and tidal oscillations. Offshore forces indicate that winds and waves predominantly originated from the northeast (45° < θ < 120° N) throughout most of the study period, accounting for 90% of the winds and 70% of the waves. The average and gust wind speeds for these directions were 6.8 ± 1.8 m s−1 and 8.3 ± 2.1 m s−1, respectively. These winds generated significant wave heights (H0s) of 2.0 ± 0.5 m, with associated wave periods of 9.0 ± 2.0 s.
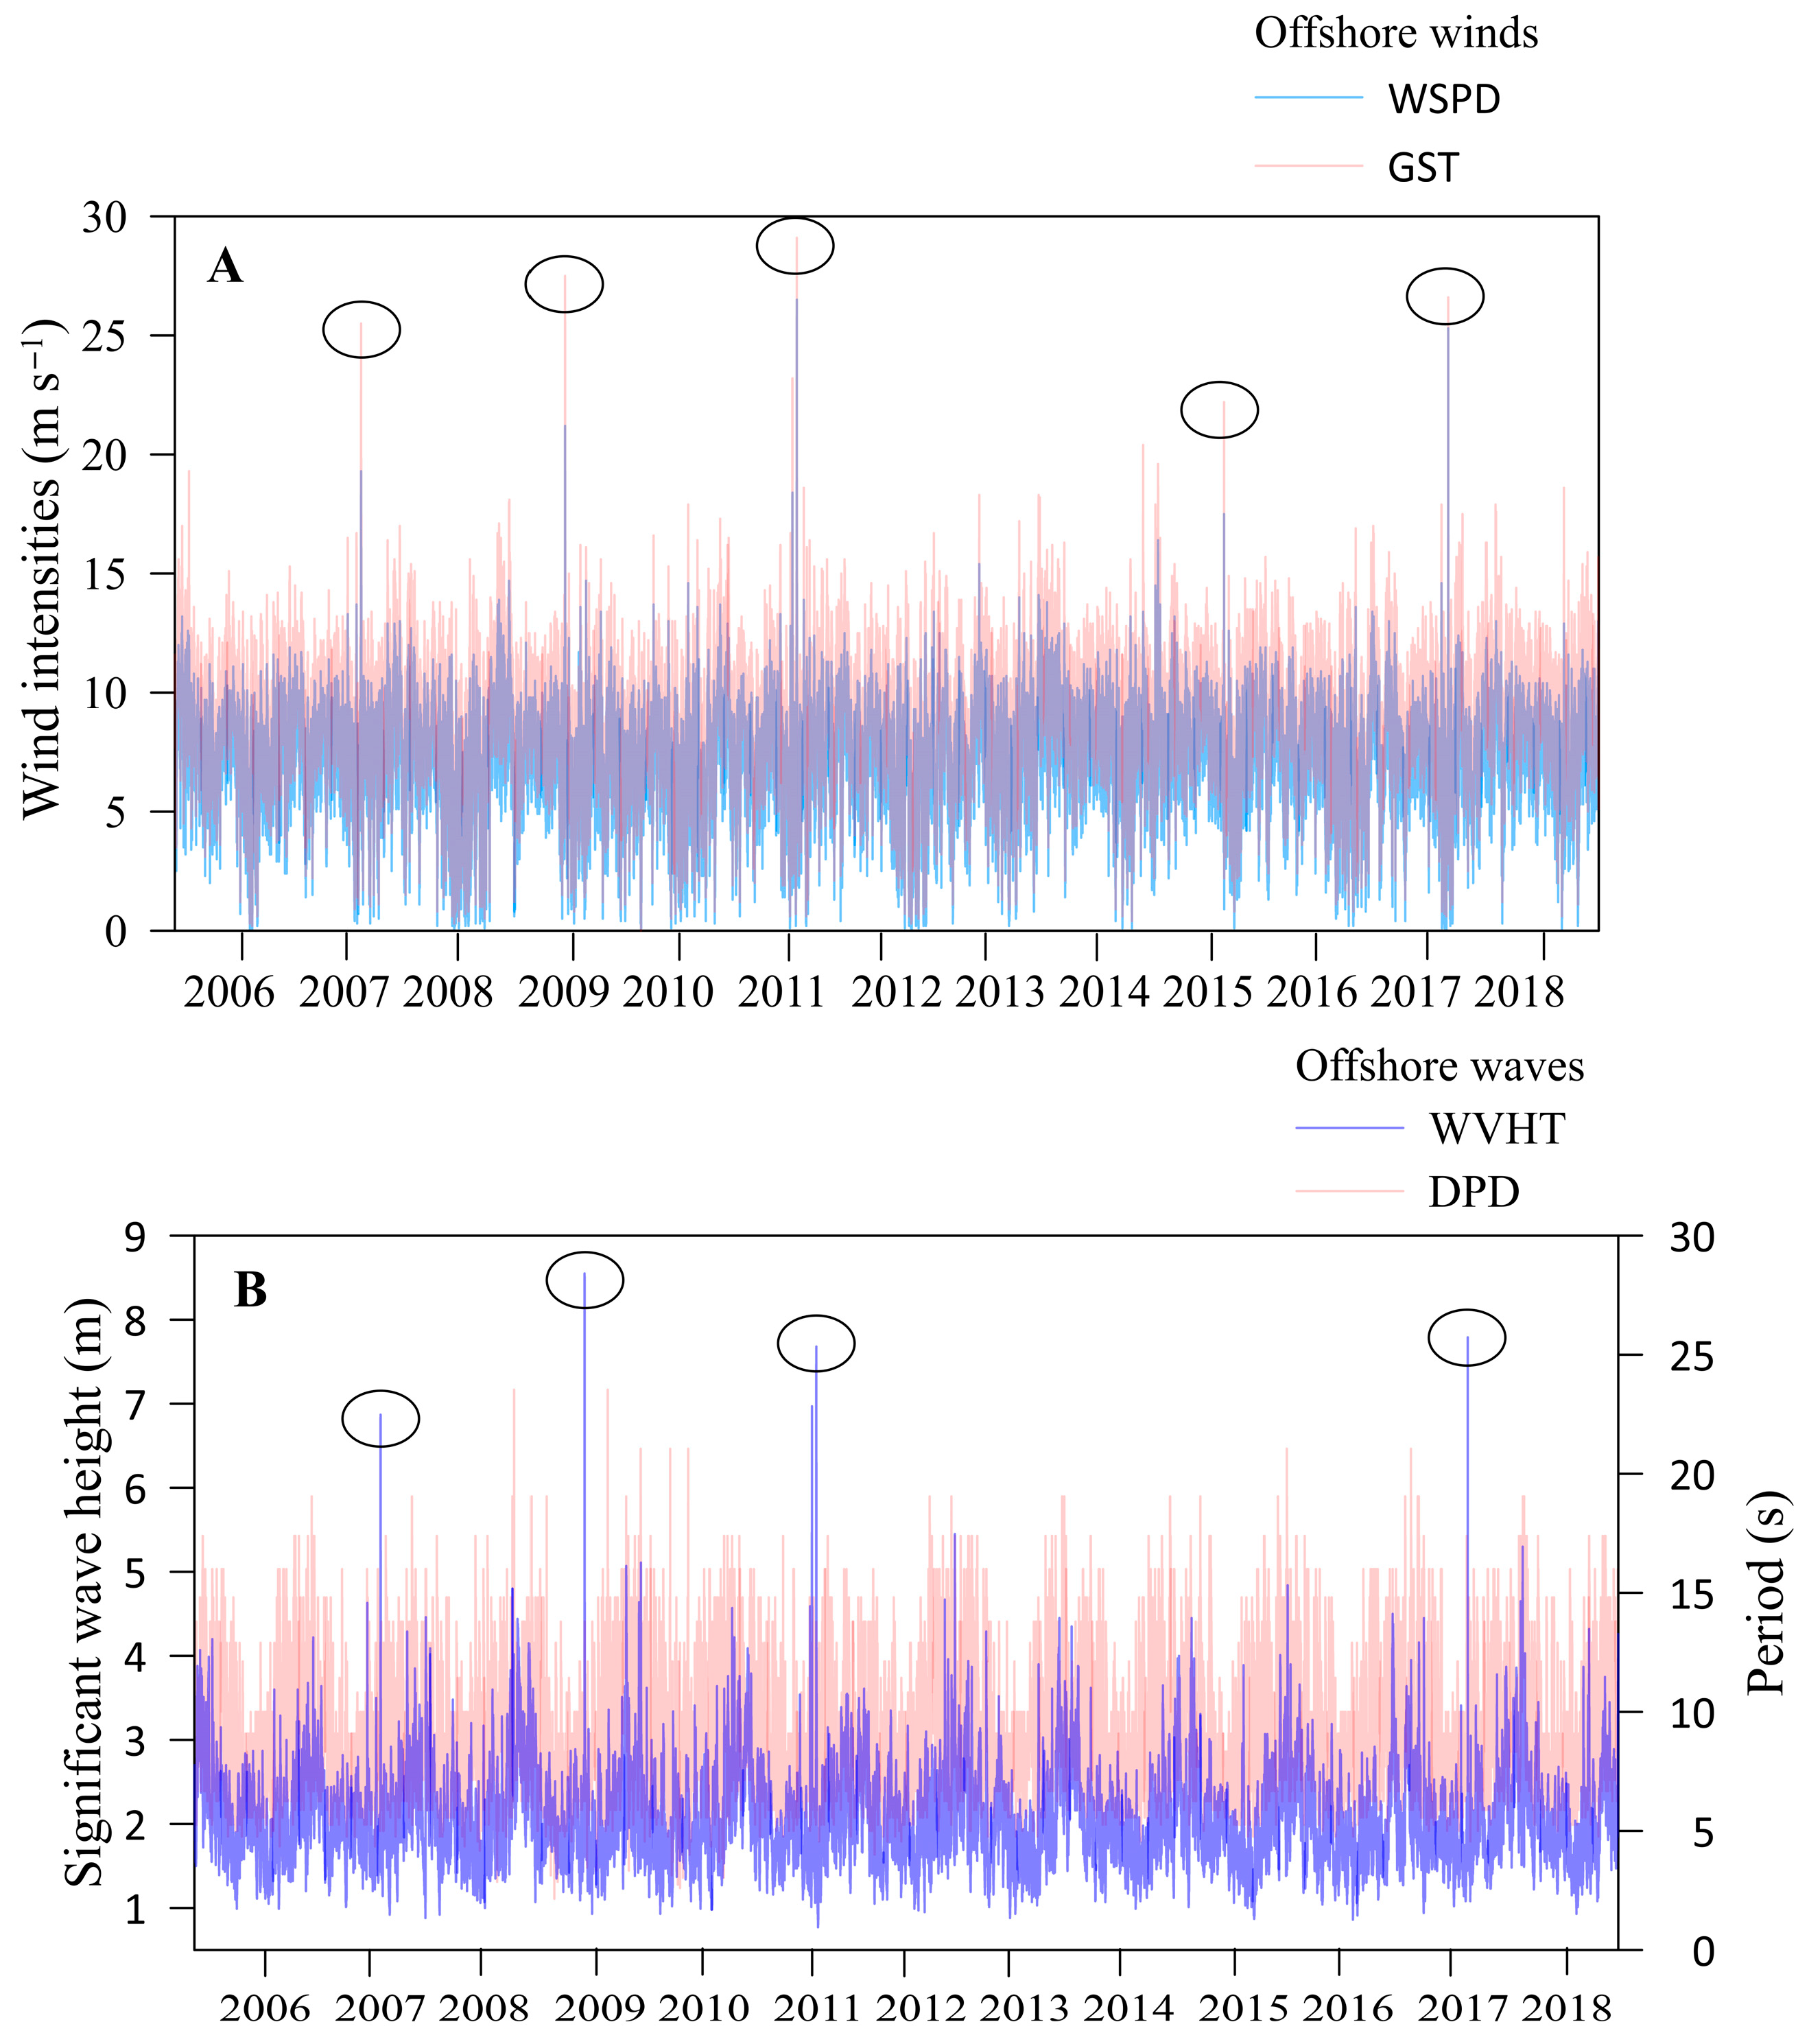
Seasonal analysis revealed that the gust wind speeds were 11% higher during the rainy season (9.2 ± 1.6 m s−1) compared with the dry season (Figure 2). Consequently, H0s increased by approximately 10% during the rainy season (2.1 ± 0.4 m), accompanied by wave periods of 9.4 ± 1.9 s. Figure 3 highlights severe storm events recorded in 2007, 2009, 2011, and 2017, where the average and gust wind speeds exceeded 20 m s−1. These storms, occurring during La Niña conditions, were associated with H0s exceeding 7 m and wave periods typically ranging between 12 and 20 s. In 2015, during a strong El Niño event, the gust wind speeds also exceeded 20 m s−1, while H0s remained below 5 m (Figure 3).
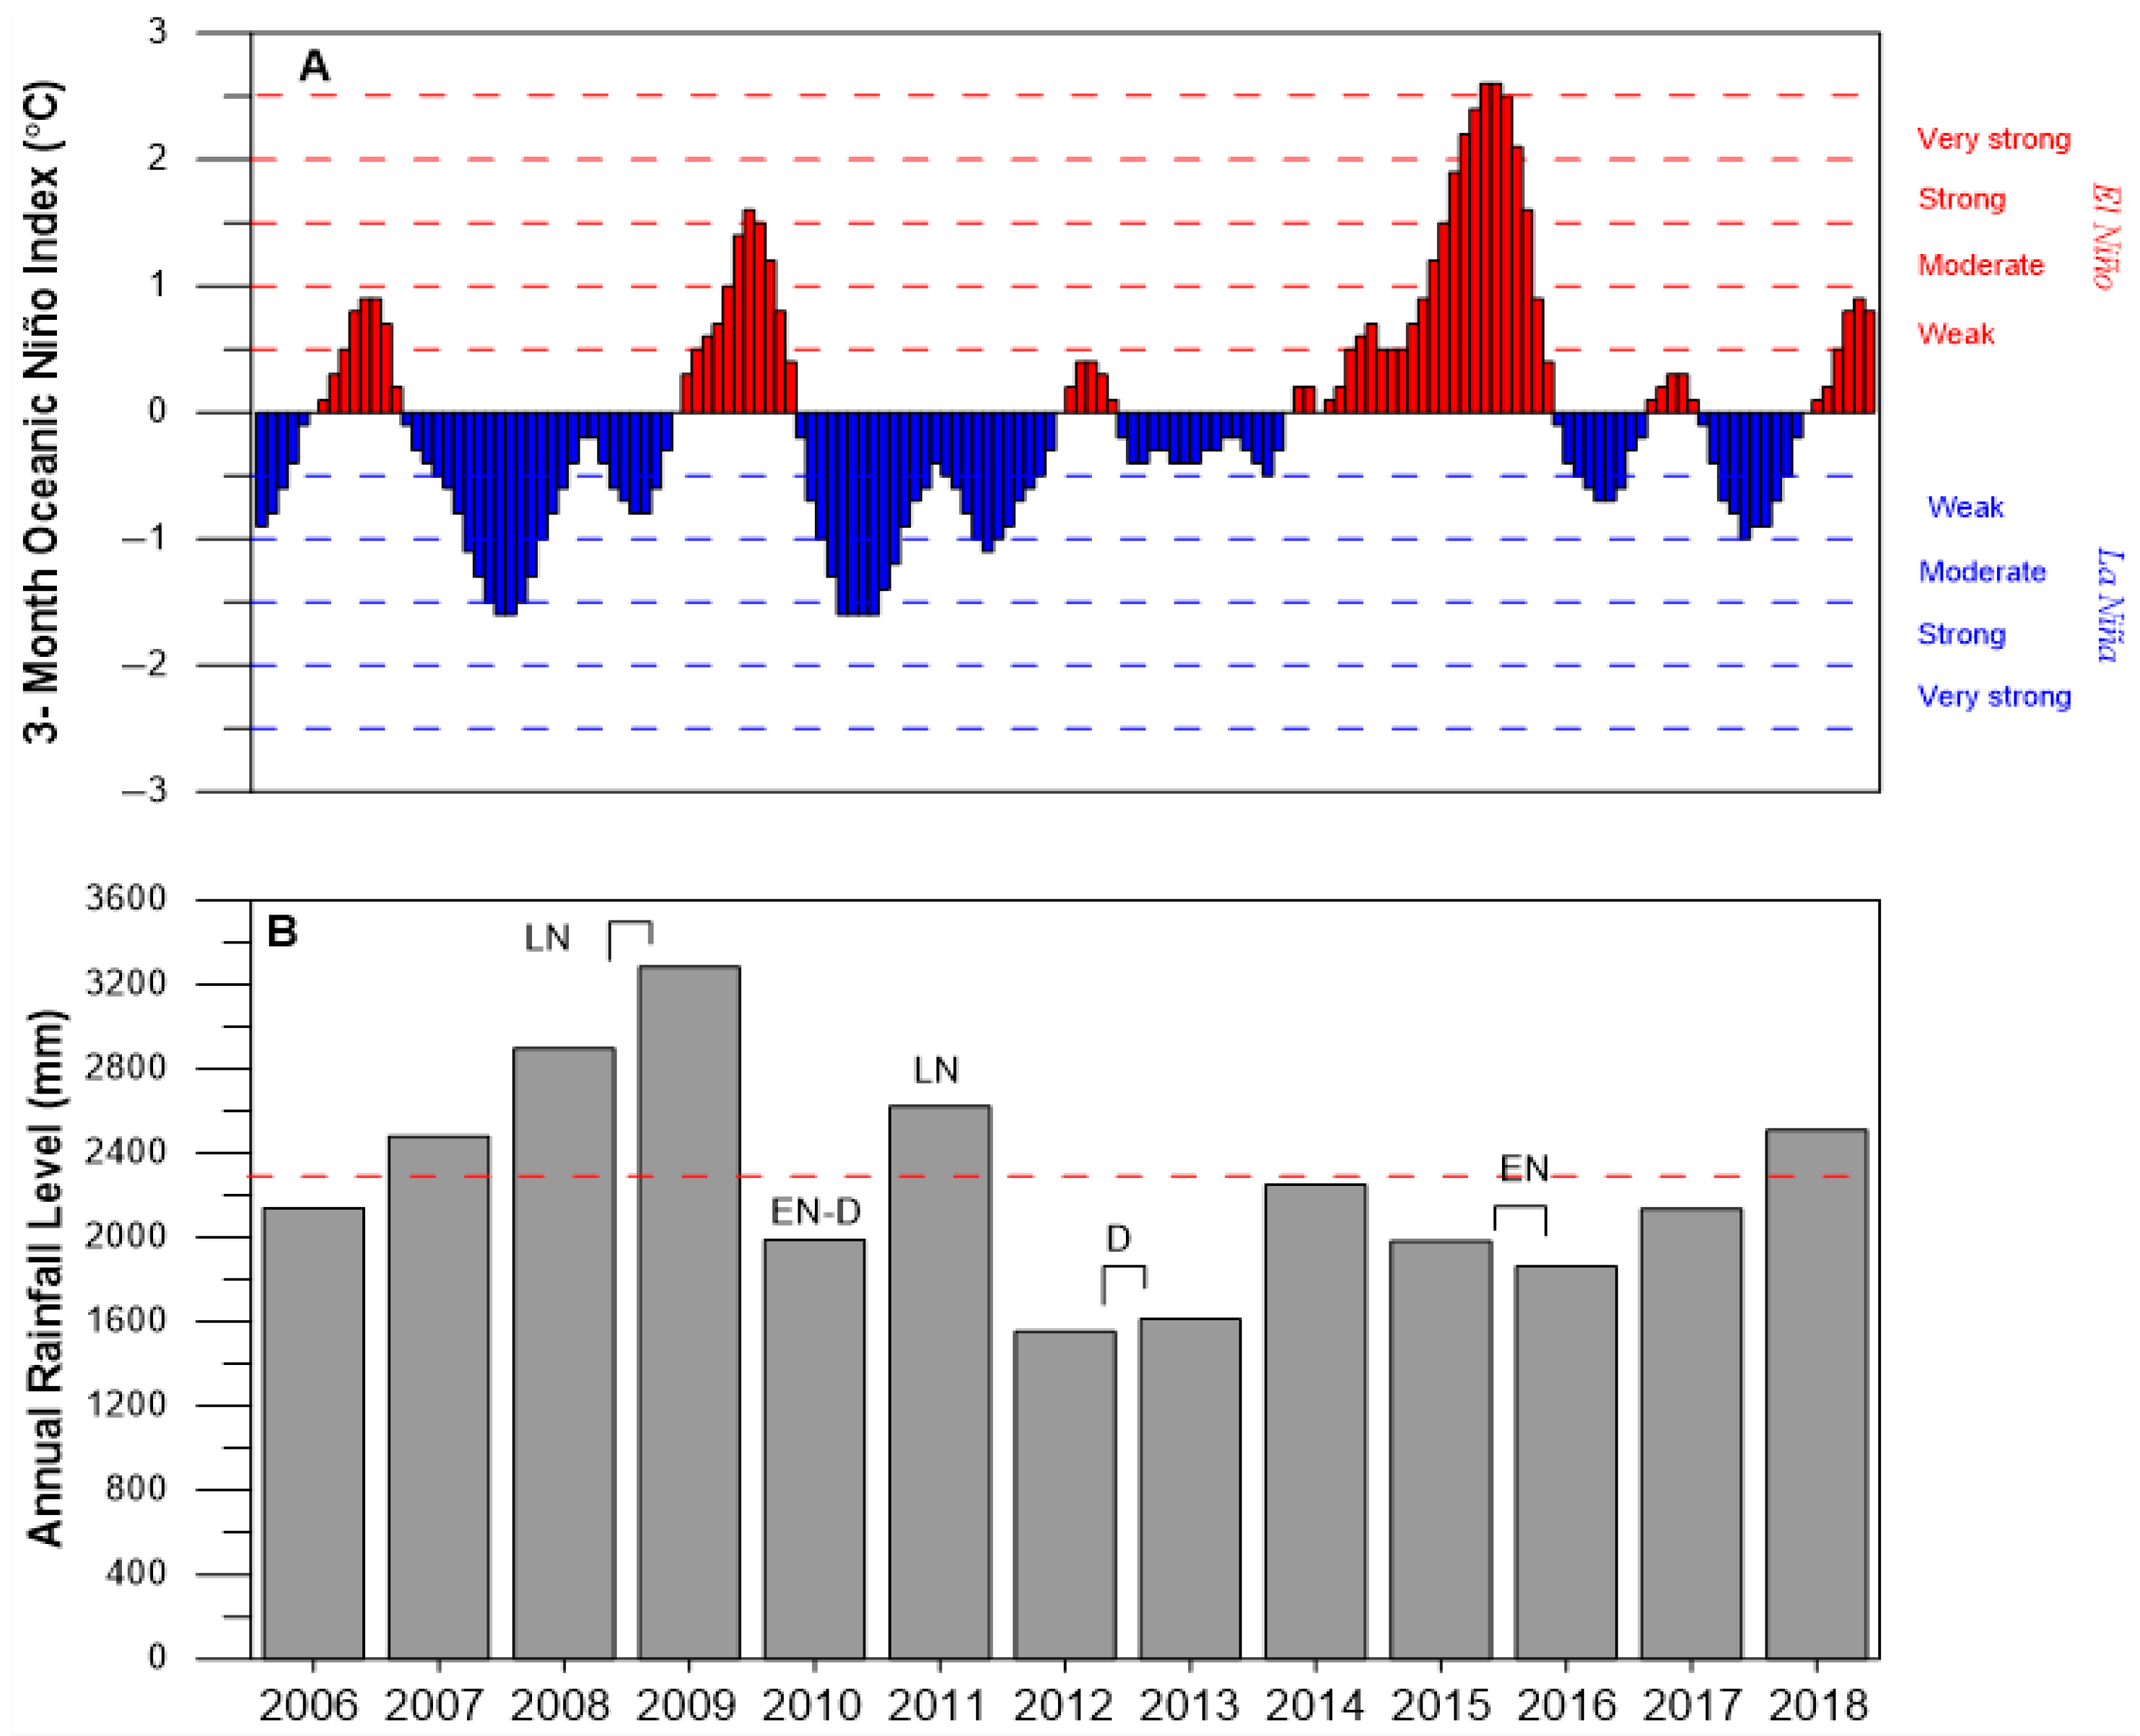
These climatic events are clearly evidenced in the precipitation and river discharge records. Between 2008 and 2009, an intense La Niña event occurred (Figure 4), driving rainfall levels to 3284.3 mm in 2009, 31.34% higher than the average rainfall recorded between 2006 and 2018. In 2010, a moderate El Niño event was accompanied by a drought event, leading to a 13.44% decrease in rainfall compared with the 2006–2018 average. Another moderate La Niña episode was observed in 2011, resulting in a 14% increase in regional rainfall levels. In 2012 and 2013, an intense and prolonged drought event occurred, leading to a 45% reduction in rainfall in 2012 and 40% in 2013 compared with the 2006–2018 average. A significant El Niño event took place from the latter half of 2015 through November 2016, leading to a 14% reduction in rainfall in 2015 and a 21% deficit in 2016 (Figure 4).
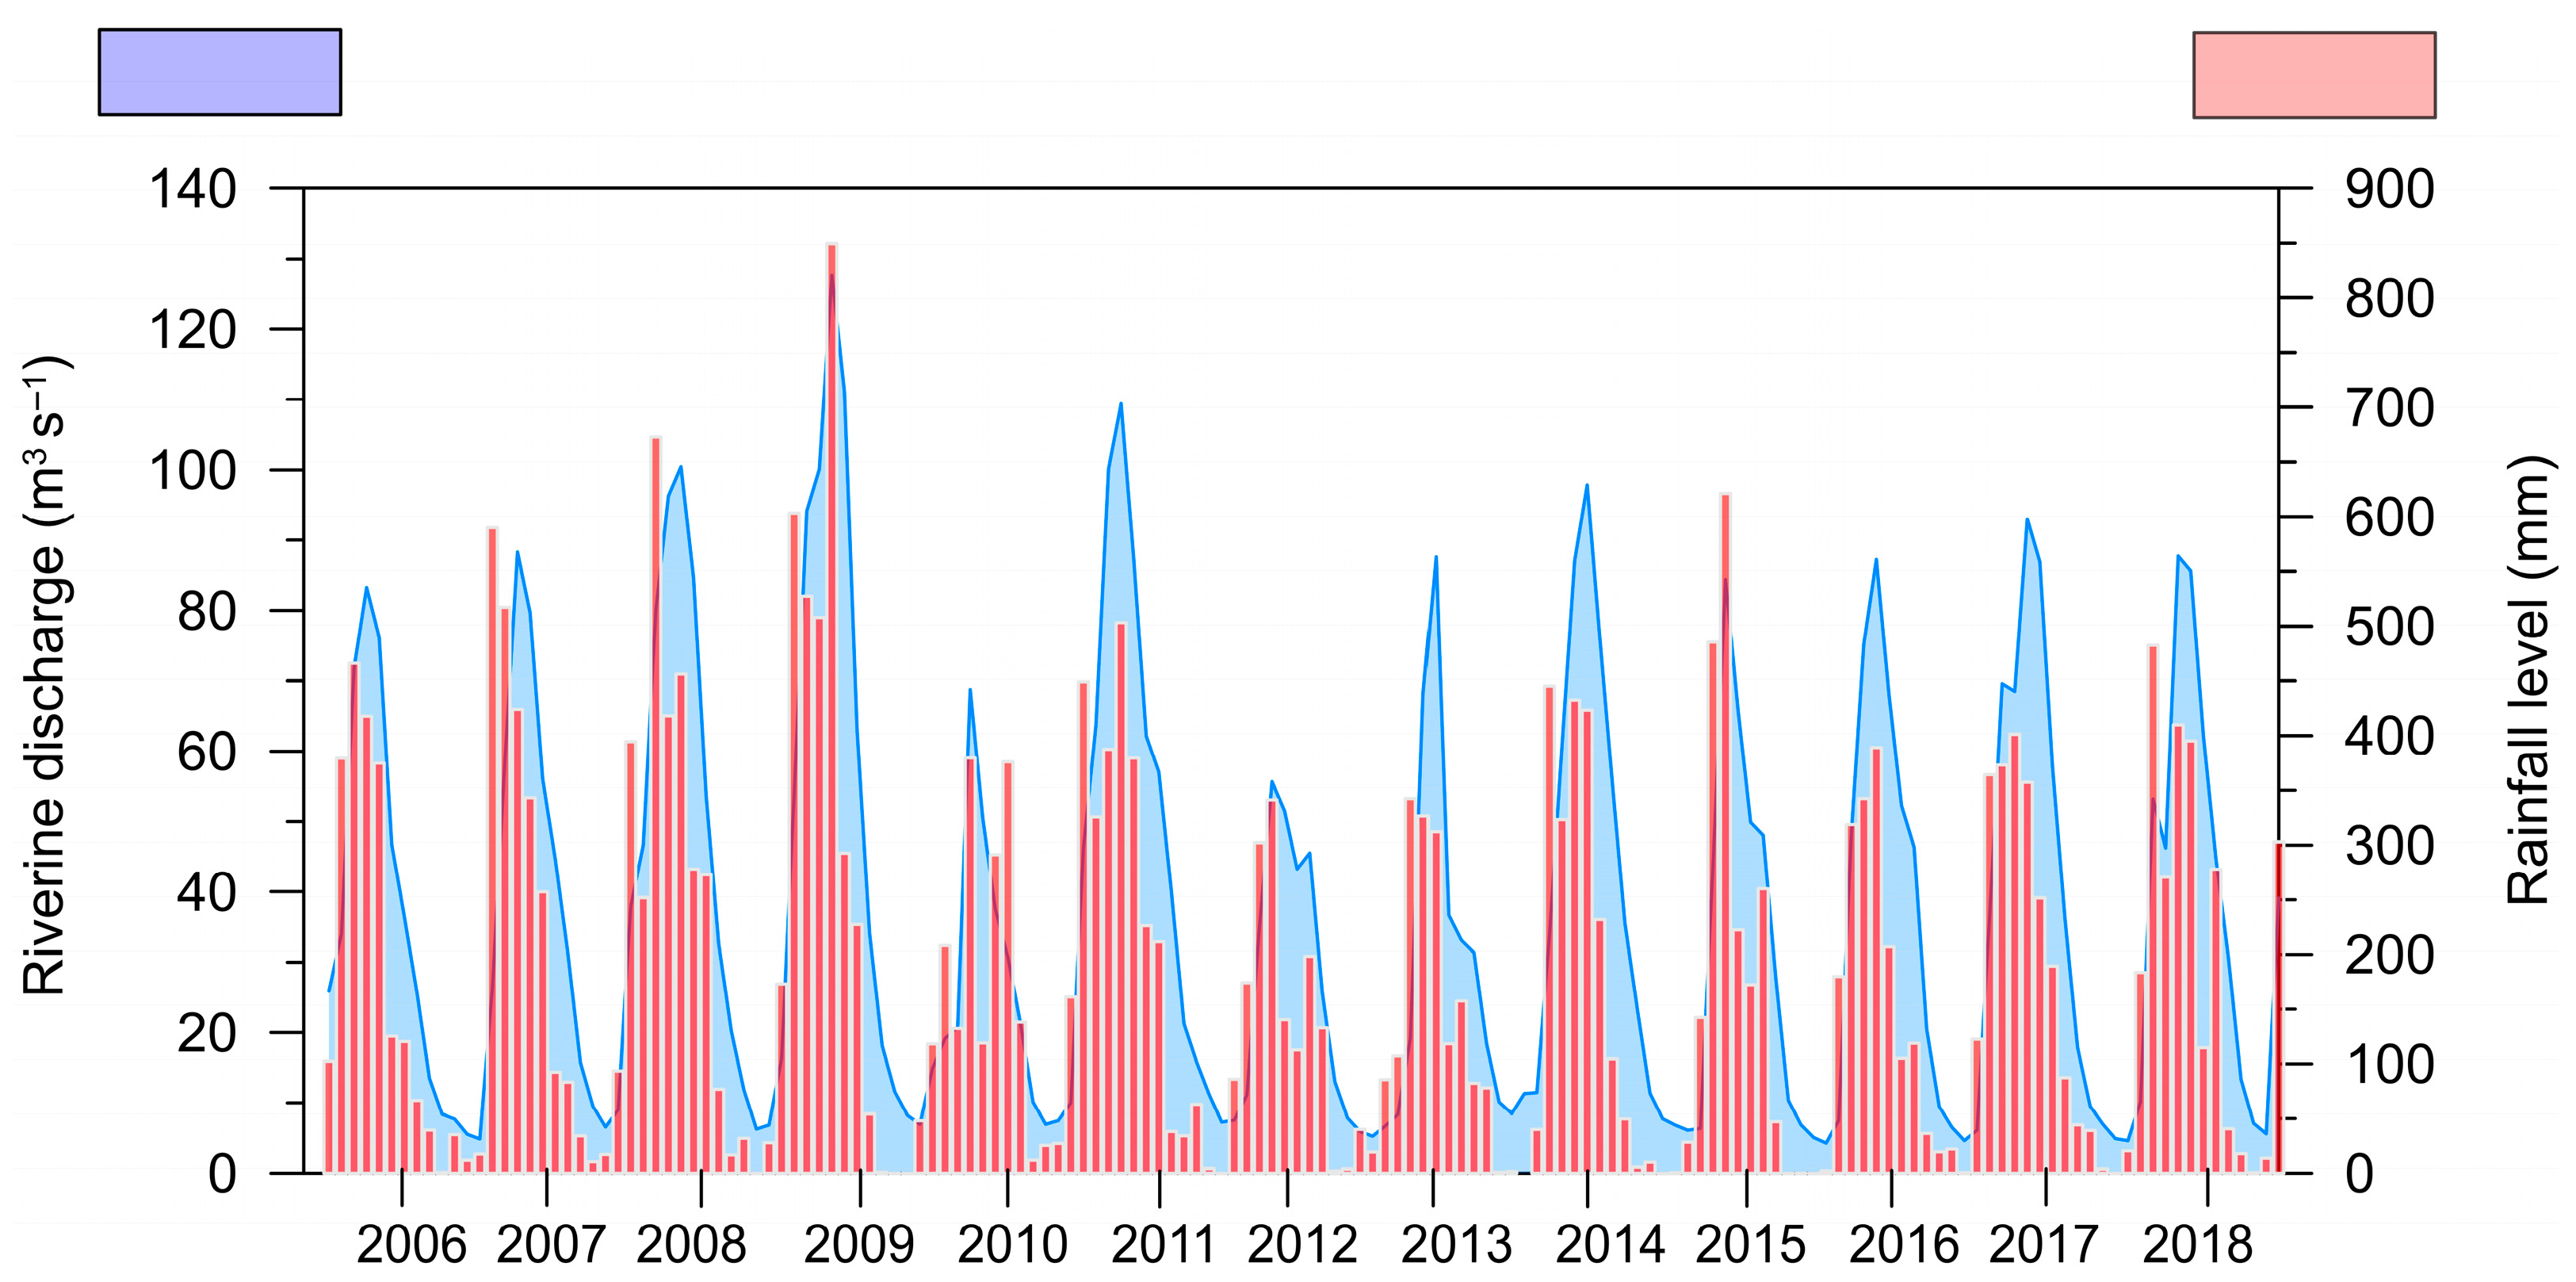
River discharge rates showed a direct correlation with rainfall levels, as shown in Figure 5, which highlights the impacts of seasonal variations and climate events. During the first half of the year, elevated rainfall levels significantly boosted the discharge rates of the Caeté River. Conversely, in the second half, lower rainfall levels resulted in reduced river discharge. Regarding climate events, the intense La Niña episode of 2008 and 2009 led to significant rainfall. In May 2009, the rainfall level reached 849.7 mm, and the river discharge of the Caeté River was 127.7 m3 s−1. This event’s impact was also observed in 2011, when the river discharge reached 109.4 m3 s−1 with a rainfall level of 503.1 mm in April 2011. Drier events, such as the drought and El Niño, occurred in 2010 and resulted in lower monthly river discharge, with the maximum discharge reaching 68.8 m3 s−1 in May 2010 (a 54.17% reduction compared with May 2009) under a rainfall level of 379.5 mm. The 2015–2016 El Niño event also caused lower rainfall levels and river discharge rates, with the maximum values recorded in April (2015: 84.4 m3 s−1 and 621.3 mm; 2016: 87.2 m3 s−1 and 389.1 mm).
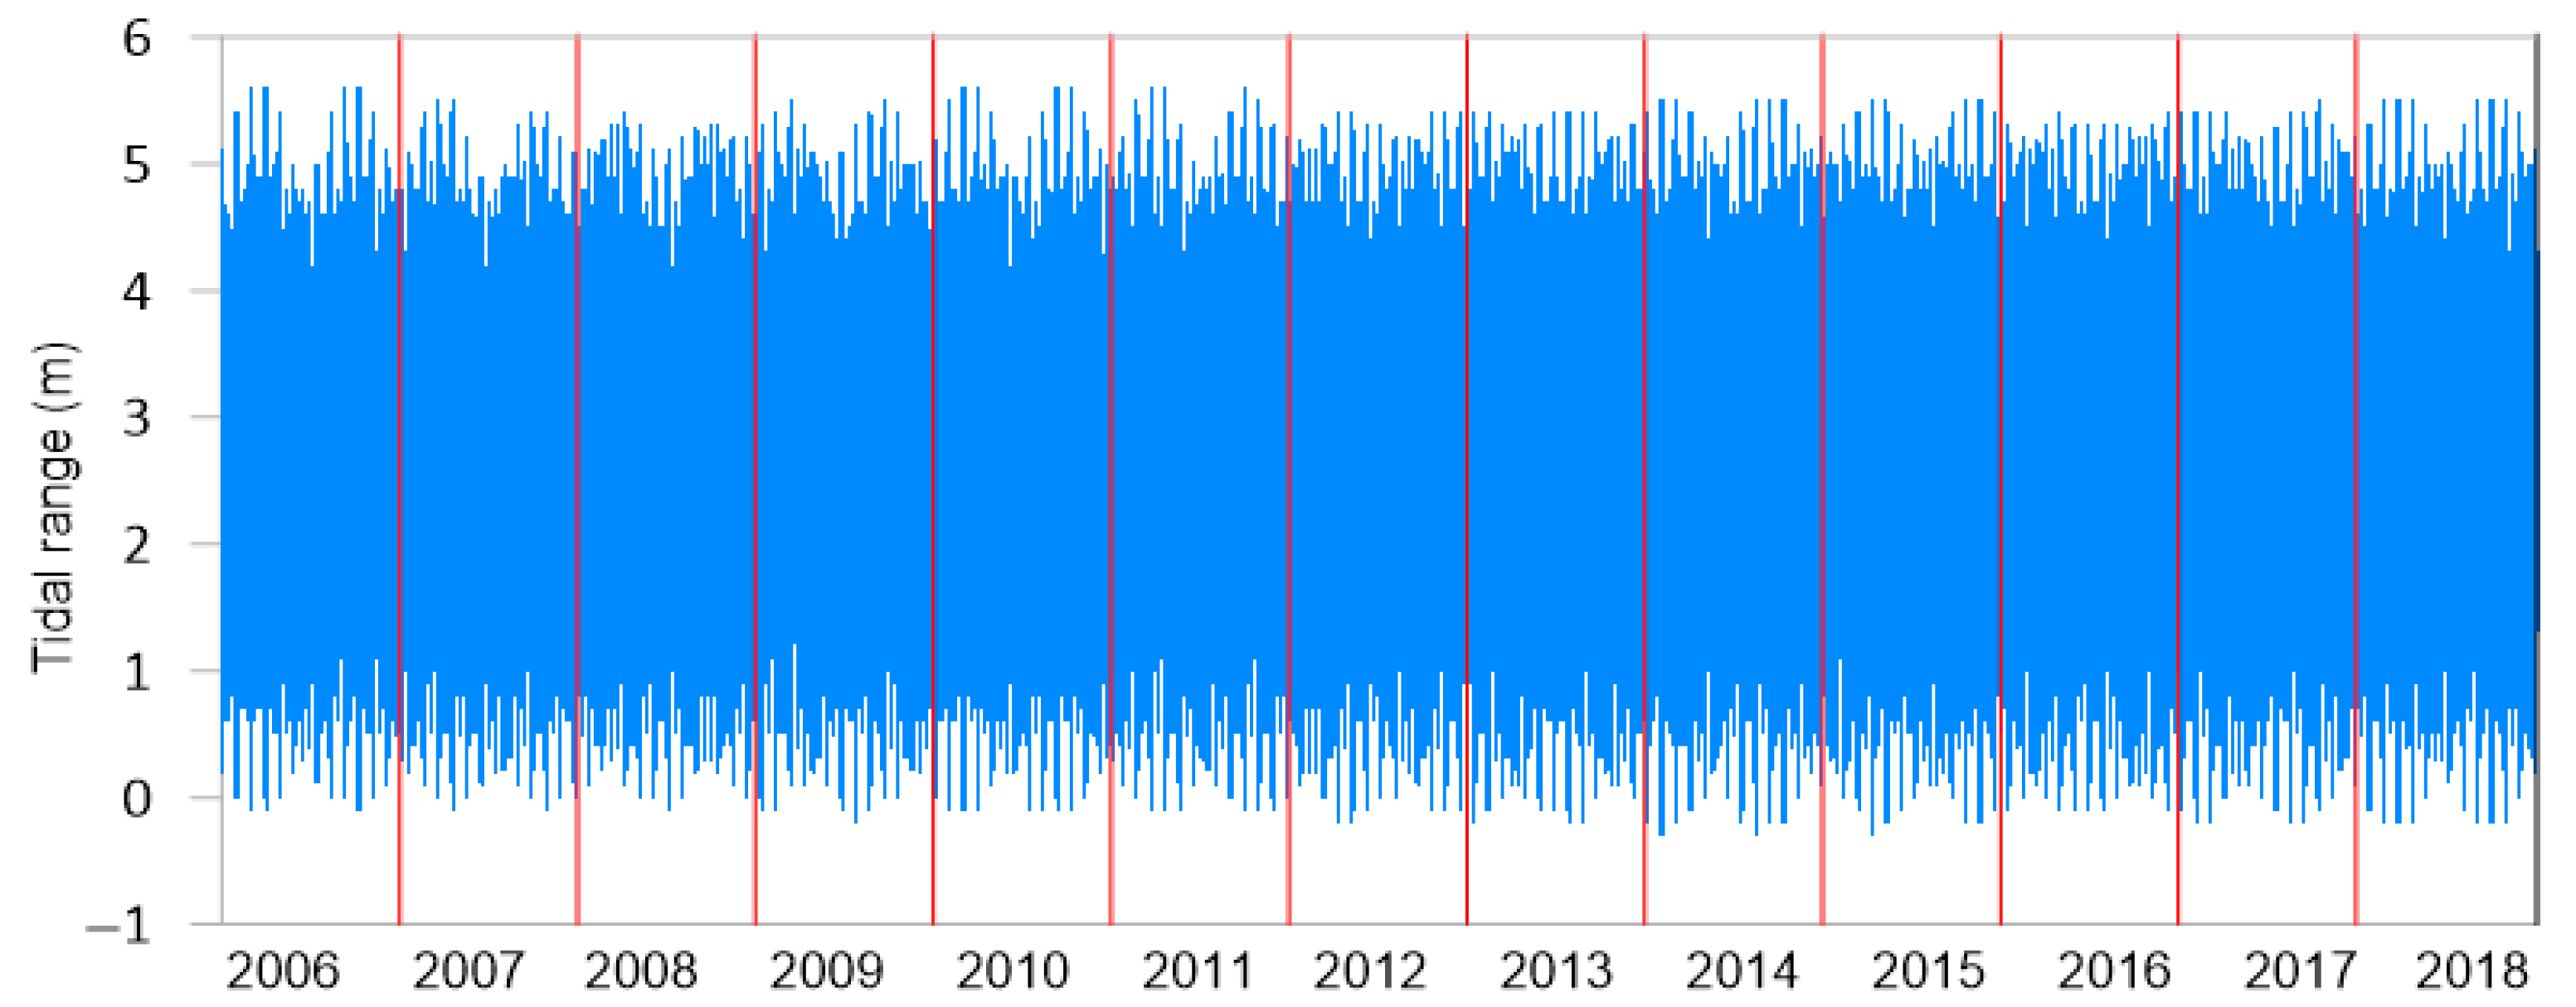
The tidal elevation in the study area is predominantly influenced by macrotides, with spring tides varying between 5.0 and 5.5 m, while neap tides range from 3.5 to 4.5 m. Notably, Figure 6, derived from CHN data, excludes the impacts of climate oscillations.

3.2. In Situ Measurements

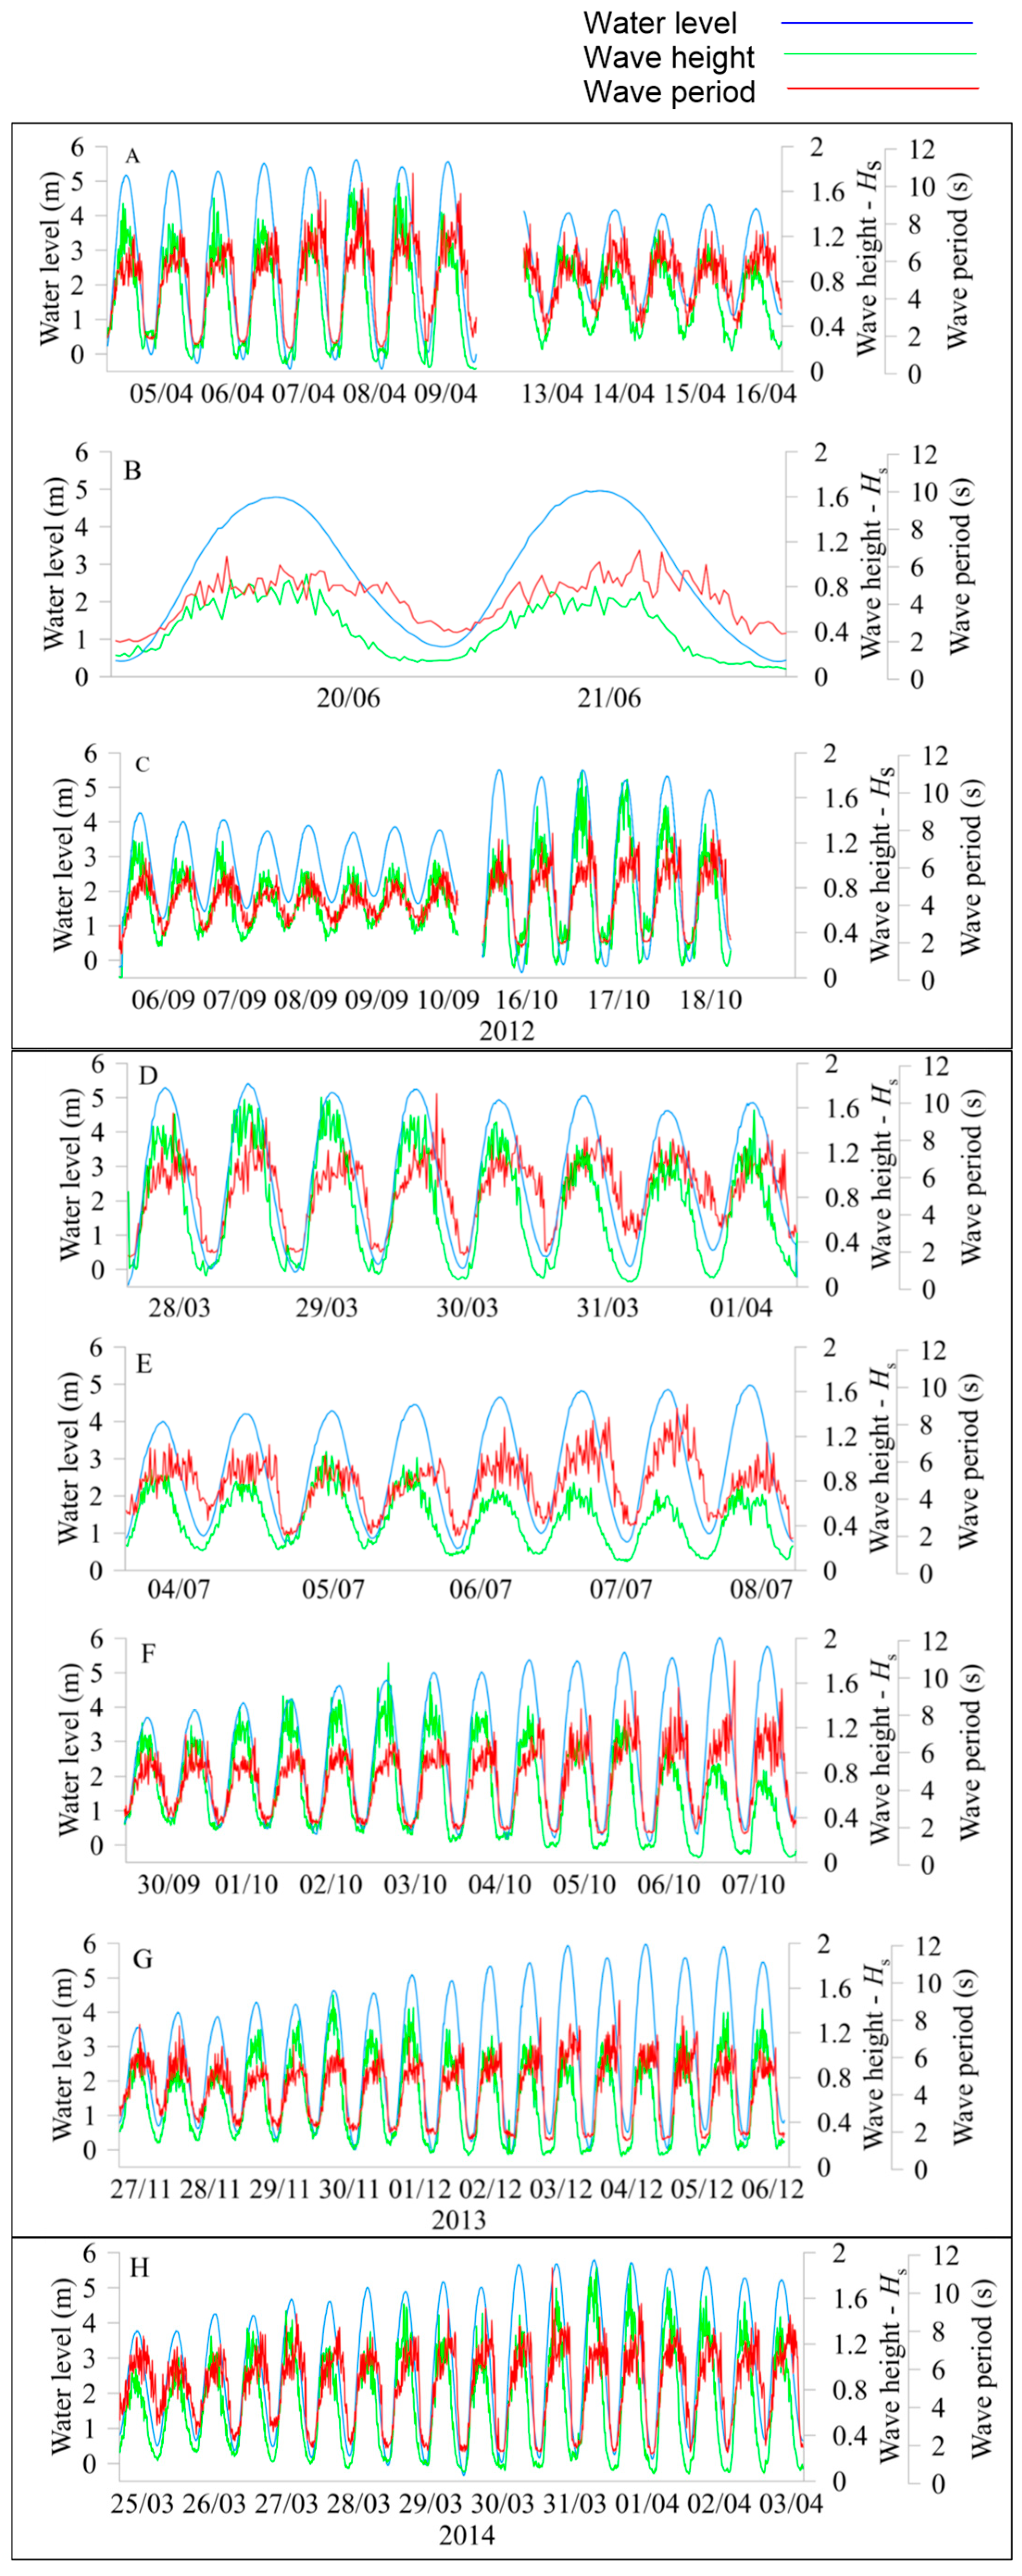
Offshore wave heights were attenuated from 2–5 m in deep water to 1–2 m in nearshore waters. In nearshore waters, wave heights and periods are modulated by semi-diurnal tidal fluctuations. During low tide, exposed sandbanks dissipate ocean waves, allowing only short-fetch limited waves to reach the base of the low-tide beach. Consequently, breaking wave heights varied significantly, ranging from 1–1.8 m at high tide to 0.1–0.5 m at low tide.
The lowest wave heights were observed during spring low tides when the sandbanks were most exposed, contributing to the wide variation in wave heights (Figure 7). The highest significant wave heights, being between 1.5 and 1.8 m, were generally accompanied by wave periods of 9–11 s. June 2012 (Figure 7B) and July 2013 (Figure 7E) saw the lowest values for both wave heights (<1.0 m) and periods (<8 s). During spring high tides (as recorded in April 2014; Figure 7H), the water depth across the beach increases by up to 6 m, allowing longer-period ocean waves to cross the sandbanks and surf zone and reach the beach.

3.3. Shoreline Analysis

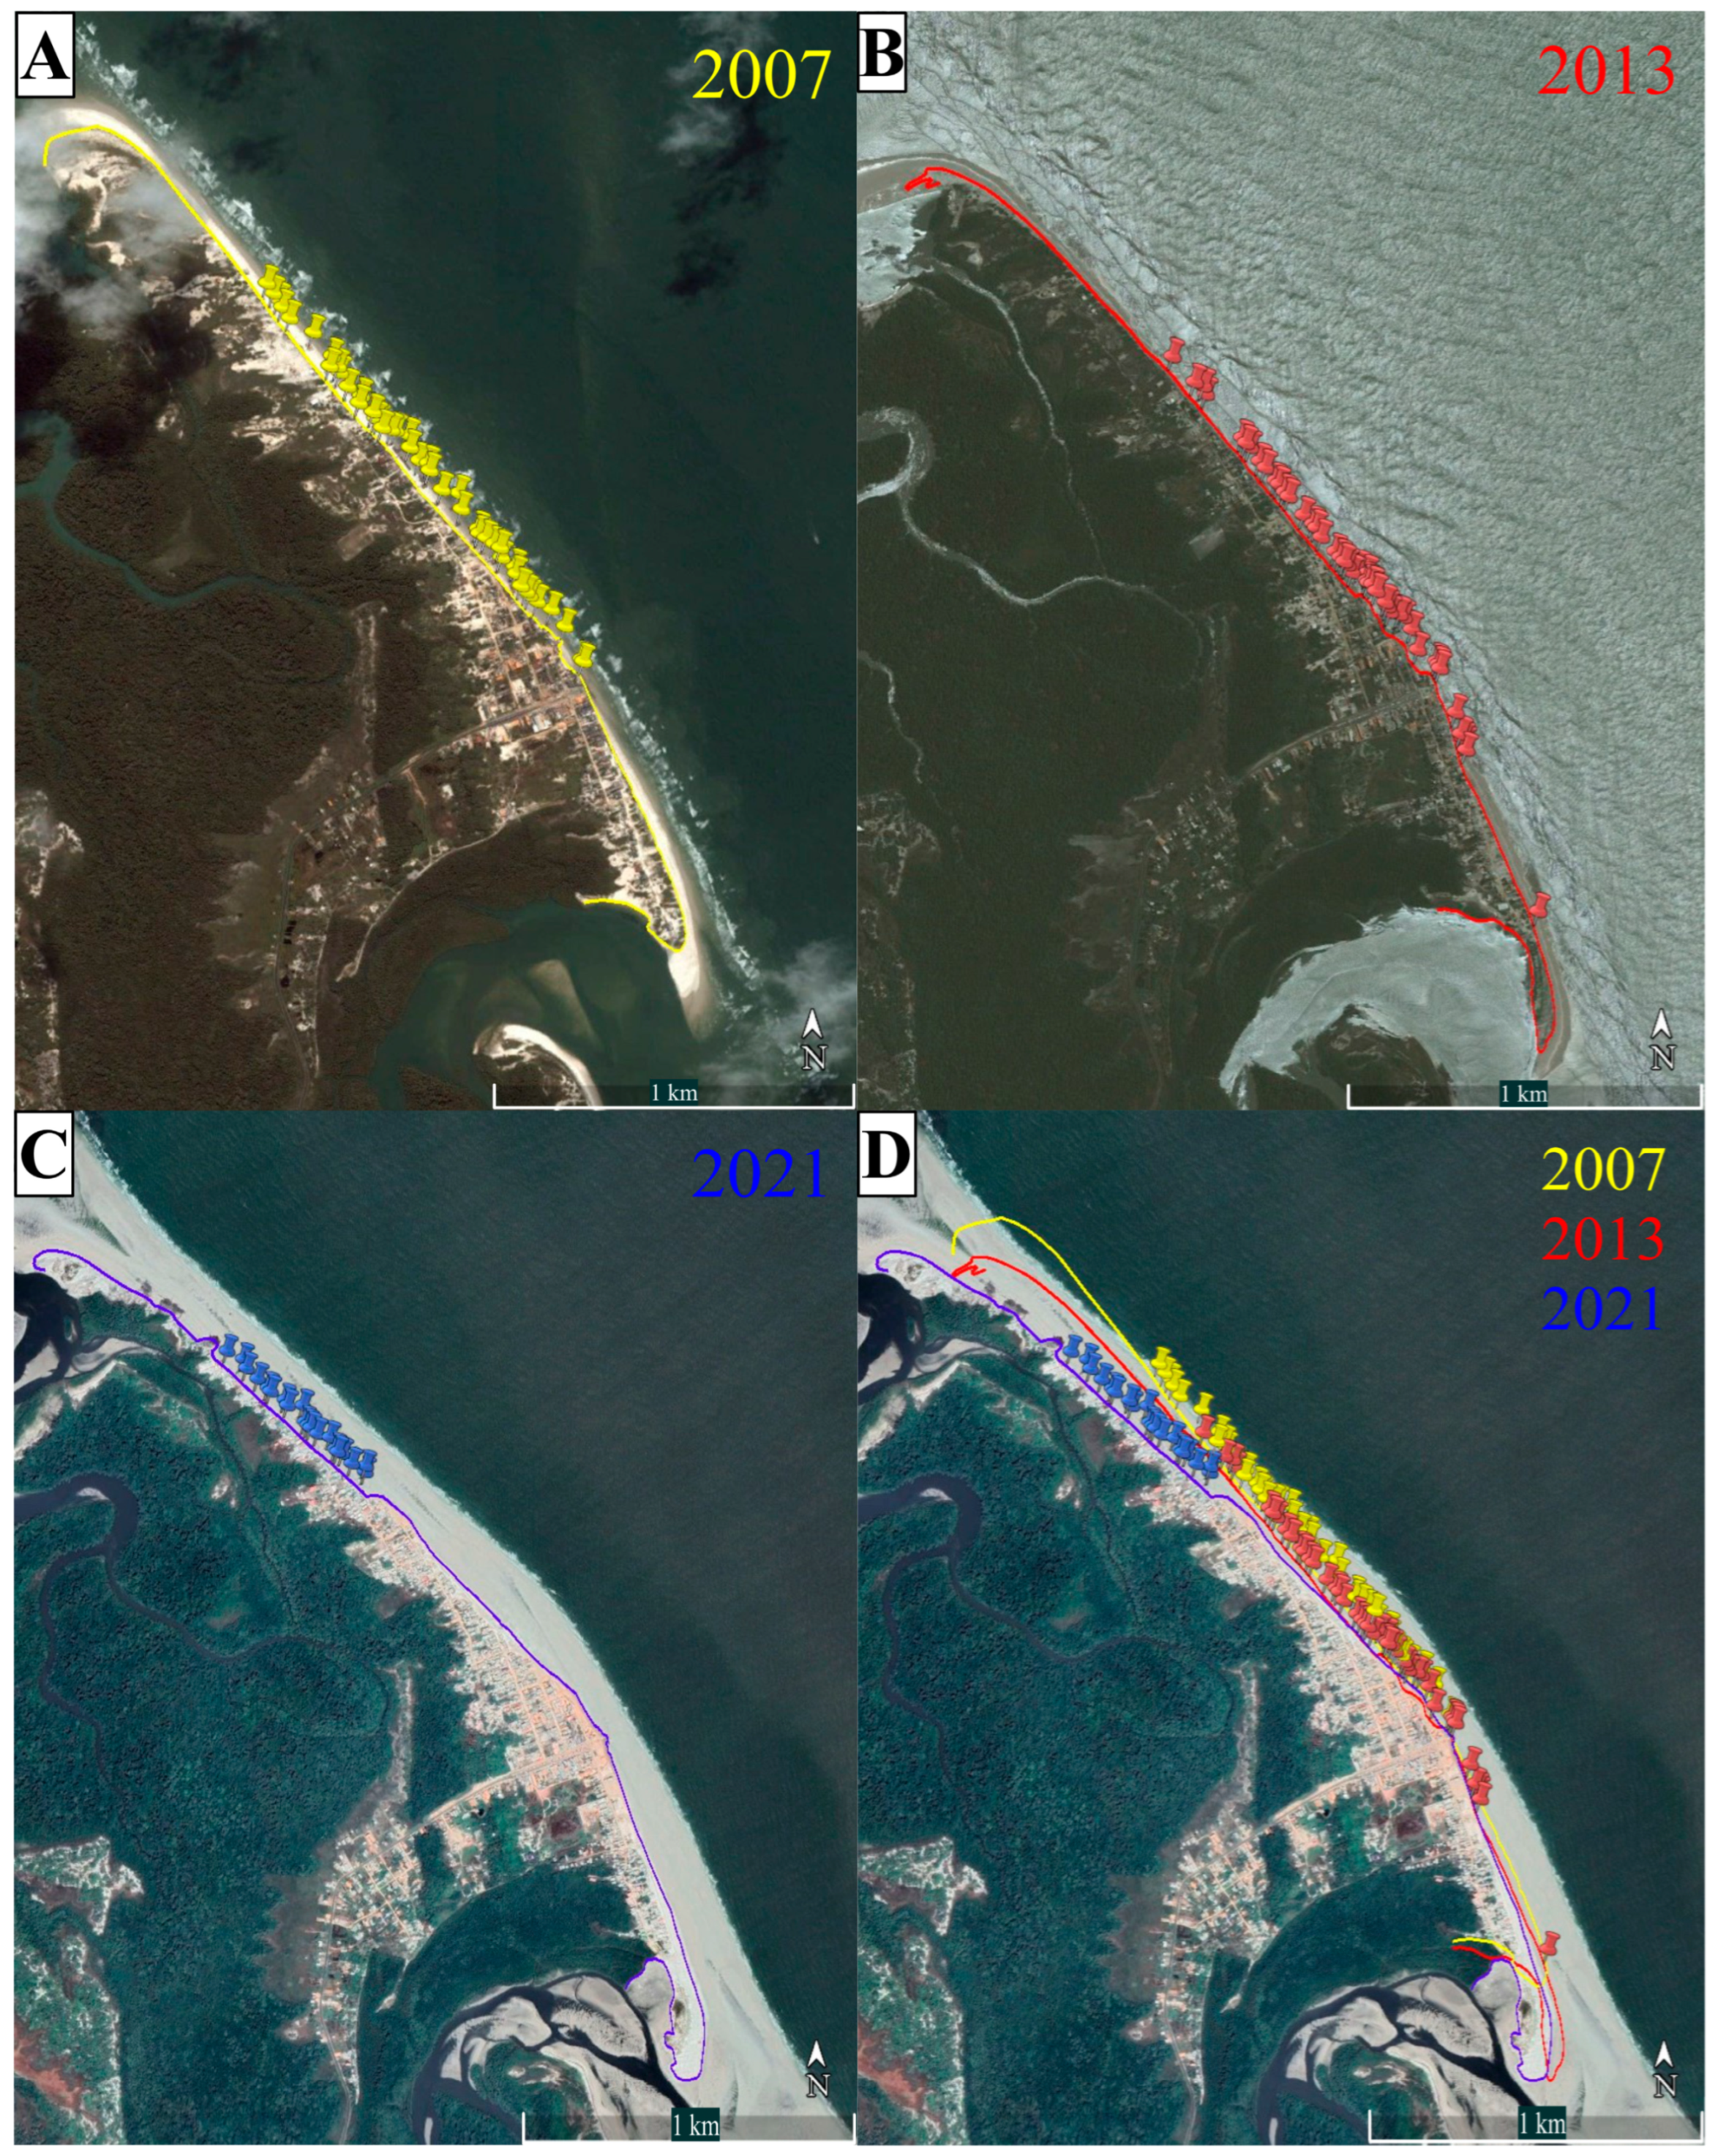
The northwestern sector of Ajuruteua has been particularly impacted by erosion. When comparing 2007 and 2021, the northernmost section of Ajuruteua Beach experienced a reduction of 0.15 km2 in area and a retreat of 0.360 km. The highest erosion rate (80%) and beach retreat (68%) of the 2007–2021 interval occurred between 2007 and 2013. This period coincided with two La Niña events (2008–2009 and 2011) and two drought events (2010 and 2012–2013). Between 2013 and 2021, the most notable occurrence was the 2015–2016 El Niño event (Figure 4).
The satellite images presented in Figure 8 illustrate the distribution of buildings (stilt houses, hostels, or bars) located in the intertidal zone, marked with pins to highlight their vulnerability to erosive processes. In 2007 (Figure 8A), the image captured during high tide shows 43 houses situated within the intertidal area. By 2013 (Figure 8B), a reduction of 0.12 km2 in surface area and a shoreline retreat of 0.245 km in the northernmost sector compared with 2007 (Table 2) led to partial destruction of the previously identified structures. In the same year, due to intensified erosion and a lack of land use regulation, 44 houses were recorded as exposed within the intertidal zone. The 2013 image also corresponds to a high-tide event, revealing the inundation of several of these structures. The image for 2021 (Figure 8C) reflects low-tide conditions and an apparent stabilization in the central portion of the beach, attributed to the removal of the buildings and the construction of the seawall and boardwalk. That year, only 20 houses remained exposed in the intertidal zone, all of which were concentrated in the northern sector.
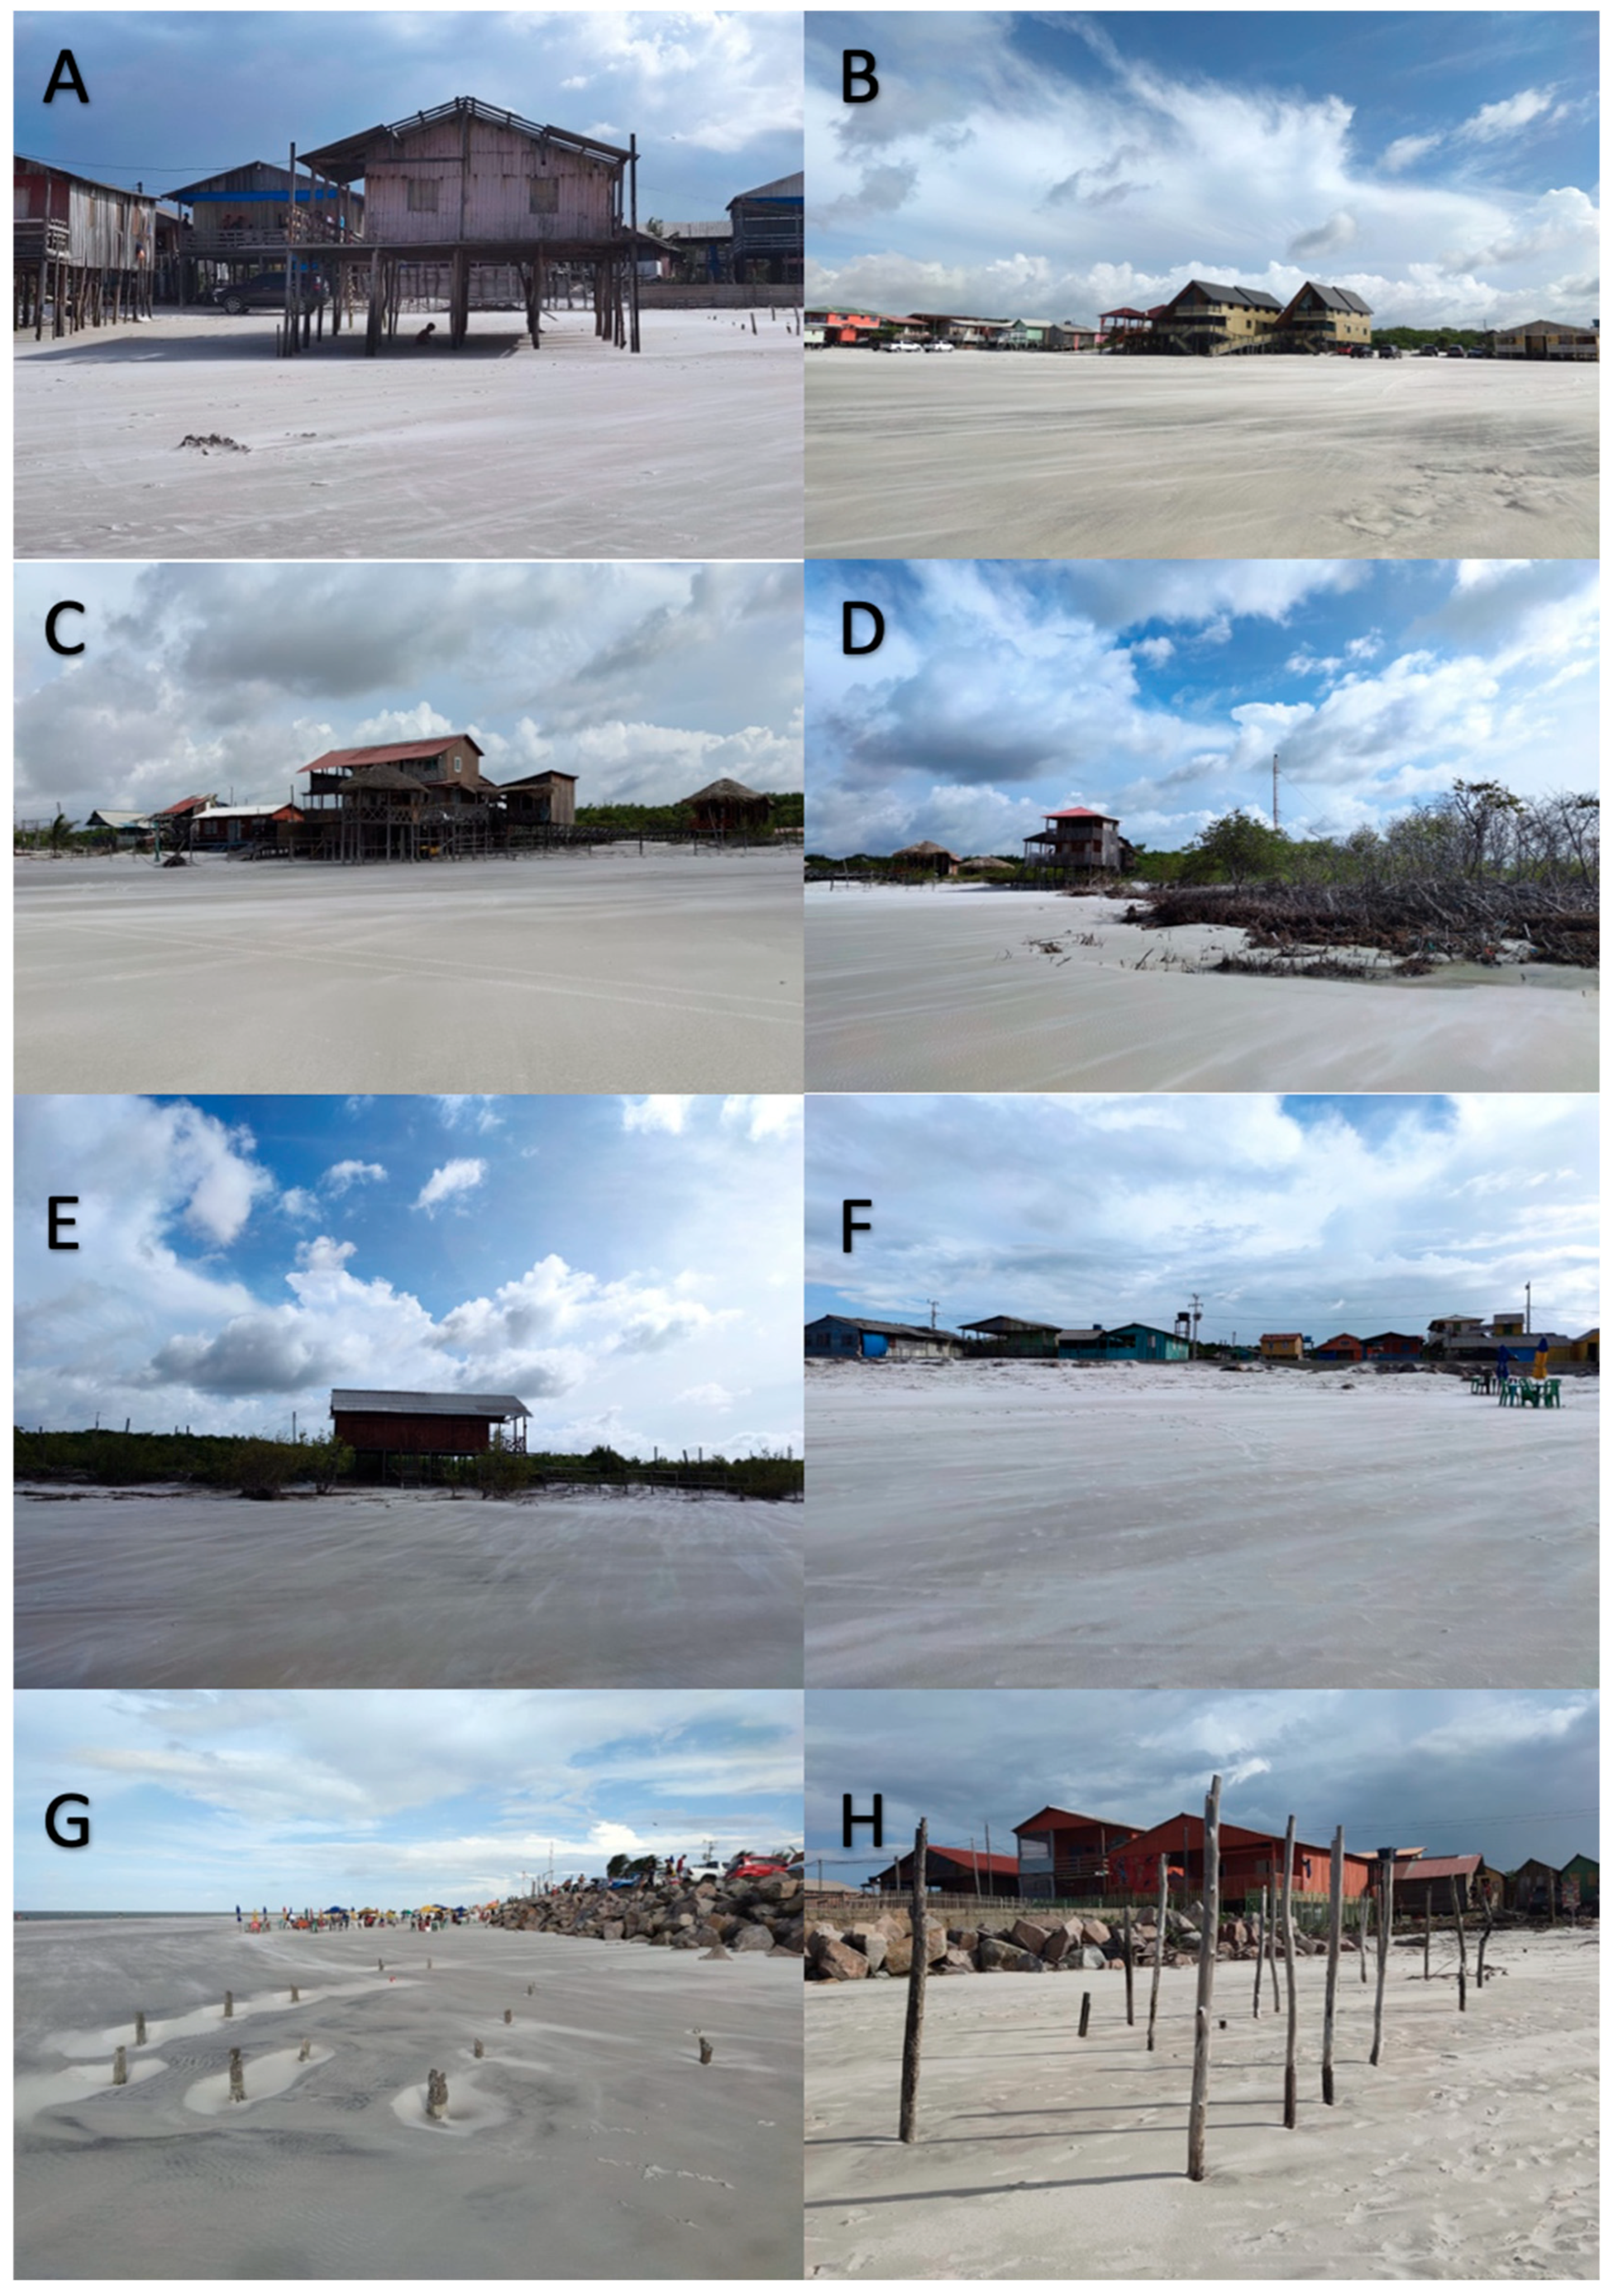
Photographs documenting unregulated occupation in the intertidal zone and frontal dunes in 2021 are presented in Figure 9. These images show stilt houses located in the northwestern sector (Figure 9A–F) as well as destroyed structures—evidenced by the remaining stilt supports—located in the central portion of the beach (Figure 9G,H).

4. Discussion

The climate along the Amazon coast is characterized by two main seasons: a dry and a rainy season [37]. The typical rainfall pattern in this region is also influenced by large-scale climatic fluctuations [21,34,38]. These fluctuations can lead to a decrease in rainfall, resulting in drier-than-normal years, typically under the influence of El Niño or other drought conditions, as occurred in 2010, 2012–2013, and 2015–2016. On the other hand, higher-than-normal rainfall levels are usually associated with La Niña, as observed in 2008–2009 and 2011 (Figure 4 and Figure 5).
This study recorded some of the most intense climatic events with global impacts in recent decades, such as those of 2009 (La Niña), 2010 (El Niño and drought), 2012 (drought), and 2015 (El Niño), as reported in [39,40,41]. These events had direct effects on offshore data, with notable peaks in gust wind speeds, wave heights, and dominant wave periods during the La Niña episodes of 2007, 2009, 2011, and 2017 (Figure 3A,B). Additionally, extreme variations in rainfall levels and river discharge were observed during both flooding and drier conditions, with the highest and lowest peaks recorded in 2009 and 2011 (La Niña) and in 2010 and 2012 (drier conditions), respectively, as illustrated in Figure 4 and Figure 5.
At a local scale, the lowest wave heights were recorded during spring low tides when the sandbanks were more exposed (Figure 7). Conversely, the highest wave heights (Hs) and periods were recorded during high tides, though they were also influenced by offshore wind conditions. For example, on 2–3 October 2013, during a neap tide, the maximal Hs values were recorded, with offshore gust wind speeds reaching about 13 m s−1 on 28–29 September. Similarly, on 30 November and 1 December 2013, the maximal Hs values were observed between the neap and spring tides, coinciding with maximal offshore gust wind speeds of 15 m s−1 in the previous days. While the field campaigns did not cover all the climatic events mentioned above, the highest wave heights in October 2012 (during a drought event) were recorded compared with other studied months. These data show that offshore conditions influence nearshore conditions and, under the effect of climatic events, these conditions can be exacerbated, as previously demonstrated.
Similar to Ajuruteua Beach, high-energy coastal systems such as those for Normandy (France), the Bay of Fundy (Canada), and the Yellow Sea coast (South Korea) also exhibit significant tidal ranges combined with wave exposure [11,42,43]. In many of these regions, rapid coastal erosion is exacerbated by unregulated or poorly planned development, as also seen in this study.
To mitigate coastal erosion in these areas and reduce impacts—especially during extreme climatic events—it is essential to consider the short- and long-term physical processes that affect the shoreline, including tidal dynamics, wave action, and climate interactions. This approach is crucial for anticipating cumulative impacts and developing more adaptive and climate-resilient strategies. Unfortunately, the influence of physical processes on Amazonian beaches remains poorly studied [11], despite these areas having considerable tourism potential and facing serious challenges related to unregulated development
In this way, our study plays an important role in demonstrating how short- and long-term physical processes affect the shoreline, as well as how that coastal zone has been affected by unregulated development, with the construction of numerous precarious wooden stilt structures built over mangroves, dunes, and the intertidal zone, which has exacerbated coastal erosion processes, as shown in Figure 8 and Figure 9. Previous studies have also documented the severe impacts of erosion in the study area, particularly its contribution to infrastructure damage and economic losses. According to [44], between 2014 and 2018, erosion resulted in the loss of approximately 50 buildings, including houses, bars, and hostels, directly affecting 1825 inhabitants. The resulting economic losses were estimated to be USD 2,578,419.36.
The construction of seawalls between 2018 and 2021 further intensified this issue by creating a false sense of security, thereby encouraging the expansion of new buildings in environmentally sensitive areas, particularly in the northwestern sector, which is the zone most affected by erosion (Figure 8). Additionally, management decisions appear to have overlooked the role of tidal modulation, as well as the influence of offshore wind and wave patterns and extreme climatic events. As a result, signs of erosion are already evident in recently constructed sections of the boardwalk, which have been repeatedly revitalized due to the growing tourism interest the area holds (field observation).
Based on the results of this study, it is recommended that land use be properly regulated, and several proposals are suggested: banning irregular occupation in dune fields, intertidal zones, and mangrove areas; relocating structures situated in the most vulnerable zones to mitigate impacts, especially during extreme climatic events or equinoctial spring tides, when wave energy tends to intensify and threaten existing infrastructure; strengthening the natural protection of the shoreline through the restoration of dunes with native vegetation; and avoiding hard engineering structures, which have been shown—particularly in the study area—to exacerbate erosion in adjacent sections.

5. Conclusions

Natural conditions contribute to high hydrodynamic energy, increasing the risk of erosion, especially during equinoctial periods and extreme climatic events. Offshore conditions were influenced by La Niña events, with severe storms recorded in 2008–2009 and 2011. Rainfall exhibited extreme fluctuations during climatic events such as those of 2008–2009 (La Niña), 2010 (El Niño and drought), 2011 (La Niña), 2012–2013 (drought), and 2015–2016 (El Niño). The nearshore waves exhibited moderate energy and variability, influenced by offshore conditions, tidal modulation, and the climate. Tidal modulation of breaking waves was observed due to the presence of sandbanks. As a result of this tidal modulation, the beach experienced low energy during low tides and high energy during high tides, especially during equinoctial periods and extreme climatic events. In addition, unregulated development and the lack of beach planning have exacerbated erosion at this macrotidal beach and the destruction of several structures. This study recommends that governmental authorities regulate local territorial occupation and consider both short- and long-term physical processes in future coastal protection projects.

Author Contributions

Conceptualization, R.L.M.d.C.P., L.C.C.P. and C.M.; methodology, R.L.M.d.C.P., L.C.C.P. and C.M.; validation, R.L.M.d.C.P., L.C.C.P. and C.M.; formal analysis, R.L.M.d.C.P., L.C.C.P. and C.M.; investigation, R.L.M.d.C.P. and L.C.C.P.; resources, R.L.M.d.C.P., L.C.C.P. and C.M.; data curation, R.L.M.d.C.P., L.C.C.P. and C.M.; writing original draft preparation, R.L.M.d.C.P., L.C.C.P. and C.M.; supervision, R.L.M.d.C.P. and C.M.; funding acquisition, L.C.C.P. All authors have read and agreed to the published version of the manuscript.

Funding

This research was funded by Brazilian National Council for Scientific and Technological Development—CNPq (431295/2016-6; 314037/2021-7).

Data Availability Statement

The original contributions presented in this study are included in the article. Further inquiries can be directed to the corresponding author.

Acknowledgments

This study was financed by the Brazilian National Council for Scientific and Technological Development (CNPq) through a Universal Project (431295/2016-6). The author Luci C.C. Pereira (314037/2021-7) would also like to thank CNPq for its research grants.

Conflicts of Interest

The authors declare no conflicts of interest.

References

  1. Aagaard, T. Modulation of surf zone processes on a barred beach due to changing water levels, Skalligen, Denmark. J. Coast. Res. 2002, 18, 25–38. [Google Scholar]
  2. Prasad, D.H.; Kumar, N.D. Coastal erosion studies—A review. Int. J. Geosci. 2014, 5, 341–345. [Google Scholar] [CrossRef]
  3. Vousdoukas, M.I.; Ranasinghe, R.; Mentaschi, L.; Plomaritis, T.A.; Athanasiou, P.; Luijendijk, A.; Feyen, L. Sandy coastlines under threat of erosion. Nat. Clim. Change 2020, 10, 260–263. [Google Scholar] [CrossRef]
  4. Short, A.D. Macro-meso tidal beach morphodynamics—An overview. J. Coast. Res. 1991, 7, 417–436. [Google Scholar]
  5. Levoy, F.; Monfort, O.; Larsonneur, C. Hydrodynamic variability on megatidal beaches, Normandy, France. Cont. Shelf Res. 2001, 21, 563–586. [Google Scholar] [CrossRef]
  6. Pranzini, E.; Williams, A.T. Coastal Erosion and Protection in Europe; Routledge: London, UK, 2013; p. 457. [Google Scholar]
  7. Mentaschi, L.; Vousdoukas, M.I.; Pekel, J.F.; Voukouvalas, E.; Feyen, L. Global long-term observations of coastal erosion and accretion. Sci. Rep. 2018, 8, 12876. [Google Scholar] [CrossRef]
  8. Wright, L.D.; Nielsen, P.; Short, A.D.; Greene, M.O. Morphodynamics of a macrotidal beach. Mar. Geol. 1982, 50, 97–128. [Google Scholar] [CrossRef]
  9. Masselink, G. Simulating the effects of tides on beach morphodynamics. J. Coast. Res. 1993, 15, 180–197. [Google Scholar]
  10. Anthony, E.J.; Gardel, A.; Gratiot, N.; Proisy, C.; Allison, M.A.; Dolique, F.; Fromard, F. The Amazon-influenced muddy coast of South America: A review of mud-bank–shoreline interactions. Earth Sci. Rev. 2010, 103, 99–121. [Google Scholar] [CrossRef]
  11. Pereira, L.C.C.; Vila-Concejo, A.; Trindade, W. Tidal modulation. In Sandy Beach Morphodynamics; Jackson, D.W.T., Short, A.D., Eds.; Elsevier: Amsterdam, The Netherlands, 2020; pp. 87–101. [Google Scholar] [CrossRef]
  12. Kroon, A.; Masselink, G. Morphodynamics of intertidal bar morphology on a macrotidal beach under low-energy wave conditions, North Lincolnshire, England. Mar. Geol. 2002, 190, 591–608. [Google Scholar] [CrossRef]
  13. Haquette, A.; Aernouts, D. The influence of nearshore sand bank dynamics on shoreline evolution in a macrotidal coastal environment, Calais, northern France. Cont. Shelf Res. 2010, 30, 1349–1361. [Google Scholar] [CrossRef]
  14. Idier, D.; Bertin, X.; Thompson, P.; Pickering, M.D. Interactions Between Mean Sea Level, Tide, Surge, Waves and Flooding: Mechanisms and Contributions to Sea Level Variations at the Coast. Surv. Geophys. 2019, 40, 1603–1630. [Google Scholar] [CrossRef]
  15. Souza-Filho, P.W.M.; Martins, E.d.S.F.; da Costa, F.R. Using mangroves as a geological indicator of coastal changes in the Bragança macrotidal flat, Brazilian Amazon: A remote sensing data approach. Ocean Coast. Manag. 2006, 49, 462–475. [Google Scholar] [CrossRef]
  16. Rodrigues, H.d.S.; de Lima, A.M.M.; Kuhn, P.A.F.; Rodrigues, H.J.B.; da Rocha, E.J.P. Economic vulnerability: Resulting from coastal erosion in Ajuruteua—Bragança/PA. Res. Soc. Dev. 2021, 10, e109101623822. [Google Scholar] [CrossRef]
  17. Teixeira, S.G.; Bandeira, I.C.N.; Dantas, M.E. Shoreline Variation and Identification of Local Erosion Geoindicators on the Brazilian Amazon Coast. J. Coast. Res. 2021, 37, 1088–1098. [Google Scholar] [CrossRef]
  18. Marengo, J.A.; Alves, L.M.; Soares, W.R.; Rodriguez, D.A.; Camargo, H.; Riveros, M.P.; Pabló, A.D. Two contrasting severe seasonal extremes in tropical South America in 2012: Flood in Amazonia and drought in northeast Brazil. J. Clim. 2013, 26, 9137–9154. [Google Scholar] [CrossRef]
  19. Marengo, J.A.; Borma, L.S.; Rodriguez, D.A.; Pinho, P.; Soares, W.R.; Alves, L.M. Recent extremes of drought and fooding in Amazonia: Vulnerabilities and human adaptation. Am. J. Clim. Change 2013, 2, 87–96. [Google Scholar] [CrossRef]
  20. Marengo, J.A.; Torres, R.R.; Alves, L.M. Drought in Northeast Brazil—Past, present, and future. Theor. Appl. Climatol. 2017, 129, 1189–1200. [Google Scholar] [CrossRef]
  21. Espinoza, J.C.; Marengo, J.A.; Schongart, J.; Jimenez, J.C. The new historical flood of 2021 in the Amazon River compared to major floods of the 21st century: Atmospheric features in the context of the intensification of floods. Weather Clim. Extrem. 2022, 35, 100406. [Google Scholar] [CrossRef]
  22. Cunha, A.P.; Zeri, M.; Deusdará Leal, K.R.; Costa, L.C.; Cuartas, L.A.; Marengo, J.A.; Tomasella, J.; Vieira, R.M.; Barbosa, A.A.; Cunningham, C.; et al. Extreme Drought Events over Brazil from 2011 to 2019. Atmosphere 2019, 10, 642. [Google Scholar] [CrossRef]
  23. da Costa, A.K.R.; Pereira, L.C.C.; Jiménez, J.A.; de Oliveira, A.R.G.; de Jesus Flores-Montes, M.; da Costa, R.M. Effects of Extreme Climatic Events on the Hydrological Parameters of the Estuarine Waters of the Amazon Coast. Estuar. Coast. 2022, 45, 1517–1533. [Google Scholar] [CrossRef]
  24. Pereira, L.C.C.; Guimarães, D.O.; Ribeiro, M.J.S.; Costa, R.M.; Souza-Filho, P.W.M. Use and occupation in Bragança littoral, Brazilian Amazon. J. Coast. Res. 2007, 50, 1116–1120. [Google Scholar] [CrossRef]
  25. Pereira, L.C.C.; Vila-Concejo, A.; Costa, R.M.; Short, A.D. Managing physical and anthropogenic hazards on macrotidal Amazon beaches. Ocean Coast. Manag. 2014, 96, 149–162. [Google Scholar] [CrossRef]
  26. Souza-Filho, P.W.M.; El-Robrini, M. Geomorphology of the Bragança coastal zone, northeastern Pará State. Rev. Bras. Geociênc. 2000, 30, 522–526. [Google Scholar] [CrossRef]
  27. Monteiro, M.C.; Pereira, L.C.C. Morphodynamic change of a macrotidal sand beach in the brazilian Amazon Coast (Ajuruteua—Pará). J. Coast. Res. 2009, 56, 103–107. [Google Scholar]
  28. Santos, P.B.M. Variabilidade Hidroclimática e Sua Relação com a Erosão Costeira na Praia de Ajuruteua (Bragança-PA). Trabalho de Conclusão de Curso (Graduação em Engenharia Ambiental e Energias Renováveis). Bachelor’s Thesis, Universidade Federal Rural da Amazônia, Belém, PA, Brazil, 2019. [Google Scholar]
  29. Cohen, M.C.L.; Lara, R.J.; Ramos, J.F.D.; Dittmar, T. Factors influencing the variability of Mg, Ca and K in waters of a mangrove creek in Bragança, North Brazil. Mangroves Salt Marshes 1999, 3, 9–15. [Google Scholar] [CrossRef]
  30. Menezes, M.P.M.; Berger, U.; Mehlig, U. Mangrove vegetation in Amazonia: A review of studies from the coast of Pará and Maranhão States, north Brazil. Acta Amaz. 2008, 38, 403–420. [Google Scholar] [CrossRef]
  31. Souza-Filho, P.W.M.; Paradell, W.R. Use of synthetic aperture radar for recognition of Coastal Geomorphological Features, land-use assessment, and shoreline changes in Bragança coast, Pará, Northern Brazil. Earth Sci. An. Acad. Bras. Ciênc. 2003, 75, 341–356. [Google Scholar] [CrossRef]
  32. INMET. Instituto Nacional de Meteorologia. Monitoramento das Estações Automáticas. 2024. Available online: https://portal.inmet.gov.br/dadoshistoricos (accessed on 30 November 2024).
  33. CHN. Centro de Hidrografia e Navegação Marinha do Brasil. 2024. Available online: https://www.marinha.mil.br/dhn/ (accessed on 30 November 2024).
  34. Pereira, L.C.C.; Vila-Concejo, A.; Short, A.D. Influence of subtidal sand banks on tidal modulation of waves and beach morphology in Amazon macrotidal beaches. J. Coast. Res. 2013, 65, 1821–1826. [Google Scholar] [CrossRef]
  35. Golden Gate Weather Services. 2024. Available online: https://ggweather.com/enso/oni.htm (accessed on 30 November 2024).
  36. ANA. Agência Nacional de águas. 2024. Available online: https://www.gov.br/ana/pt-br (accessed on 30 November 2024).
  37. Martorano, L.G.; Pereira, L.C.; Cezar, E.G.M.; Pereira, I.C.B. Estudos Climáticos do Estado do Pará, Classificação Climática (Köppen) e Deficiência Hídrica (Thornthwhite, Mather); SUDAM/EMBRAPA, SNLCS: Belém, PA, Brazil, 1993. [Google Scholar]
  38. Silva, B.R.P.; Pereira, L.C.C.; Vila-Concejo, A.; Costa, R.M. Effects of rainfall patterns on the trophic conditions of a near-pristine Amazon estuary (Brazil). Reg. Stud. Mar. Sci. 2025, 1, 10410. [Google Scholar] [CrossRef]
  39. Marengo, J.A.; Tomasella, J.; Alves, L.M.; Soares, W.R.; Rodriguez, D.A. The drought of 2010 in the context of historical droughts in the Amazon región. Geophys. Res. Lett. 2011, 38, L12703. [Google Scholar] [CrossRef]
  40. Marengo, J.A.; Williams, E.R.; Alves, L.M.; Soares, W.R.; Rodriguez, D.A. Extreme Seasonal Climate Variations in the Amazon Basin: Droughts and Floods. In Interactions Between Biosphere, Atmosphere and Human Land Use in the Amazon Basin; Nagy, L., Forsberg, B., Artaxo, P., Eds.; Ecological Studies; Springer: Berlin/Heidelberg, Germany, 2016; pp. 55–76. [Google Scholar] [CrossRef]
  41. Barnard, P.L.; Hoover, D.; Hubbard, D.M.; Snyder, A.; Ludka, B.C.; Allan, J.; Serafin, K.A. Extreme oceanographic forcing and coastal response due to the 2015–2016 El Niño. Nat. Commun. 2017, 8, 14365. [Google Scholar] [CrossRef]
  42. Yang, B.C.; Dalrymple, R.W.; Chun, S.S.; Lee, H.J. Transgressive sedimentation and stratigraphic evolution of a wave-dominated macrotidal coast, western Korea. Mar. Geol. 2006, 235, 35–48. [Google Scholar] [CrossRef]
  43. Levoy, F.; Monfort, O.; Anthony, E.J. Multi-decadal shoreline mobility of a managed sandy tidal coast (Normandy, France): Behavioural variability in a context of sea-level rise and increasing storm intensity. Reg. Stud. Mar. Sci. 2023, 62, 102973. [Google Scholar] [CrossRef]
  44. Rodrigues, H.D.S. Análise de Perdas Econômicas Geradas Pela Erosão em Ambiente Praiano: Caso da Praia de Ajuruteua–Bragança/PA. Master’s Thesis, Federal University of Pará, Belém, PA, Brazil, 2018. [Google Scholar]
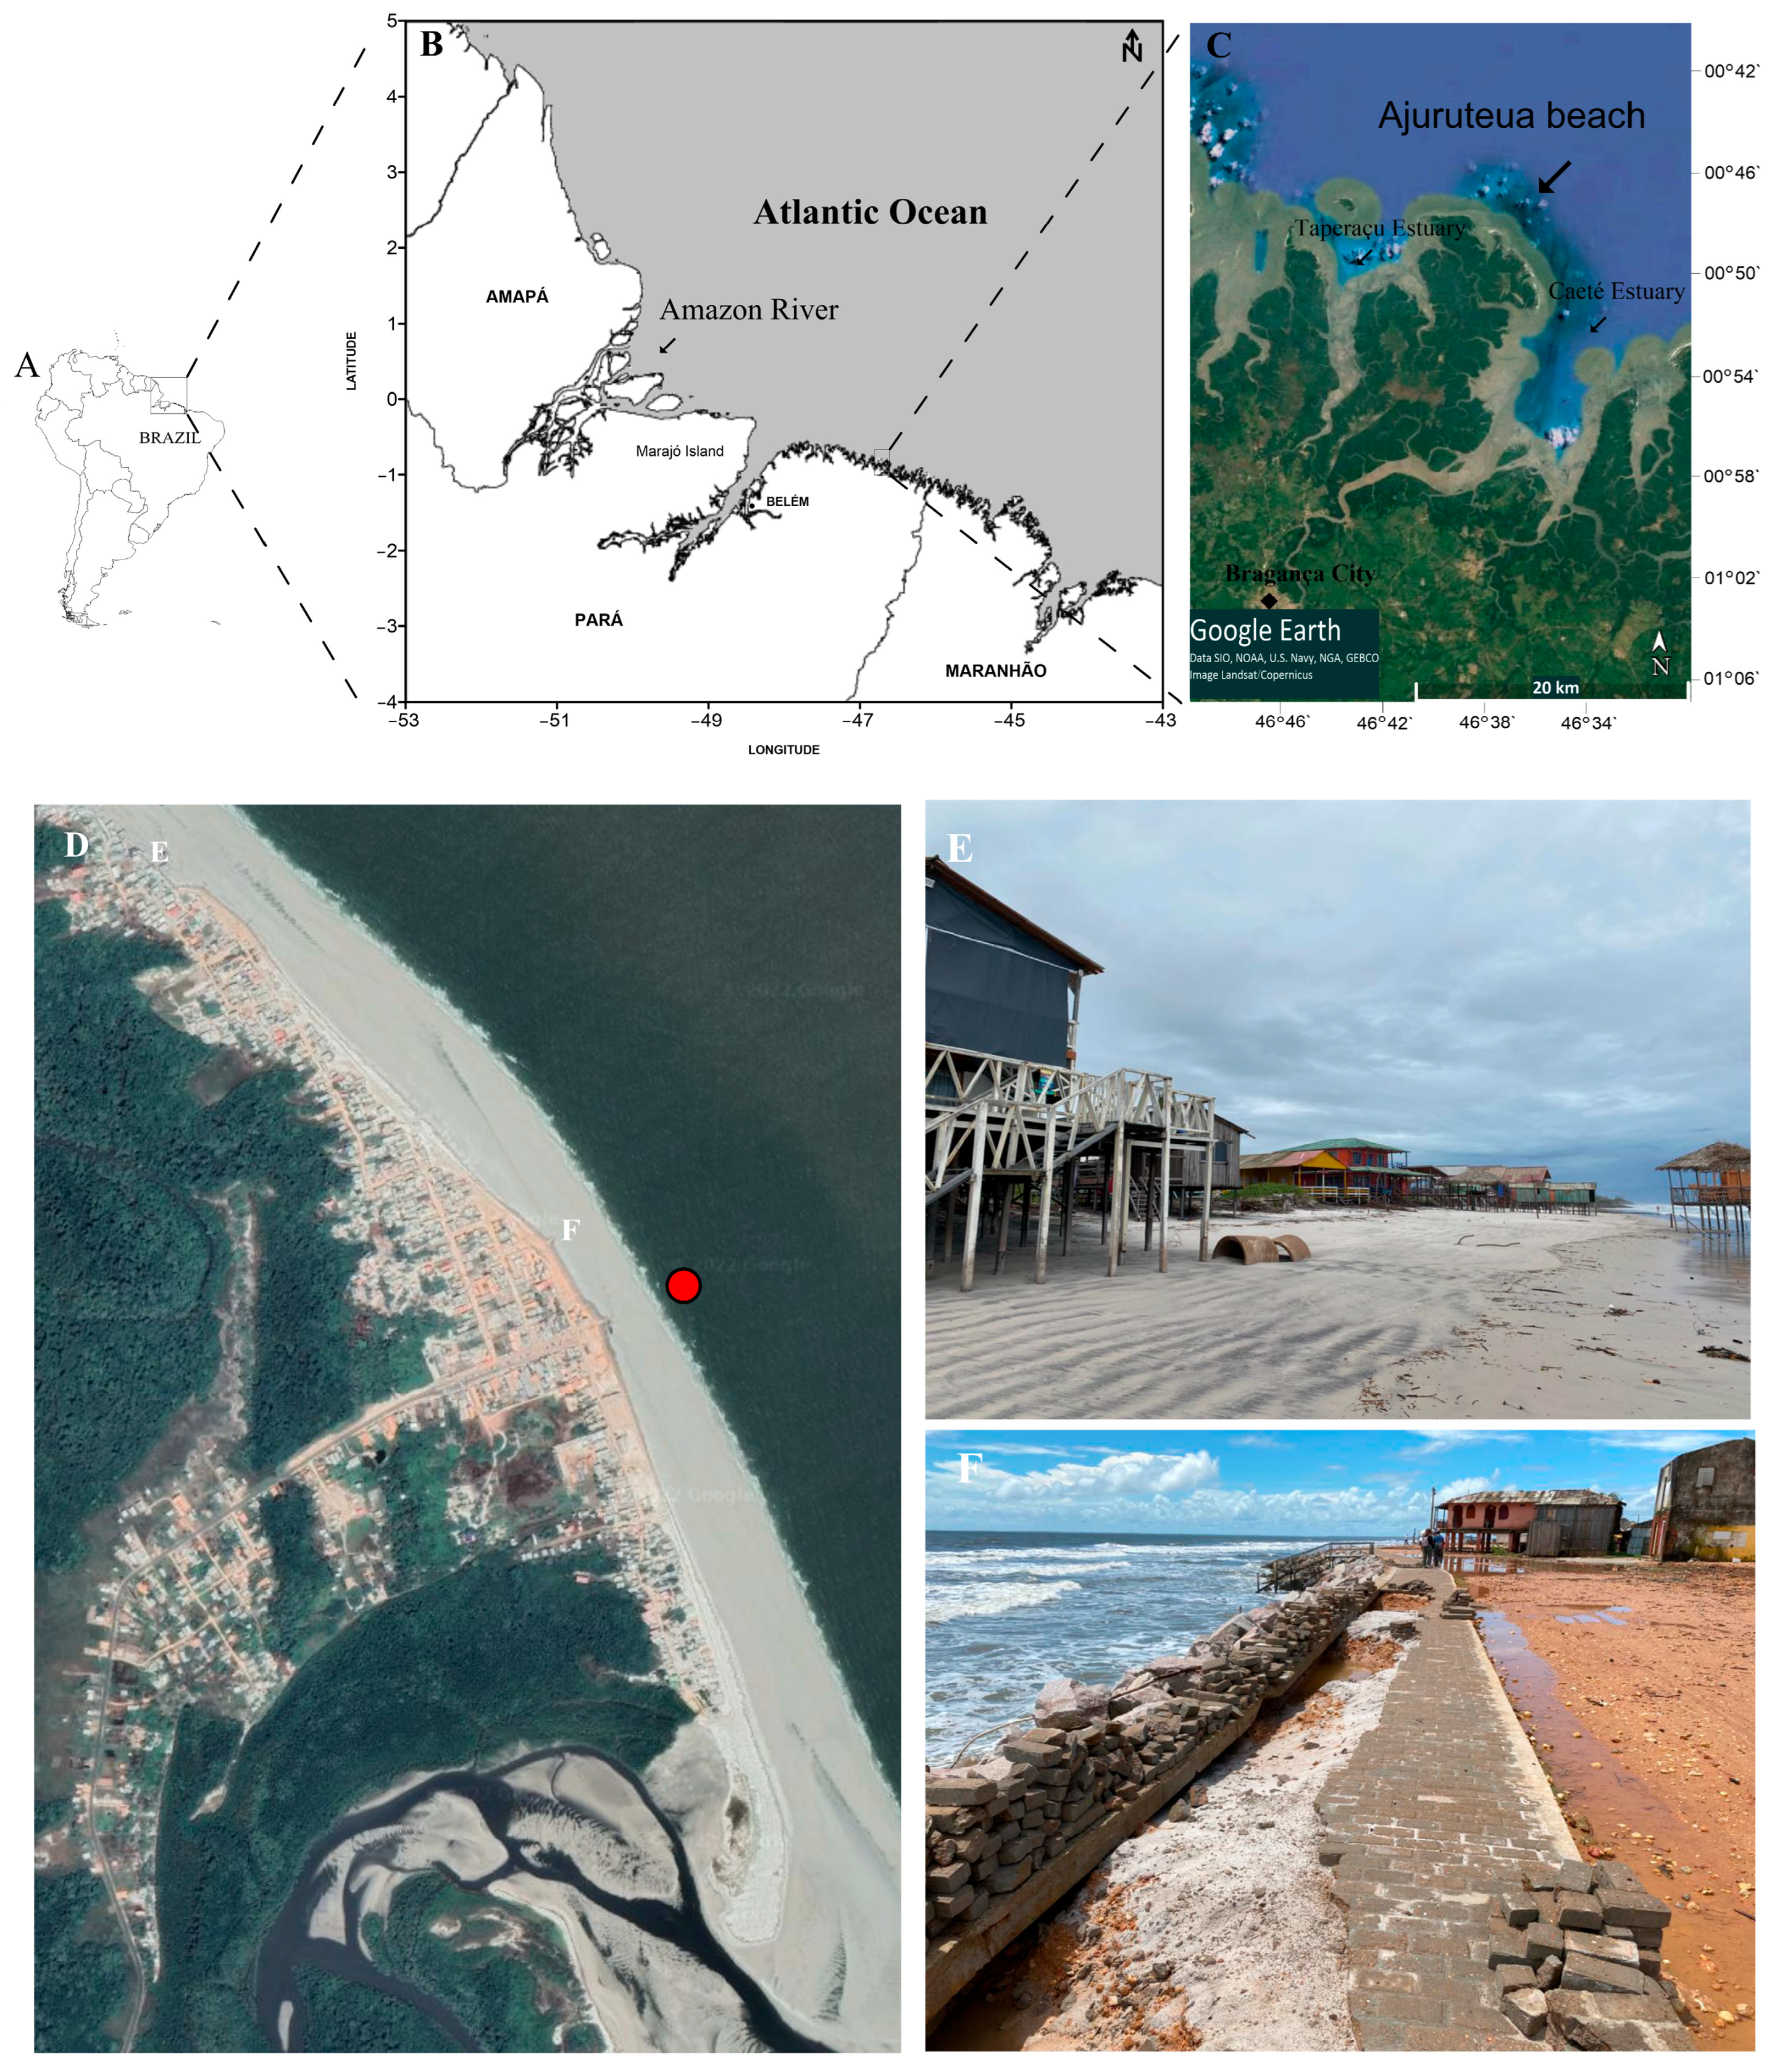
Figure 1. Study area focusing on (A) South America, (B) the Brazilian Amazon coastline, (C) the Bragantinian Peninsula, including the Caeté and Taperaçu estuaries as well as Bragança city, (D) Ajuruteua Beach, (E) unregulated development within the intertidal zone of Ajuruteua Beach, and (F) erosion in the waterfront area of Ajuruteua Beach. The red circle in Figure 1D marks the location of the oceanographic station.
Coasts 05 00029 g001
Figure 2. Box plot of wind speed (A) and wave height (B) in rainy and dry seasons and seasonal wind and wave directions (θ °N), as well as a histogram (%) (C) of the wind speed classes (rainy (D) and dry (E) seasons) and wave height (rainy (F) and dry (G) seasons) from the NOAA (station 41041) for the period of 2006–2018.
Coasts 05 00029 g002
Figure 3. Offshore (A) wind (intensity in m s−1) and (B) wave (height (m) and period (s)) conditions between 2006 and 2018. The circles mark the maximum values in the dataset.
Coasts 05 00029 g003
Figure 4. (A) Three-month Oceanic Niño Index and (B) annual rainfall levels from 2006 to 2018, emphasizing key climate events (LN = La Niña; EN = El Niño; D = drought), alongside the historical average (red line). Data sources: the NOAA for (A) and the INMET for (B).
Coasts 05 00029 g004
Figure 5. Monthly variation in river discharge (m3 s−1) and rainfall (mm) from 2006 to 2018. (Source: river discharge obtained from ANA and rainfall levels obtained from INMET).
Coasts 05 00029 g005
Figure 6. Tidal water level data recorded by the CHN at the Fundeadouro de Salinópolis station, spanning the period from 2006 to 2018.
Coasts 05 00029 g006
Figure 7. Representation of water level (blue line), significant wave heights (Hs, green line), and wave periods (T, red line) observed during various months in 2012 (AC), 2013 (DG) and 2014 (H) at Ajuruteua Beach.
Coasts 05 00029 g007
Figure 8. Google Earth satellite image showing the coastline (lines) and house locations (pins) in three years—(A) 2007 (yellow), (B) 2013 (red), and (C) 2021 (blue)—highlighting the effects of coastal erosion in the study area. Image (D) illustrates how the coastline changed over the three-year period.
Coasts 05 00029 g008
Figure 9. Representation of unregulated development across various areas: intertidal beach zones (AC), frontal dunes (DF), and debris from houses located in front of seawalls (G,H).
Coasts 05 00029 g009
Table 1. Natural characteristics during field campaigns.
SeasonNatural Conditions and Months
Rainy- When river discharge begins to rise and aligns with equinoctial tides, it typically occurs during March and April.
- When the peak of river discharge reaches its highest values, it typically occurs during May and June.
Dry- When river discharge decreases and aligns with equinoctial tides, this typically occurs in September and October.
- When local river discharge reaches its lowest levels, it is usually observed in November and December.
Table 2. Maximum beach retreat in NW sector and eroded area for 2007–2013, 2007–2021, and 2013–2021.
Features2007–20132013–20212007–2021
Area0.12 km20.03 km20.15 km2
Maximal beach retreat 0.245 km0.119 km0.360 km
Disclaimer/Publisher’s Note: The statements, opinions and data contained in all publications are solely those of the individual author(s) and contributor(s) and not of MDPI and/or the editor(s). MDPI and/or the editor(s) disclaim responsibility for any injury to people or property resulting from any ideas, methods, instructions or products referred to in the content.