Article

Shoreline Response to Hurricane Otis and Flooding Impact from Hurricane John in Acapulco, Mexico

by
Luis Valderrama-Landeros
1,
Iliana Pérez-Espinosa
1,
Edgar Villeda-Chávez
1,
Rafael Alarcón-Medina
2 and
Francisco Flores-de-Santiago
3,*
1
Coordinación de Percepción Remota, Comisión Nacional para el Conocimiento y Uso de la Biodiversidad (CONABIO), Mexico City 14010, Mexico
2
Departamento de Estudios Culturales, El Colegio de la Frontera Norte, Carretera Escénica Tijuana-Ensenada, San Antonio del Mar, Tijuana 22560, Mexico
3
Instituto de Ciencias del Mar y Limnología, Universidad Nacional Autónoma de México, Mexico City 04510, Mexico
*
Author to whom correspondence should be addressed.
Coasts 2025, 5(3), 28; https://doi.org/10.3390/coasts5030028
Submission received: 31 May 2025 / Revised: 5 July 2025 / Accepted: 31 July 2025 / Published: 4 August 2025

Abstract

The city of Acapulco was impacted by two near-consecutive hurricanes. On 25 October 2023, Hurricane Otis made landfall, reaching the highest Category 5 storm on the Saffir–Simpson scale, causing extensive coastal destruction due to extreme winds and waves. Nearly one year later (23 September 2024), Hurricane John—a Category 2 storm—caused severe flooding despite its lower intensity, primarily due to its unusual trajectory and prolonged rainfall. Digital shoreline analysis of PlanetScope images (captured one month before and after Hurricane Otis) revealed that the southern coast of Acapulco, specifically Zona Diamante—where the major seafront hotels are located—experienced substantial shoreline erosion (94 ha) and damage. In the northwestern section of the study area, the Coyuca Bar experienced the most dramatic geomorphological change in surface area. This was primarily due to the complete disappearance of the bar on October 26, which resulted in a shoreline retreat of 85 m immediately after the passage of Hurricane Otis. Sentinel-1 Synthetic Aperture Radar (SAR) showed that Hurricane John inundated 2385 ha, four times greater than Hurricane Otis’s flooding (567 ha). The retrofitted QGIS methodology demonstrated high reliability when compared to limited in situ local reports. Given the increased frequency of intense hurricanes, these methods and findings will be relevant in other coastal areas for monitoring and managing local communities affected by severe climate events.

1. Introduction

Hurricanes are severe meteorological phenomena characterized by intense wind gusts, storm surges, and heavy rainfall. They originate in tropical regions as a result of the vertical and circular movement of warm, moist air over the ocean surface [1]. These systems typically propagate westward, though their paths can vary due to atmospheric currents. Upon landfall, hurricanes weaken due to the loss of oceanic heat and moisture but still cause substantial damage to coastal infrastructure and ecosystems [2]. Mexico’s geographical location exposes it to hurricanes from both the Atlantic and Pacific basins [3]. In the Atlantic, hurricanes frequently develop near the West African coast and move westward across the Caribbean Sea, while in the Eastern Pacific, they form off the coast of Central America and often move northwestward along Mexico’s coastline [4].
One of the first hurricane impact studies focused on Hurricane Hugo, which struck the east coast of the United States of America in 1989, causing the loss of up to 91% of the coastal vegetation canopy [5]. The landfall of hurricanes Ivan in 2004, Katrina and Rita in 2005, and Gustav and Ike in 2008 substantially altered the shoreline along the north section of the Gulf of Mexico, causing a shoreline retreat of approximately 100 m [6]. In such cases, the severe retreat of shorelines and dunes, which protect beaches from waves and tidal forces, was particularly pronounced, with some dunes losing several meters in height during each hurricane event. Specifically, hurricanes significantly contribute to shoreline retreat through storm surges and changes in flooding regimes. These immediate impacts can hinder the long-term capacity of coastal dunes, beaches, and wetlands to protect inland areas from hurricane damage. Moreover, coastal constructions can exacerbate hurricane impacts by restricting natural sand movement [7]. In recent years, there has been growing interest in studying the impact of hurricanes on coastal tourist areas because of their economic and ecological importance [8]. For example, the strong winds and flooding from hurricanes may trigger landslides (e.g., Hurricane Maria in Dominica in 2017) and cause structural damage to roads, ports, and buildings, leading to major economic losses. Conversely, tropical storms and hurricanes serve as the primary freshwater source for desert regions in northwestern Mexico, where major tourist destinations have expanded in recent decades [9].
Traditional methods for monitoring shorelines typically involve topographic profiles using total stations, optical levels, and handheld hypsometers [10,11,12]; GPS surveys in the intertidal zone [13,14,15]; small research aircraft [16,17,18]; and drone flights [19,20,21]. While these approaches are valuable, they can be time-consuming and costly, often resulting in limited spatial coverage [22]. Additionally, most of these methods require field deployments, which may be impossible immediately after the landfall of a major hurricane [23]. Assessing hurricane impacts through field surveys presents substantial challenges, including travel risk in flooded areas, landslides, and restricted access by federal authorities [24]. Hurricanes in the Pacific Ocean also form rapidly (~5 days from formation to landfall), often with unpredictable trajectories. This frequently leads to a dearth of pre-impact field data, complicating comparisons with post-event conditions for monitoring efforts [25]. Consequently, spaceborne multispectral sensors are often the most effective tool for analyzing hurricane effects [26]. However, their utility is limited by cloud cover interference, making them effective only in specific weather conditions [27]. As hurricanes generate extensive clouds, these sensors may be unsuitable. Unhampered by cloud cover, an alternative approach could be the use of active sensors such as Synthetic Aperture Radar (SAR) data [28]. These data are particularly valuable in flat, flood-prone coastal areas, where the incident angle of the backscatter SAR signal and the calm water surfaces yield optimal spatial data [29].
The coastal city of Acapulco recently experienced the impacts of two hurricanes: Otis on 25 October 2023 and John on 23 September 2024. Otis made direct landfall at the port of Acapulco as a Category 5 hurricane on the Saffir–Simpson scale, with sustained winds of 265 km/h. This made it both the most devastating hydrometeorological event in Mexico during 2023 and the strongest hurricane ever recorded along the Eastern Pacific coast [30]. Hurricane John, a Category 2 storm, made landfall 120 km southeast of the city. However, it followed an unusual trajectory, crossing over the western mountain range as a Category 1 hurricane before returning to sea, while generating substantial rainfall in mountainous areas. Thus, the primary objective of this study was to examine the impacts of Hurricane Otis on shoreline dynamics, with specific emphasis on quantifying areas of erosion and accretion. Additionally, we assessed flood extent from both hurricanes Otis and John, focusing on the most severely affected zones. We excluded shoreline changes caused by Hurricane John, as its impact occurred farther from the city of Acapulco.

2. Materials and Methods

2.1. Study Area

The study area is situated along the municipality of Acapulco’s shore (Acapulco is the name of a port, a city, and a region), which spans about 80 km of shoreline from Mitla in the northwest to the Papagayo River mouth in the southeast (Figure 1). The local tidal regime is semidiurnal, with a maximum amplitude of 0.9 m during summer spring tides https://predmar.cicese.mx/ (accessed on 24 June 2025). Acapulco lies along a collision coast formed by the interaction of the North American and Cocos tectonic plates [31], resulting in a narrow continental shelf (~10 km wide) dominated by reflective-type beaches [32].
Two coastal lagoons are found within this area: Coyuca in the northern part and Tres Palos in the south [33]. Along this shoreline lie Acapulco’s most prominent tourist areas and infrastructure, on which the local economy heavily depends, including numerous beachfront hotels, attractions, and an international airport. Pie de la Cuesta Beach (adjacent to Coyuca Bar), the Bay of Acapulco, and Zona Diamante are the core of Acapulco’s tourism industry [34]. Hurricane Otis’s impact severely impinged on a local economy already ravaged by more than a decade of drug-related violence and recurring natural disasters, boosted by poor planning devoid of any environmental perspective [35]. In the 1940s, Acapulco emerged as one of the world’s most renowned beach tourist destinations. Still, deterioration caused by a lack of environmental perspective in its urban planning has since undermined its touristic appeal. As this study shows, some of the more damaged areas are precisely those that have historically experienced larger infrastructure growth (seafront hotels and resorts) over the last few decades, namely, beach spots in Zona Diamante.

2.2. Environmental Data

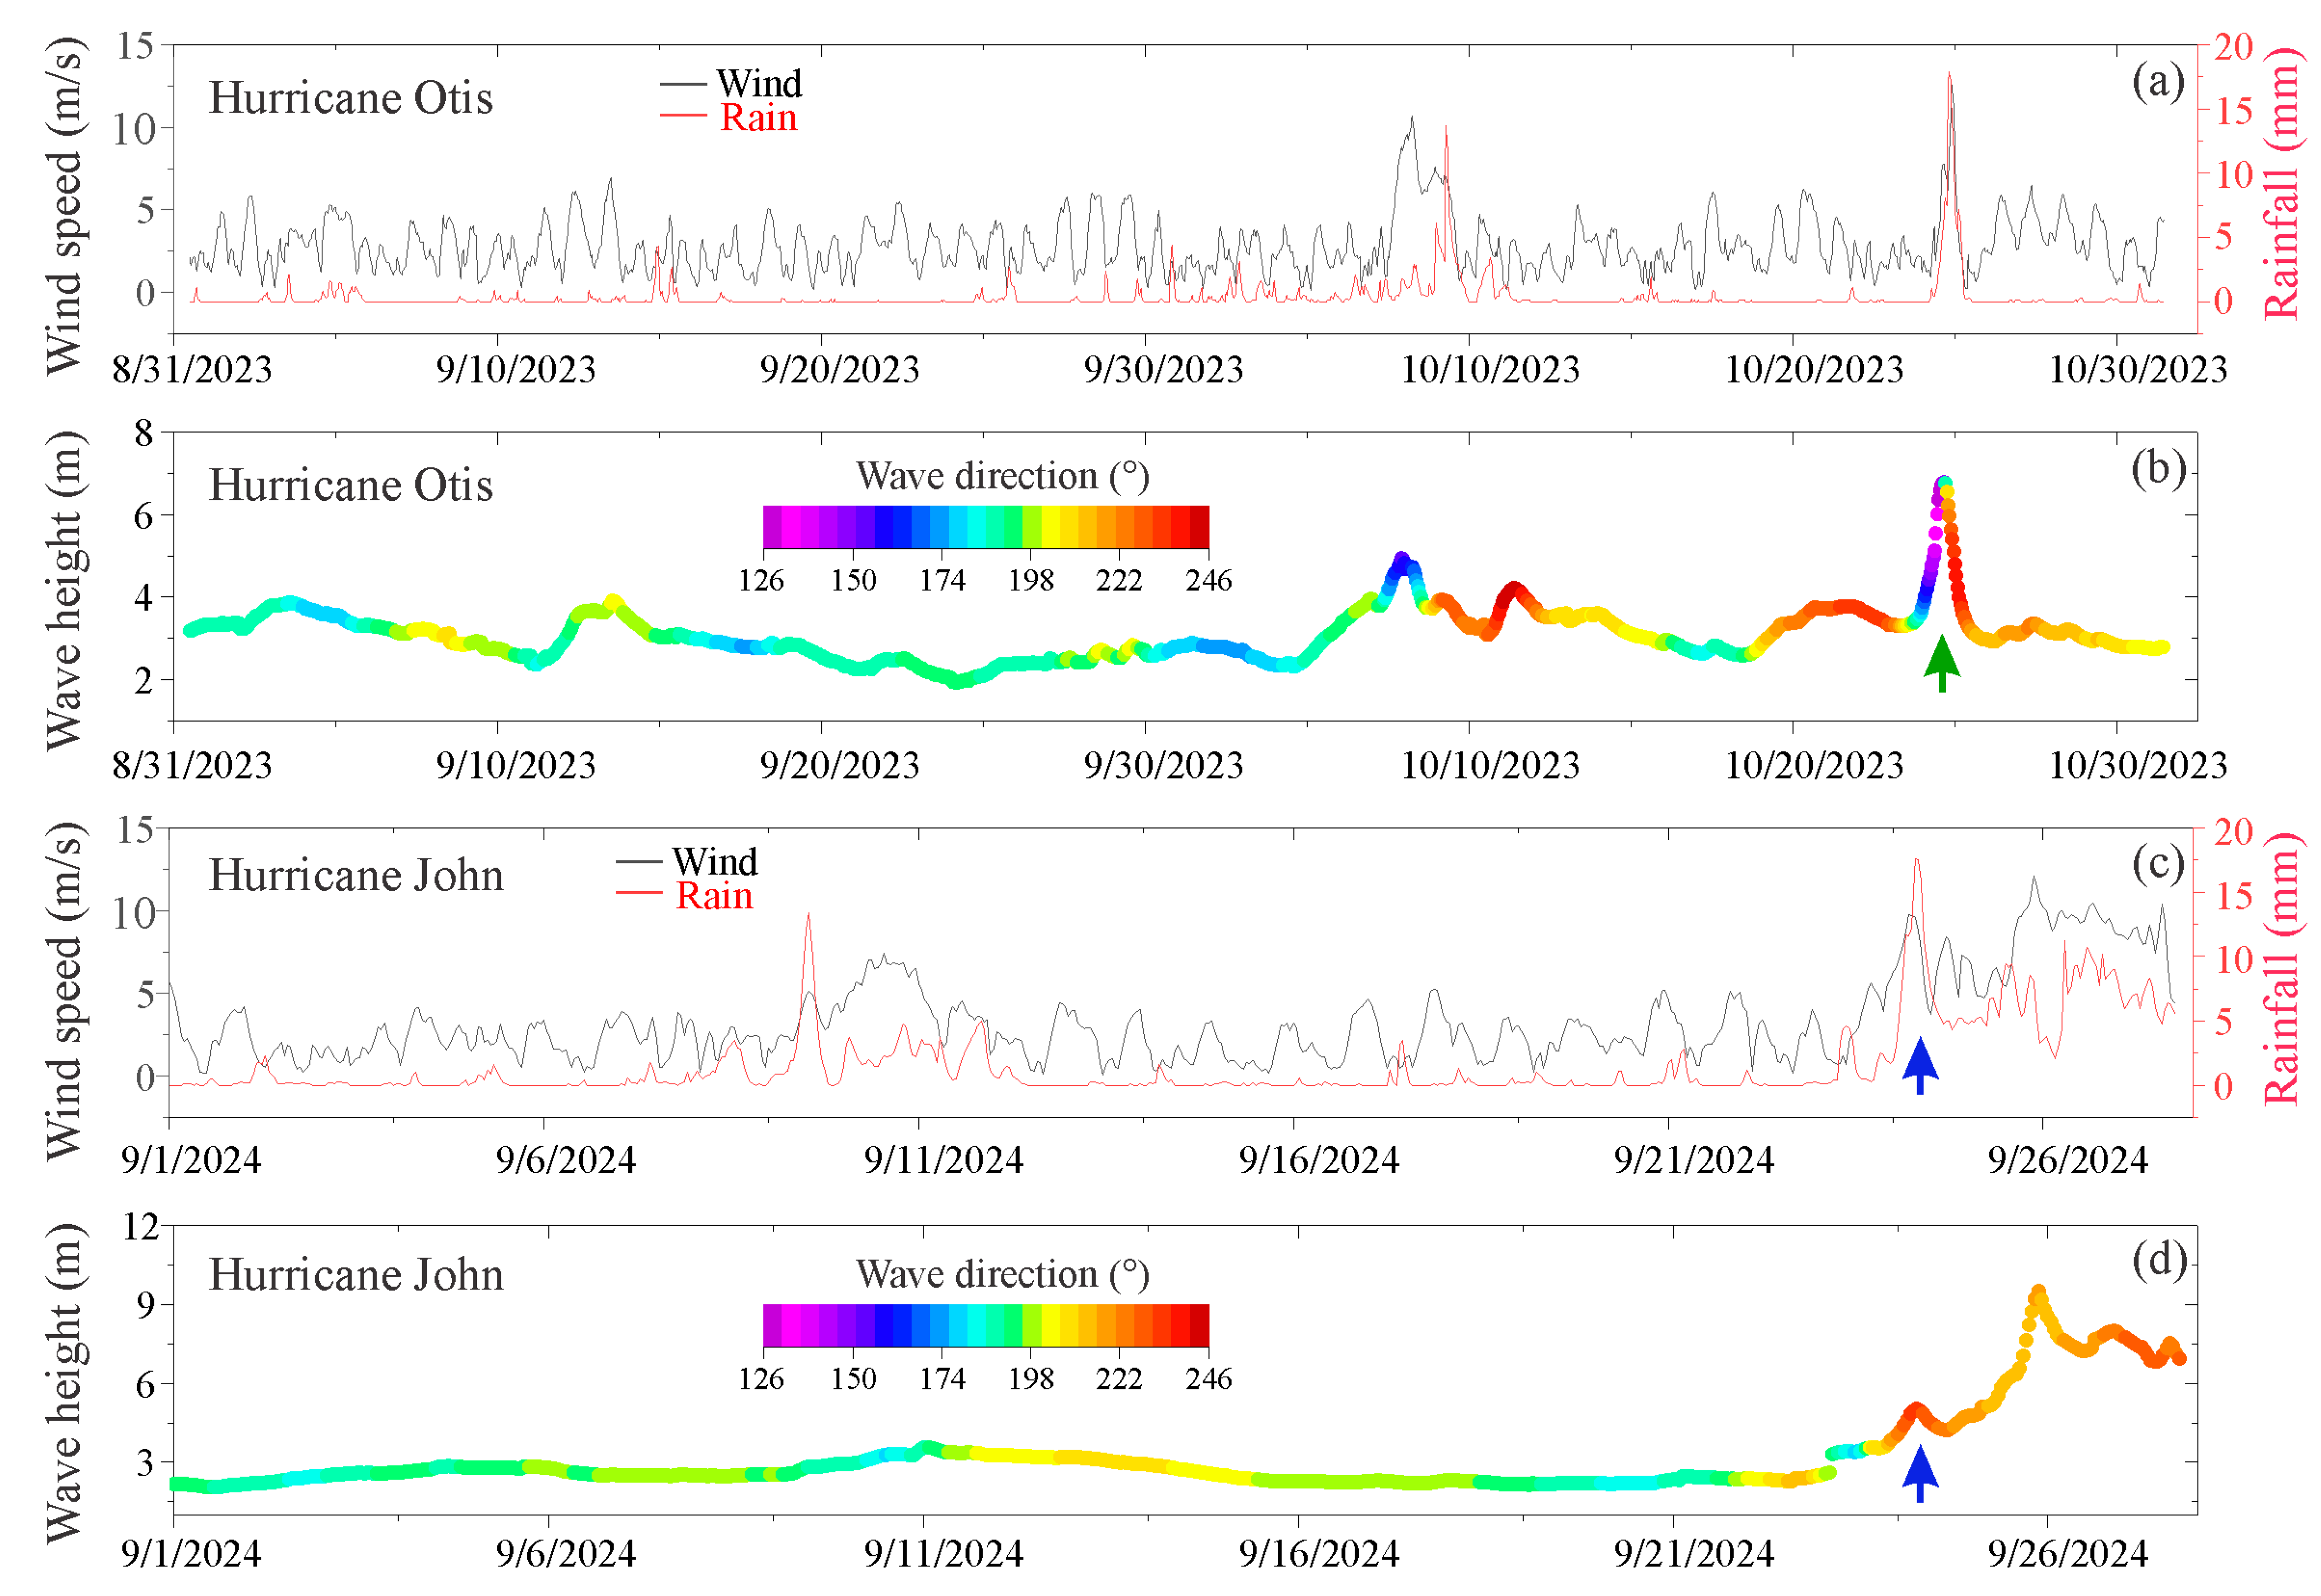
We collected hourly environmental data from the ERA5 platform (https://cds.climate.copernicus.eu/, accessed 2 October 2024) for two distinct time series (Figure 2). The first dataset covers the period from 1 September to 31 October 2023, capturing the impact of Hurricane Otis. The second dataset covers the period from 1 to 28 September 2024, during the impact of Hurricane John. Specifically, we downloaded data for wind speed (m/s), rainfall (mm), maximum wave height (m), and wave direction (°) off the coast of the city of Acapulco. We processed and visualized the data using the R programming language.

2.3. Shoreline Monitoring

The research area was divided into three distinct sectors, namely the northwest coast (from Mitla Beach to Coyuca Bar), the Bay of Acapulco (the central area), and the southeast coast (spanning from Zona Diamante to the mouth of the Papagayo River). To determine the instantaneous position of a shoreline, we used the Normalized Difference Water Index (NDWI) in a series of 5 m spatial resolution images acquired from the PlanetScope website (https://account.planet.com/, accessed 11 July 2024). The NDWI equation is
N D W I = G r e e n N e a r   i n f r a r e d G r e e n + N e a r   i n f r a r e d
The NDWI is a normalized index that yields positive values for water features and negative or zero values for soil and vegetation [36]. Compared to traditional multispectral spaceborne data sources, such as Sentinel-2 and the Landsat program, PlanetScope imagery offers superior temporal resolution (daily acquisitions) for tracking dynamic events like hurricanes, along with finer spatial resolution (3 to 5 m/pixel), which is substantially better than that of Sentinel-2 (10 m) and Landsat (30 m) data [37]. Moreover, PlanetScope images are available upon request in two versions: a basic top-of-atmosphere radiance product and a rectified surface reflectance version processed using the 6Sv2.1 radiative transfer code. Both versions are available in two configurations: one featuring four bands (blue, green, red, and near-infrared) and another encompassing eight bands (coastal blue, blue, green I, green, red, yellow, red edge, and near-infrared). One consideration is that PlanetScope images come at a cost; however, they can be purchased for specific areas and dates, offering customized datasets tailored to users with particular needs.
The tidal level at the time of each satellite image was estimated using the semi-diurnal M2 tidal amplitude harmonic, derived from freely available tidal prediction software MAR v.1.0 http://predmar.cicese.mx/ (accessed 24 June 2025). The acquisition time of each satellite image was extracted from the metadata file and adjusted to GMT-6. Subsequently, we conducted an automatic vectorization analysis using the QGIS v.3.42.2 software (previously known as Quantum GIS) with the aid of equidistant transects based on a constant baseline [38]. The method described above is similar to the commonly employed Digital Shoreline Analysis System (DSAS), designed as an add-on for ArcMap v.10.2.2 software. However, we retrofitted the DSAS method within the open-source QGIS software.
Actual rate-of-change variables were quantified using each shoreline intersection among the transects. As a general rule, the shoreline movement difference concerning the baseline is considered a seaward shift (accretion) and a landward shift (erosion) at each transect. The transects were instrumental in delimiting the direction and extent of the area involved using vectors. Specifically, the changes in direction (shoreline retreat or accretion), the distance in meters, and the area involved in the displacements of average shoreline vectors before and after Otis were determined by intersecting them to estimate the average coastline movement for each period.
Shoreline change rates were quantified by measuring displacement at each transect–shoreline intersection. As a general rule for coastal geomorphology assessments, seaward displacements (accretion) were assigned positive values, while landward displacements (erosion) received negative values. The transect network enabled vector-based analysis of shoreline change, providing accurate measurements of (1) displacement direction (accretion or retreat), (2) magnitude of change (in meters), and (3) affected area extent [39]. To address the possible influence of tidal variations in the different satellite image scenes, we opted to average the shoreline vectors over the two specific periods [40]. This approach is commonly used with large databases when field verifications are unfeasible, such as when dealing with historical, multidecadal data or remote or inaccessible locations. In this sense, we were unable to assess beach conditions before the hurricane’s impact because we only became aware of its path a few days before it made landfall. Additionally, we were unable to conduct fieldwork after the impact due to the city of Acapulco being inaccessible and considered a disaster zone for several months.

2.4. Synthetic Aperture Radar Analysis

The physical characteristics of water make it highly detectable using a polarized SAR signal in flat terrain, as it produces a clear reflection. However, SAR signals exhibit increased backscatter errors in regions with steep slopes, generating excessive speckle noise [41]. Consequently, two masks were developed for the study area to mitigate these issues. The first mask excluded areas with steep slopes (exceeding a 5% incline) where water accumulation would be improbable, while the second mask targeted regions with permanent water bodies, such as the two coastal lagoons and the sea. We utilized the NASA global digital elevation model (DEM) [42] with a 30 m spatial resolution as the base dataset. This DEM was processed using the “Terrain” algorithm in the Google Earth Engine (GEE) to generate a slope map, with values expressed as percent slope (vertical meters of elevation change per 100 horizontal meters). Additionally, to identify permanent water bodies, we analyzed the complete GEE Dynamic World image collection [43] and specifically selected pixels classified as “water” from 1 January 2023 to 1 January 2024, and until the specific date of each hurricane’s impact.
The analysis was conducted in two stages: before and after the landfall of Hurricane Otis (October 2023) and Hurricane John (September 2024). For Hurricane Otis, we utilized Sentinel-1 SAR data from 12 October 2023 and 24 October 2023, while for Hurricane John, we used 12 September 2024 and 24 September 2024 acquisitions. In both cases, we applied a morphological reducer filter (focalMedian) using a circular kernel with a 100-pixel radius to reduce speckle noise [44]. Subsequently, the difference between the later and earlier dates was quantified using a flooding threshold for pixels with values less than −3 dB difference [45]. This threshold was detected by analyzing the Sentinel-1 histogram of the study area. However, previous studies have identified water discrimination thresholds of −19 dB in cross-polarization ALOS PALSAR [46] and −14 dB in co-polarization RADARSAT-2 data [47]. The biggest advantage of Sentinel-1, compared to other spaceborne SAR sensors, is that it provides free SAR data. Sentinel-1 offers frequent revisit times of up to 6 days at the equator. Sentinel-1 operates with dual-polarization (VV and VH), providing more detailed information about the surface than single-polarization data, which enables more accurate classification of surface features. Sentinel-1 operates in the C-band (~5.5 cm wavelength) with a frequency of around 5.405 GHz. The Interferometric Wide (IW) mode provides a swath width of 250 km, primarily used for coastal monitoring [48].

3. Results

The time series of wind speed and rainfall data during Hurricane Otis depicts specific patterns (Figure 3). Notably, the peak rainfall of 18 mm and the average wind speed of 14 m/s over 30 h coincided with the landfall of Hurricane Otis on 25 October 2024. Additionally, the maximum wave height, primarily from the south (180°), ranged between 2 and 4 m. However, during Hurricane Otis, it surged to 7 m, with wave directions varying between southeast (135°) and southwest (225°). During the impact of Hurricane John, a similar situation was observed. However, it is worth noting that the maximum wave height recorded was remarkably lower, measuring 4 m.
Furthermore, the wave direction was predominantly from the west (270°), which aligns with the displacement vector associated with Hurricane John. Wind and rainfall data show an increase during Hurricane John’s impact, even though the storm made landfall 120 km away from Acapulco. In contrast to Hurricane Otis, the rainfall from Hurricane John continued to fluctuate between 5 and 10 mm for up to 7 days after the impact, rather than punctually peaking.
The multispectral shoreline approach involved analyzing 49 PlanetScope images, free of cloud cover, taken on different dates. The shorelines were categorized into three sections: 18 images of the northwest coast, 29 of the Bay of Acapulco, and 20 of the southeast coast. All shoreline vector results were overlaid on the nearest available high-resolution Google Earth Pro image (March 2023) for visualization. The tide levels recorded in the PlanetScope satellite images at the time of acquisition exhibited an average of 18.7 ± 8.8 cm relative to the lower low sea level (LLSL). The minimum recorded tidal amplitude was 1.7 cm, and the maximum was 37 cm LLSL.
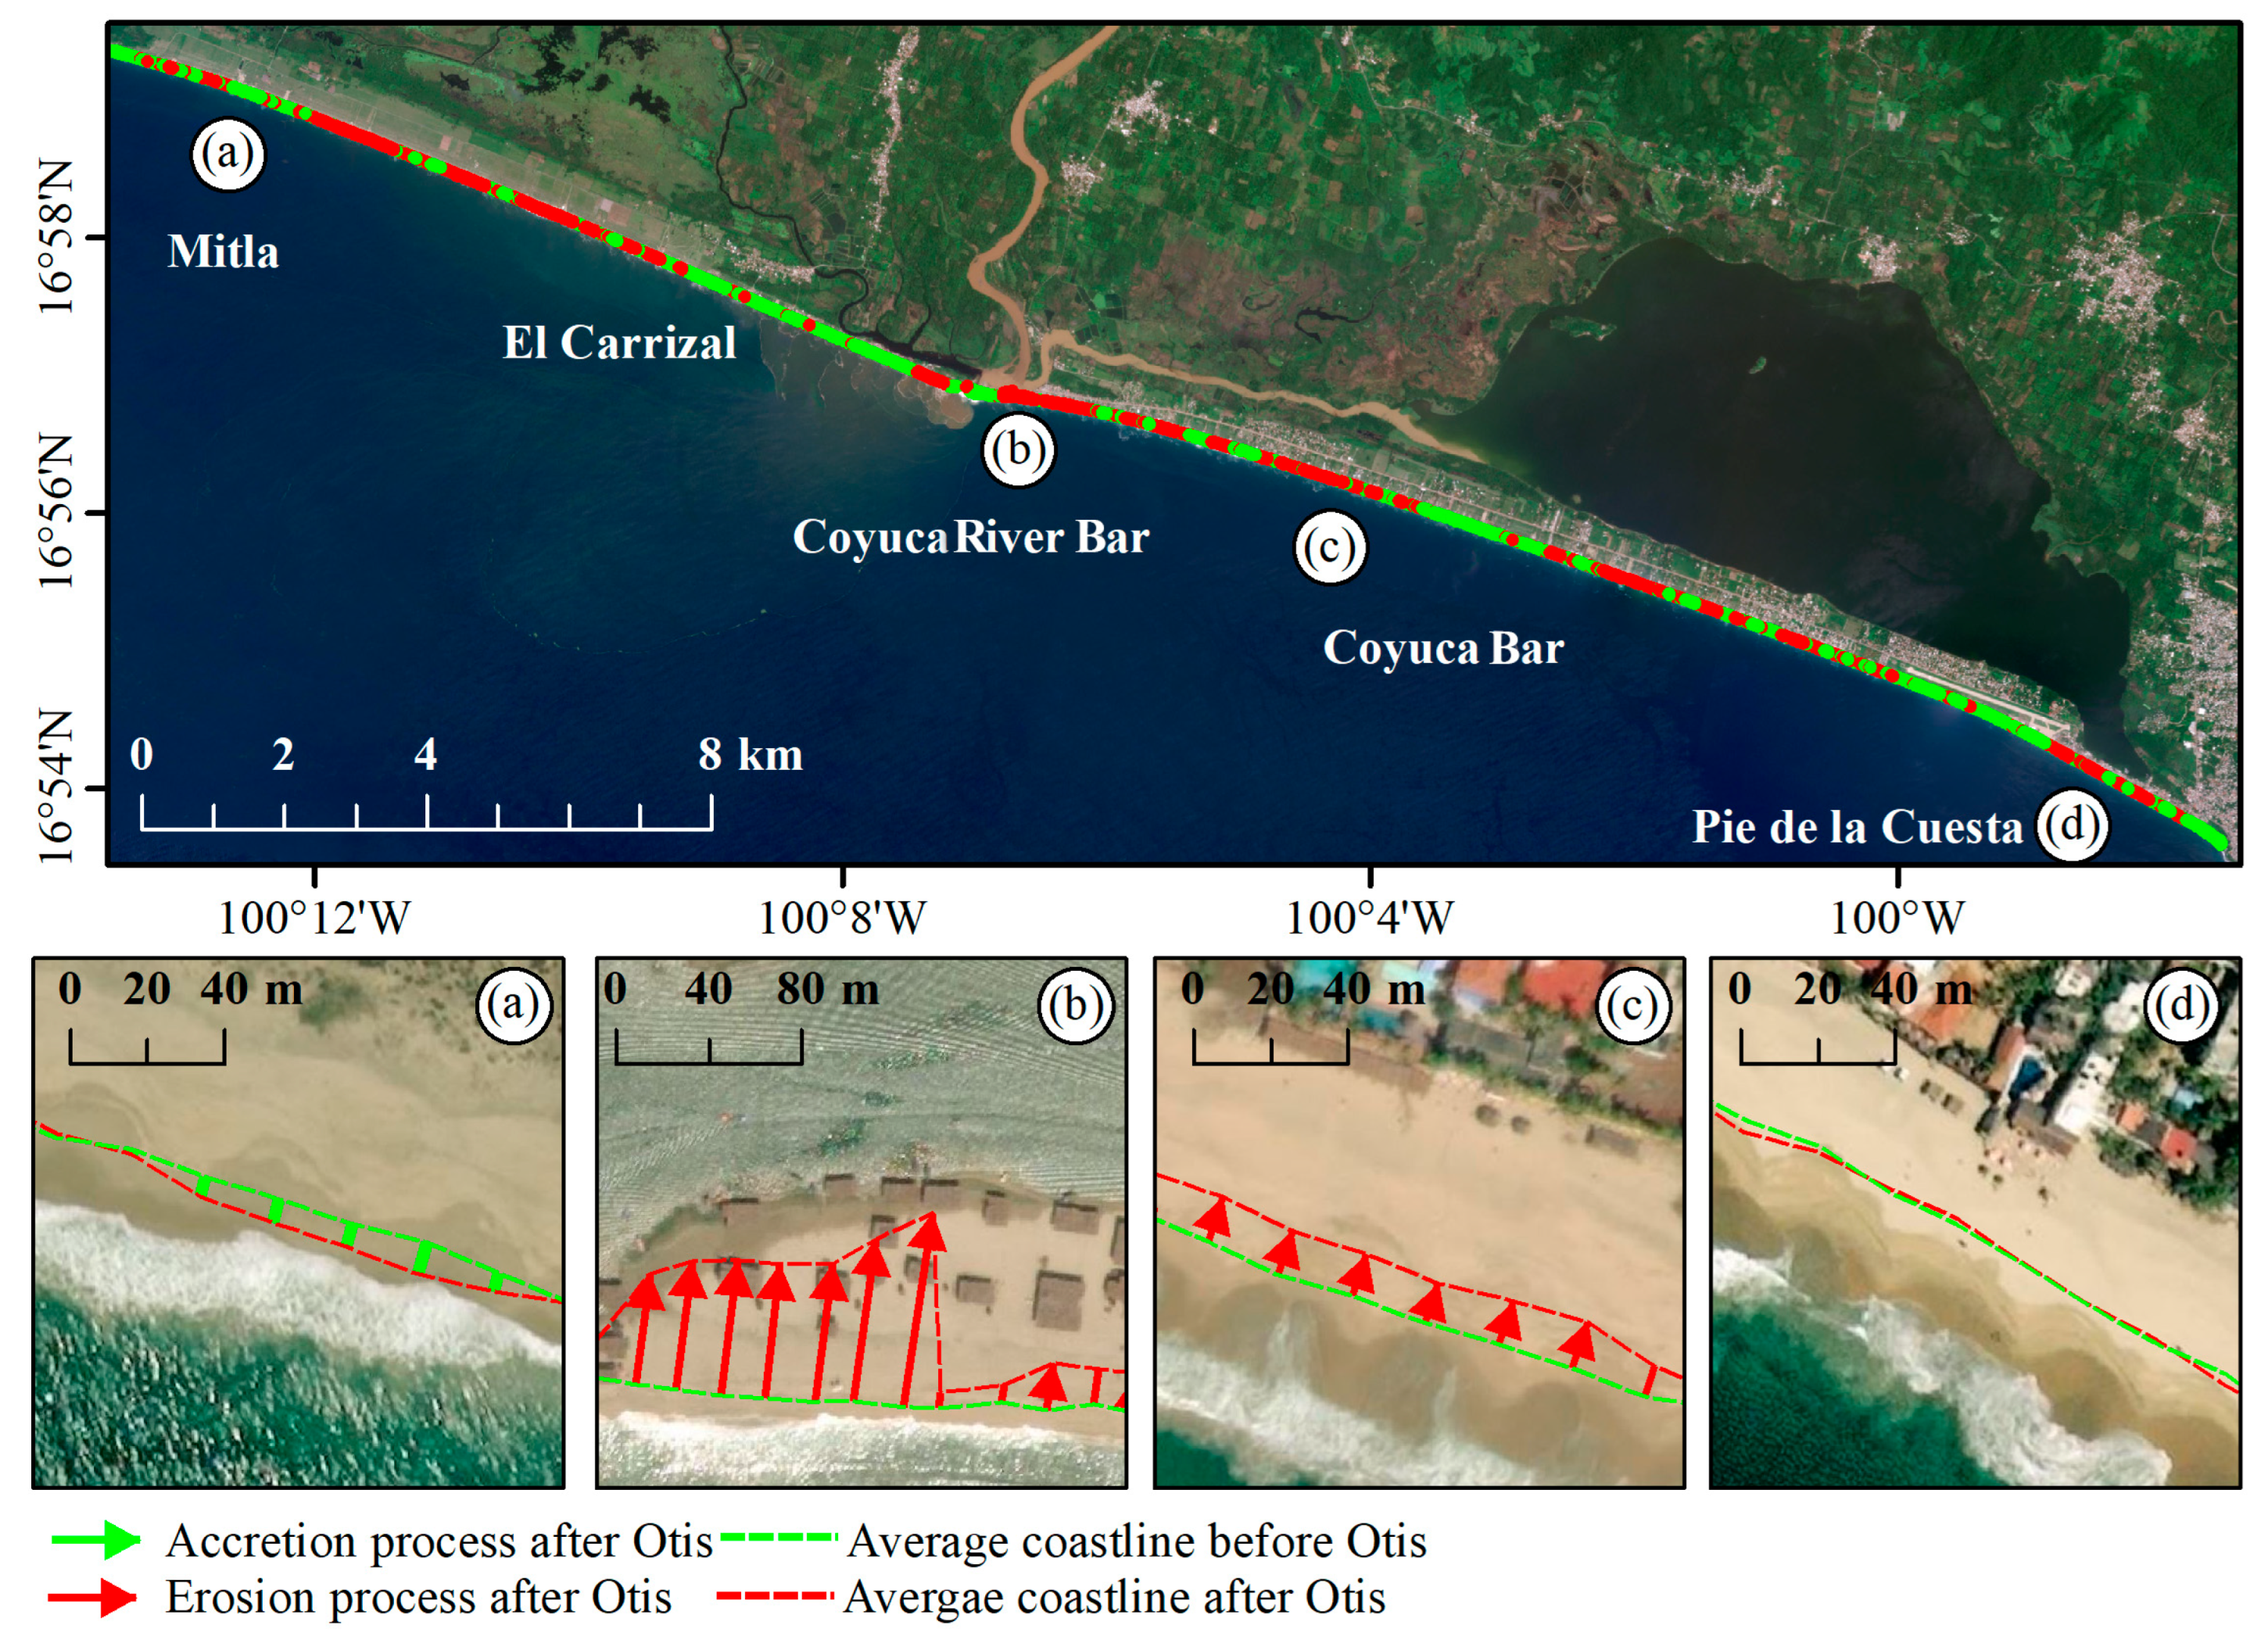
The northwest section underwent relatively minimal changes (Figure 4), with a maximum change of only 5 m—the average distance of the vectors was 4.9 ± 2.6 m for accretion and 5.3 ± 2.9 m for shoreline retreat. Thus, the changes were almost equally distributed between shoreline retreat (15 ha) and accretion (14 ha) when averaging the entire surface area based on the distance covered. However, the Coyuca Bar area was subjected to the harshest changes in surface area. This was primarily due to the complete disappearance of the bar on 26 October, spanning 85 m of shore retreat immediately after the passage of Otis. This area is characterized by scarce tourism infrastructure, such as seafront concrete hotels, and only a few wooden structures on the beach, all of which disappeared after the impact of Hurricane Otis.
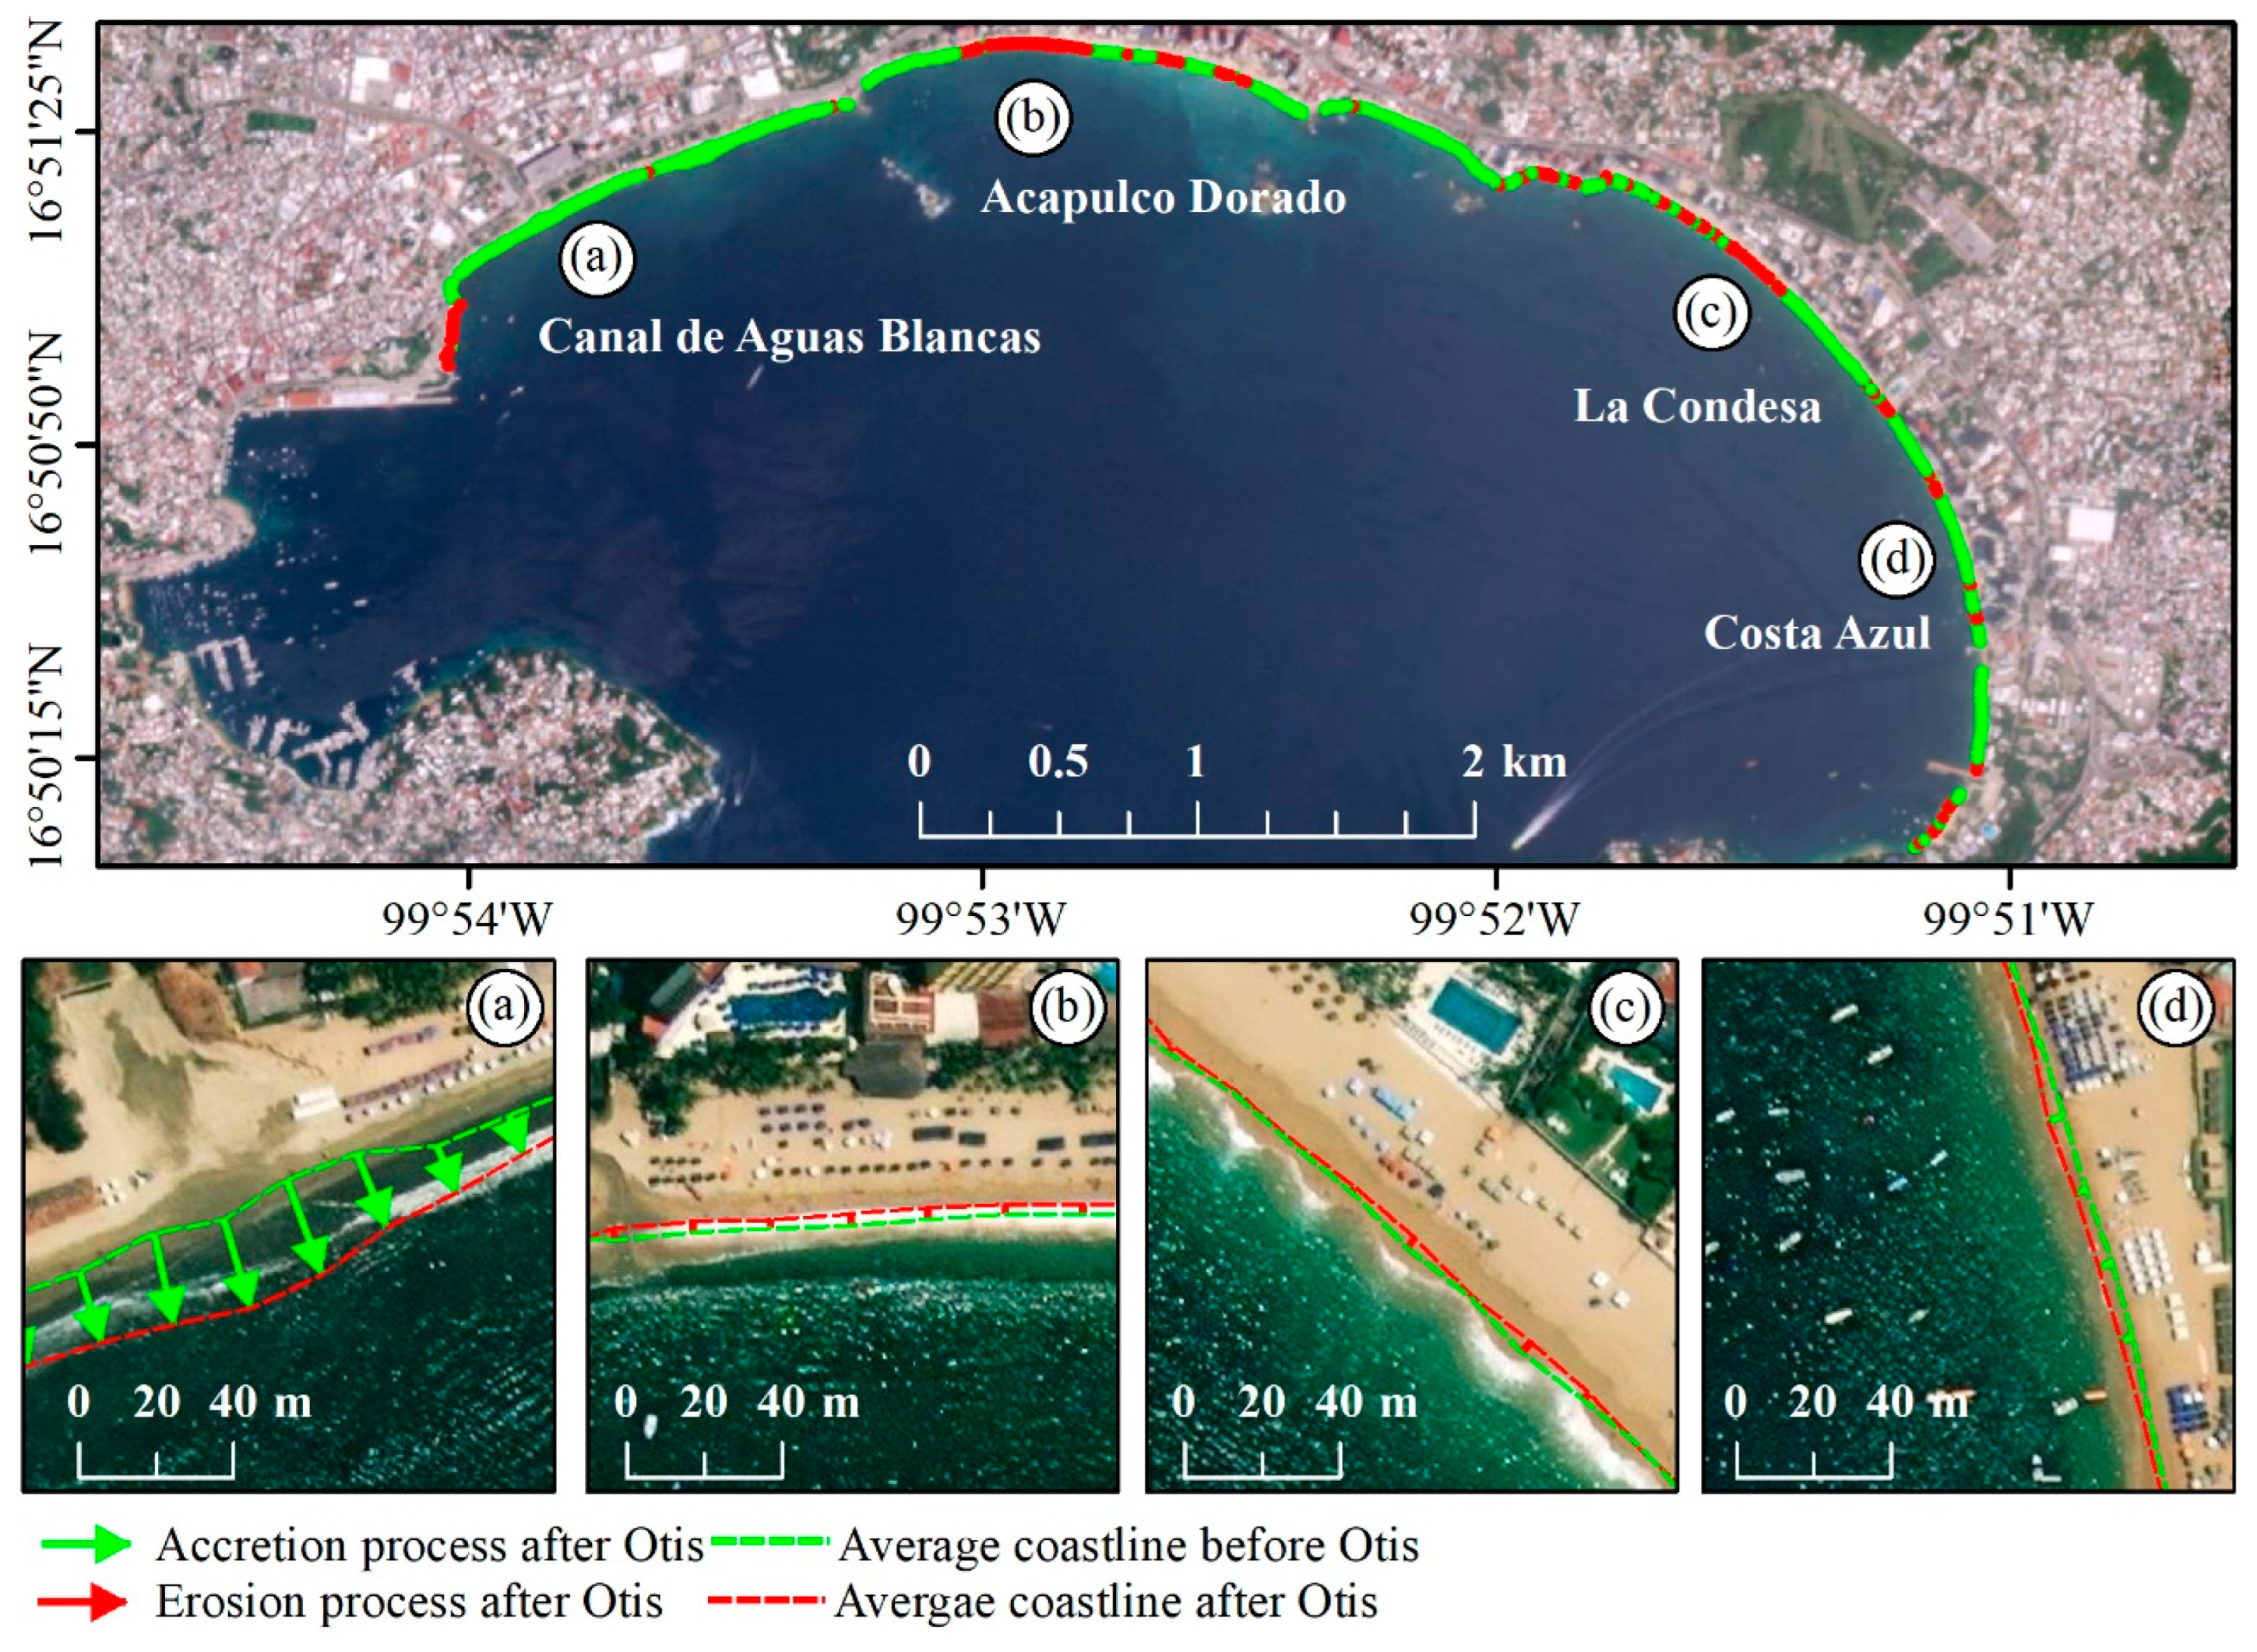
The alterations to the coastline of Acapulco Bay were relatively minor, resulting in a net increase in land area (Figure 5). The average distance of the vectors was 4.3 ± 2.1 m for accretion and 2 ± 0.6 m for shoreline retreat, resulting in approximately 6.97 ha of new land, primarily around the downtown creek (Figure 5a). Meanwhile, 0.86 ha of shoreline were lost near coastal structures, such as breakwaters, in the central bay (Figure 5b). The most notable changes occurred following Hurricane Otis, which struck to the northeast of Acapulco Bay, particularly impacting the popular tourist areas of Acapulco Dorado and La Condesa, where numerous hotels and attractions are located (Figure 5c,d).
The impact of Hurricane Otis resulted in substantial shoreline changes, particularly in the southeastern section (Figure 6). The average distance of the vectors showed higher variability due to the significant changes in shoreline retreat along the shoreline, with 6.7 ± 4.9 m for accretion and 25.7 ± 18.9 m for shoreline retreat. This pattern indicates a loss of 94 ha of beach, predominantly affecting Zona Diamante, where a shoreline retreat of up to 57 m was observed, a 2-fold increase compared to the average shoreline retreat of the entire area (Figure 6a,b). Subsequently, alternating processes of accretion and shoreline retreat were noted along the shoreline (Figure 6c), culminating at the mouth of the Papagayo River, where 11 ha of accretion and gains of up to 10 m towards the sea were observed (Figure 6d).
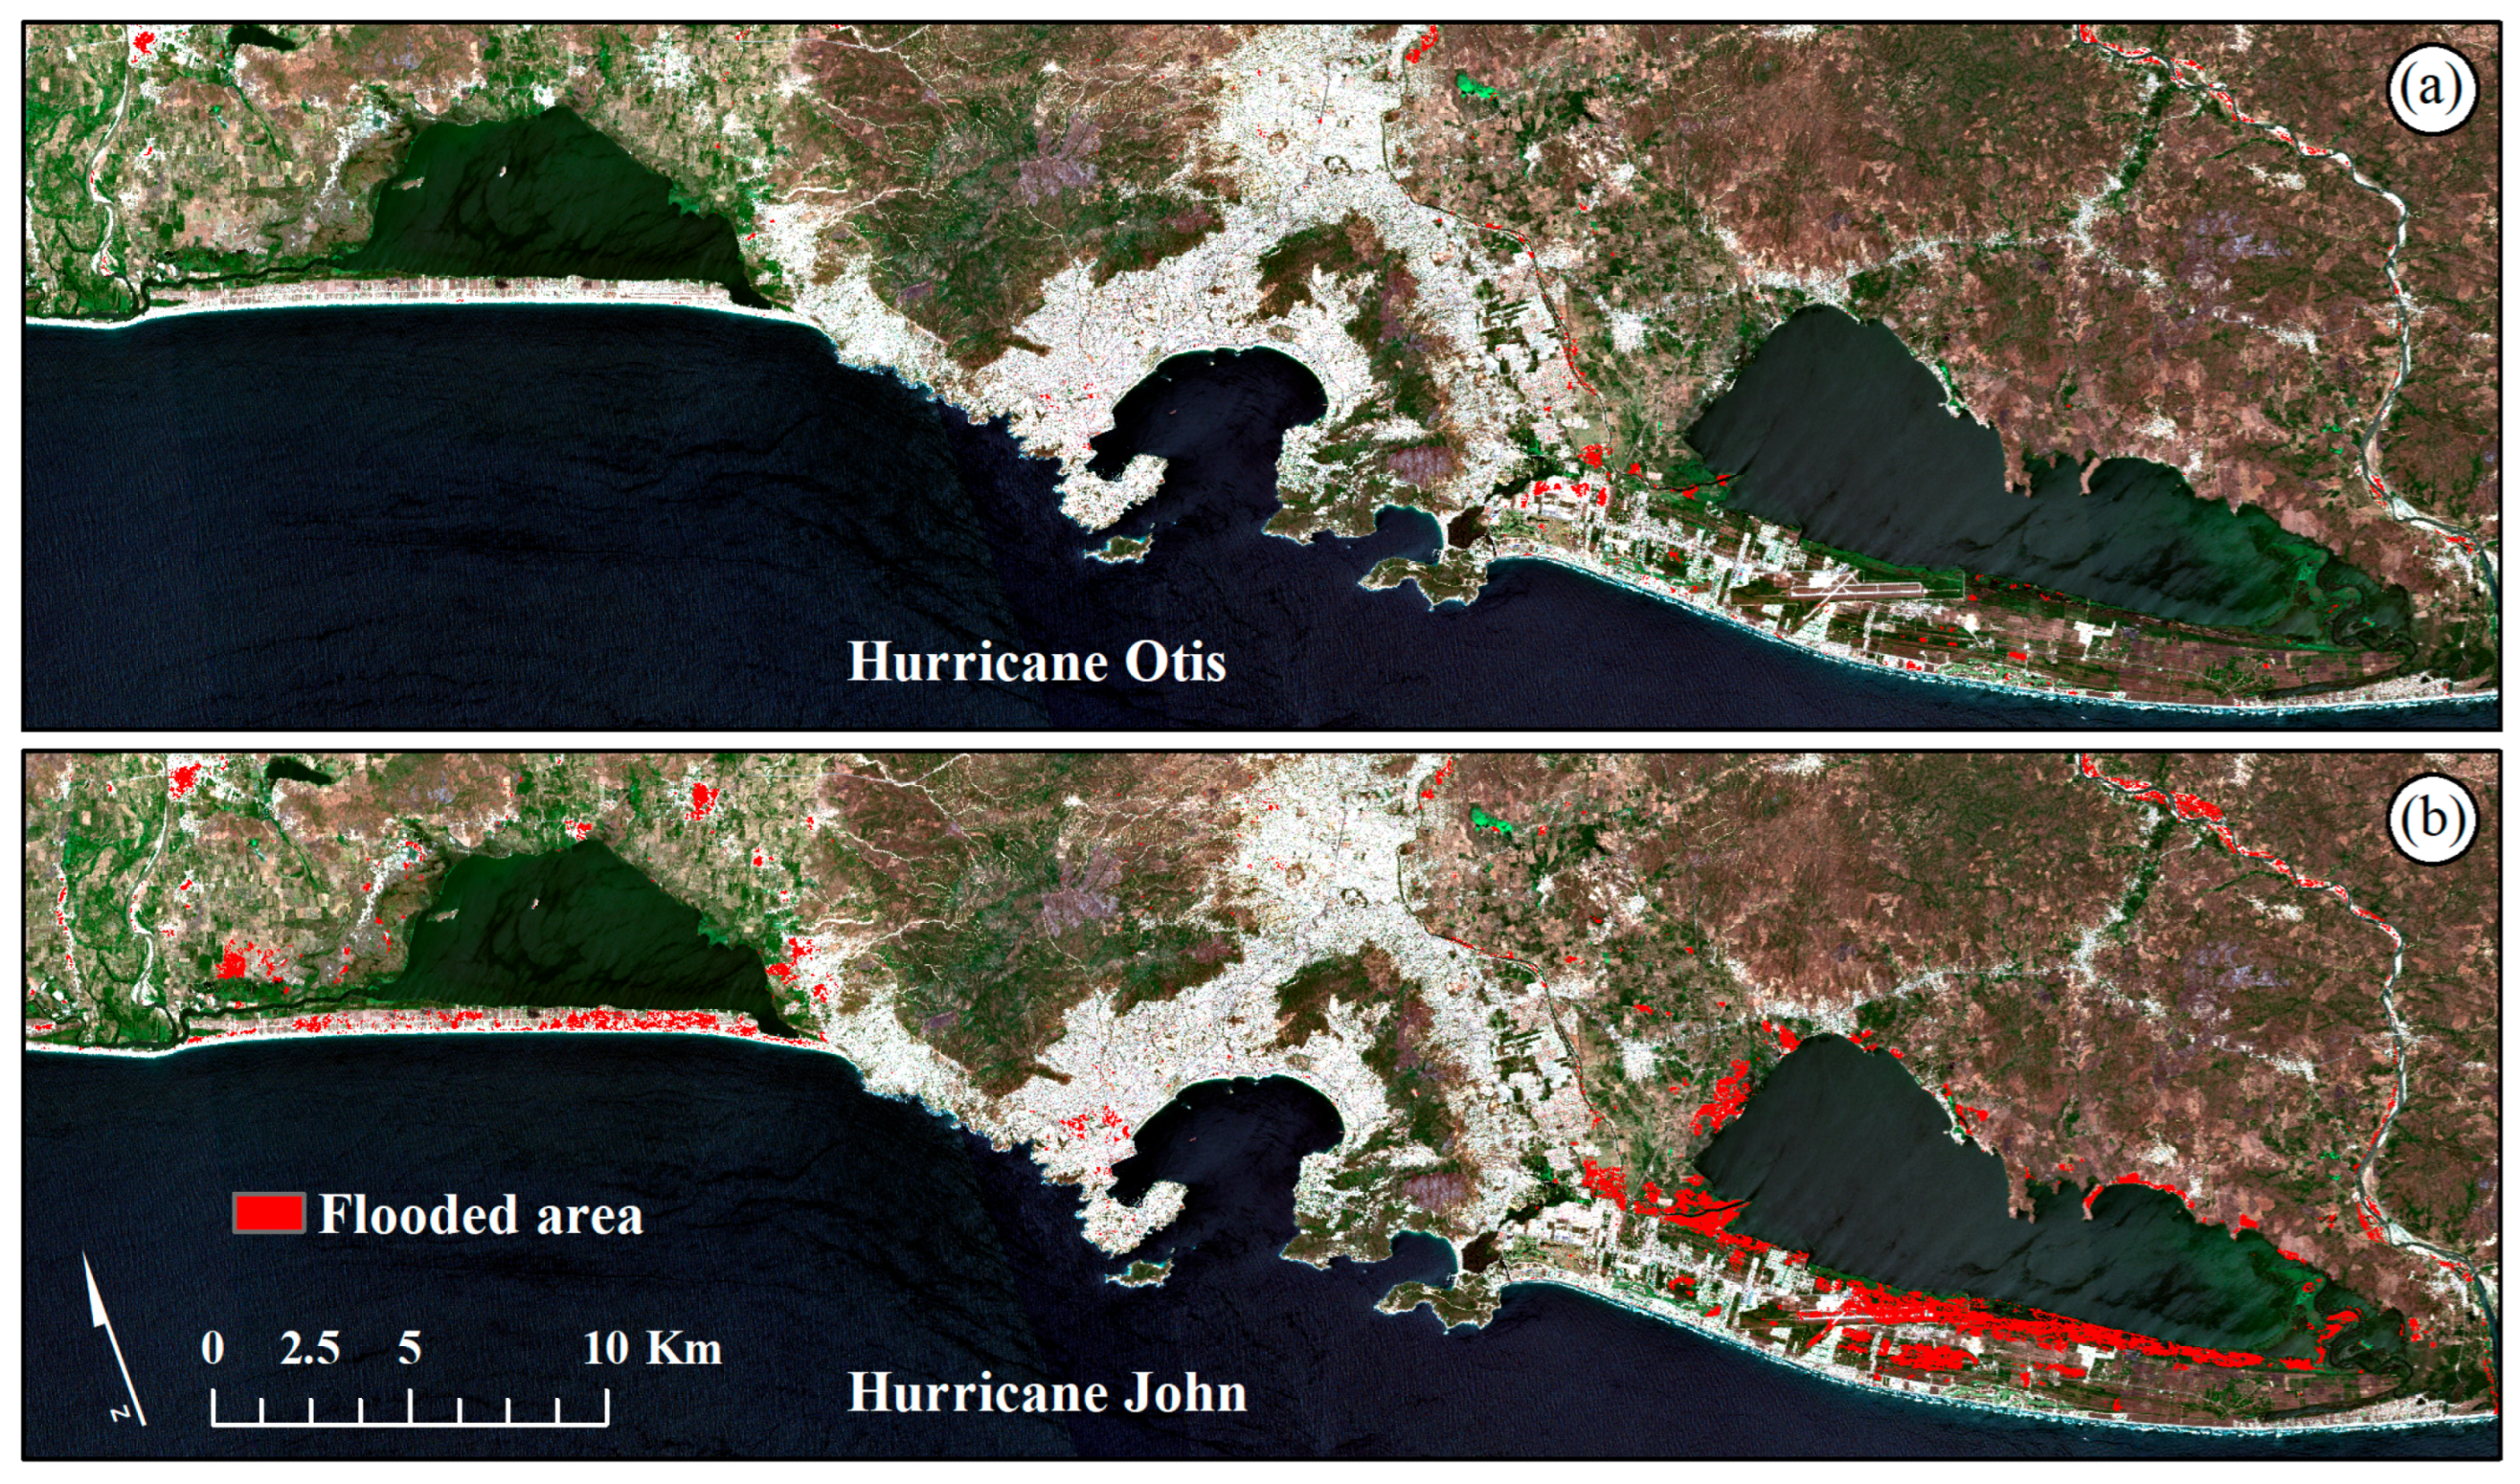
Based on the Sentinel-1 SAR data (Figure 7), a 567 ha area experienced flooding following Hurricane Otis, primarily in the Zona Diamante and around the Coyuca and Tres Palos coastal lagoons. Although Hurricane John did not make direct landfall on Acapulco, it resulted in a much larger flooded area of 2386 ha, particularly in the Coyuca Bar and along the beaches of Zona Diamante and the Tres Palos Lagoon.

4. Discussion

Satellite remote sensing data serves as the primary—and often only—source of information immediately before and after hurricane impacts, as on-site field surveys become impractical. In pre-landfall scenarios, federal authorities typically restrict travel to threatened areas for safety reasons. Similarly, post-hurricane, coastal access remains constrained. For example, after recent events, Acapulco became inaccessible by both land and air for weeks. Rivers flooding frequently damages bridges and access roads. Additionally, strong wind gusts often damage power towers, causing widespread blackouts and rendering the use of electronic equipment for field data collection unfeasible.
The ERA5 climate data has provided valuable insights into environmental conditions preceding recent hurricane impacts. These freely available data offer multiple variable selections across decades-long time intervals [49]. However, it is worth noting that the wind data did not yield the expected results for either hurricane. For instance, Hurricane Otis’s maximum average wind speeds were recorded at 14 m/s (50 km/h), far below the 265 km/h reported by the National Weather Service. Prior analyses have documented the underestimation of wind speeds from ERA5 in mountainous regions [50], such as the coast of Acapulco. This phenomenon may arise from the limitations of the ERA5 dataset in effectively capturing short-range variations. It is essential to recognize that these data are derived from weather models through reanalysis, which can introduce various biases and inaccuracies, particularly influenced by the surrounding terrain [51]. However, the maximum wave height coincided with the recorded wave heights, closely aligning with expectations for a Category 5 hurricane (i.e., 7 m [25]) moving in a northwesterly direction consistent with Hurricane Otis’s approach. Nevertheless, inconsistencies in wind data did not significantly influence our shoreline change analysis, as multispectral satellite imagery provides wind-independent measurements of shoreline position. Furthermore, the wind data came from a single observation point for the entire study area, rather than a network of coastal weather stations that could introduce spatial variability in wind signal representation along the coastline.
The tidal variations observed during satellite image acquisition were relatively small, ranging from 1.7 to 37 cm above the lower low sea level, with a mean difference of 18.7 ± 8.8 cm across all satellite images. We argue that focusing on the pre- and post-hurricane average shoreline position has reduced the uncertainty introduced by tidal fluctuations. However, this approach may be less effective in regions with larger tidal ranges, such as the northern Pacific coast of Mexico, where spring tide amplitudes can exceed 1.8 m [52].
The northwest coastal area exhibited minimal beach changes, likely attributed to the absence of permanent seafront infrastructure [40]. Globally, high shoreline retreat zones have been observed following tropical storms and hurricane impacts, worsened by the presence of coastal infrastructure such as seafront hotels [53]. Notably, concrete structures at the beach–dune interface resulted in perpendicular fragmentation of the shoreline, disrupting sand transport from dunes to beaches and consequently leading to substantial shoreline retreat [54]. The only existing infrastructure in the northwestern section was located along the Coyuca River Bar, consisting of wooden, non-permanent structures. Such non-permanent constructions are intentionally used in high-risk zones due to their replaceability after storm damage. A quick analysis of the historically available very-high spatial resolution images from Google Earth Pro indicates that these structures tend to vanish whenever a storm occurs, and the sandy bar at the river mouth shifts.
In Acapulco Bay, shoreline retreat occurred adjacent to protective structures such as breakwaters. This phenomenon is not unique to this location. For instance, it has been noted in other coastal regions where rigid structures contribute to shoreline retreat in areas affected by the littoral current patterns [55]. Conversely, localized accretion occurred near creeks [56], primarily due to watershed-derived sediment transport [57], resulting in considerable deposition of sand into the bay. This result is consistent with a recent study conducted in the Acapulco coastal region, which investigated the effects of rainfall on flow dynamics and flooding in the central and eastern zones of the bay [31]. The study utilized high-resolution terrain topography data acquired via UAV-LiDAR technology and performed a comprehensive hydrological network analysis. The findings revealed a correlation between sediment load capacity and rainfall-triggered landslides, while topographic features strongly controlled debris flows. Intense rainfall associated with hurricanes generated flash floods and mudslides, particularly on steep slopes. Additionally, large boulders, uprooted trees, and fine-grained sediments from mountainous areas were mobilized downstream and deposited in the coastal zone, where slope gradients decreased.
Although in situ analysis was not feasible, we validated our results through alternative methods, including very high-resolution Google Earth Pro images and citizen science, which involves the participation of local communities who contribute observations. For example, the available very high-resolution visual data confirmed that sediment input from the streams in the bay was substantial, with high turbidity observed at the mouths of the streams. Moreover, a recent study using digital terrain models confirmed the locations of sediment input and the drainage area within Acapulco Bay. Specifically, regions characterized by smooth topography, gentle slopes, and inadequate drainage systems are prone to extensive flooding. In contrast, areas with well-established drainage networks primarily experience water accumulation in low-lying zones. The flood model indicates that concealed drainage systems extend underground canals in coastal areas without visible streams, resulting in substantial street and road flooding [31]. Furthermore, our identified impacts were corroborated by local news reports and NGO damage assessments [35].
The most notable changes to the shoreline caused by Hurricane Otis are found in the southeast section. The analysis reveals a maximum shoreline retreat of 57 m, which is less than the previously recorded maximum retreat of 76 m for the same area [58]. The difference could likely be a consequence of the method and data employed, which were based on high-water-line digitalization from multi-source satellite data (Sentinel-2, GeoEye, WorldView-3, and Planet). Furthermore, the maximum shoreline retreat aligns with early journalistic reports documenting a beach retreat of up to 41 m immediately after the impact, suggesting persistent shoreline erosion along at least 2 km of the Zona Diamante [35]. However, our study also revealed that the length of the damaged shoreline was much greater, with at least 10 km of continuous shoreline retreat.
Overall, our analysis revealed a loss of 94 ha of beaches, compared to 11 ha of accretion, primarily near the mouth of the Papagayo River. During a hurricane impact, the littoral current can change direction due to the combined effects of hurricane winds, storm surge, and intense wave action [59]. The intensity and direction of these currents may shift before, during, and after the hurricane’s landfall, leading to substantial shoreline retreat and changes in sediment transport [7]. However, not all sections of the study area experienced shoreline retreat, and it is clear that concrete structures fragmenting the beach and dune played a key role in the overall shoreline retreat within this coastal area. Moreover, since the 1990s, this area has been subjected to aggressive urban development policies characterized by a lack of environmental considerations, as evidenced by the rapid growth of precarious low-income housing near the Tres Palos Lagoon and its surrounding wetlands [33]. In addition, the upscale tourism infrastructure along the Zona Diamante has led to emergent urban developments that mimic decades of environmental degradation, subordinated to economic interests with little to no regard for local ecology—a potentially perfect recipe for future disasters of the scale and magnitude caused by Otis [59].
Regrettably, the construction of buildings between the beach and the dune is widespread in tourist destinations in Mexico, leading to shoreline retreat problems due to strong waves. For example, in other major tourist destinations in Mexico, such as Mazatlán, shoreline retreats of up to 90 m have been documented, particularly during the summer when tropical storms and hurricanes elevate sea levels by as much as 40 cm and increase wave height by up to 5 m [40]. In Acapulco, approximately 80% of high-rise buildings along the coastline sustained hurricane-induced damage, with wind and wave forces compromising their structural integrity. The erosive action of waves removed substantial volumes of sand, triggering shoreline reconfiguration, beach narrowing, and vertical erosion of up to 2 m [58]. Additionally, the storm surge intensity caused overwash, displacing sediment beyond the berm and altering dune morphology, ultimately disrupting sediment distribution patterns [35].
In Acapulco and other Mexican tourist destinations, hotels are commonly constructed atop dunes—the highest point in the beach profile—to reduce flood risk [40]. However, this practice results in the permanent loss of dune sediment, which would otherwise help mitigate beach erosion, as it becomes trapped beneath concrete infrastructure [14]. The only area exhibiting shoreline accretion is adjacent to the Papagayo River. Studies have shown that rivers are a primary source of sediment for Pacific beaches [59]. However, high-energy events—including storms, strong currents, and wave action—could substantially modify the morphology of river mouths and tidal inlets, leading to their widening and reshaping in response to dynamic coastal processes [60]. For example, along other parts of the Mexican Pacific coast, researchers have documented consistent accretion of up to 400 m at the mouth of the San Pedro River over the past 45 years [39] and 49 m in 34 years at the mouth of the Presidio River [61].
Active SAR data serves as the primary source of spaceborne information during a hurricane impact, given the prevalence of clouds that obstruct the acquisition of multispectral images [62]. In regions such as the coastal area of Acapulco, persistent cloud cover, particularly following hurricane events, renders multispectral imagery unfeasible. However, it is essential to note that SAR data may be susceptible to errors in the presence of rainfall. Therefore, it is recommended to obtain images a few days after hurricane landfall [63]. Regarding the flooded area during Hurricane Otis, the rainfall was brief, lasting only one day after the storm’s impact. Thus, the Sentinel-1 image was unaffected by heavy rainfall. Local news did not report extensive flooding within the city of Acapulco and instead focused on the clear shoreline retreat caused by the strong winds and waves [35]. Notwithstanding this limitation, SAR imagery remains an invaluable tool for assessing flood extent, as water indices could not be derived from multispectral imagery during such events [64].
Notably, Hurricane John, a lower-category hurricane, resulted in 5-fold more extensive flooding than Hurricane Otis. This atypical impact can be attributed to the trajectory of Hurricane John, which progressed inland along a mountain range as a Category 1 storm for three consecutive days. This prolonged interaction led to substantial water accumulation that subsequently shifted toward the coastal region of Acapulco. A similar scenario occurred along the coast of Sinaloa, Mexico, when Category 1 Hurricane Pamela made landfall in October 2021, causing severe flooding throughout the port of Mazatlán that persisted for several weeks [25]. The flood-affected areas during Hurricane John align with local media reports, highlighting the critical role of SAR data in damage assessment and recovery efforts.
In the context of processing multispectral and SAR data, it is crucial to consider the constraints associated with satellite data. While PlanetScope imagery offers higher resolution (5 m/pixel) than widely used Sentinel-2 data (10 m/pixel), it remains less detailed than WorldView-2 data (1.8 m/pixel). For instance, a discrepancy of ±4.6 m has been documented when comparing PlanetScope to WorldView-2 along a shoreline in the Pacific Northwest [38]. Regarding SAR data, increased moisture content can weaken radar signals [48]. For instance, during intense rainfall events like Hurricane John, radar wave penetration through the atmosphere may be reduced, compromising data quality and detail [65]. Such conditions can also increase radar signal scattering, producing noisy images [66]. However, our filtering method demonstrated reliability, as the identified flooded areas aligned with ground reports, local drone footage, and the pronounced meander of the heavily flooded Papagayo River. For example, drone surveys confirmed severe flooding in urban settlements around Tres Palos Lagoon and Coyuca Bar, as did a Navy base airport, hindering relief efforts for days.
The shoreline analysis indicates that the impact of Hurricane Otis on the beach was most prominent in areas lacking coastal dunes. In this sense, the conservation of dunes should be a priority [67], as they naturally mitigate flooding and wave energy [68]. However, conservation policies in Mexico often neglect these dynamic coastal landforms. For instance, Acapulco’s development practices have consistently prioritized coastal urbanization over environmental protection in recent decades [33]. Finally, it is essential to implement comprehensive long-term programs to restore mangrove forests in coastal lagoons to mitigate the impacts of flooding [69]. For example, the largest flooded areas were detected around the coastal lagoon of Tres Palos, a site that historically supported a large extension of mangrove forest.

5. Conclusions

The area stretching from Zona Diamante to the Papagayo River mouth experienced the most severe impacts from the winds and waves of Hurricane Otis, resulting in substantial shoreline erosion of 94 ha. In contrast, the northwestern section and the Bay of Acapulco showed accretion patterns, primarily due to sediment deposition from streams flowing into the bay. SAR data is particularly valuable for identifying flooded areas during the days following a hurricane’s landfall, especially when access to affected areas is severely limited. Furthermore, SAR data is not influenced by cloud cover, which can hinder the effectiveness of water indices derived from multispectral imagery in evaluating water levels. Ongoing monitoring endeavors will be essential to determine the degree of beach recovery and to identify the areas of higher risk of flooding and sediment transport. The presence of beachfront buildings and the removal of dunes, as well as mangrove forest fragmentation, will lead to increased coastal damage. In such cases, the interaction between misdirected human actions and extreme natural events—whose frequency and intensity will likely increase due to global warming, as exemplified by hurricanes Otis and John—inevitably leads to disaster. For example, during the preparation of this article, Hurricane Erik—a Category 3 storm—impacted near Pinotepa Nacional, a community 200 km southeast of Acapulco.

Author Contributions

Conceptualization, L.V.-L. and F.F.-d.-S.; methodology, L.V.-L. and E.V.-C.; software, L.V.-L., E.V.-C. and I.P.-E.; validation, R.A.-M.; formal analysis, I.P.-E.; investigation, L.V.-L. and I.P.-E.; resources, L.V.-L.; data curation, I.P.-E. and R.A.-M.; writing—original draft preparation, L.V.-L.; writing—review and editing, R.A.-M. and F.F.-d.-S.; visualization, L.V.-L. and F.F.-d.-S.; supervision, L.V.-L.; project administration, L.V.-L. All authors have read and agreed to the published version of the manuscript.

Funding

This research received no external funding.

Institutional Review Board Statement

Not applicable.

Informed Consent Statement

Not applicable.

Data Availability Statement

These data are available at UNINMAR: https://uninmar.icmyl.unam.mx/ (accessed 29 May 2025).

Acknowledgments

The PlanetScope data (https://account.planet.com/) was obtained by an education and research program license granted to the last author.

Conflicts of Interest

The authors declare no conflicts of interest.

References

  1. Lugo, A.E. Visible and Invisible Effects of Hurricanes on Forest Ecosystems: An International Review. Austral Ecol. 2008, 33, 368–398. [Google Scholar] [CrossRef]
  2. Ameca, E.I.; Nie, Y.; Wu, R.; Mittermeier, R.A.; Foden, W.; Wei, F. Identifying Protected Areas in Biodiversity Hotspots at Risk from Climate and Human-Induced Compound Events for Conserving Threatened Species. Sci. Total Environ. 2024, 938, 173192. [Google Scholar] [CrossRef] [PubMed]
  3. Jáuregui, E. Climatology of Landfalling Hurricanes and Tropical Storms in Mexico. Atmosfera 2003, 16, 193–204. [Google Scholar]
  4. Chen, Q.; Wang, L.; Tawes, R. Hydrodynamic Response of Northeastern Gulf of Mexico to Hurricanes. Estuaries Coasts 2008, 31, 1098–1116. [Google Scholar] [CrossRef]
  5. Hook, D.D.; Buford, M.A.; Williams, T.M. Impact of Hurricane Hugo on the South Carolina Coastal Plain Forest. J. Coast. Res. Spec. Issue 1992, 8, 291–300. [Google Scholar]
  6. Stanturf, J.A.; Goodrick, S.L.; Outcalt, K.W. Disturbance and Coastal Forests: A Strategic Approach to Forest Management in Hurricane Impact Zones. Ecol. Manag. 2007, 250, 119–135. [Google Scholar] [CrossRef]
  7. Wang, X.; Wang, W.; Tong, C. A Review on Impact of Typhoons and Hurricanes on Coastal Wetland Ecosystems. Shengtai Xuebao 2016, 36, 23–29. [Google Scholar] [CrossRef]
  8. Huang, A.; Medeiros, M. How Do Hurricanes Impact the Tourism Economy? Anatolia 2021, 32, 513–516. [Google Scholar] [CrossRef]
  9. Hernández, M.L.; Carreño, M.L.; Castillo, L. Methodologies and Tools of Risk Management: Hurricane Risk Index (HRi). Int. J. Disaster Risk Reduct. 2018, 31, 926–937. [Google Scholar] [CrossRef]
  10. Klemas, V. Beach Profiling and LIDAR Bathymetry: An Overview with Case Studies. J. Coast. Res. 2011, 27, 1019–1028. [Google Scholar] [CrossRef]
  11. Flores-de-Santiago, F.; Valderrama-Landeros, L.; Villaseñor-Aguirre, J.; Álvarez-Sánchez, L.F.; Rodríguez-Sobreyra, R.; Flores-Verdugo, F. Detection of Beach–Dune Geomorphic Changes by Means of Satellite and Unmanned Aerial Vehicle Data: The Case of Altamura Island in the Gulf of California. Coasts 2023, 3, 383–400. [Google Scholar] [CrossRef]
  12. Besset, M.; Anthony, E.J.; Bouchette, F. Multi-Decadal Variations in Delta Shorelines and Their Relationship to River Sediment Supply: An Assessment and Review. Earth Sci. Rev. 2019, 193, 199–219. [Google Scholar] [CrossRef]
  13. Rodrigues Nunes, J.C.; Puhl, E.; Aliotta, S.; Toldo, E.E.; Machado Schffer, P.N.; Fick, C.; Lima-Filho, F.P.; Andrade dos Reis Junior, J.; Silveira dos Santos, G.; Barros, C.A.; et al. Beach Ridge Sequence Evolution of Punta Verde, Northern Coast of the San Matías Gulf, Argentina. J. S. Am. Earth Sci. 2024, 133, 104704. [Google Scholar] [CrossRef]
  14. Toimil, A.; Camus, P.; Losada, I.J.; Le Cozannet, G.; Nicholls, R.J.; Idier, D.; Maspataud, A. Climate Change-Driven Coastal Erosion Modelling in Temperate Sandy Beaches: Methods and Uncertainty Treatment. Earth Sci. Rev. 2020, 202, 103110. [Google Scholar] [CrossRef]
  15. Brand, E.; Chen, M.; Montreuil, A.L. Optimizing Measurements of Sediment Transport in the Intertidal Zone. Earth Sci. Rev. 2020, 200, 103029. [Google Scholar] [CrossRef]
  16. Okyay, U.; Telling, J.; Glennie, C.L.; Dietrich, W.E. Airborne Lidar Change Detection: An Overview of Earth Sciences Applications. Earth Sci. Rev. 2019, 198, 102929. [Google Scholar] [CrossRef]
  17. Greer, J.M. A Sampling of Environmental Data, and Its Presentation, from a Multi-Role U.S. Coast Guard Aircraft. Corros. Rev. 2023, 41, 103–113. [Google Scholar] [CrossRef]
  18. Villalobos Perna, P.; Di Febbraro, M.; Carranza, M.L.; Marzialetti, F.; Innangi, M. Remote Sensing and Invasive Plants in Coastal Ecosystems: What We Know So Far and Future Prospects. Land 2023, 12, 341. [Google Scholar] [CrossRef]
  19. Dronova, I.; Kislik, C.; Dinh, Z.; Kelly, M. A Review of Unoccupied Aerial Vehicle Use in Wetland Applications: Emerging Opportunities in Approach, Technology, and Data. Drones 2021, 5, 45. [Google Scholar] [CrossRef]
  20. Adade, R.; Aibinu, A.M.; Ekumah, B.; Asaana, J. Unmanned Aerial Vehicle (UAV) Applications in Coastal Zone Management—A Review. Environ. Monit. Assess. 2021, 193, 154. [Google Scholar] [CrossRef] [PubMed]
  21. Alvarez-Vanhard, E.; Houet, T.; Mony, C.; Lecoq, L.; Corpetti, T. Can UAVs Fill the Gap Between in Situ Surveys and Satellites for Habitat Mapping? Remote Sens. Environ. 2020, 243, 111780. [Google Scholar] [CrossRef]
  22. Kumar, P.; Debele, S.E.; Sahani, J.; Rawat, N.; Marti-Cardona, B.; Alfieri, S.M.; Basu, B.; Basu, A.S.; Bowyer, P.; Charizopoulos, N.; et al. An Overview of Monitoring Methods for Assessing the Performance of Nature-Based Solutions against Natural Hazards. Earth Sci. Rev. 2021, 217, 103603. [Google Scholar] [CrossRef]
  23. Mondal, M.; Mukherjee, A.; Kumar, P.; Ismaeel, N.M.; Das, K. A Process-Based Impact of Tropical Cyclone and Hurricane on Surface Water-Groundwater Interaction and Contaminant Mobilization of Coastal Aquifers. Prog. Disaster Sci. 2024, 22, 100318. [Google Scholar] [CrossRef]
  24. Yim, W.W.-S. Hurricanes and Typhoons: Past, Present, and Future. Eos. Trans. Am. Geophys. Union 2005, 86, 166. [Google Scholar] [CrossRef]
  25. Vizcaya-Martínez, D.A.; Flores-de-Santiago, F.; Valderrama-Landeros, L.; Serrano, D.; Rodríguez-Sobreyra, R.; Álvarez-Sánchez, L.F.; Flores-Verdugo, F. Monitoring Detailed Mangrove Hurricane Damage and Early Recovery Using Multisource Remote Sensing Data. J. Environ. Manag. 2022, 320, 115830. [Google Scholar] [CrossRef] [PubMed]
  26. McCarthy, M.J.; Jessen, B.; Barry, M.J.; Figueroa, M.; McIntosh, J.; Murray, T.; Schmid, J.; Muller-Karger, F.E. Mapping Hurricane Damage: A Comparative Analysis of Satellite Monitoring Methods. Int. J. Appl. Earth Obs. Geoinf. 2020, 91, 102134. [Google Scholar] [CrossRef]
  27. Sunkur, R.; Kantamaneni, K.; Bokhoree, C.; Rathnayake, U.; Fernando, M. Mangrove Mapping and Monitoring Using Remote Sensing Techniques towards Climate Change Resilience. Sci. Rep. 2024, 14, 6949. [Google Scholar] [CrossRef]
  28. Mouche, A.; Chapron, B.; Knaff, J.; Zhao, Y.; Zhang, B.; Combot, C. Copolarized and Cross-Polarized SAR Measurements for High-Resolution Description of Major Hurricane Wind Structures: Application to Irma Category 5 Hurricane. J. Geophys. Res. Ocean. 2019, 124, 3905–3922. [Google Scholar] [CrossRef]
  29. Kovacs, J.M.; De Santiago, F.F.; Bastien, J.; Lafrance, P. An Assessment of Mangroves in Guinea, West Africa, Using a Field and Remote Sensing Based Approach. Wetlands 2010, 30, 773–782. [Google Scholar] [CrossRef]
  30. Miranda-Esteban, A.; Bedolla-Solano, R.; Bedolla-Solano, I. The Impact of Hurricane Otis on the Student Community of the School of Sociology, Mexico. Int. Soc. Study Vernac. Settl. 2023, 10, 729–751. [Google Scholar] [CrossRef]
  31. Urrutia-Fucugauchi, J.; Fernández-Martínez, I.; Lara-Omaña, A.; Rosales-Armendariz, C.; Cavazos, T.; Pérez-Cruz, L.; Zapotitla-Roman, J. LiDAR and Photogrammetric Study of the Acapulco Bay after the October 2023 Otis Hurricane in Southern Mexico. Nat. Hazards. 2025, 121, 1–18. [Google Scholar] [CrossRef]
  32. Carvache-Franco, M.; Carvache-Franco, W.; Carvache-Franco, O.; Solis-Radilla, M.M.; Morrison, M.; Pulido-Fernández, J.I. Tourism Market Segmentation Applied to Coastal and Marine Destinations: A Study from Acapulco, Mexico. Sustainability 2021, 13, 13903. [Google Scholar] [CrossRef]
  33. Rodriguez, A. Las Inundaciones En Llano Largo, Acapulco: Riesgo, Turismo y Desarrollo. In Las inundaciones en Llano Largo, Acapulco: Riesgo, Turismo y Desarrollo; Plaza y Valdés, SA de CV: Ciudad de México, Mexico, 2011. [Google Scholar]
  34. Roy, P.D.; Natarajan, L.; Chokkalingam, L. Changes in Lu/Lc and Vegetation around the Acapulco Bay at Southwest Mexico from the Hurricane Otis (October 25, 2023). J. S. Am. Earth Sci. 2024, 136, 104819. [Google Scholar] [CrossRef]
  35. Niño-Gutiérrez, N.S. Resilience in Adversity: Acapulco and the Aftermath of Otis Hurricane Category 5 of October 25, 2023. South Asian J. Soc. Stud. Econ. 2023, 20, 209–224. [Google Scholar] [CrossRef]
  36. Gao, B.C. NDWI—A Normalized Difference Water Index for Remote Sensing of Vegetation Liquid Water from Space. Remote Sens. Environ. 1996, 58, 257–266. [Google Scholar] [CrossRef]
  37. Roy, D.P.; Huang, H.; Houborg, R.; Martins, V.S. A Global Analysis of the Temporal Availability of PlanetScope High Spatial Resolution Multi-Spectral Imagery. Remote Sens. Environ. 2021, 264, 112586. [Google Scholar] [CrossRef]
  38. Valderrama-Landeros, L.; Flores-de-Santiago, F.; Álvarez-Sánchez, L.F.; Flores-Verdugo, F.; Rodríguez-Sobreyra, R. The Influence of Spatial Resolution on Coastline Detection by Means of Multisource Remote Sensing Data. Remote Sens. Appl. 2024, 35, 101258. [Google Scholar] [CrossRef]
  39. Valderrama-Landeros, L.; Flores-de-Santiago, F. Assessing Coastal Erosion and Accretion Trends along Two Contrasting Subtropical Rivers Based on Remote Sensing Data. Ocean. Coast. Manag. 2019, 169, 58–67. [Google Scholar] [CrossRef]
  40. Valderrama-Landeros, L.; Flores-Verdugo, F.; Flores-de-Santiago, F. Assessing the Coastal Vulnerability by Combining Field Surveys and the Analytical Potential of CoastSat in a Highly Impacted Tourist Destination. Geographies 2022, 2, 642–656. [Google Scholar] [CrossRef]
  41. Huang, K.; Yang, G.; Yuan, Y.; Sun, W.; Meng, X.; Ge, Y. Optical and SAR Images Combined Mangrove Index Based on Multi-Feature Fusion. Sci. Remote Sens. 2022, 5, 100040. [Google Scholar] [CrossRef]
  42. Crippen, R.; Buckley, S.; Agram, P.; Belz, E.; Gurrola, E.; Hensley, S.; Kobrick, M.; Lavalle, M.; Martin, J.; Neumann, M.; et al. Nasadem global elevation model: Methods and progress. Int. Arch. Photogramm. Remote Sens. Spat. Inf. Sci. 2016, 41, 125–128. [Google Scholar] [CrossRef]
  43. Brown, C.F.; Brumby, S.P.; Guzder-Williams, B.; Birch, T.; Hyde, S.B.; Mazzariello, J.; Czerwinski, W.; Pasquarella, V.J.; Haertel, R.; Ilyushchenko, S.; et al. Dynamic World, Near Real-Time Global 10 m Land Use Land Cover Mapping. Sci. Data 2022, 9, 251. [Google Scholar] [CrossRef]
  44. Ahmad, S.K.; Hossain, F.; Eldardiry, H.; Pavelsky, T.M. A Fusion Approach for Water Area Classification Using Visible, near Infrared and Synthetic Aperture Radar for South Asian Conditions. IEEE Trans. Geosci. Remote Sens. 2020, 58, 2471–2480. [Google Scholar] [CrossRef]
  45. Kovacs, J.M.; Lu, X.X.; Flores-Verdugo, F.; Zhang, C.; Flores de Santiago, F.; Jiao, X. Applications of ALOS PALSAR for Monitoring Biophysical Parameters of a Degraded Black Mangrove (Avicennia Germinans) Forest. ISPRS J. Photogramm. Remote Sens. 2013, 82, 102–111. [Google Scholar] [CrossRef]
  46. Flores-de-Santiago, F.; Kovacs, J.M.; Lafrance, P. An Object-Oriented Classification Method for Mapping Mangroves in Guinea, West Africa, Using Multipolarized ALOS PALSAR L-Band Data. Int. J. Remote Sens. 2013, 34, 563–586. [Google Scholar] [CrossRef]
  47. Montgomery, J.S.; Hopkinson, C.; Brisco, B.; Patterson, S.; Rood, S.B. Wetland Hydroperiod Classification in the Western Prairies Using Multitemporal Synthetic Aperture Radar. Hydrol. Process. 2018, 32, 1476–1490. [Google Scholar] [CrossRef]
  48. Mullissa, A.; Vollrath, A.; Odongo-Braun, C.; Slagter, B.; Balling, J.; Gou, Y.; Gorelick, N.; Reiche, J. Sentinel-1 Sar Backscatter Analysis Ready Data Preparation in Google Earth Engine. Remote Sens. 2021, 13, 1954. [Google Scholar] [CrossRef]
  49. Hersbach, H. The ERA5 Atmospheric Reanalysis. In Proceedings of the AGU fall meeting abstracts, San Francisco, CA, USA, 12–16 December 2016; Volume 2016. [Google Scholar]
  50. Potisomporn, P.; Adcock, T.A.A.; Vogel, C.R. Evaluating ERA5 Reanalysis Predictions of Low Wind Speed Events around the UK. Energy Rep. 2023, 10, 4781–4790. [Google Scholar] [CrossRef]
  51. Davidson, M.R.; Millstein, D. Limitations of Reanalysis Data for Wind Power Applications. Wind Energy 2022, 25, 1646–1653. [Google Scholar] [CrossRef]
  52. Valderrama-Landeros, L.; Blanco y Correa, M.; Flores-Verdugo, F.; Álvarez-Sánchez, L.F.; Flores-de-Santiago, F. Spatiotemporal Shoreline Dynamics of Marismas Nacionales, Pacific Coast of Mexico, Based on a Remote Sensing and GIS Mapping Approach. Env. Monit. Assess. 2020, 192, 123. [Google Scholar] [CrossRef] [PubMed]
  53. Ramesh, M.; Swathy Krishna, P.S.; Amrutha Raj, V.; Sheela Nair, L. Coupled Coastal Monitoring Framework for the Analysis of Beach Stability and Nearshore Hydrodynamics of a Structure Influenced Medium Energy Coast in India. Ocean. Coast. Manag. 2023, 239, 106619. [Google Scholar] [CrossRef]
  54. Billet, C.; Alonso, G.; Danieli, G.; Dragani, W. Evaluation of Beach Nourishment in Mar Del Plata, Argentina: An Application of the CoastSat Toolkit. Coast. Eng. 2024, 193, 104593. [Google Scholar] [CrossRef]
  55. Komar, P.D. Coastal Erosion Processes and Impacts: The Consequences of Earth’s Changing Climate and Human Modifications of the Environment. In Treatise on Estuarine and Coastal Science; Academic Press: San Diego, CA, USA, 2012; Volume 3. [Google Scholar]
  56. Ngowo, R.G.; Ribeiro, M.C.; Pereira, M.J. Quantifying 28-Year (1991–2019) Shoreline Change Trends along the Mnazi Bay—Ruvuma Estuary Marine Park, Tanzania. Remote Sens. Appl. 2021, 23, 100607. [Google Scholar] [CrossRef]
  57. Ramírez-Herrera, M.T.; Coca, O.; Gaidzik, K.; Vargas Espinosa, V.H. Hurricane Otis: Category 5 Storm Effects and Cascading Hazards in Acapulco Bay, Mexico. Glob. Earth Surf. Process. Change 2025, 3, 100004. [Google Scholar] [CrossRef]
  58. Blanco Betancourt, R.; Gómez Reyes, E.; Mascarenhas, A.D.S. Subtidal Water Exchange between Caimanero Lagoon and the Adjacent Inner Shelf, West Coast of México: Seasonal Circulation Pattern and Its Implication. J. Coast. Res. 2008, 24, 83–94. [Google Scholar] [CrossRef]
  59. Thinh, N.A.; Thanh, N.N.; Tuyen, L.T.; Hens, L. Tourism and Beach Erosion: Valuing the Damage of Beach Erosion for Tourism in the Hoi An World Heritage Site, Vietnam. Environ. Dev. Sustain. 2019, 21, 2113–2124. [Google Scholar] [CrossRef]
  60. Hernández-Guzmán, R.; Ruiz-Luna, A.; Cervantes-Escobar, A. Environmental Flow Assessment for Rivers Feeding a Coastal Wetland Complex in the Pacific Coast of Northwest Mexico. Water Environ. J. 2019, 33, 536–546. [Google Scholar] [CrossRef]
  61. Flores-de-Santiago, F.; Rodríguez-Sobreyra, R.; Álvarez-Sánchez, L.F.; Valderrama-Landeros, L.; Amezcua, F.; Flores-Verdugo, F. Understanding the Natural Expansion of White Mangrove (Laguncularia Racemosa) in an Ephemeral Inlet Based on Geomorphological Analysis and Remote Sensing Data. J. Environ. Manag. 2023, 338, 117820. [Google Scholar] [CrossRef]
  62. Zhang, C.; Xiao, X.; Zhao, L.; Qin, Y.; Doughty, R.; Wang, X.; Dong, J.; Yang, X. Mapping Eucalyptus Plantation in Guangxi, China by Using Knowledge-Based Algorithms and PALSAR-2, Sentinel-2, and Landsat Images in 2020. Int. J. Appl. Earth Obs. Geoinf. 2023, 120, 103348. [Google Scholar] [CrossRef]
  63. Colin, A.; Tandeo, P.; Peureux, C.; Husson, R.; Longepe, N.; Fablet, R. Rain Regime Segmentation of Sentinel-1 Observation Learning from NEXRAD Collocations with Convolution Neural Networks. IEEE Trans. Geosci. Remote Sens. 2024, 62, 4202914. [Google Scholar] [CrossRef]
  64. Adeli, S.; Salehi, B.; Mahdianpari, M.; Quackenbush, L.J.; Brisco, B.; Tamiminia, H.; Shaw, S. Wetland Monitoring Using SAR Data: A Meta-Analysis and Comprehensive Review. Remote Sens. 2020, 12, 2190. [Google Scholar] [CrossRef]
  65. Zhao, Y.; Longépé, N.; Mouche, A.; Husson, R. Automated Rain Detection by Dual-Polarization Sentinel-1 Data. Remote Sens. 2021, 13, 3155. [Google Scholar] [CrossRef]
  66. Zhao, X.; Shao, W.; Lai, Z.; Jiang, X. Retrieval of Rain Rates for Tropical Cyclones from Sentinel-1 Synthetic Aperture Radar Images. IEEE J. Sel. Top. Appl. Earth Obs. Remote Sens. 2023, 16, 3187–3197. [Google Scholar] [CrossRef]
  67. Knight, J. The Green Infrastructure of Sandy Coastlines: A Nature-Based Solution for Mitigation of Climate Change Risks. Sustainability 2024, 16, 1056. [Google Scholar] [CrossRef]
  68. Hofstede, J.L.A. Status and Prospects of Nature-Based Solutions for Coastal Flood and Erosion Risk Management in the Federal State of Schleswig–Holstein, Germany. J. Coast. Conserv. 2024, 28, 40. [Google Scholar] [CrossRef]
  69. Soanes, L.M.; Pike, S.; Barker, D.; Butt, C.; John, L.; Medcalf, K.; Naumann, E.; Rouse, C.; Samuel, C.A.; Mukhida, F. Opportunity Mapping for Nature-Based Solutions: Mitigating Storm Surge and Land Erosion in the Caribbean. Nat.-Based Solut. 2023, 4, 100095. [Google Scholar] [CrossRef]
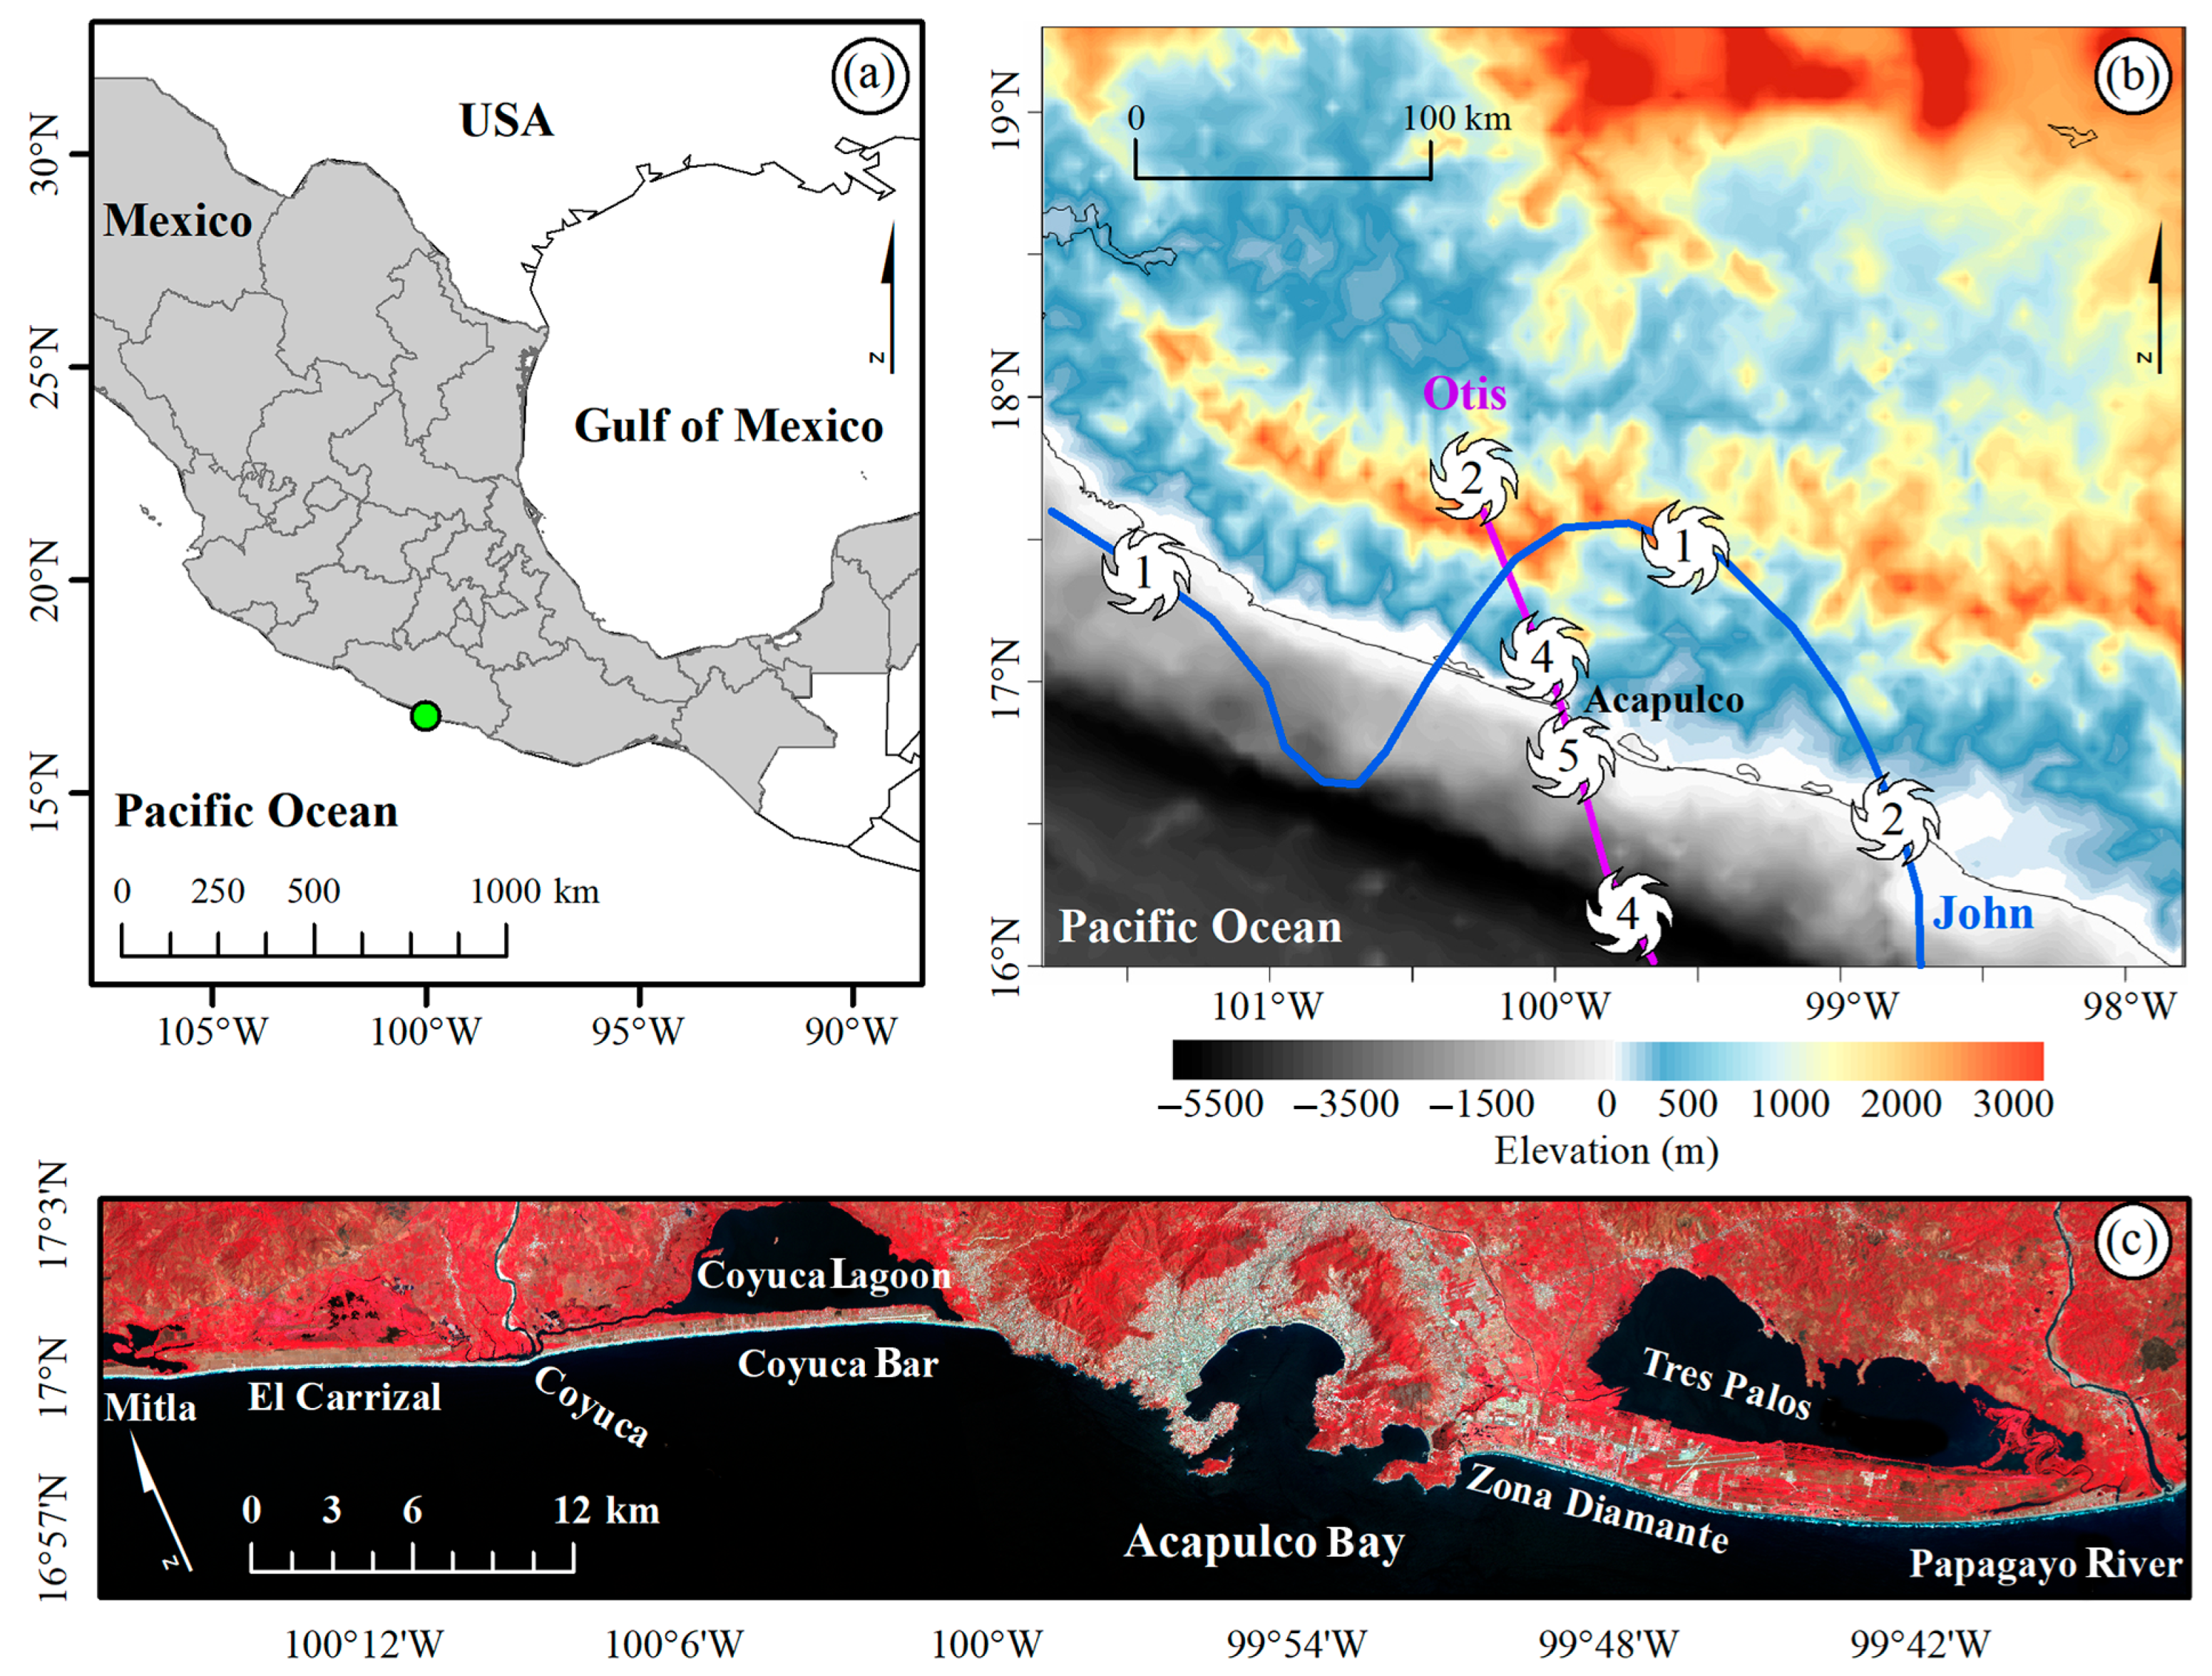
Figure 1. (a) Location of the coastal city of Acapulco (green circle) on the southeastern coast of Mexico. The grey area represents the Mexican states. (b) The digital elevation model (m) of Guerrero state, derived from freely available TOPEX data (https://topex.ucsd.edu/index.html, accessed 1 July 2025). The magenta vector shows the center of Hurricane Otis’s path on 24–25 October 2023, and the blue vector indicates Hurricane John’s path during 23–27 September 2024, with the corresponding Saffir–Simpson Hurricane Scale. (c) The analyzed shoreline area surrounding Acapulco Bay, between Mitla Beach and the mouth of the Papagayo River, as captured by PlanetScope (enhanced near-infrared, red, and green imagery, dated 5 March 2024).
Coasts 05 00028 g001
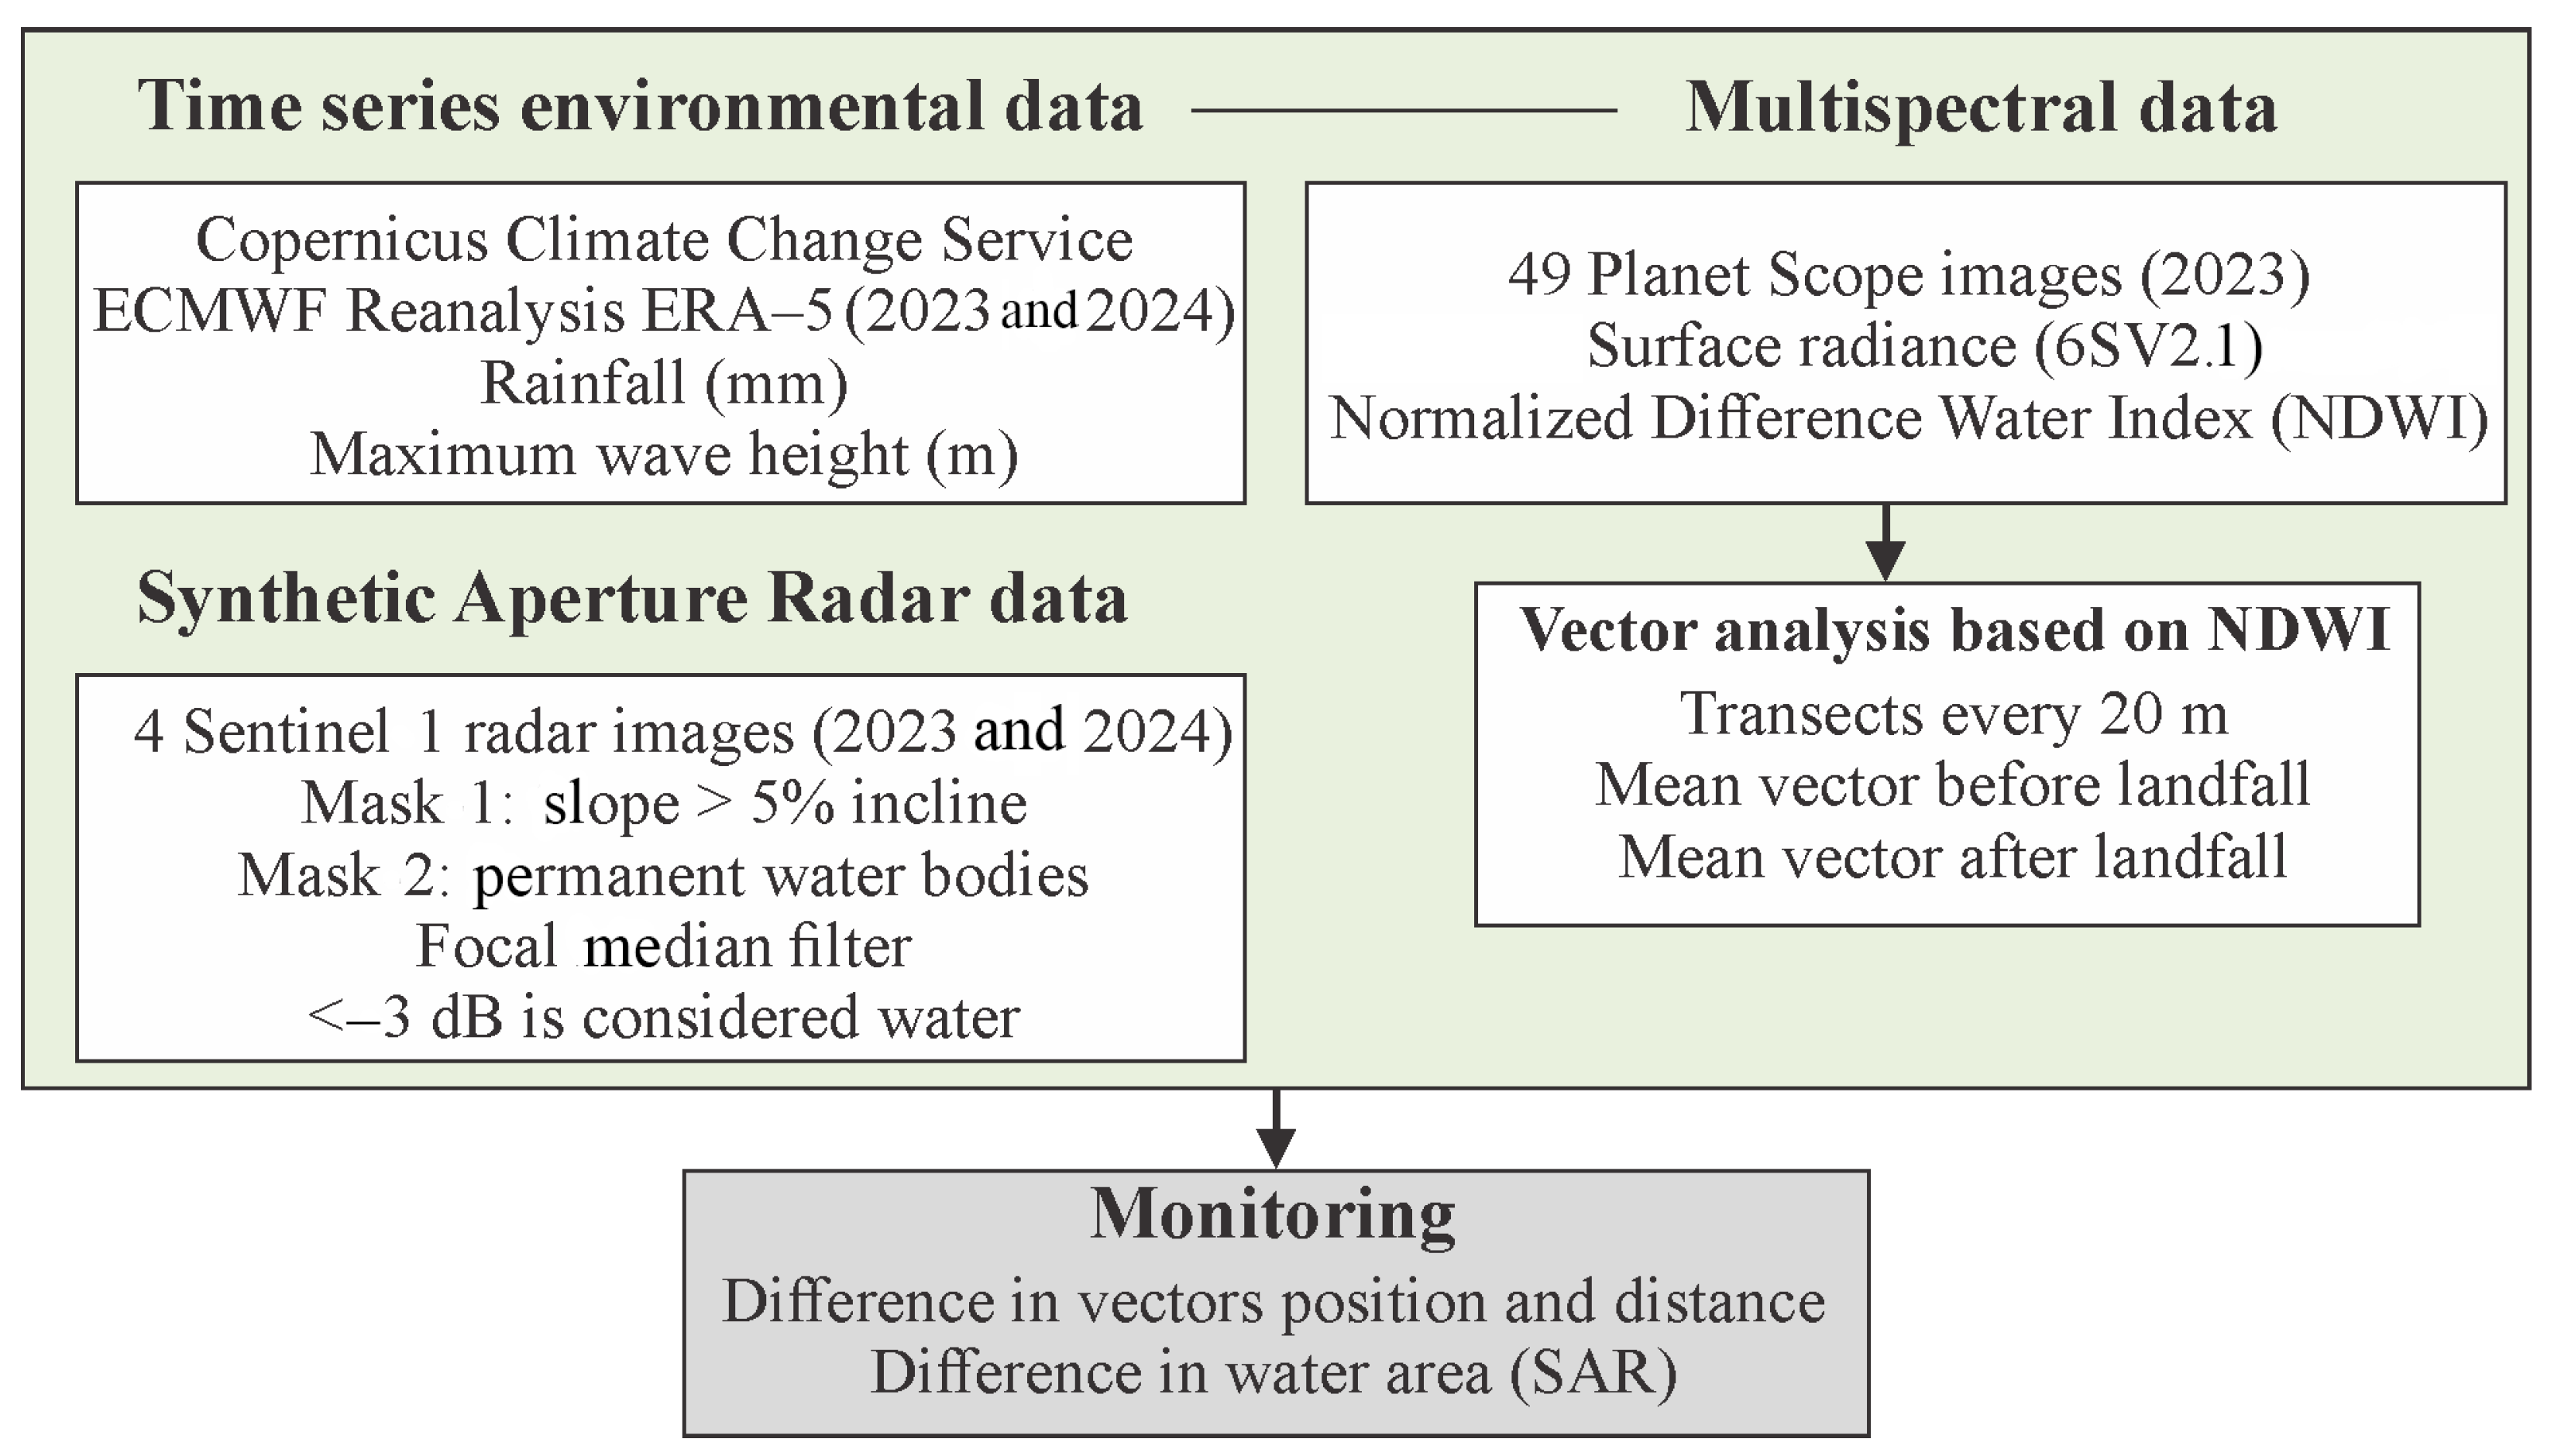
Figure 2. Flowchart of the remote sensing assessment in Acapulco, Mexico.
Coasts 05 00028 g002
Figure 3. Hurricane Otis’s time series of the wind speed (m/s) and rainfall (mm) (a), and wave height (m) and direction (b) every hour from September to October 2023. Hurricane John’s time series of the wind speed (m/s) and rainfall (mm) (c), and wave height (m) and direction (d) every hour from 1 to 28 September 2024 (c). The green and blue arrows indicate the dates of the Hurricane Otis and Hurricane John impacts, respectively.
Coasts 05 00028 g003
Figure 4. Shoreline changes attributed to Hurricane Otis’s impact in the northwest section of the study area. Representative locations: Mitla (a), Coyuca River Bar (b), Coyuca Bar (c), and Pie de la Cuesta (d). The green vector indicates accretion, while the red vector shows shoreline retreat. The green line indicates the average shoreline of the PlanetScope images before the impact of Otis, while the red line represents the average shoreline after.
Coasts 05 00028 g004
Figure 5. Shoreline changes attributed to Hurricane Otis’s impact on the Acapulco Bay area. Representative locations: Canal de Aguas Blancas (a), Acapulco Dorado (b), La Condesa (c), and Costa Azul (d). The green vector indicates accretion, while the red vector shows shoreline retreat. The green line indicates the average shoreline of the PlanetScope images before the impact of Otis, while the red line represents the average shoreline after.
Coasts 05 00028 g005
Figure 6. Shoreline changes attributed to Hurricane Otis’s impact at the southeast section of the study area. Representative locations: Revolcadero (a), Alfredo Bonfil (b), Barra Vieja (c), and Papagayo River Bar (d). The green vector indicates accretion, while the red vector shows shoreline retreat. The green line indicates the average shoreline of the PlanetScope images before the impact of Otis, while the red line represents the average shoreline after.
Coasts 05 00028 g006
Figure 7. Flooded areas following the impact of hurricanes Otis (a) and John (b) based on Sentinel-1 SAR data.
Coasts 05 00028 g007
Disclaimer/Publisher’s Note: The statements, opinions and data contained in all publications are solely those of the individual author(s) and contributor(s) and not of MDPI and/or the editor(s). MDPI and/or the editor(s) disclaim responsibility for any injury to people or property resulting from any ideas, methods, instructions or products referred to in the content.