Article

Links Between the Coastal Climate, Landscape Hydrology, and Beach Dynamics near Cape Vidal, South Africa

1
Department of Geography, University of Zululand, KwaDlangezwa 3886, South Africa
2
Physics Department, University of Puerto Rico, Mayaguez, PR 00681, USA
Coasts 2025, 5(3), 25; https://doi.org/10.3390/coasts5030025
Submission received: 22 April 2025 / Revised: 3 July 2025 / Accepted: 7 July 2025 / Published: 18 July 2025

Abstract

Coastal climate processes that affect landscape hydrology and beach dynamics are studied using local and remote data sets near Cape Vidal (28.12° S, 32.55° E). The sporadic intra-seasonal pulsing of coastal runoff, vegetation, and winds is analyzed to understand sediment inputs and transport by near-shore wind-waves and currents. River-borne sediments, eroded coral substrates, and reworked beach sand are mobilized by frequent storms. Surf-zone currents ~0.4 m/s instill the northward transport of ~6 105 kg/yr/m. An analysis of the mean annual cycle over the period of 1997–2024 indicates a crest of rainfall over the Umfolozi catchment during summer (Oct–Mar), whereas coastal suspended sediment, based on satellite red-band reflectivity, rises in winter (Apr–Sep) due to a deeper mixed layer and larger northward wave heights. Sediment input to the beaches near Cape Vidal exhibit a 3–6-year cycle of southeasterly waves and rainy weather associated with cool La Nina tropical sea temperatures. Beachfront sand dunes are wind-swept and release sediment at ~103 m3/yr/m, which builds tall back-dunes and helps replenish the shoreline, especially during anticyclonic dry spells. A wind event in Nov 2018 is analyzed to quantify aeolian transport, and a flood in Jan–Feb 2025 is studied for river plumes that meet with stormy seas. Management efforts to limit development and recreational access have contributed to a sustainable coastal environment despite rising tides and inland temperatures.

1. Introduction

Coastlines are shaped by geological history, environmental conditions, and land use. In the absence of urban development, natural fluctuations of sea level, coastal hydrology, and wind–wave action lead to cycles of shoreline advance and retreat [1,2,3]. Refracted breakers mobilize seabed sediments on exposed coasts [4] that swash along the lower beach and join wind-blown sand from the upper beach [5,6]. These local processes tend to coincide over seasonal cycles but have alternating influence during storm events.
The coastal zone near Cape Vidal, 28.12° S, 32.55° E (Figure 1a), is characterized by dry upland savannah [7] a wide plain of wetlands, and tall vegetated sand dunes facing a narrow shelf. Terrestrial runoff is channeled into the Umfolozi Valley during the Dec–Mar wet season, generating sediment outflows of ~7 105 T/yr [8]. Coastal reworking by persistent wind and wave action leads to sediment contributions from tall dunes and weathered substrates. A succession of shallow log-spiral bays with headlands, coral reefs, and recessed beaches attracts recreational tourism [9]. Although the warm shelf-edge Agulhas Current and dry anticyclonic winds are southward, coastal sediments tend to move northward at ~800 m3/day/m due to refracted waves and tidal swash [10,11,12].
According to the results presented below, local rainfall >25 mm/day occurs ~5% of the time and stimulates runoff that discharges via the Umfolozi Valley (Figure 1a) and rivers further south. The silty freshwater plumes and subsequent near-shore sediment concentration can be tracked by satellite red-band reflectivity [13,14]. Validations performed elsewhere yield a 2:1 rating curve (~0.1 kg/m3 per 0.05 Sr−1) with 92% correlation in low-turbidity waters typical of subtropical coasts [15].
The beachfront near Cape Vidal has minimal urban development, so natural processes can be quantified to inform coastal environmental and tourism management strategies. Weather stations and moorings are limited, so a variety of satellite + model-interpolated datasets are employed to describe local conditions, supplemented by field measurements as part of a long-term coastal monitoring project. Our objective is to link local beach erosion and accretion to the regional landscape hydrology, wind–wave action, and large-scale climate.
Here it is hypothesized that global La Nina conditions will induce moist airflow, high runoff, and big waves that favor northward surf-zone sand transport near Cape Vidal. Conversely, global El Ninos will feature locally dry airflow, low runoff, and small waves that favor southward aeolian transport along the east-facing dunes. This multi-year global climate alternation [8] will induce a cyclical sand supply that may require adaptation.

2. Data and Methods

2.1. Data Sources and Attributes

Field surveys were conducted bi-annually in the period of 1998–2005. Hand-held wind measurements were conducted along transects inland from the beach to identify local gradients. Beach sand samples were collected at three points around the Mabibi headland (27.33° S, 32.75° E, cf. Figure 8f) and sieved for grain size distribution. Surf-zone currents were measured via drifting drogues tracked at one-minute intervals using theodolites. Beach profiles were surveyed during bi-annual surveys and via Google Earth digital technology. Biodiversity surveys were conducted in a range of habitats. The Umfolozi river-flow was obtained from the SA Hydrology Dept at upstream (28.36° S, 32.00° E) and downstream gauges (28.45° S, 32.20° E) for comparison with daily satellite-model EC reanalysis over the catchment [16]. The time–space correlation of Jan–Mar river-flow onto field rainfall was analyzed (Figure A1) to objectively define the ‘catchment’: 28.5–27.5° S, 31.75–32.5° E, which encompasses the Rift Valley, Umfolozi Valley, Umkuze wetlands, and Lake St Lucia (Figure 1a). All data attributes are listed in Table 1 below.
Landscape characteristics were analyzed at 1 km resolution from Modis satellite day-time surface temperature and vegetation color fraction (29–27° S, 32–33° E), contrasting a wet spell (DJF 2014) and dry spell (DJF 2016). Aerial photos and Landsat visible images were obtained at the Umfolozi river mouth, Cape Vidal, and Mabibi. Suspended sediments in near-shore seawater were estimated via monthly SeaWifs, Modis and Viirs satellite red-band 0.67 µm reflectivity 1997–2024 [15] from the Umfolozi river mouth to Cape Vidal (28.1–28.4° S, 32.45–32.65° E, Figure 1a). A Hovmöller plot was made along the coast from Mapelane to Mabibi (28.5–27.5° S, excluding lakes). Weekly satellite data could not be used to generate long time series due to frequent cloud cover; however, daily Viirs images were obtained for the flood case study.
Daily weather conditions were analyzed for surface temperature, humidity, wind velocity, air pressure, and boundary layer height via Merra2 reanalysis [17] in the period 1981–2024. Wind power on the beach was calculated from [18]. The catchment’s daily Chirps rainfall [19] and monthly satellite vegetation color [20] were obtained, as proxies for landscape hydrology and runoff. Daily sea surface temperatures, mixed layer depth (MLD), salinity, and currents were obtained in the near-shore zone from Umfolozi to Cape Vidal via a 10 km resolution hybrid ocean reanalysis (Hycom3) [21]. Daily wave height, period, and direction characteristics were extracted at the grid point nearest Cape Vidal from NOAA wavewatch3 (W3) reanalysis [22,23] of 1997–2024, and the meridional (V) wave component was employed to quantify longshore drift on this east-facing coast. The reader may note that ‘surf-zone’ and ‘near-shore’ convey a distance from the coast of 0–200 m and 0–4000 m, respectively. ‘Wind-waves’ refer to incoming swells and breakers with a mixture of wavelengths.

2.2. Statistical Methods and Analysis

The daily time series were analyzed for mean annual cycle and frequency distributions over the period of 1997–2024, N = 10,226, and wind-wave roses were plotted. Surf-zone drifter tracks and beach sand samples were summarized into speed, direction, and grain-size histograms. Lag-correlations were calculated between the daily catchment rainfall, river-flow, and V wave height time series. A caveat here is that cross-shore transport by wind and waves, which can modulate littoral drift, is assumed to be minor in comparison with longshore components. Using the V component has the advantage of combining direction with speed or height, and offers a useful index of longshore transport channeled by the east-facing coastline of Cape Vidal.
Climatic influences were studied via a time–space correlation analysis using catchment rainfall, vegetation, and wind power indices over the period of 1981–2024. Daily correlation maps were calculated between the rainfall time series constrained to >1 mm/day (N = 5846) and regional fields of satellite netOLR [24] from –2-day lead to +2 lag. Indices were averaged to seasonal values (N = 44) and time–space-correlated with surface wind, air pressure, and sea surface temperature fields. This method of referencing a time series to each grid point of an environmental field is an innovative way to link local effects to wider causes. Statistical significance requires R values > |0.24| for 95% confidence.
Multi-year cycles were identified by an application of wavelet spectral analysis to rainfall, vegetation, and wind power time series, filtered to retain variability > 18 months. Weather extremes were elucidated by case studies of dry northeasterly winds on 4 Nov 2018 and summer floods in 19–20 February 2025. Wind and rainfall maps, hourly heat flux and boundary layer height, daily river-flow and salinity time series, and satellite lidar aerosol backscatter and red-band imagery fulfill the dry and wet case study analyses.
Near-shore red-band reflectivity was statistically analyzed from Umfolozi to Sodwana and sand dune height was plotted with rainfall and wind-speed data to identify local gradients. Changes in the beach profile at Cape Vidal were obtained, and sea level trends were determined from Durban harbor and satellite altimetry reanalysis [25]. Trends in Merra2 surface temperatures and winds were mapped over the study area to quantify climate change from 1981 to 2024. Visitor numbers at Cape Vidal were obtained from annual reports [26] and indicate 9000 to 35,000/month.

3. Results

3.1. Coastal Hydrology and Landscape

Figure 1a–e characterize the coastal hydrology and landscape. The topography descends from 240 m at the Rift Valley 32.1° E to a plain of wetlands and lakes at 40 m elevation at 32.4° E. These dry savannah grasslands experience rainfall of 2.0 mm/day; that is half of the potential evaporation of 4.2 mm/day. Rainfall increases to 2.7 mm/day at the coast, where longshore winds average 6.8 m/s from the south and northeast. Tall vegetated sand dunes slope steeply toward the beach, where coral reefs form intermittent headlands. The satellite imagery (Figure 1b,c) reveals muddy river outflow in the south, and wave-reworked sediments in the north. Umfolozi river-flow time series show pronounced seasonality, with little discharge in winter (Figure 1d). The marine environment is characterized by a narrow shelf and warm Agulhas Current. The convex coast accelerates longshore flow and receives swells from SE sectors, making for a dynamic environment. With warm windy weather and a P–E deficit, foredune sands have a ~1% moisture content for efficient aeolian transport [18].

3.2. Red-Band Reflectivity

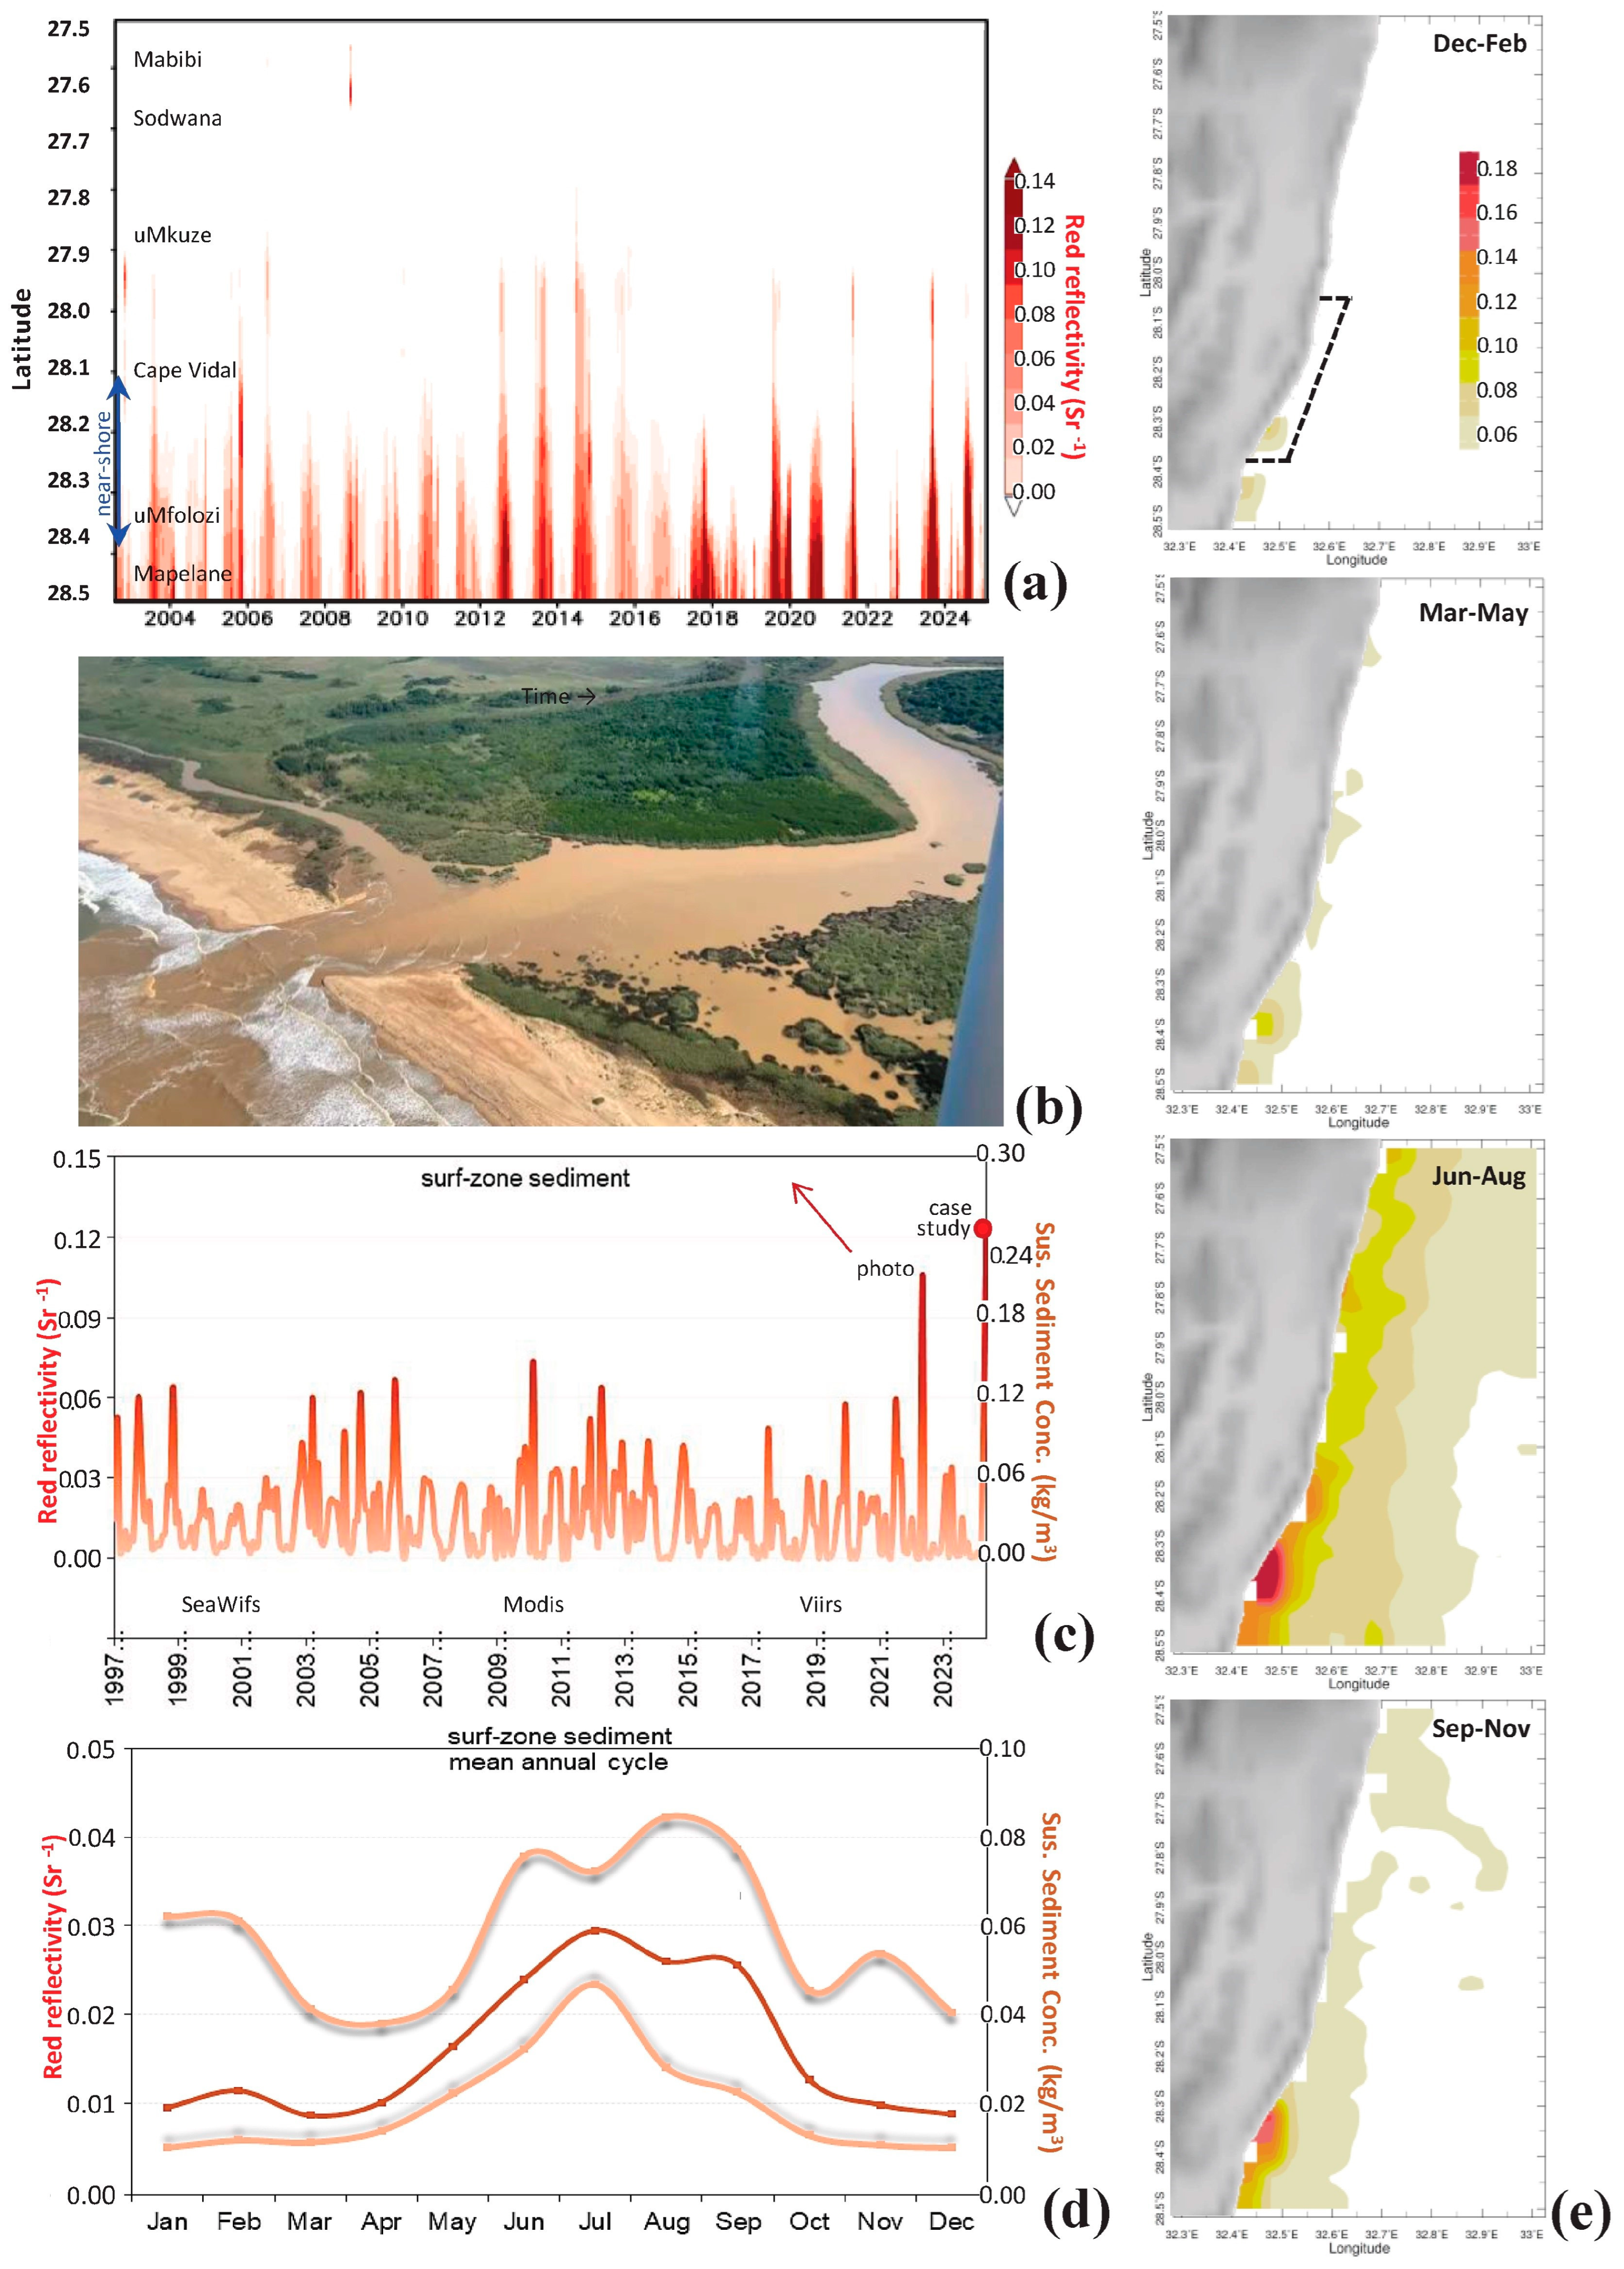
Figure 2a–c present the near-shore satellite red-band reflectivity as Hovmöller 28.5–27.5° S and time series, and an aerial photo of the Umfolozi discharge. The southern coastal zone received multi-year pulses of terrestrial runoff in 2012–2014 and 2019–2024, causing turbid seawater, but only a few pulses reached the northern log-spiral bays of Sodwana and Mabibi. The aerial photo of the Umfolozi discharge near Mapelane reveals a muddy outflow that disperses seaward at concentrations of ~0.2 kg/m3 (0.1 Sr−1) when river mouth dunes are breached. The buoyant discharge plume loops back to the coast and joins coarse sands reworked in the surf-zone. The Hovmöller plot shows a northward decline of suspended sediment concentration to ~0.02 kg/m3 (0.01 Sr−1), maintaining water clarity for near-shore diving activities.

3.3. Mean Annual Cycle and Frequency Distributions

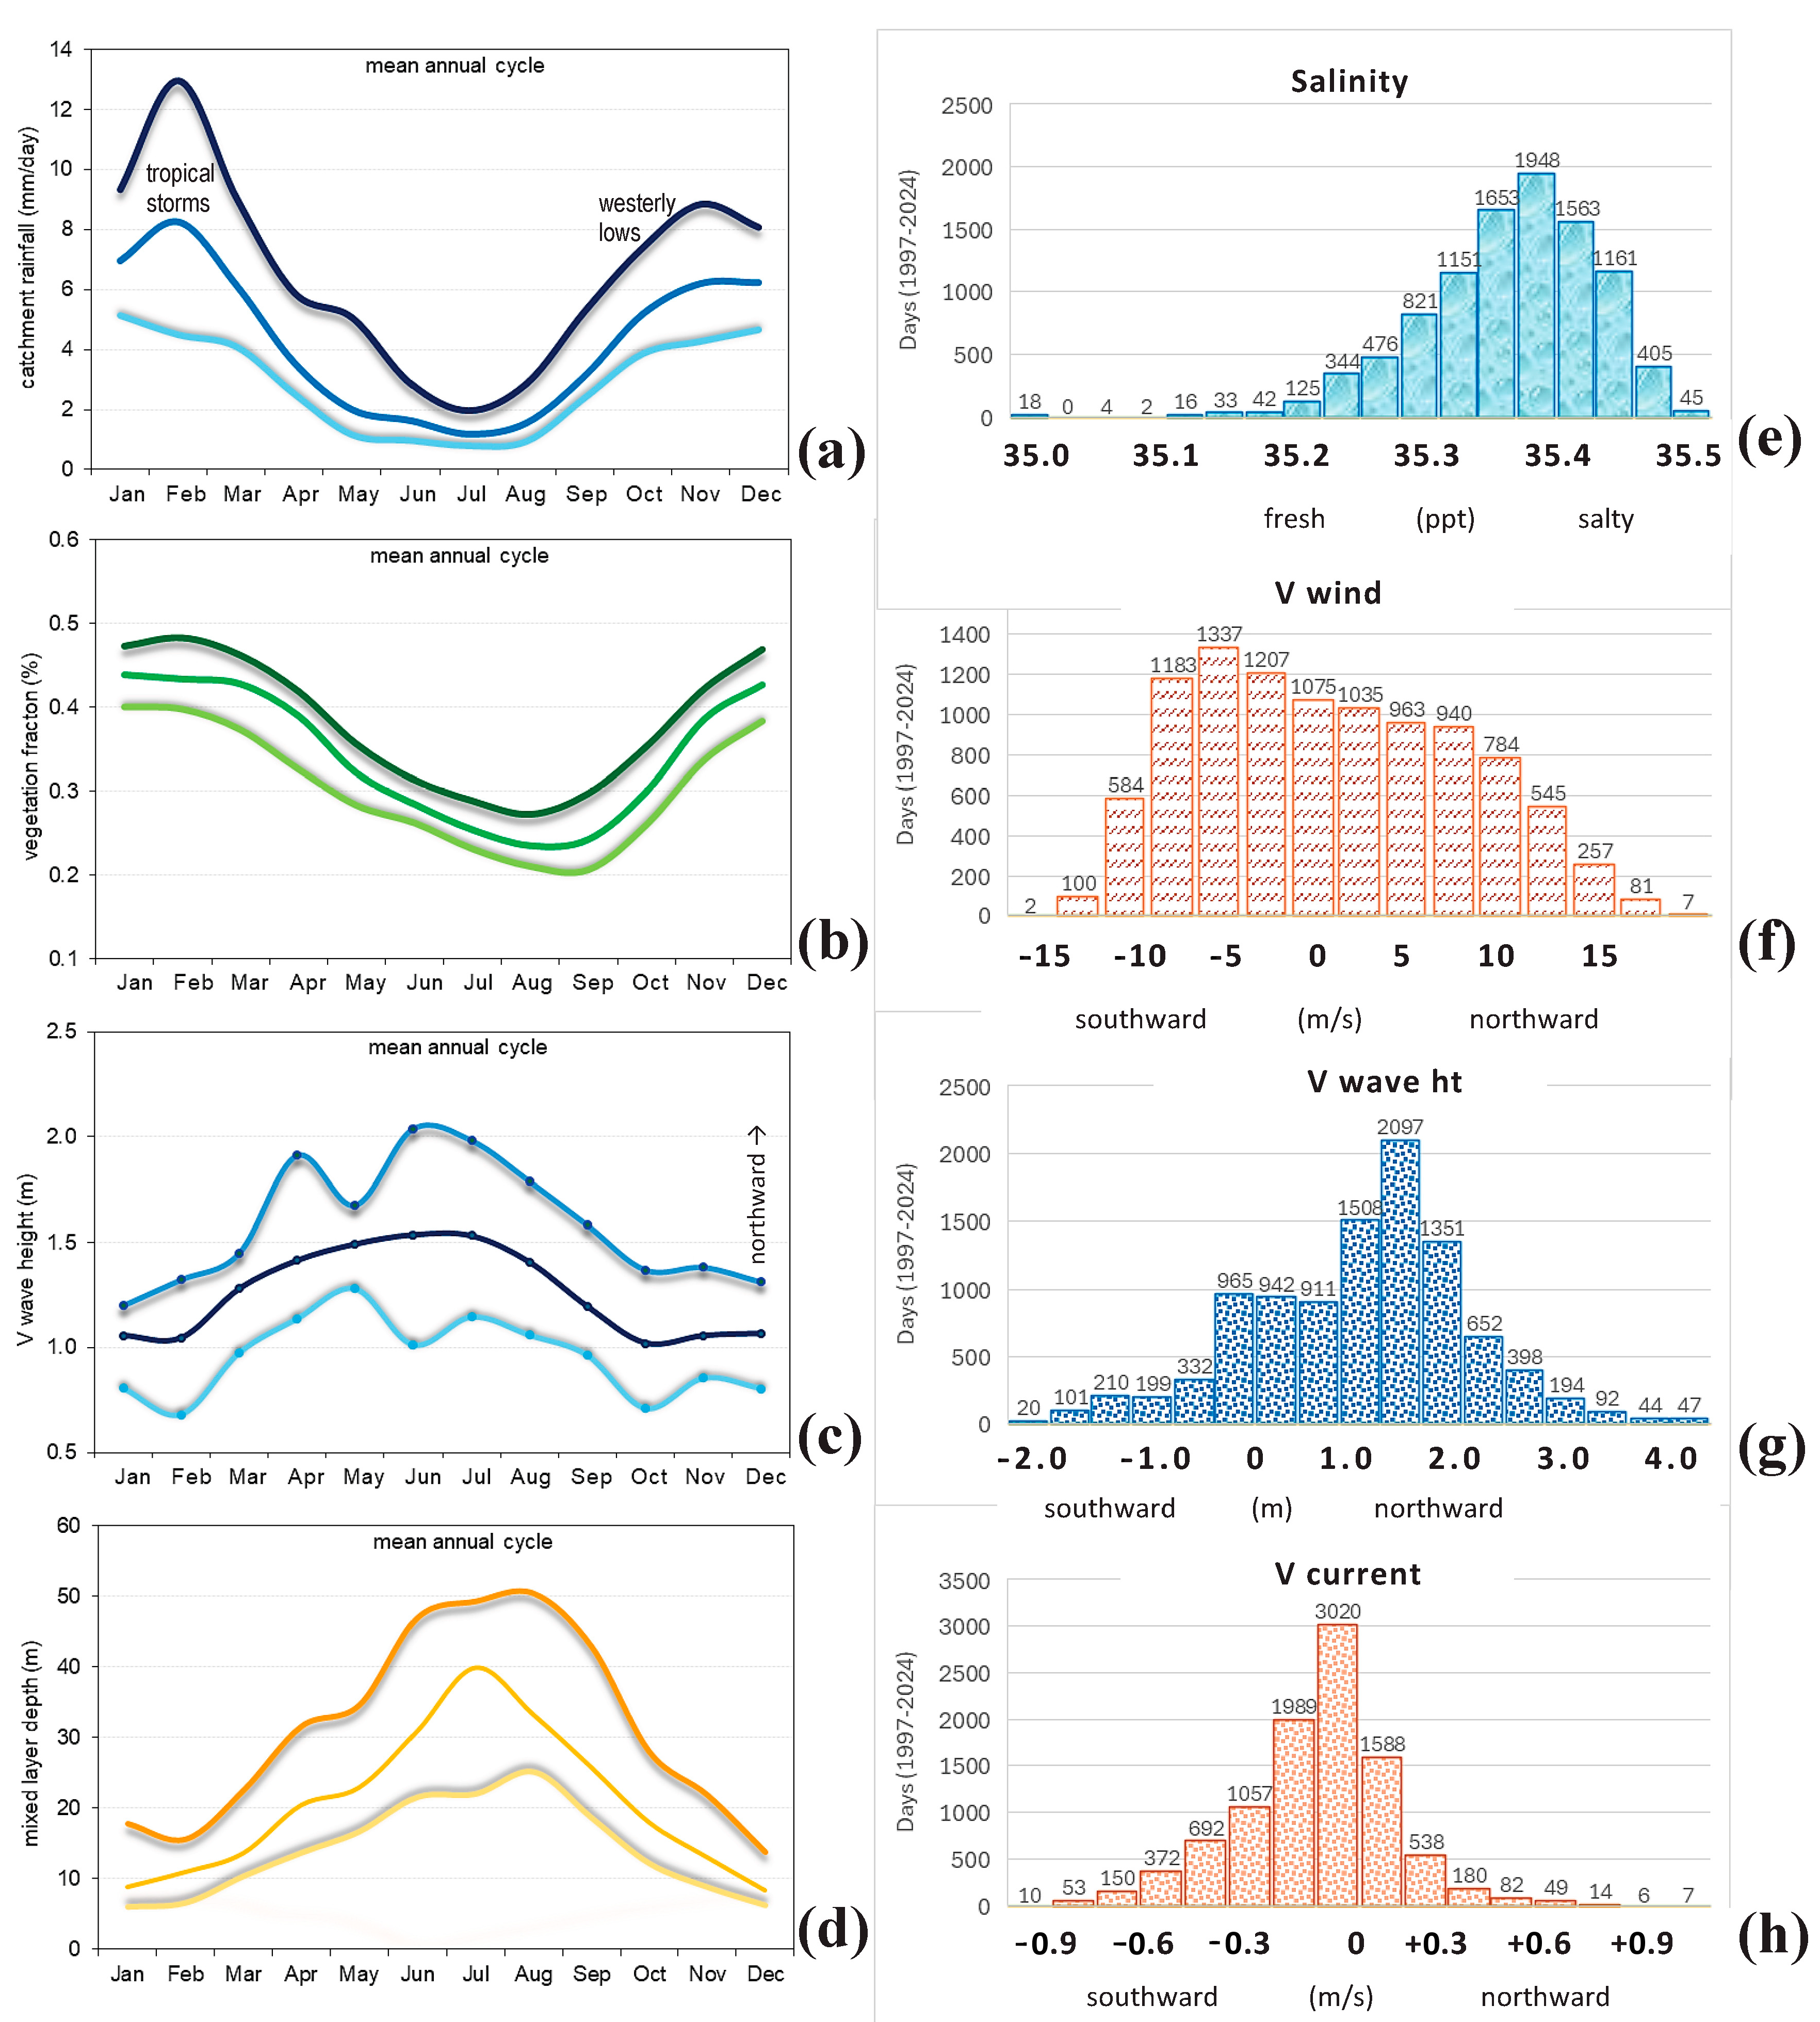
The mean annual cycle of near-shore red-band reflectivity is presented in Figure 2d. The median and lower quintile crest in winter (0.15–0.25 Sr−1), consistent with maps of red-band reflectivity (Figure 2e). Although the mean annual cycles for terrestrial rainfall and vegetation (Figure 3a,b) crest in summer (Nov, Feb) and generate Umfolozi river-flows >100 m3/s, seaward discharge only occurs when the dunes are breached. Meridional wave height (Figure 3c) crests at 1.6 m in Jun–Jul with lower and upper quintiles of 1.0–2.1 m. The wave action releases mineral-rich sea spray that fertilizes the foredune vegetation [27]. The depth of wave-induced turbulence is modulated by swell height and mixed layer depth (MLD, Figure 3d). Thermal stratification (shallow MLD) during summer inhibits surf-zone turbulence, so the seawater remains clear, despite runoff. The MLD crests in the cool winter months (40 m, Jul–Aug) allowing storm waves to lift coarse sediments from the seabed for northward transport [28]. The MLD plays an important role in surf-zone transport and relies on winter-time cooling by southerly winds during frontal weather.
Frequency distributions are presented as histograms in Figure 3d–g. Although median salinity was 35.37 ppt near the Umfolozi mouth, daily values declined below 35.2 ppt about 2% of the time, indicating discharge plumes. For V wind, northeasterlies <−10 m/s prevailed ~6% of the time, generating wind-blown sand on the upper beach. Southerlies >+10 m/s occurred ~8% of the time, often accompanied by big swells and rainfall. These speeds are applicable to the beach; hand-held wind surveys found airflow about 35% ambient within the forests. The V wave height histogram had few cases of negative values (from northeast), a median of +1.6 m and southerly swells >3 m about 7% of the time. Median V currents outside the surf-zone were near zero: southward and northward drifts had an equal proportion. Measurements inside the surf-zone are given in Section 3.6 below.

3.4. Drivers of Catchment Hydrology

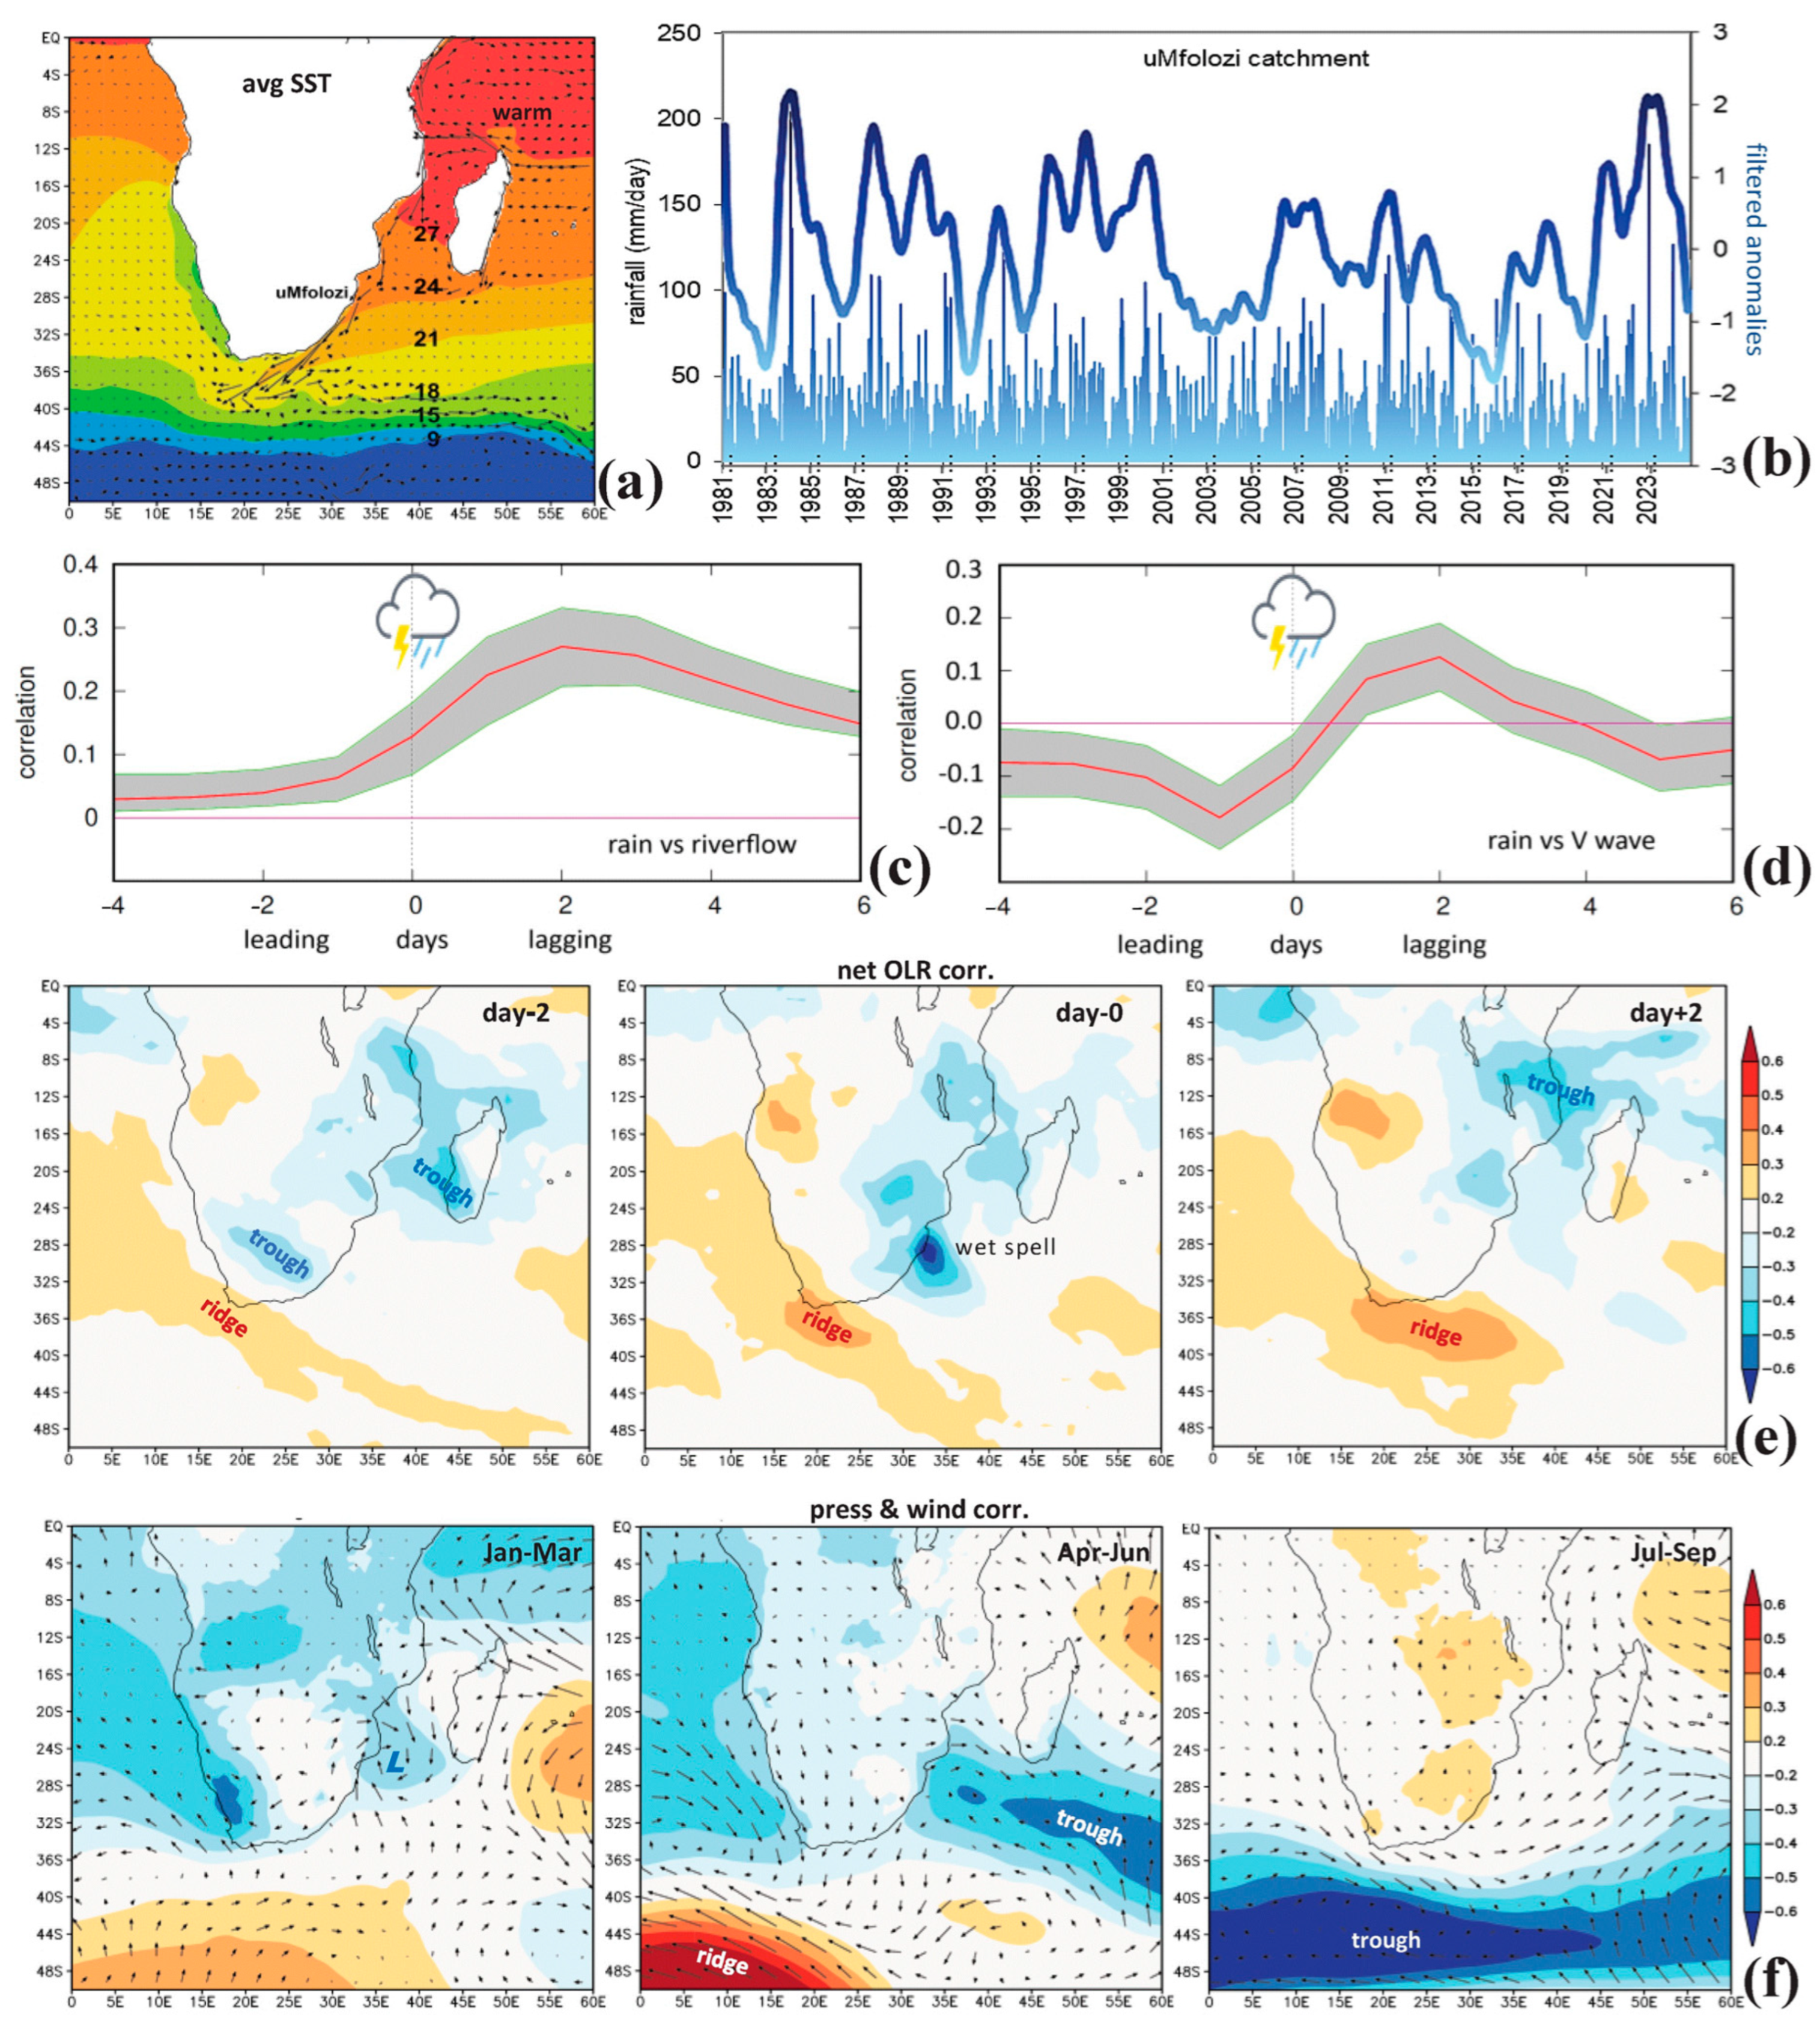
A map of average sea surface temperature and currents is presented in Figure 4a. The well-known asymmetry of large-scale marine temperatures relates to opposing warm and cold currents on the east and west coast of South Africa. In consequence, humidity attracts tropical troughs to the Mozambique Channel during summer. The catchment daily rainfall (Figure 4b) exhibits wet spells throughout the record in 1981–2024, yet 46% of the time, there is < 0.1 mm/day. Filtered rainfall anomalies reveal multi-year dry spells that produce little runoff. Lag-correlations between catchment rainfall > 1 mm/day, and daily river-flow and V wave heights are instructive (Figure 4c,d). Both show a sharp increase at +2 days and suggest that discharges are often attended by northward-wave-driven currents.
Regional lag-correlation maps between rainfall >1 mm/day and daily satellite net OLR are presented in Figure 4e. Note that net OLR indicates anticyclonic subsidence when positive and cyclonic convection when negative. During the wet spell sequence, a mid-latitude anticyclone (+OLR) advances from the western Cape. Sub-tropical troughs from the Kalahari and Madagascar converge on the Umfolozi catchment 1–2 days before the wet spell. At its greatest extent, the moist convective area (–OLR) covers 20–34° S, 27–37° E, and then retreats to the northern Mozambique Channel 1–2 days after the wet spell.
Regional time–space correlation maps of summer rainfall and fields of surface air pressure and winds in Jan–Mar, Apr–Jun, and Jul–Sep are presented in Figure 4f. During summertime, there is a low pressure over the southern Mozambique Channel and a high pressure in the mid-latitudes near Cape Town. Southerly winds are sustained which draw cool onshore airflow toward the Umfolozi catchment. As the seasons progress, a trough forms south of Madagascar forcing a retreat of the subtropical anticyclones. As winter sets in, the trough spreads across the mid-latitudes south of Africa, bringing wind-wave action to Cape Vidal.
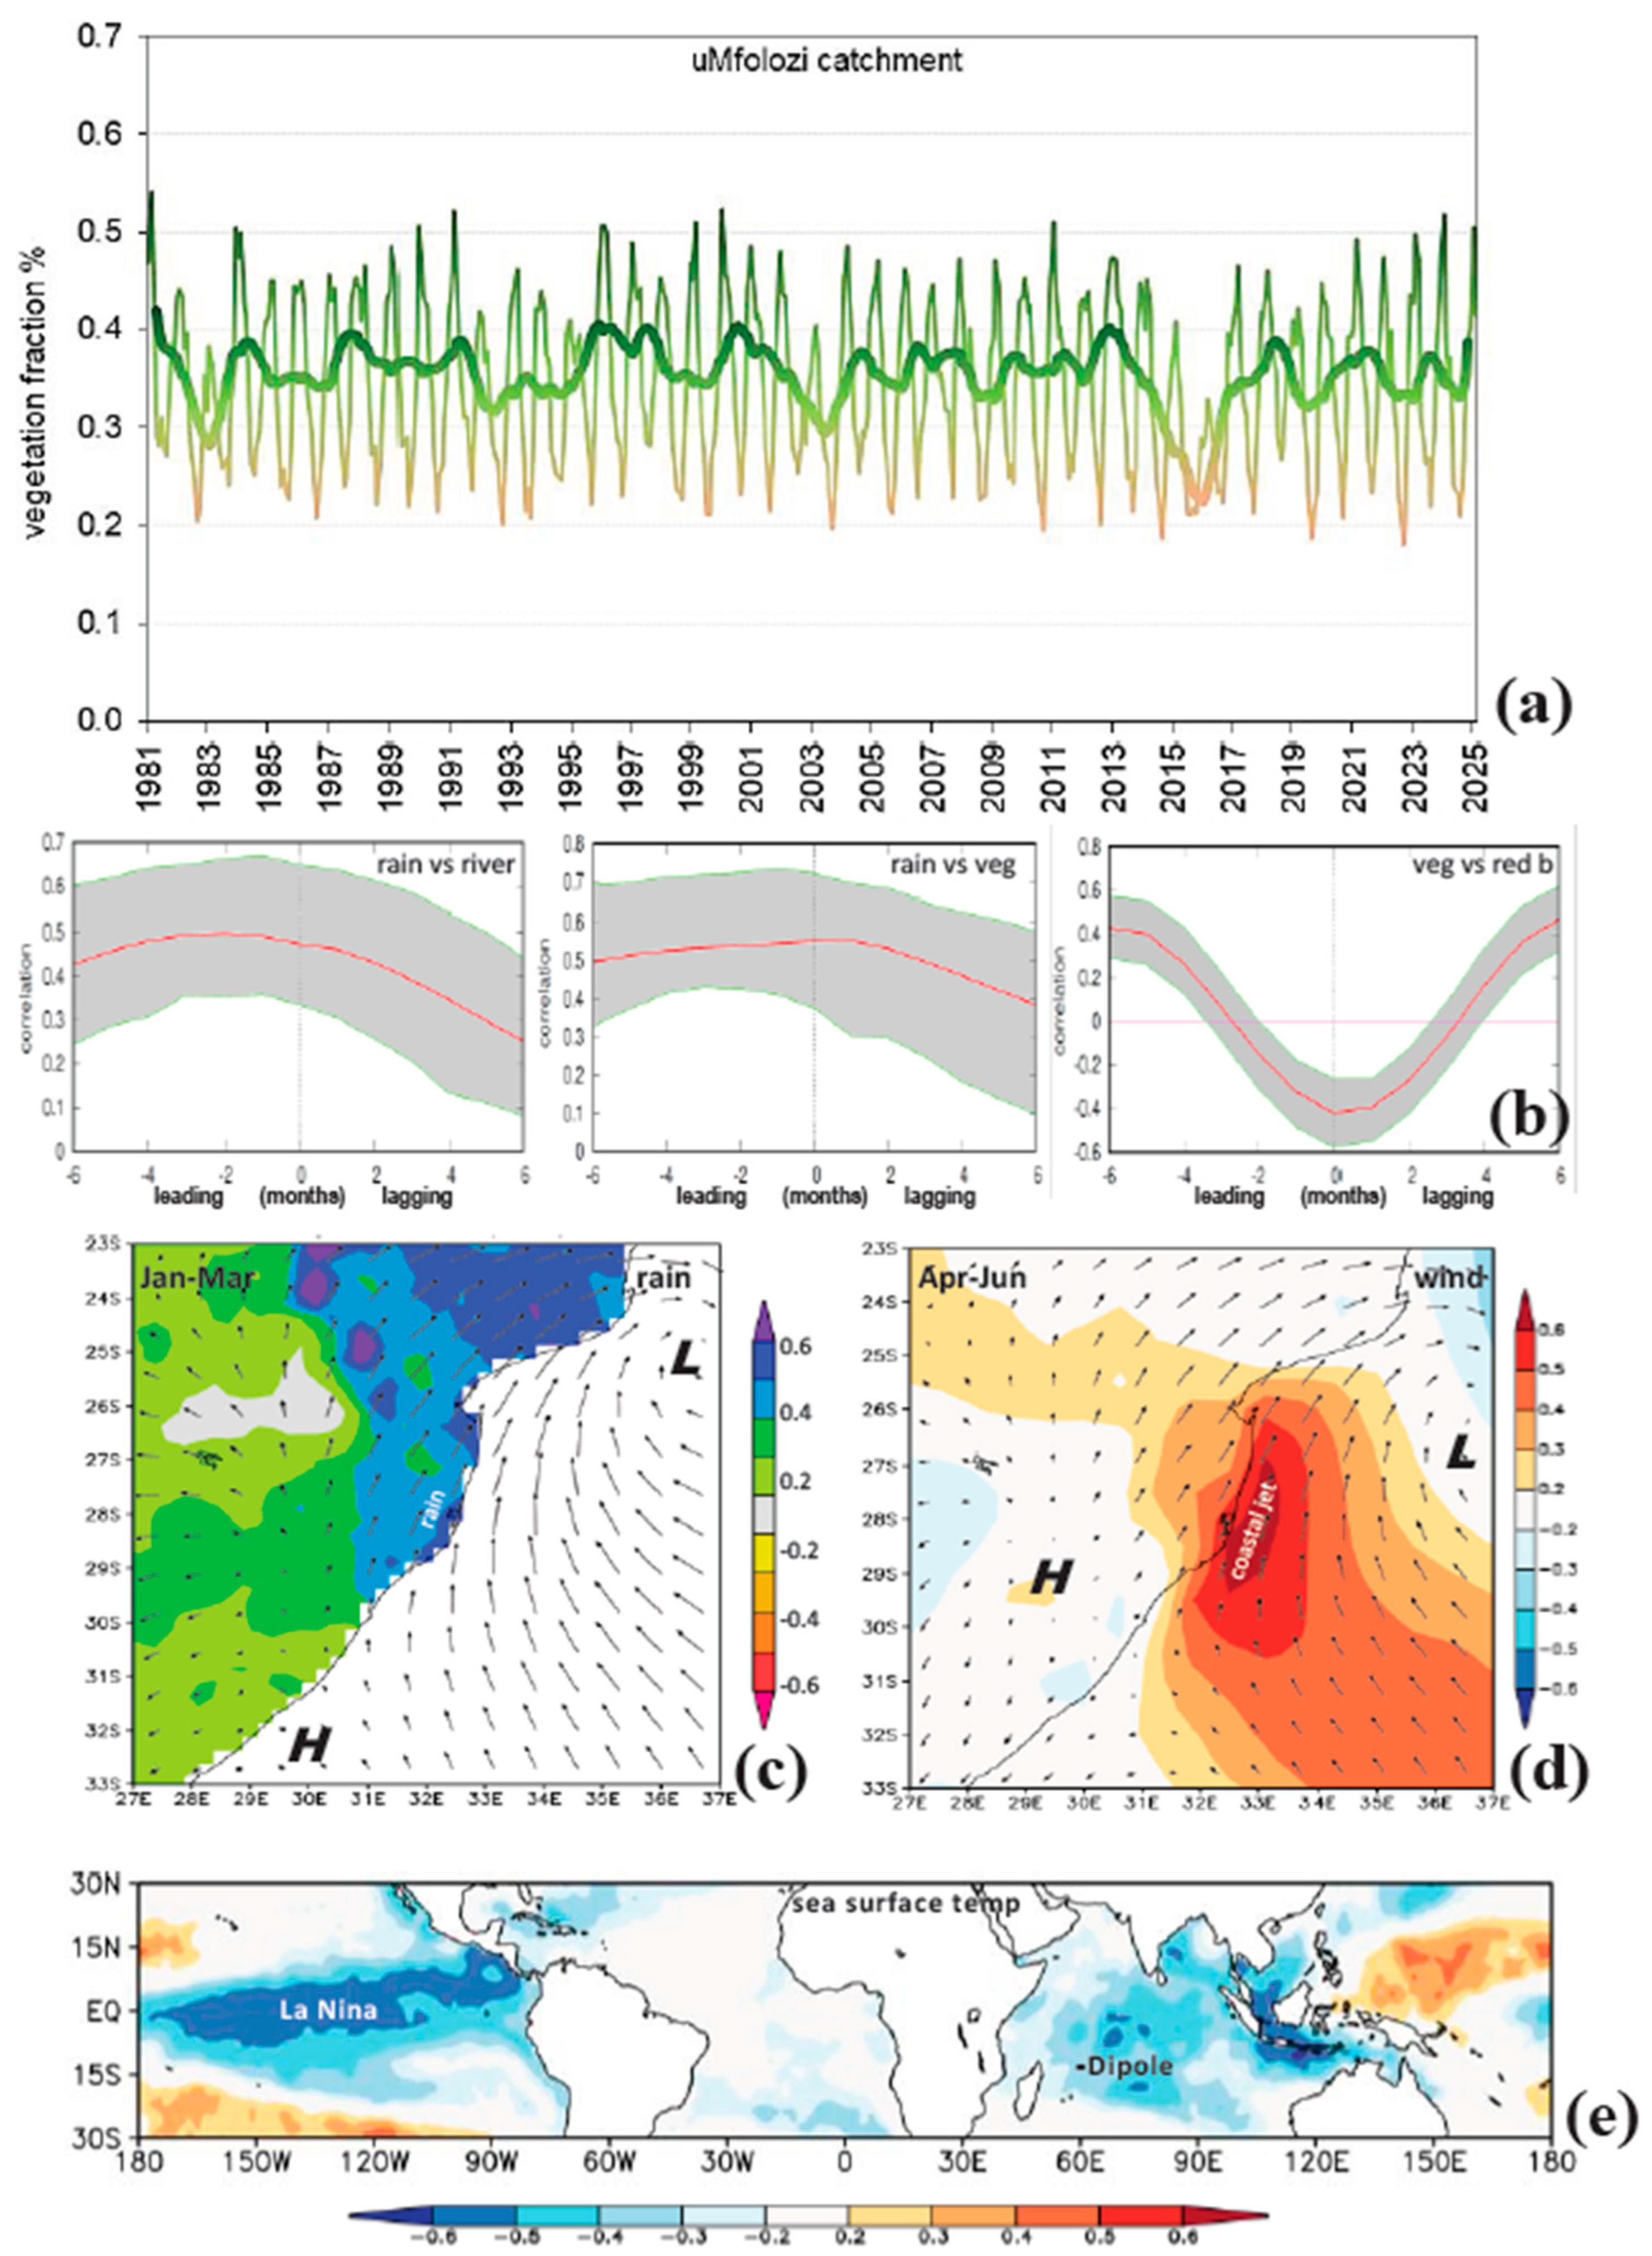
Like rainfall, the catchment vegetation fraction is a proxy for landscape hydrology. Figure 5a presents the monthly and smoothed time series. Annual cycling between summer and winter and multi-year drought (e.g., 2015–2016) punctuate the green conditions. Lag correlations between monthly rainfall, river-flow, vegetation, and red-band reflectivity are presented in Figure 5b. The hydrology is in-phase at a seasonal timescale: rainfall leads river-flow by 2 months, and vegetation lags behind rainfall by 1 month, with R values ~0.5. However, the near-shore red-band reflectivity is out-of-phase with respect to vegetation: R values become positive at + 6 months, suggesting that summer runoff is transported northward in the following winter.
Regional time–space correlation maps of summer vegetation over the Umfolozi catchment and summer rainfall and autumn wind fields are presented in Figure 5c,d. Naturally, a greener landscape is supported by summer rainfall over the coastal plains, associated with southerly winds swirling toward a low pressure over the Mozambique Channel. During autumn (Apr–Jun), the weather pattern is sustained, and southerly winds form a coastal jet near Cape Vidal. This brings cool air over the Agulhas Current and generates large swells and northward sediment transport. Considering global teleconnections with landscape vegetation, time–space correlations with summertime sea surface temperatures (Figure 5e) reveal a Pacific La Nina and negative Indian Ocean Dipole. These weaken the mid-latitude temperature gradient and associated jet stream. The outcome is an increase in stormy weather near Cape Vidal.

3.5. Wind Power, Spectral Analysis, and Contrasting Climates
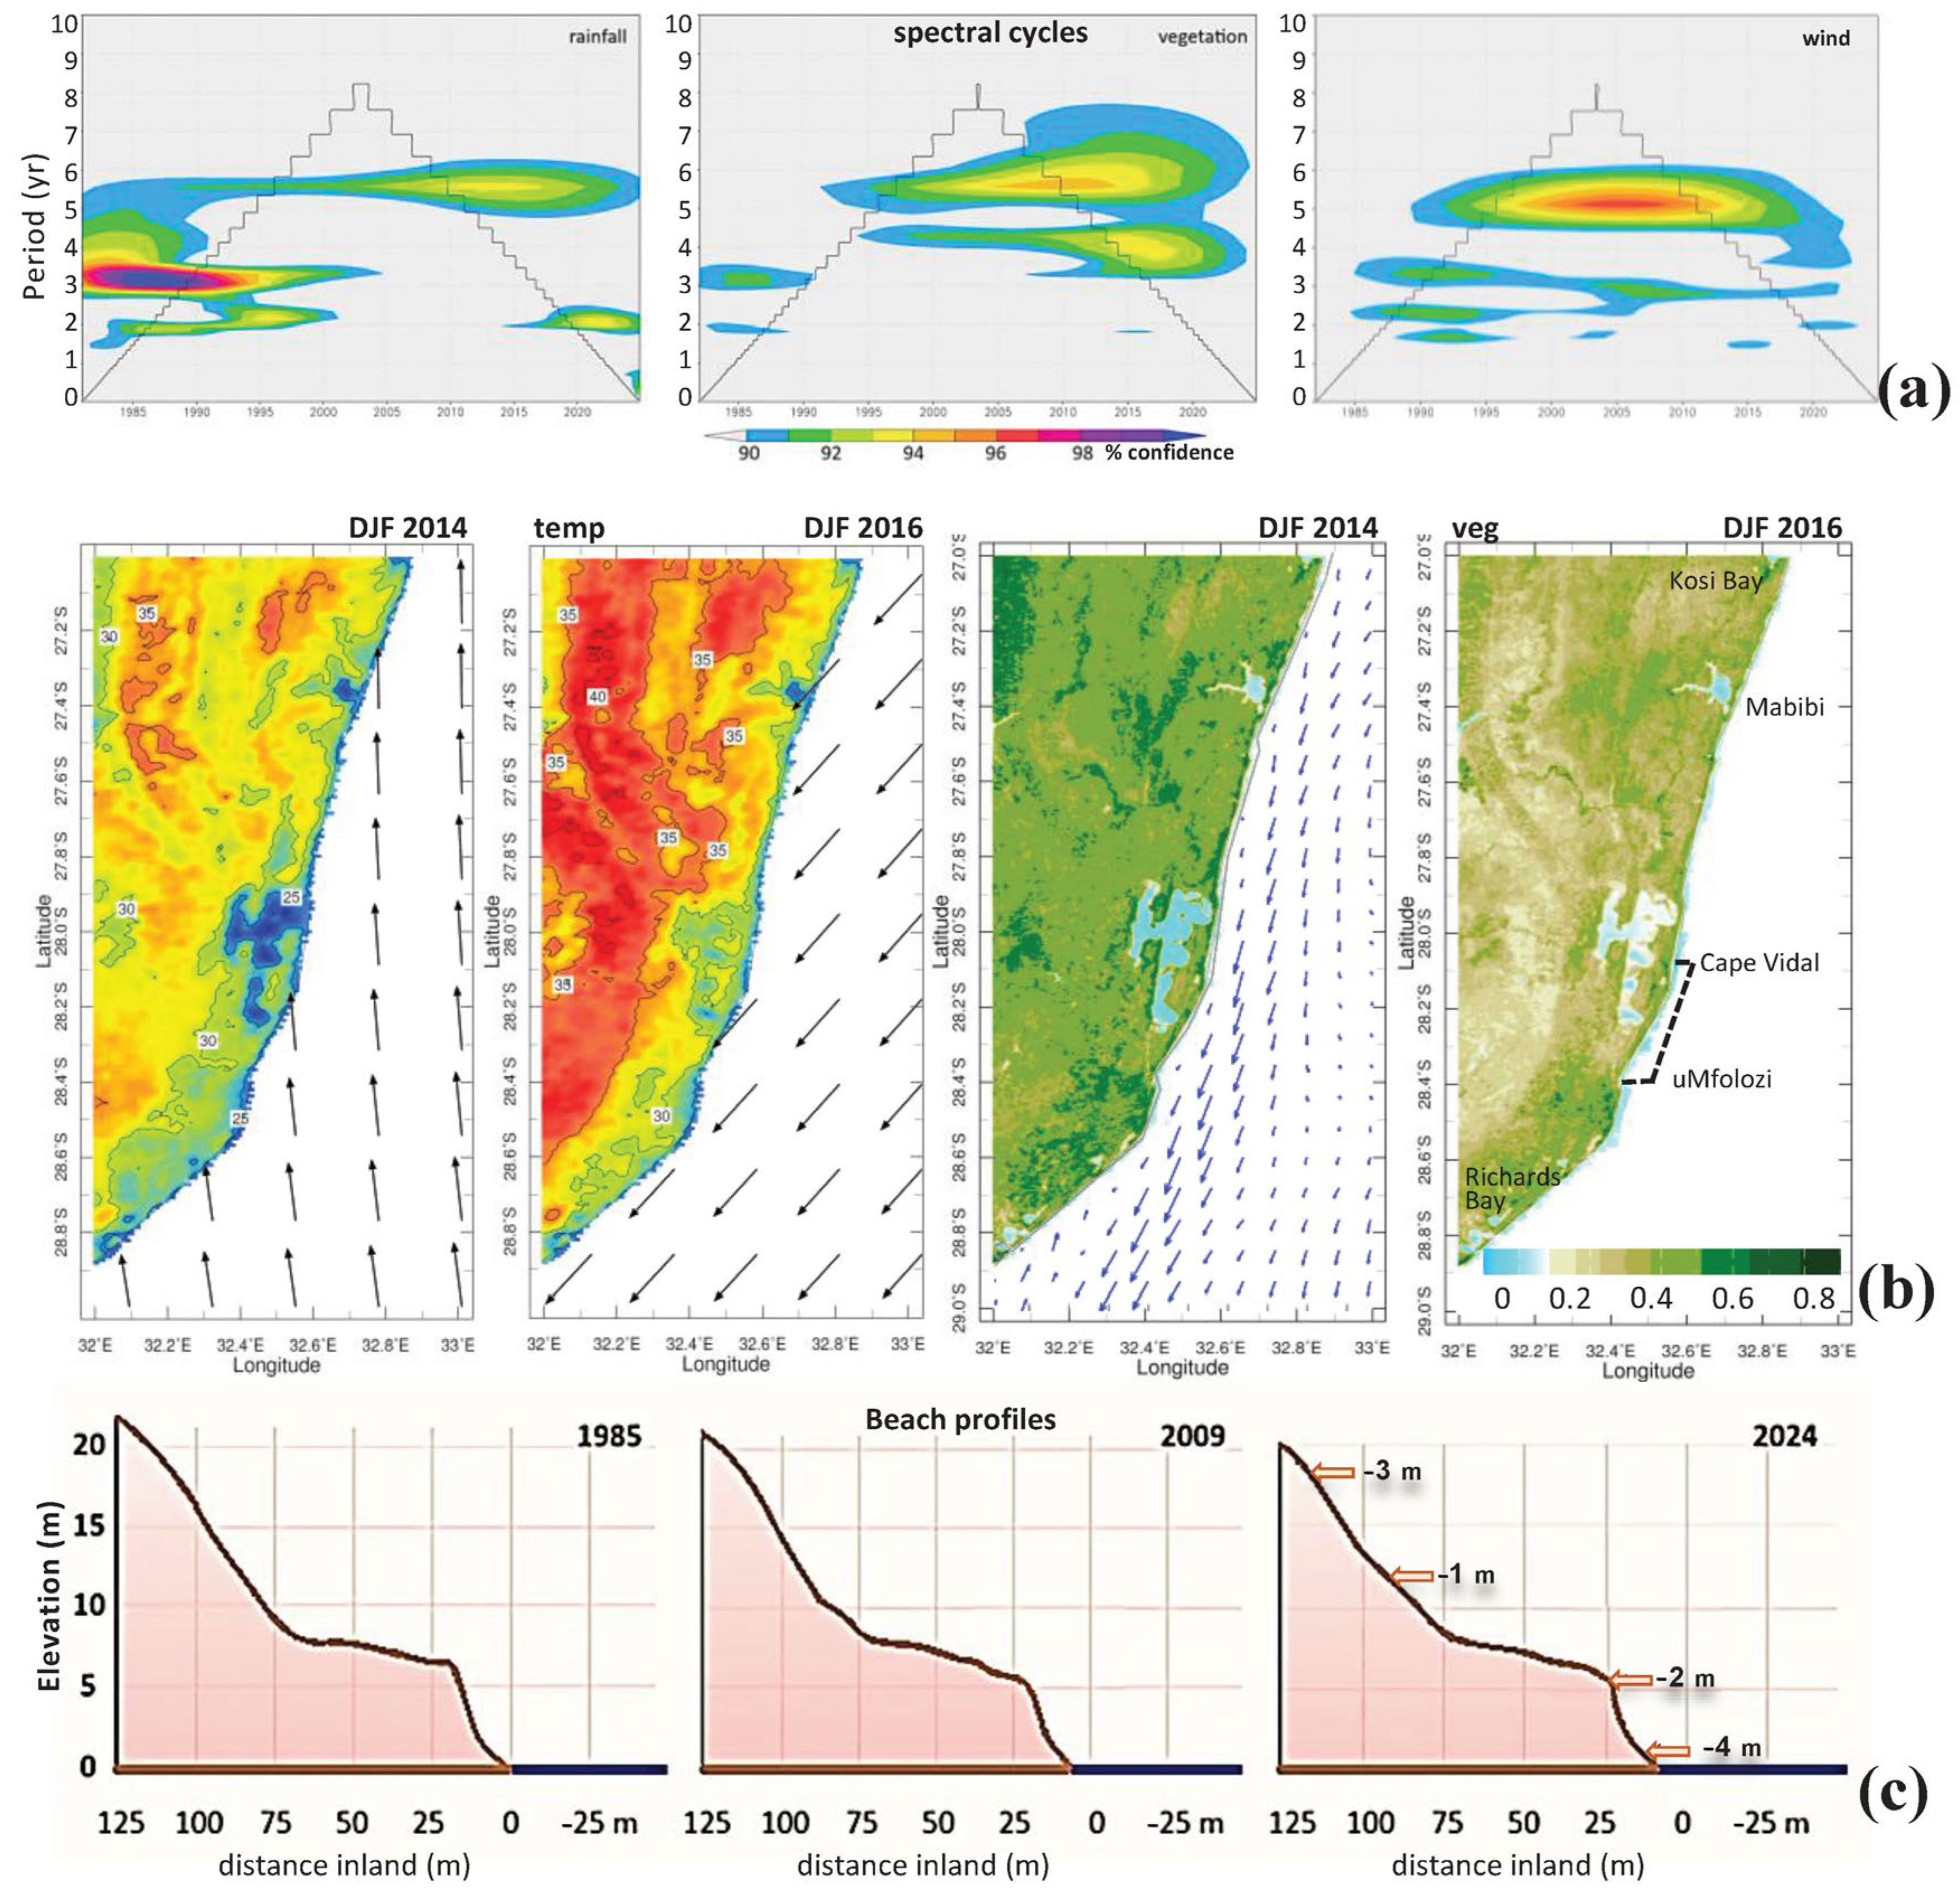
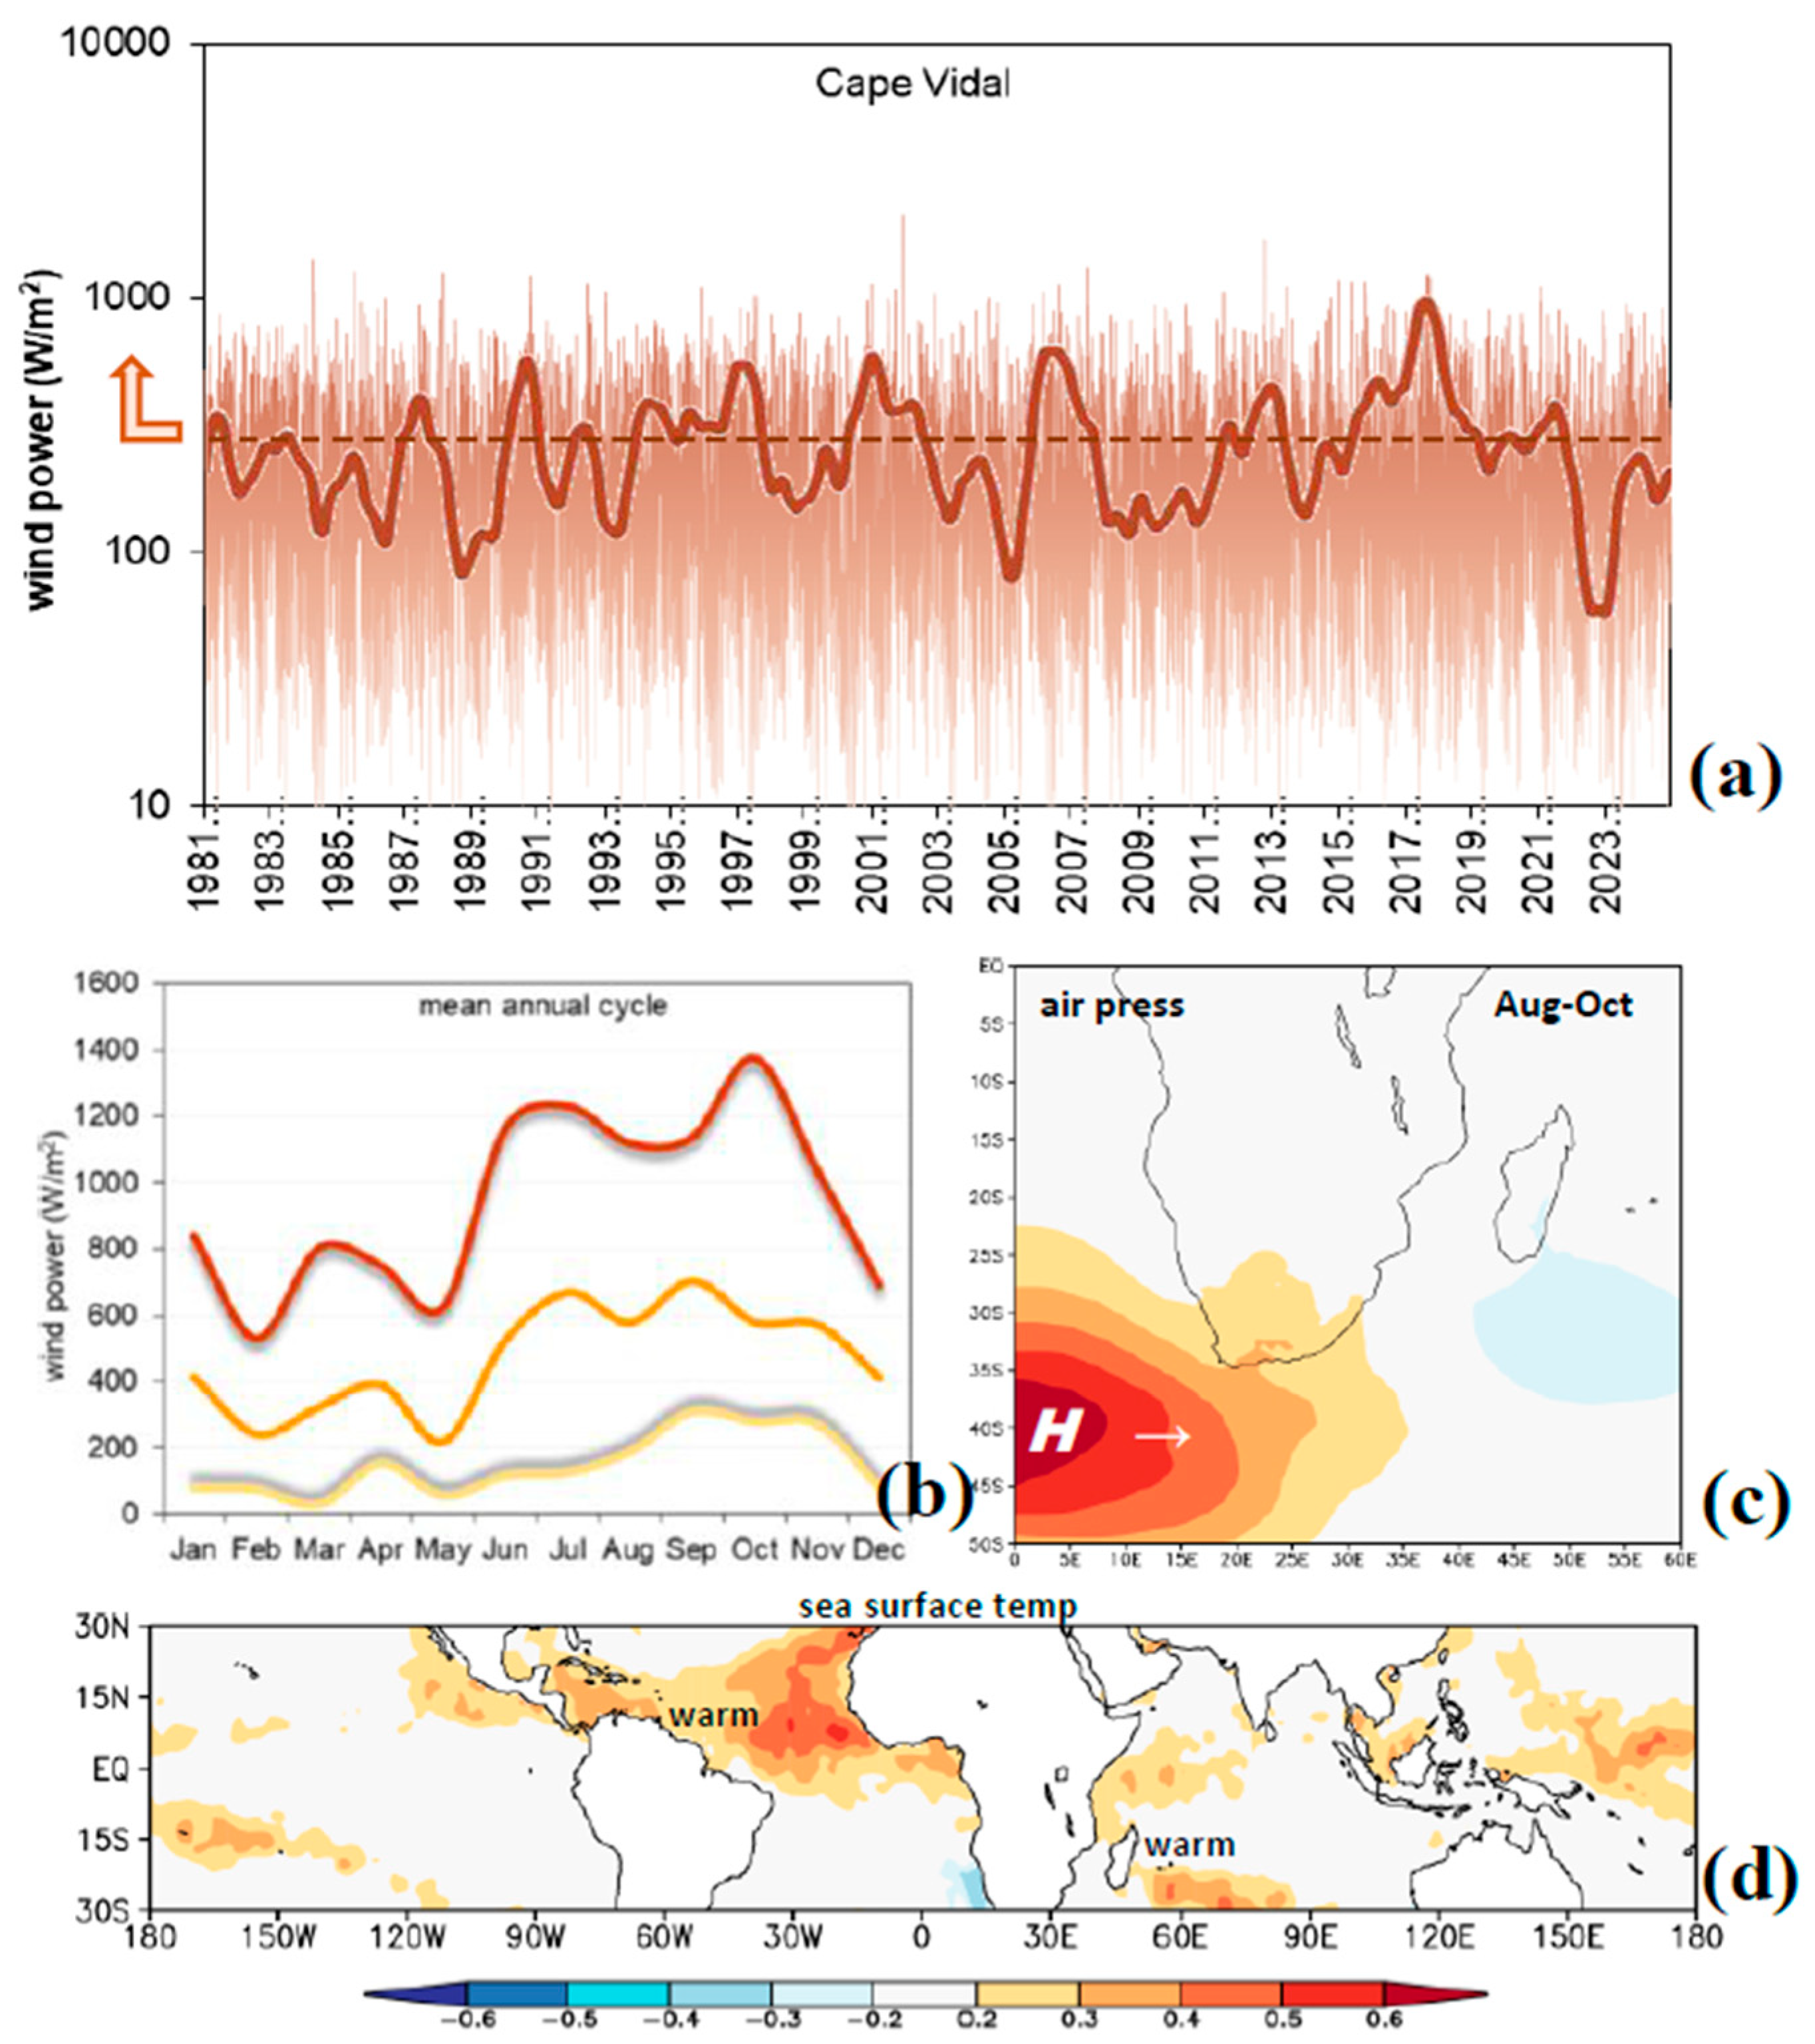
Figure 6a presents the daily record and filtered anomalies of wind power, illustrating frequent spikes above the aeolian transport threshold (350 W/m2) [18], particularly in 2017, and spells of lower values in 1989, 2005, 2009, and 2022. The mean annual cycle (Figure 6b) reveals springtime (Aug–Oct) as the season of greatest wind power, when drifting sands accumulate along the foredune. The time–space correlation map with surface air pressure (Figure 6c) indicates the ridging of the sub-tropical high-pressure belt as an underlying factor in accelerated airflow at Cape Vidal. Unlike the summer hydrology, springtime winds respond to a warmer tropical ocean (Figure 6d) particularly the west Indian (+Dipole) and north Atlantic.
Cyclical behavior is studied in the filtered rainfall, vegetation, and wind power time series by application of wavelet spectral analysis (Figure 7a). Rainfall and vegetation reflect 3 yr and 6 yr cycles, whereas wind power shows a 5 yr cycle. These are associated with thermocline oscillations in the tropical oceans, coupled with large scale zonal atmospheric Walker circulations. These cycles, noted in earlier work [8,29], are attributed to El Nino Southern Oscillation (ENSO) teleconnections that elicit responses near Cape Vidal.
Modis land surface temperature, marine winds, and vegetation fraction (Figure 7b) are contrasted for a wet spell in Dec–Feb 2014 and a dry spell in Dec–Feb 2016 (El Nino). Remarkable differences in temperature and color occurred around Lake St Lucia: 25 °C green–blue during the wet spell and 30 °C brown during the dry spell. Landscape vegetation fraction decreased from 0.6 to 0.2 in the Rift Valley, where average daytime temperatures exceeded 40 °C. Marine wind anomalies were southerly during the wet spell and northeasterly during the dry spell. Little runoff and few small waves limit the northward reworking of surf-zone sediment, yet wind-blown sand can accumulate on the upper beach.
Figure 7. (a) Wavelet spectral analysis of filtered time series, left-to-right: catchment rainfall, vegetation, and wind power, shaded >90% confidence with cone of validity. (b) Modis satellite landscape changes from wet to dry spell in Dec–Feb 2014 and Dec–Feb 2016; daytime land surface temperature and marine wind anomalies (vector largest, 2 m/s), and (right) vegetation color fraction and ocean currents (blue vector largest, 1 m/s). The near-shore zone is dashed. (c) Changes in the west–east sand dune profile at Cape Vidal (cf. Figure 1b) are labelled on the right.
Coasts 05 00025 g007

3.6. Outcome of Field Surveys

Beach profiles at Cape Vidal are presented in Figure 7c. These indicate a slight retreat at the headland over a multi-decadal timespan. There is a gradual flattening of sand dunes from 23 to 20 m on the upper beach, and a 4 m coastward shift of berms above the tidal lagoon. However, given the popularity of eco-tourism and boating activities there [26], these small changes suggest a good degree of resilience.
Umfolozi catchment sediment ~7 105 T/yr [8] is discharged in a buoyant low salinity plume that loops back onto the coast when the dunes are breached. The plumes entrain subtropical seawater and join near-shore currents. Surf-zone drifter histograms (Figure 8a–c) show median directions toward 350°, with a shoreward spread due to wind–wave refraction. Drifter speeds at Mabibi are brisk ±0.4 m/s and often reach 1 m/s. Beach sands are characterized by a moisture content ~0.9%, pH of 7.9, density of 1160 kg/m3, and grain size distribution of 240–410 μm (Figure 8d). These indicate aeolian and inter-tidal sources, typical of remote sandy beaches with few coral reefs and persistent wave action. Coarse sands are also found on the Umfolozi riverbed [8], whereas suspended river sediments are composed of fine silt with grain sizes >5 μm. A photo of the recessed bay at Cape Vidal (Figure 8e) suggests calm waters, but the aerial photo of Mabibi further north (Figure 8f) has big swells that tend to couple beach and dune sedimentation [30]. The convex coast and narrow shelf offer little protection from wave energy.
Figure 8. Field survey data: histograms of surf-zone drifter tracks along the northern coast: (a) direction (toward), (b) current speed, and (c) example of drifter tracks on 1 day. (d) Beach sand grain-size distribution at three places, (e) seaward photo of coral reef at low tide, and (f) southward aerial view of the Mabibi headland with field survey locations. Insets in (b) are wind power (gray) and wave roses with drift vectors (red).
Coasts 05 00025 g008

3.7. Case Study Wind and Flood Events

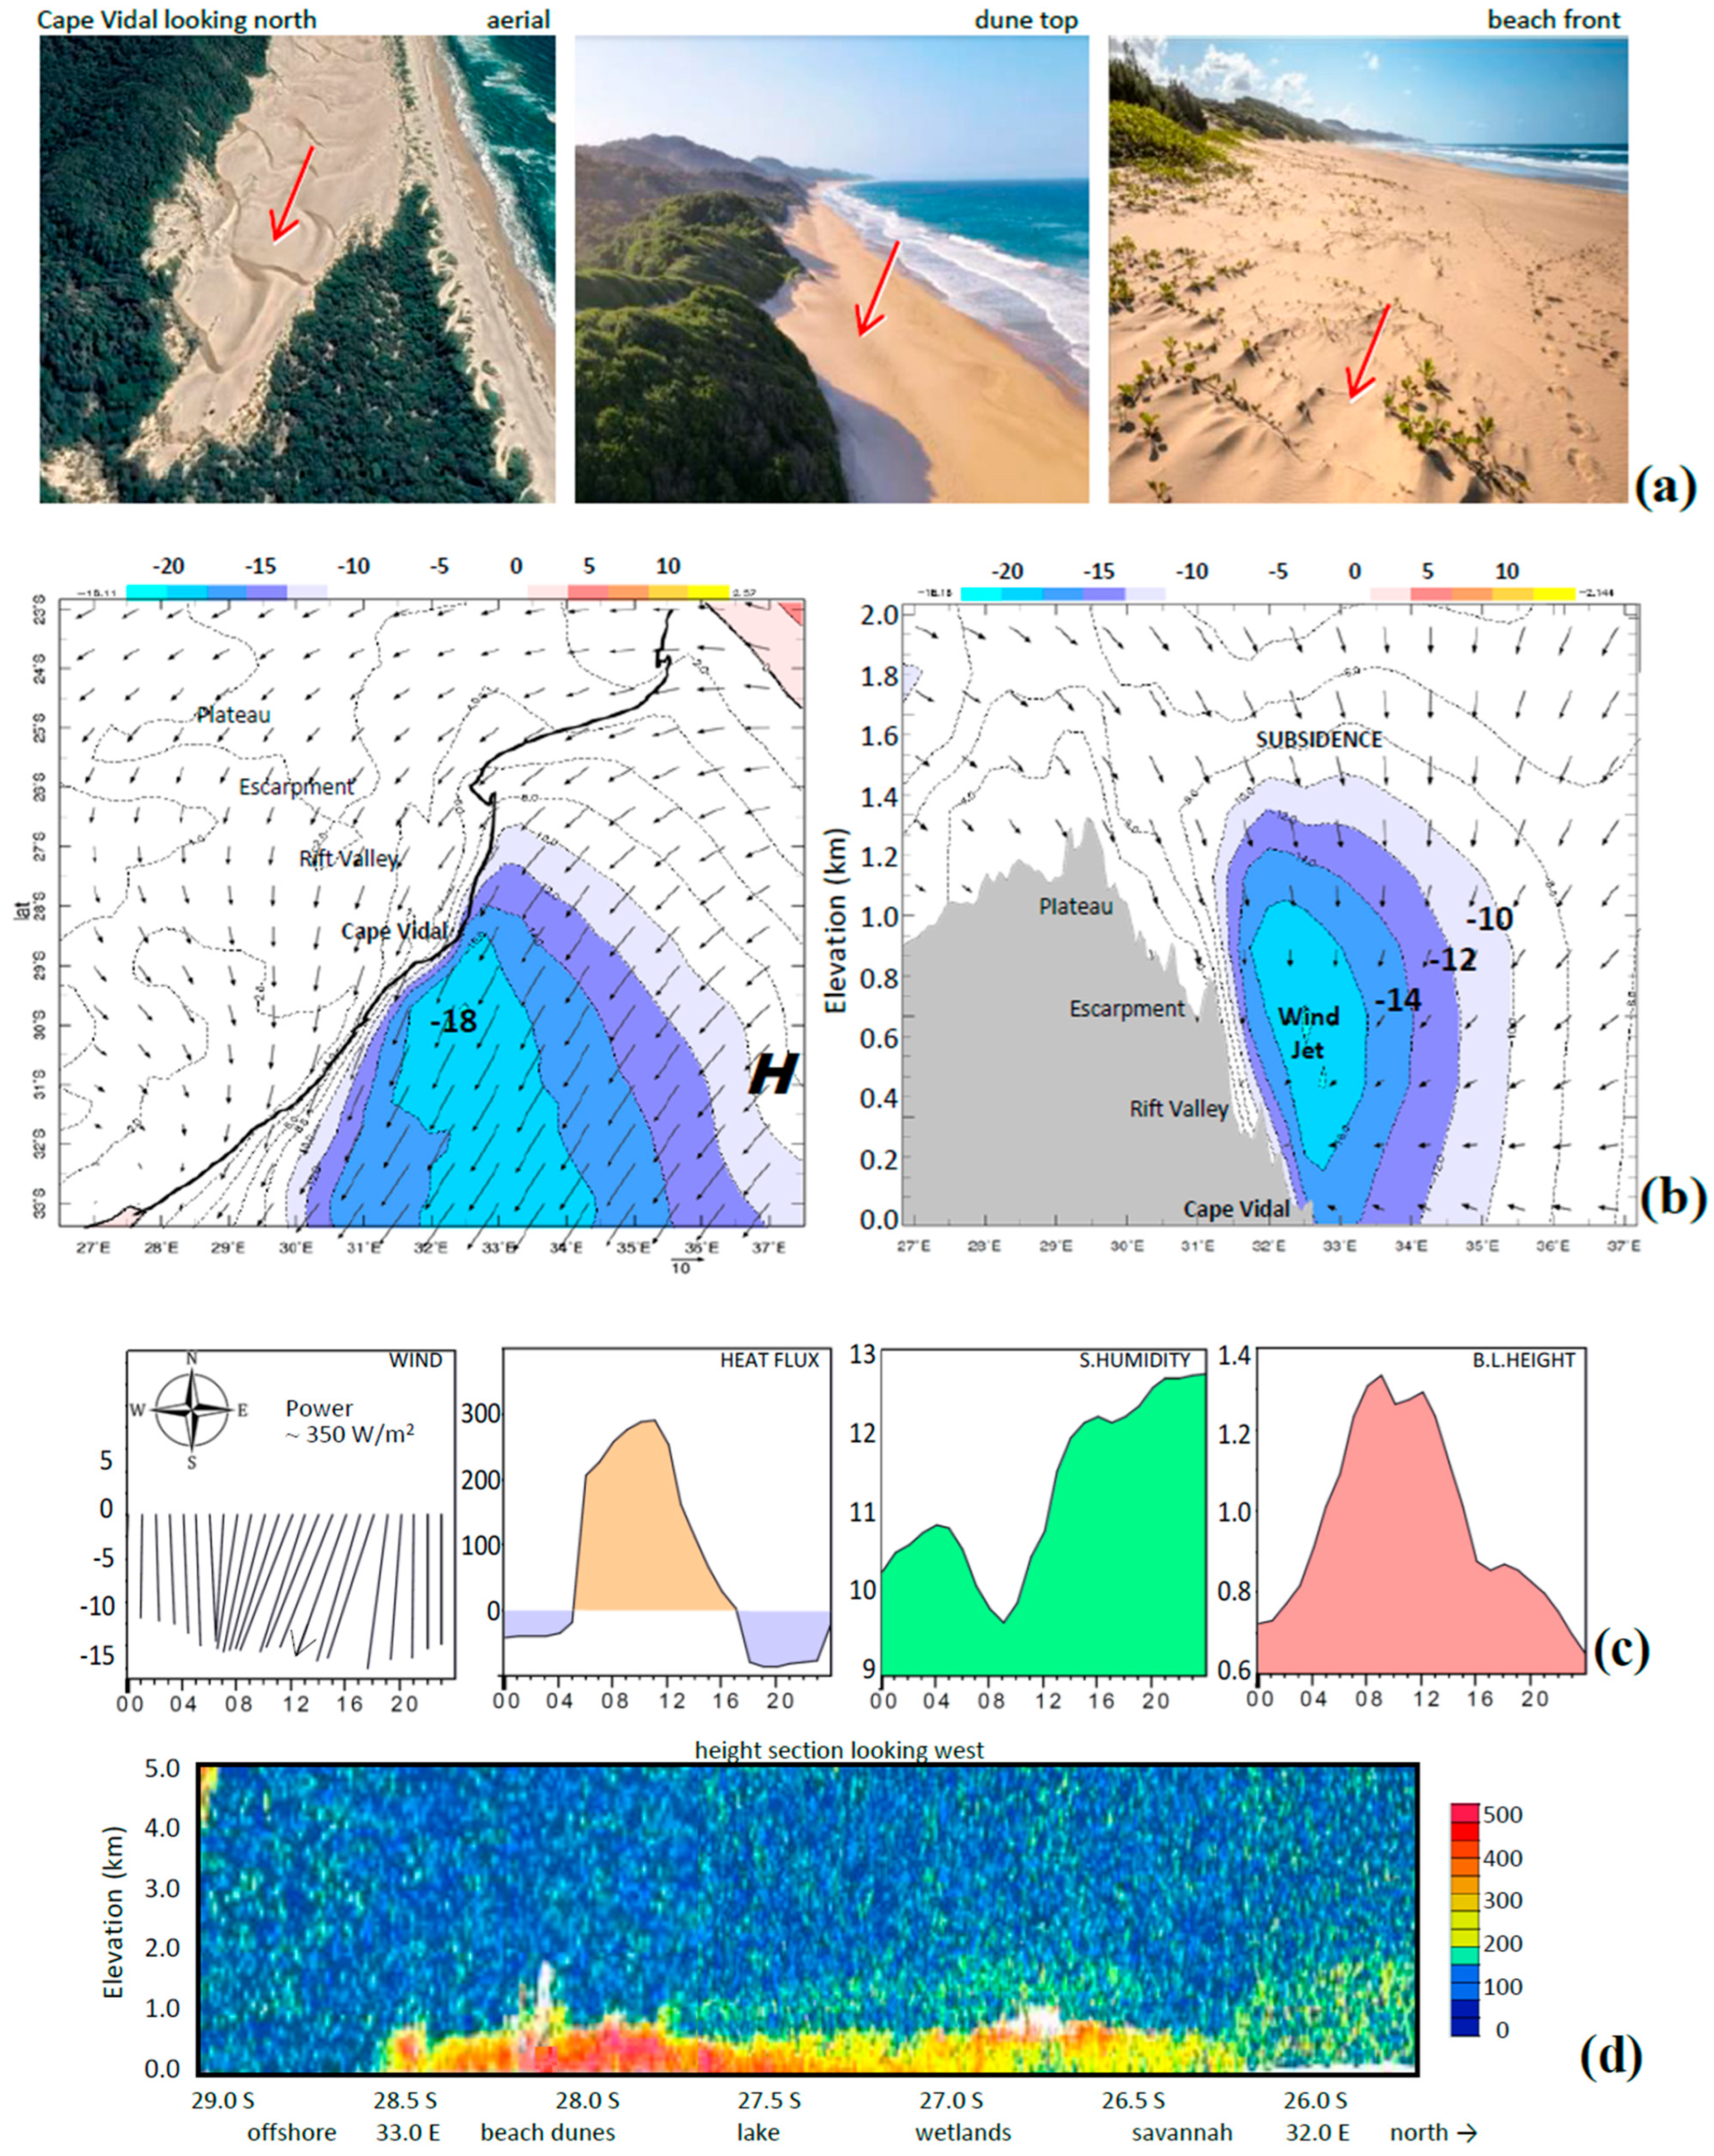
Case studies of extreme weather are reviewed. Aeolian transport emerges in photos of Cape Vidal beach during dry spells with northeasterly winds (Figure 9a). The wind map and section on 4 November 2018 (Figure 9b) reveal a coastal jet of 18 m/s on the perimeter of a marine anticyclone. Subsidence above the jet contributed to Venturi channeling of winds along the convex coast. Hourly time series (Figure 9c) reflect diurnal cycles: northerly winds increased by >10 m/s and turned shoreward as sensible heat flux and boundary layer height crested at midday. Vertical gusts during sensible heating >200 W/m2 increased air drag on the foredunes from 10:00 to 16:00 h, as specific humidity remained low (~11 g/kg). Wind power = ρ/2 (V1)3 = 350 W/m2 (ρ density, V speed at 1 m) was enhanced by low surface roughness around Lake St Lucia (Figure A2). A satellite lidar aerosol backscatter section is presented (Figure 9d) that illustrates a sandstorm over the coastal dunes and dust emissions further inland. Particulates were confined to a shallow atmospheric boundary layer (0–1 km) by anticyclonic subsidence.
A flood event in Jan–Feb 2025 is analyzed, when tropical sea temperatures were cool (La Nina). Rain gauges in the catchment recorded 550 mm over the two months. The time series of the daily Umfolozi river-flow and near-shore salinity are presented in Figure 10a. Discharge spikes ~500 m3/s coincided with salinity <35 ppt. The weather map of 19–20 Feb (Figure 10b) reveals ridging-high/cyclonic-low driving southeasterly 12 m/s winds and 3 m swells toward the coast. Cool air passing over the warm current gathered >200 W/m2 of turbulent latent and sensible heat, moistening the atmosphere and cooling the ocean. Widespread rains >30 mm/day occurred as winds lifted over the coastal plains. Viirs satellite red-band imagery (Figure 10c) reveals a muddy plume extending 5 km seaward from the Umfolozi river mouth that splits and loops back onto the coast. Reflectivity declines from 0.4 to 0.1 Sr−1 as the plume diffuses, suggesting a near-shore suspended sediment concentration of ~0.2 kg/m3 during flood events.

3.8. Contributions to Sediment Transport

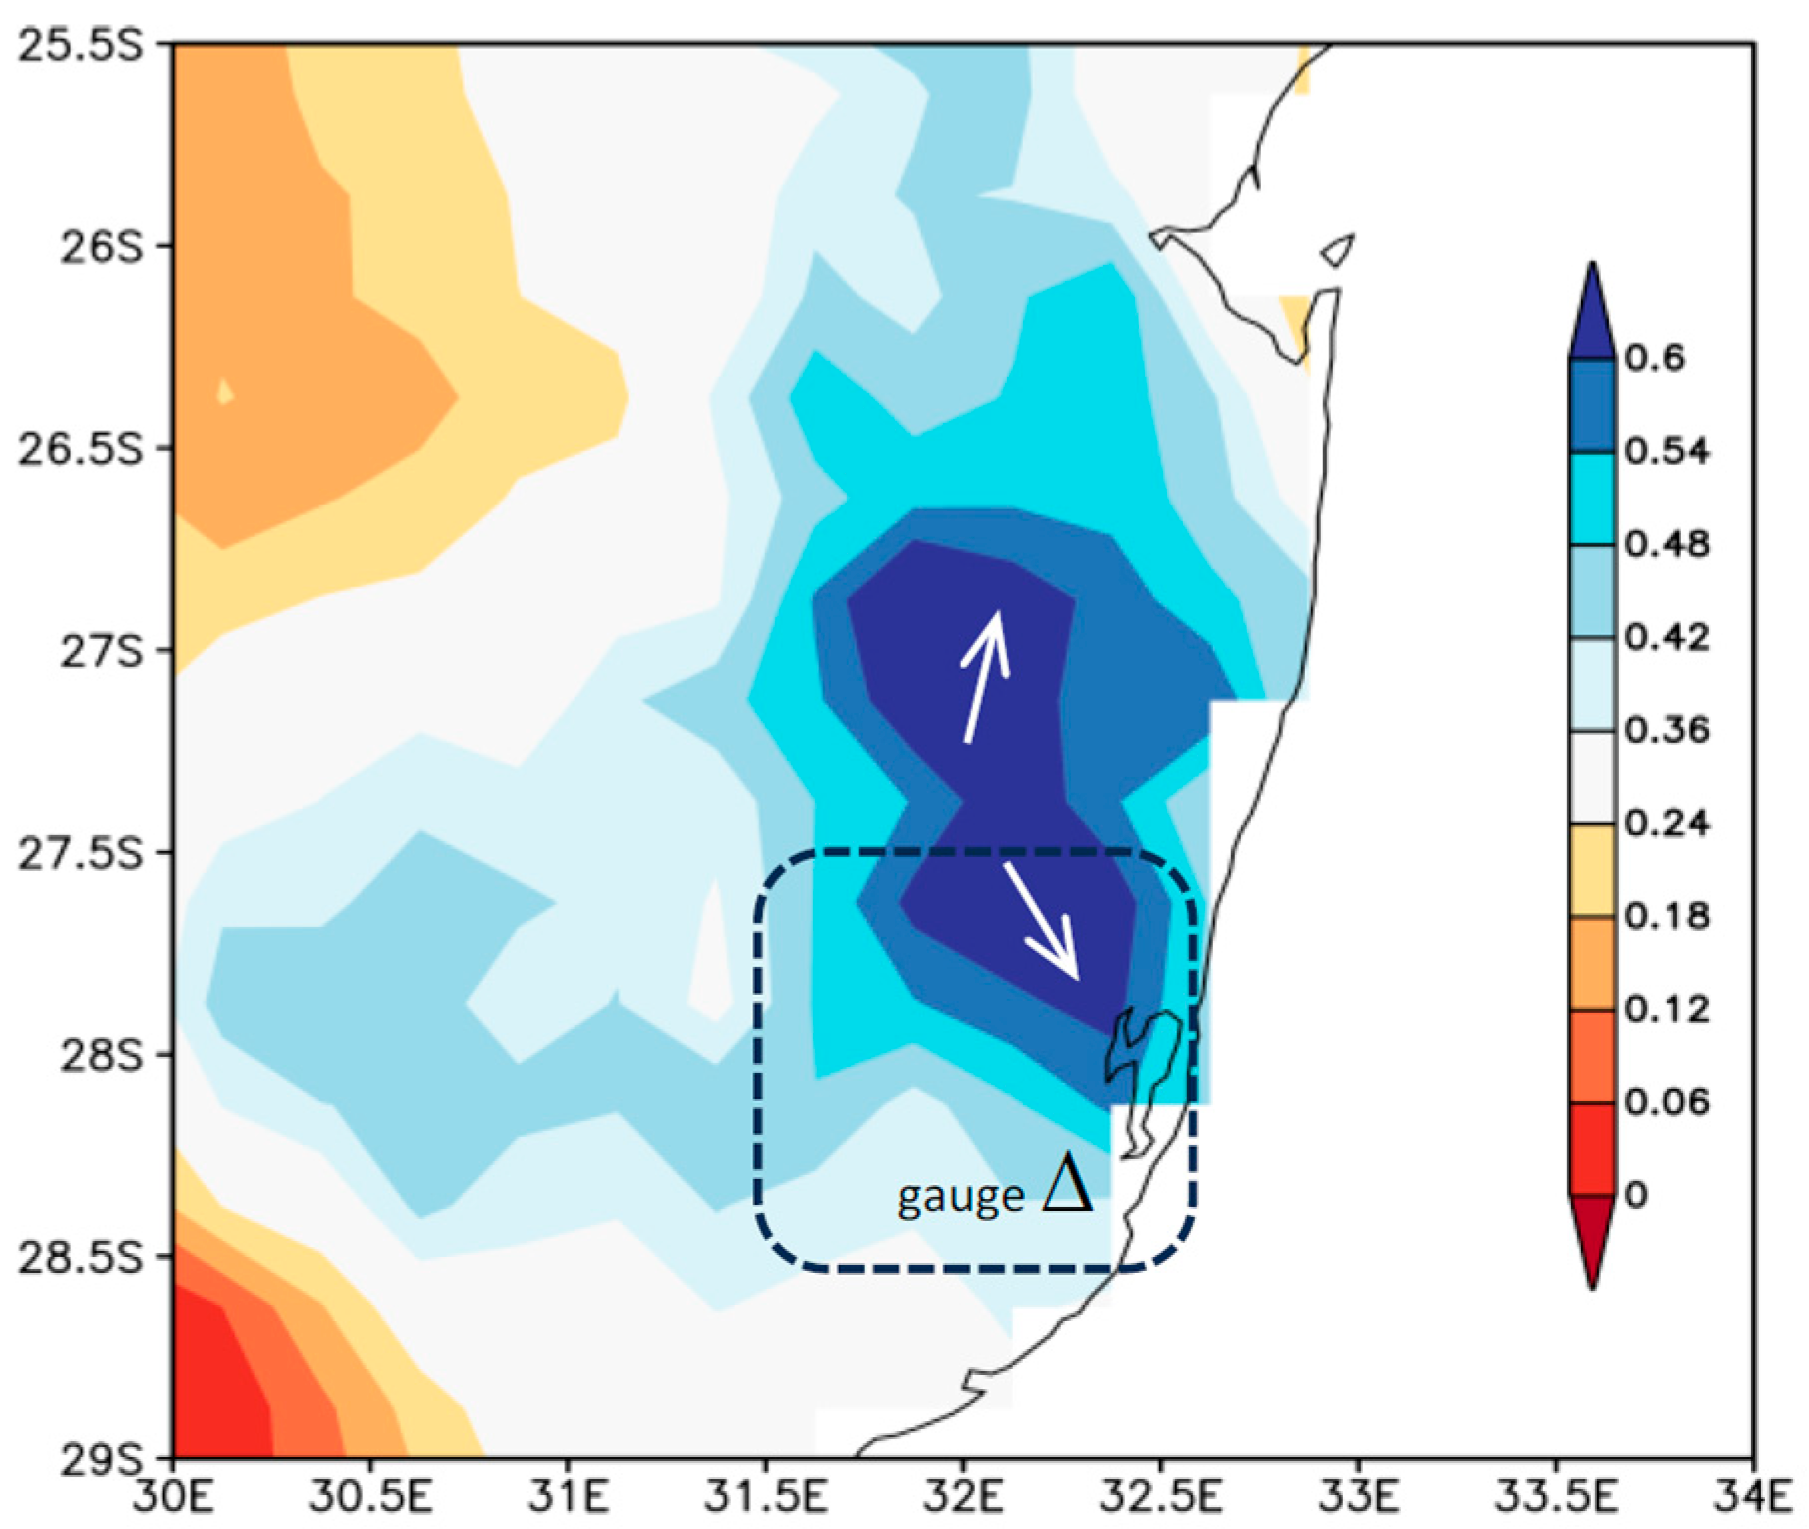
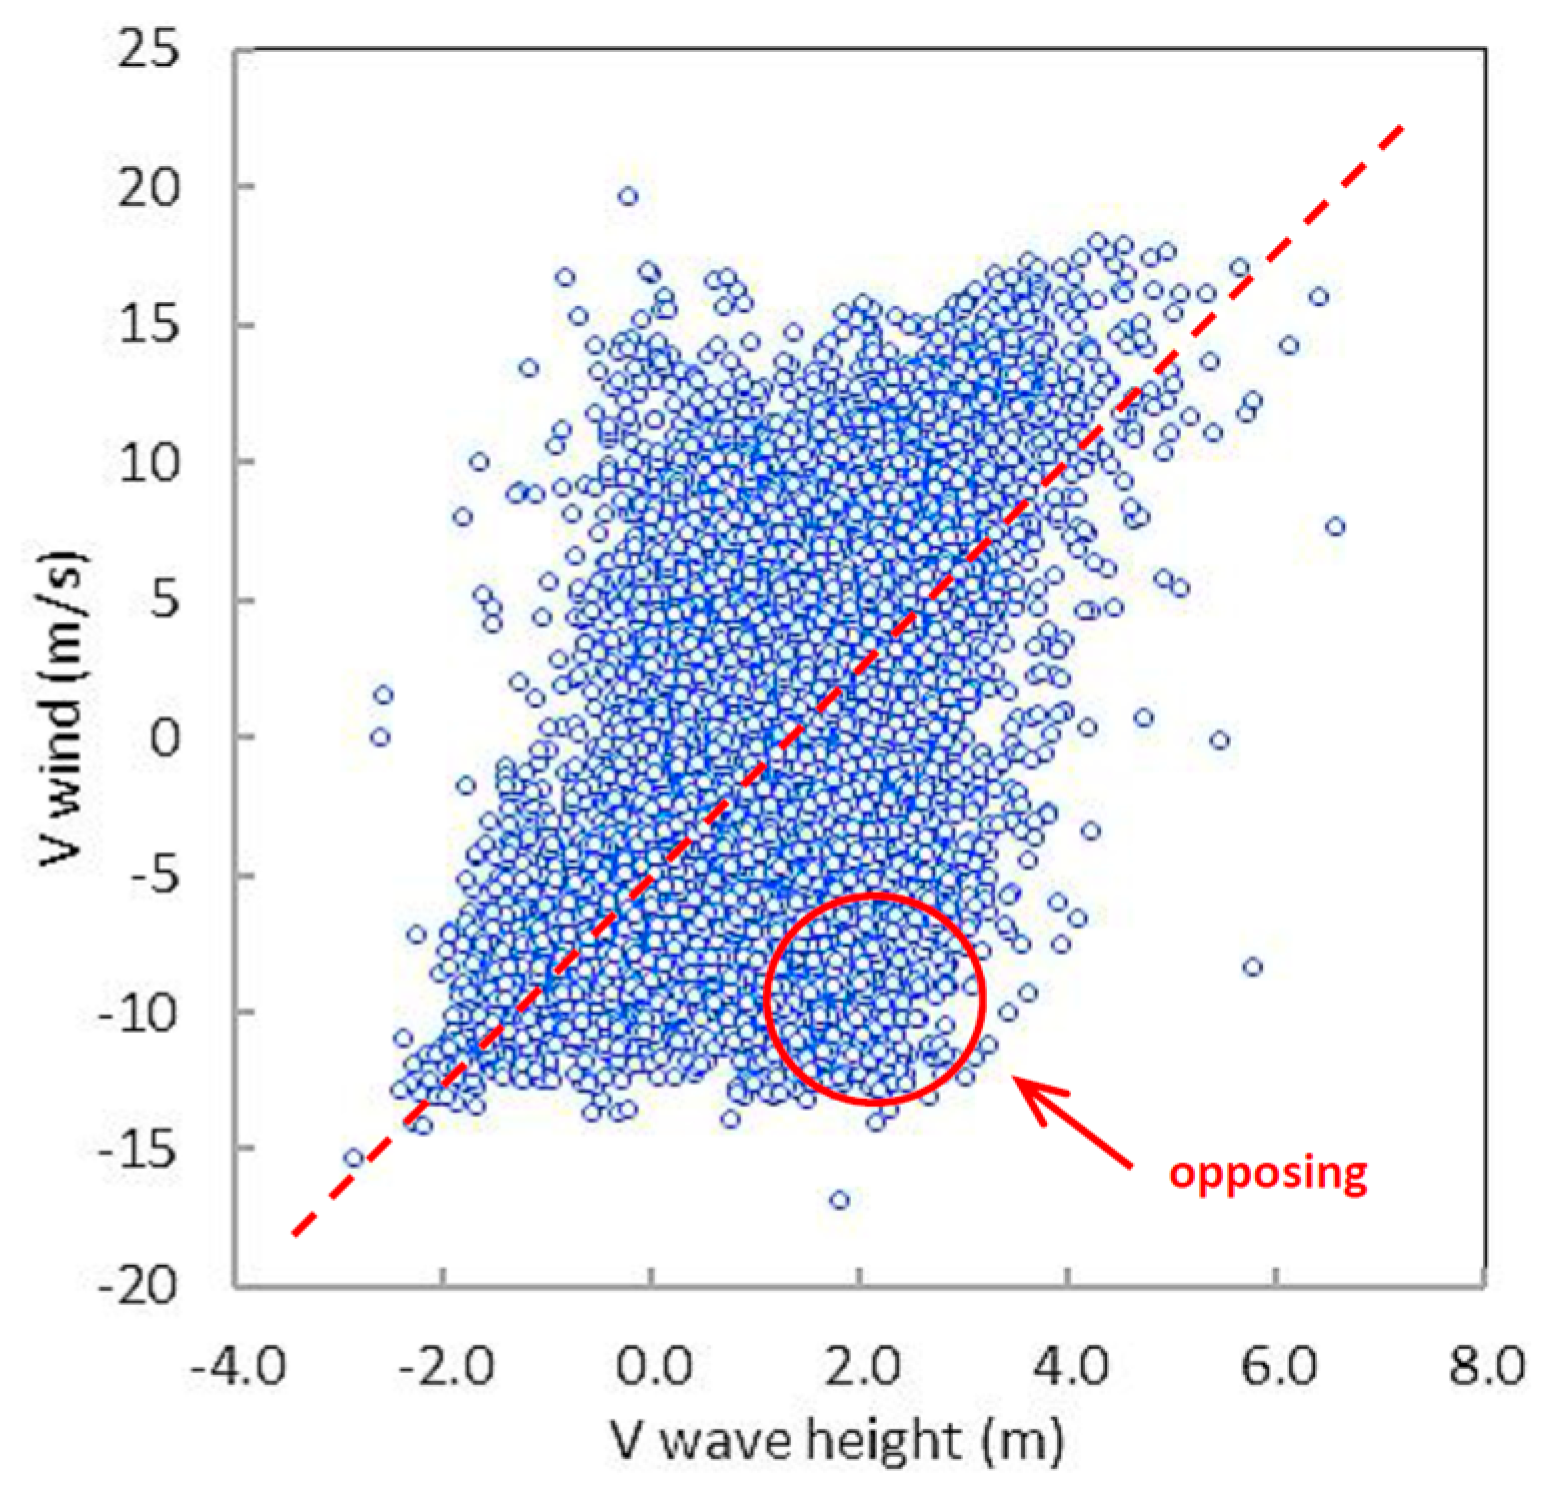
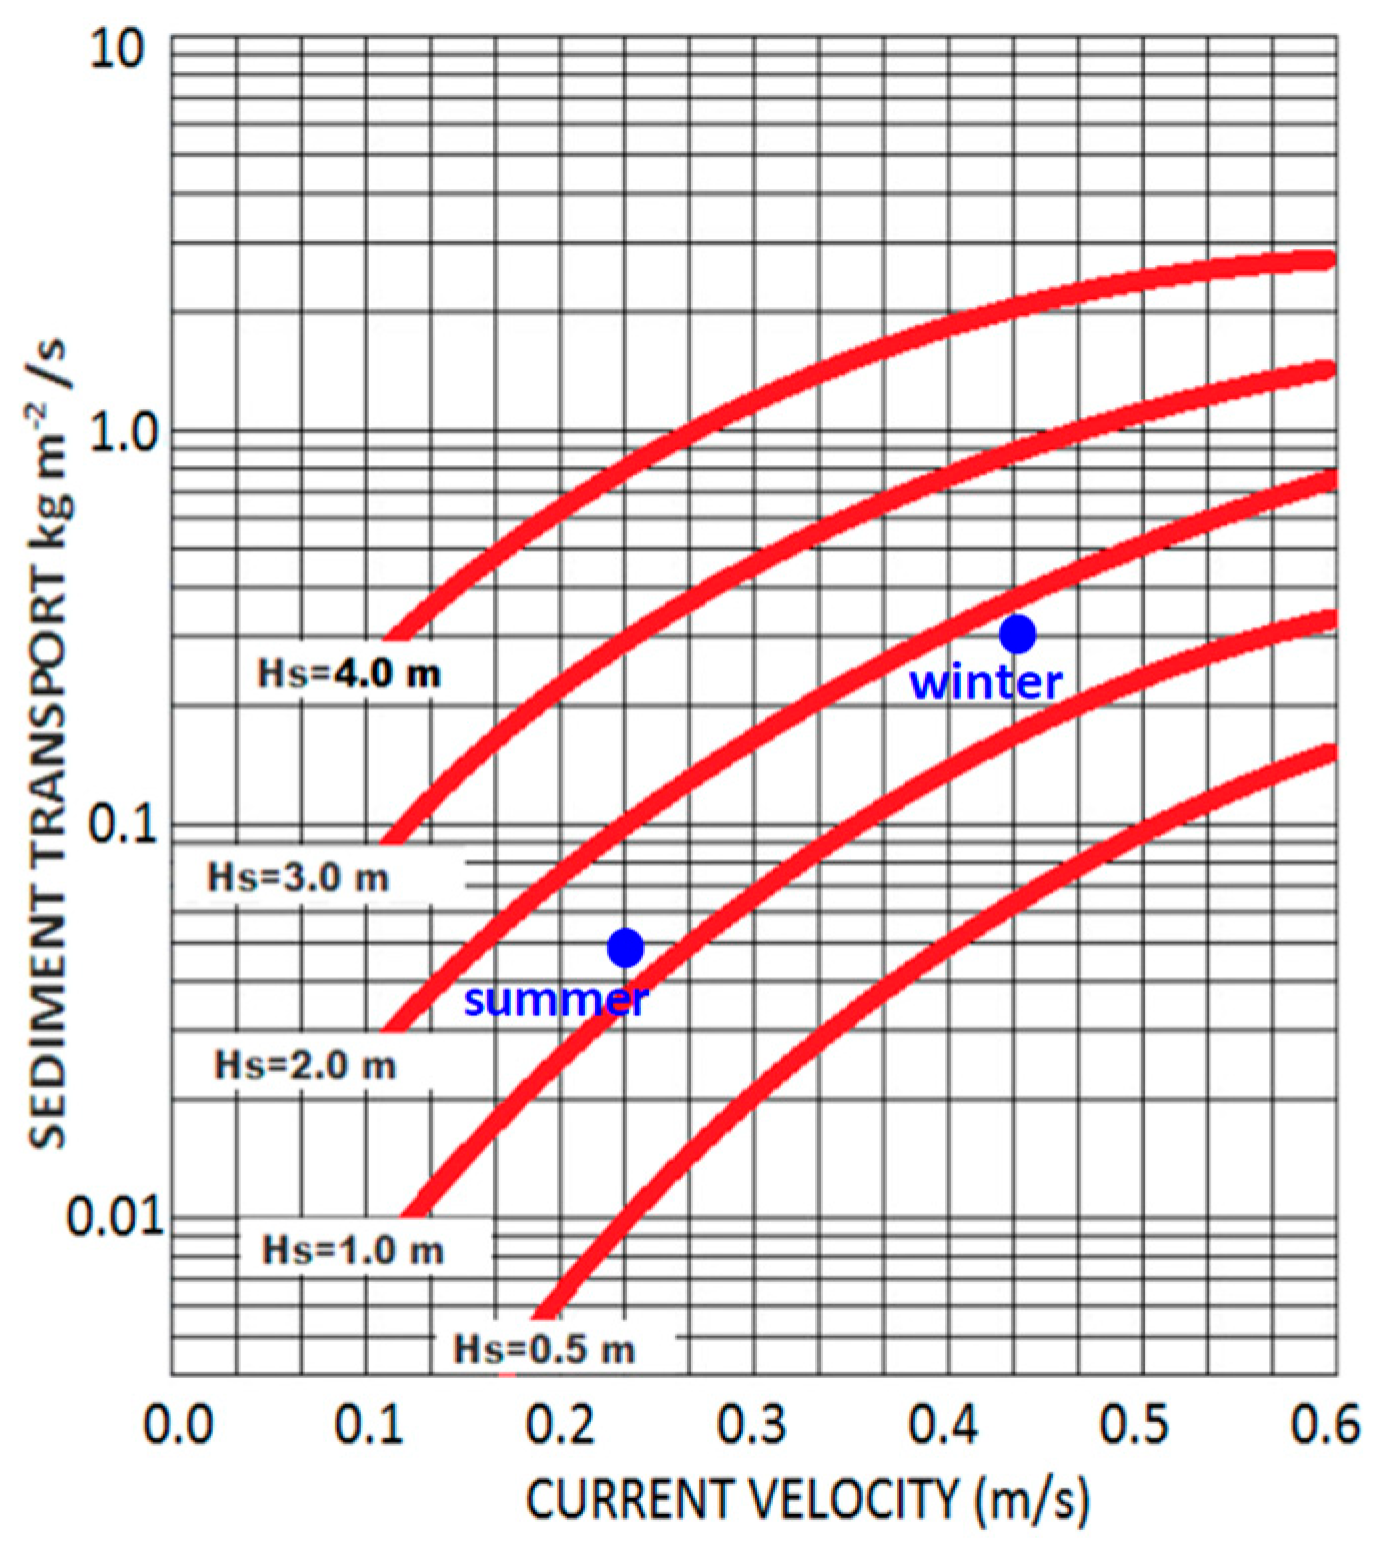
Persistent wave action from ±150° at ±1.6 m with ±7 s intervals generates wave energy, E = ∫ (H2 T sin ɵ) = 9 kW/m (H height, T period, ɵ refraction) [31], on this exposed coast, often with opposing winds (Figure A3). The surf-zone sediment transport is ST = ∫ V(C), the product of current and concentration [32,33]. Drifter speeds V ~ 0.4 m/s (cf. Figure 8b) are consistent with theory: V = 7 (s) (g H sin ɵ)0.5, for a near-shore slope of 2 × 10⁻² and a wave height with 30° refraction. Northward transport from Figure A4 (nomogram) with a surf-zone sediment concentration ±0.02 kg/m3 (Figure 11a) yields ~6 × 10⁵ kg/yr per meter of beach, replenishing the shallow log-spiral bays beyond Cape Vidal via wave action.
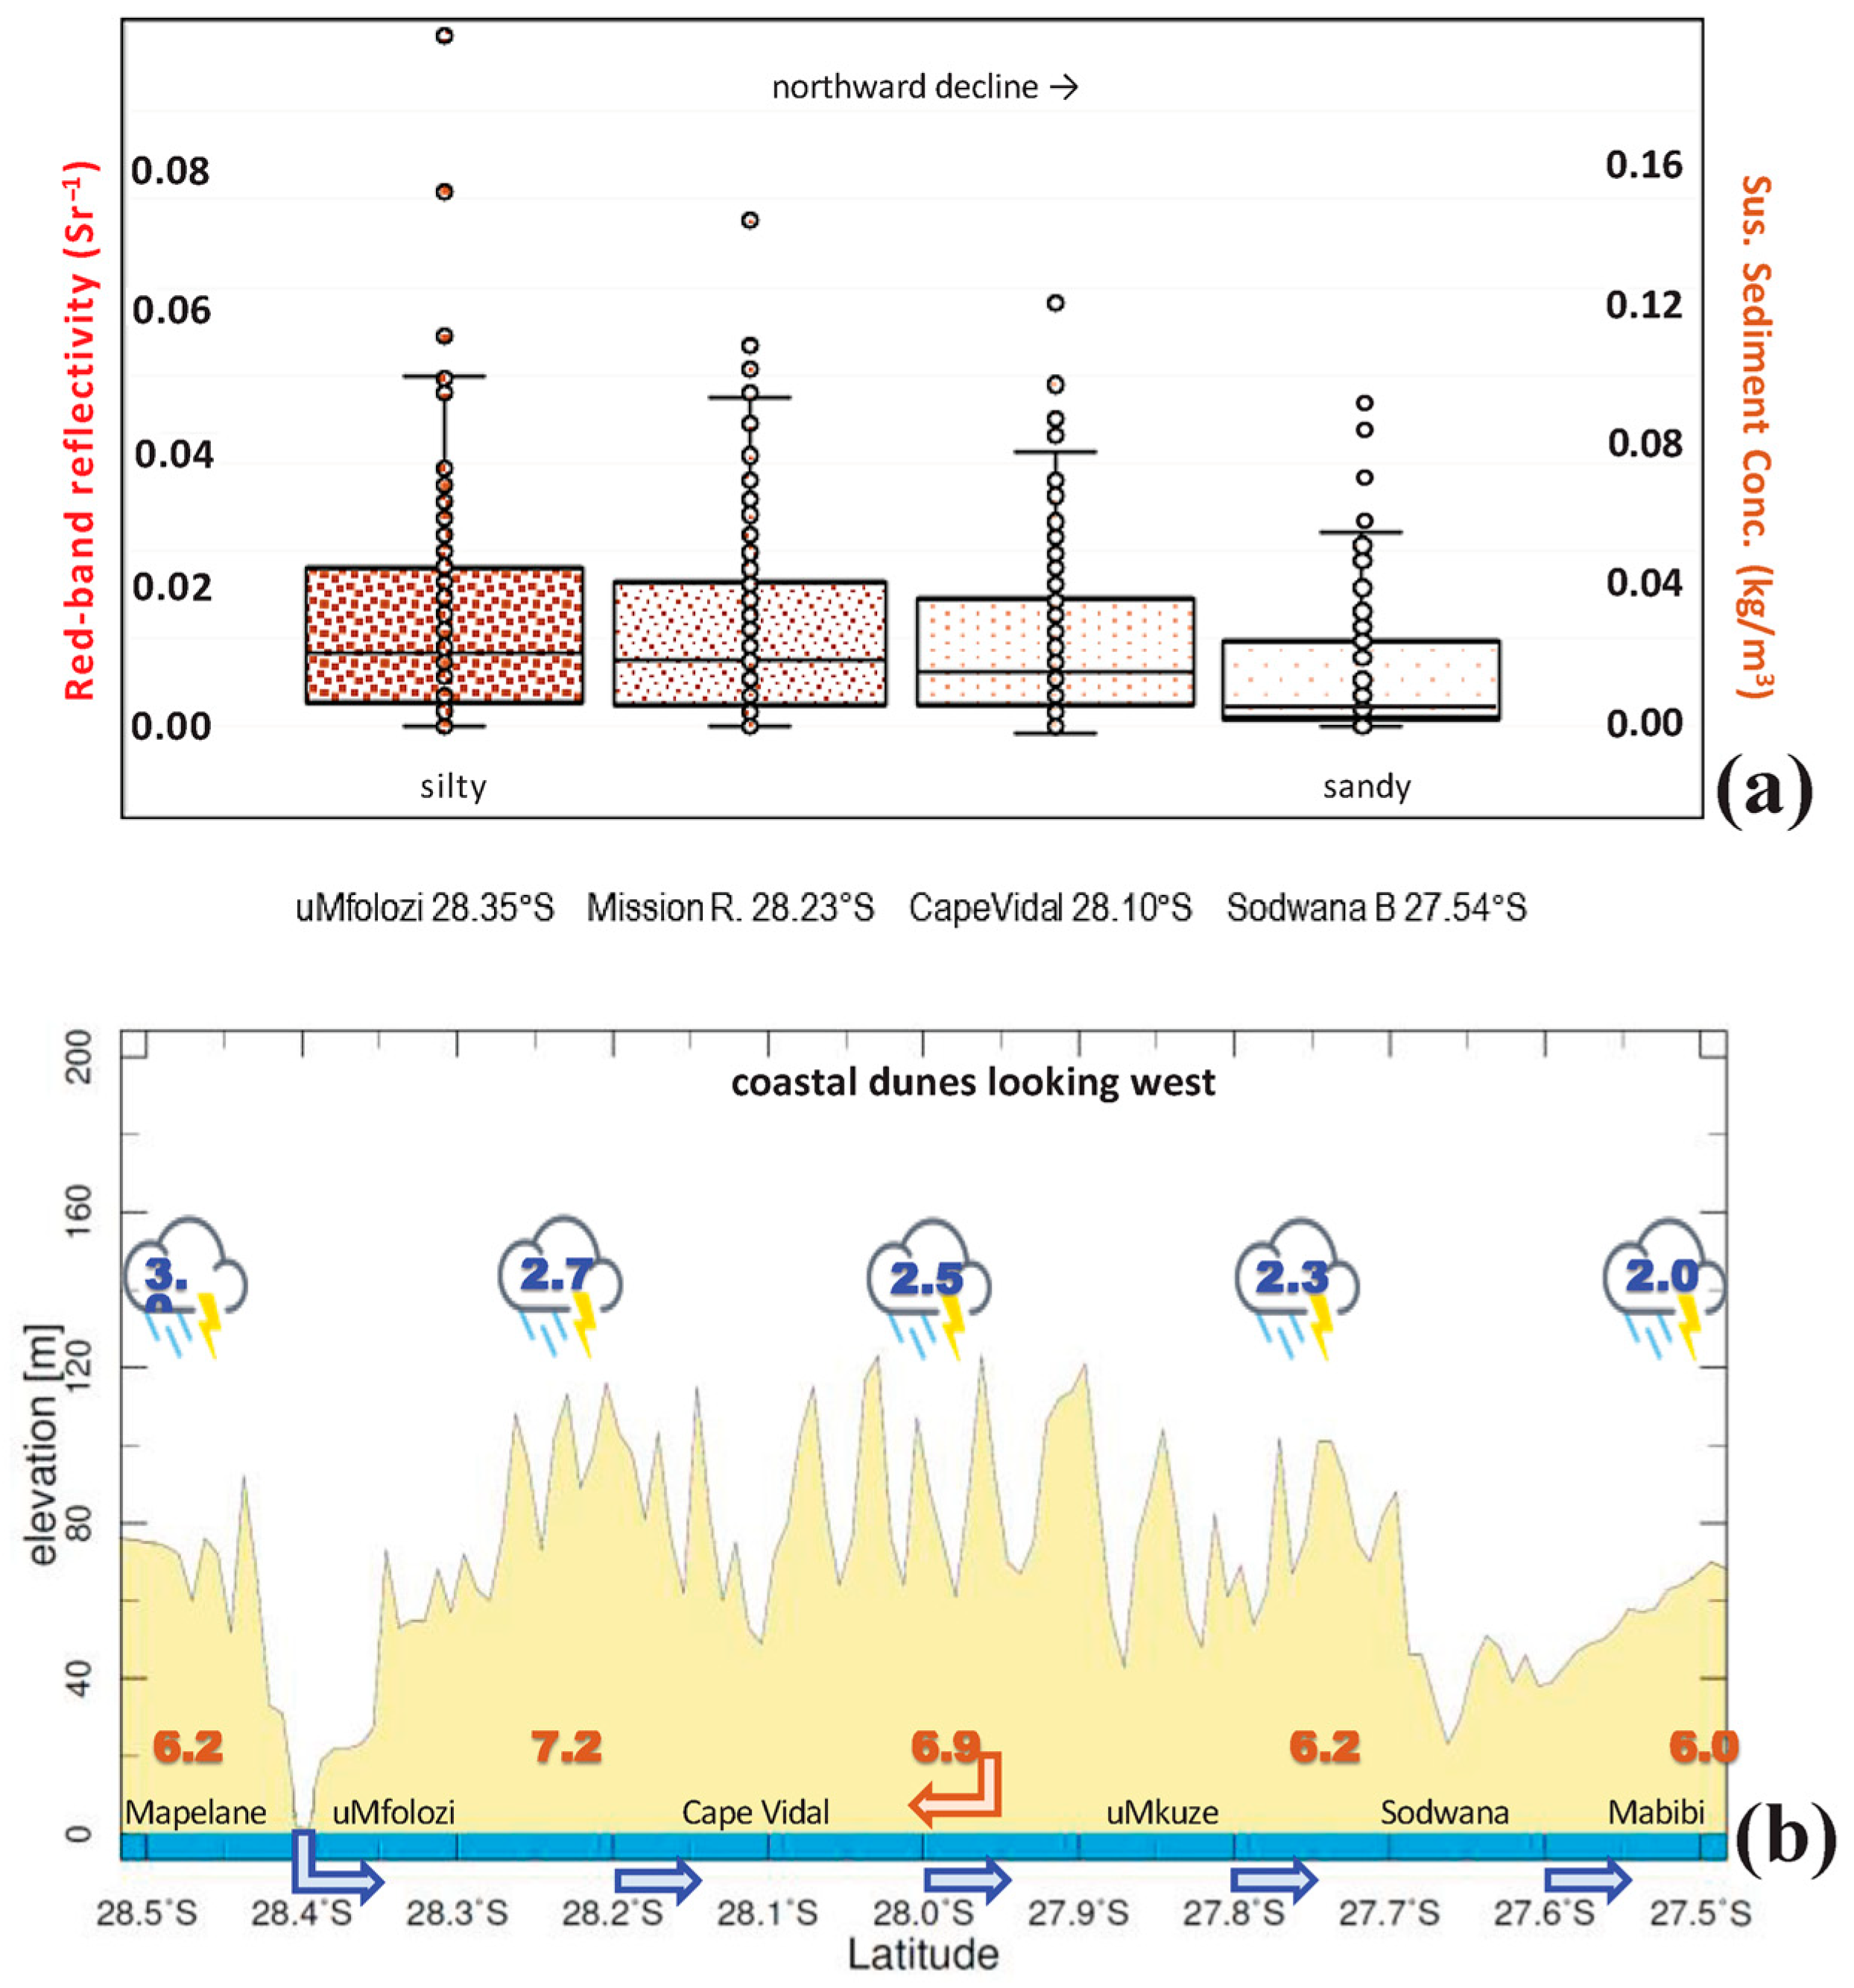
The tall dunes lining the coast (Figure 11b) have a total sand volume of ~109 m3. Although foredunes undergo aeolian transport, ~90% of back-dunes are covered by forests. Based on algorithms from [18] (Figure A5), histogram wind power exceedance of 14% (Figure A6), and sand grain sizes of 240–410 μm (cf. Figure 8d) with <1% moisture, the median aeolian transport along the upper beach exceeds 103 m3/yr/m. As summer rainfall dampens the process, sand encroachment is most likely in springtime (Aug–Oct) under dry anticyclonic weather (cf. Figure 4e and Figure 6c).
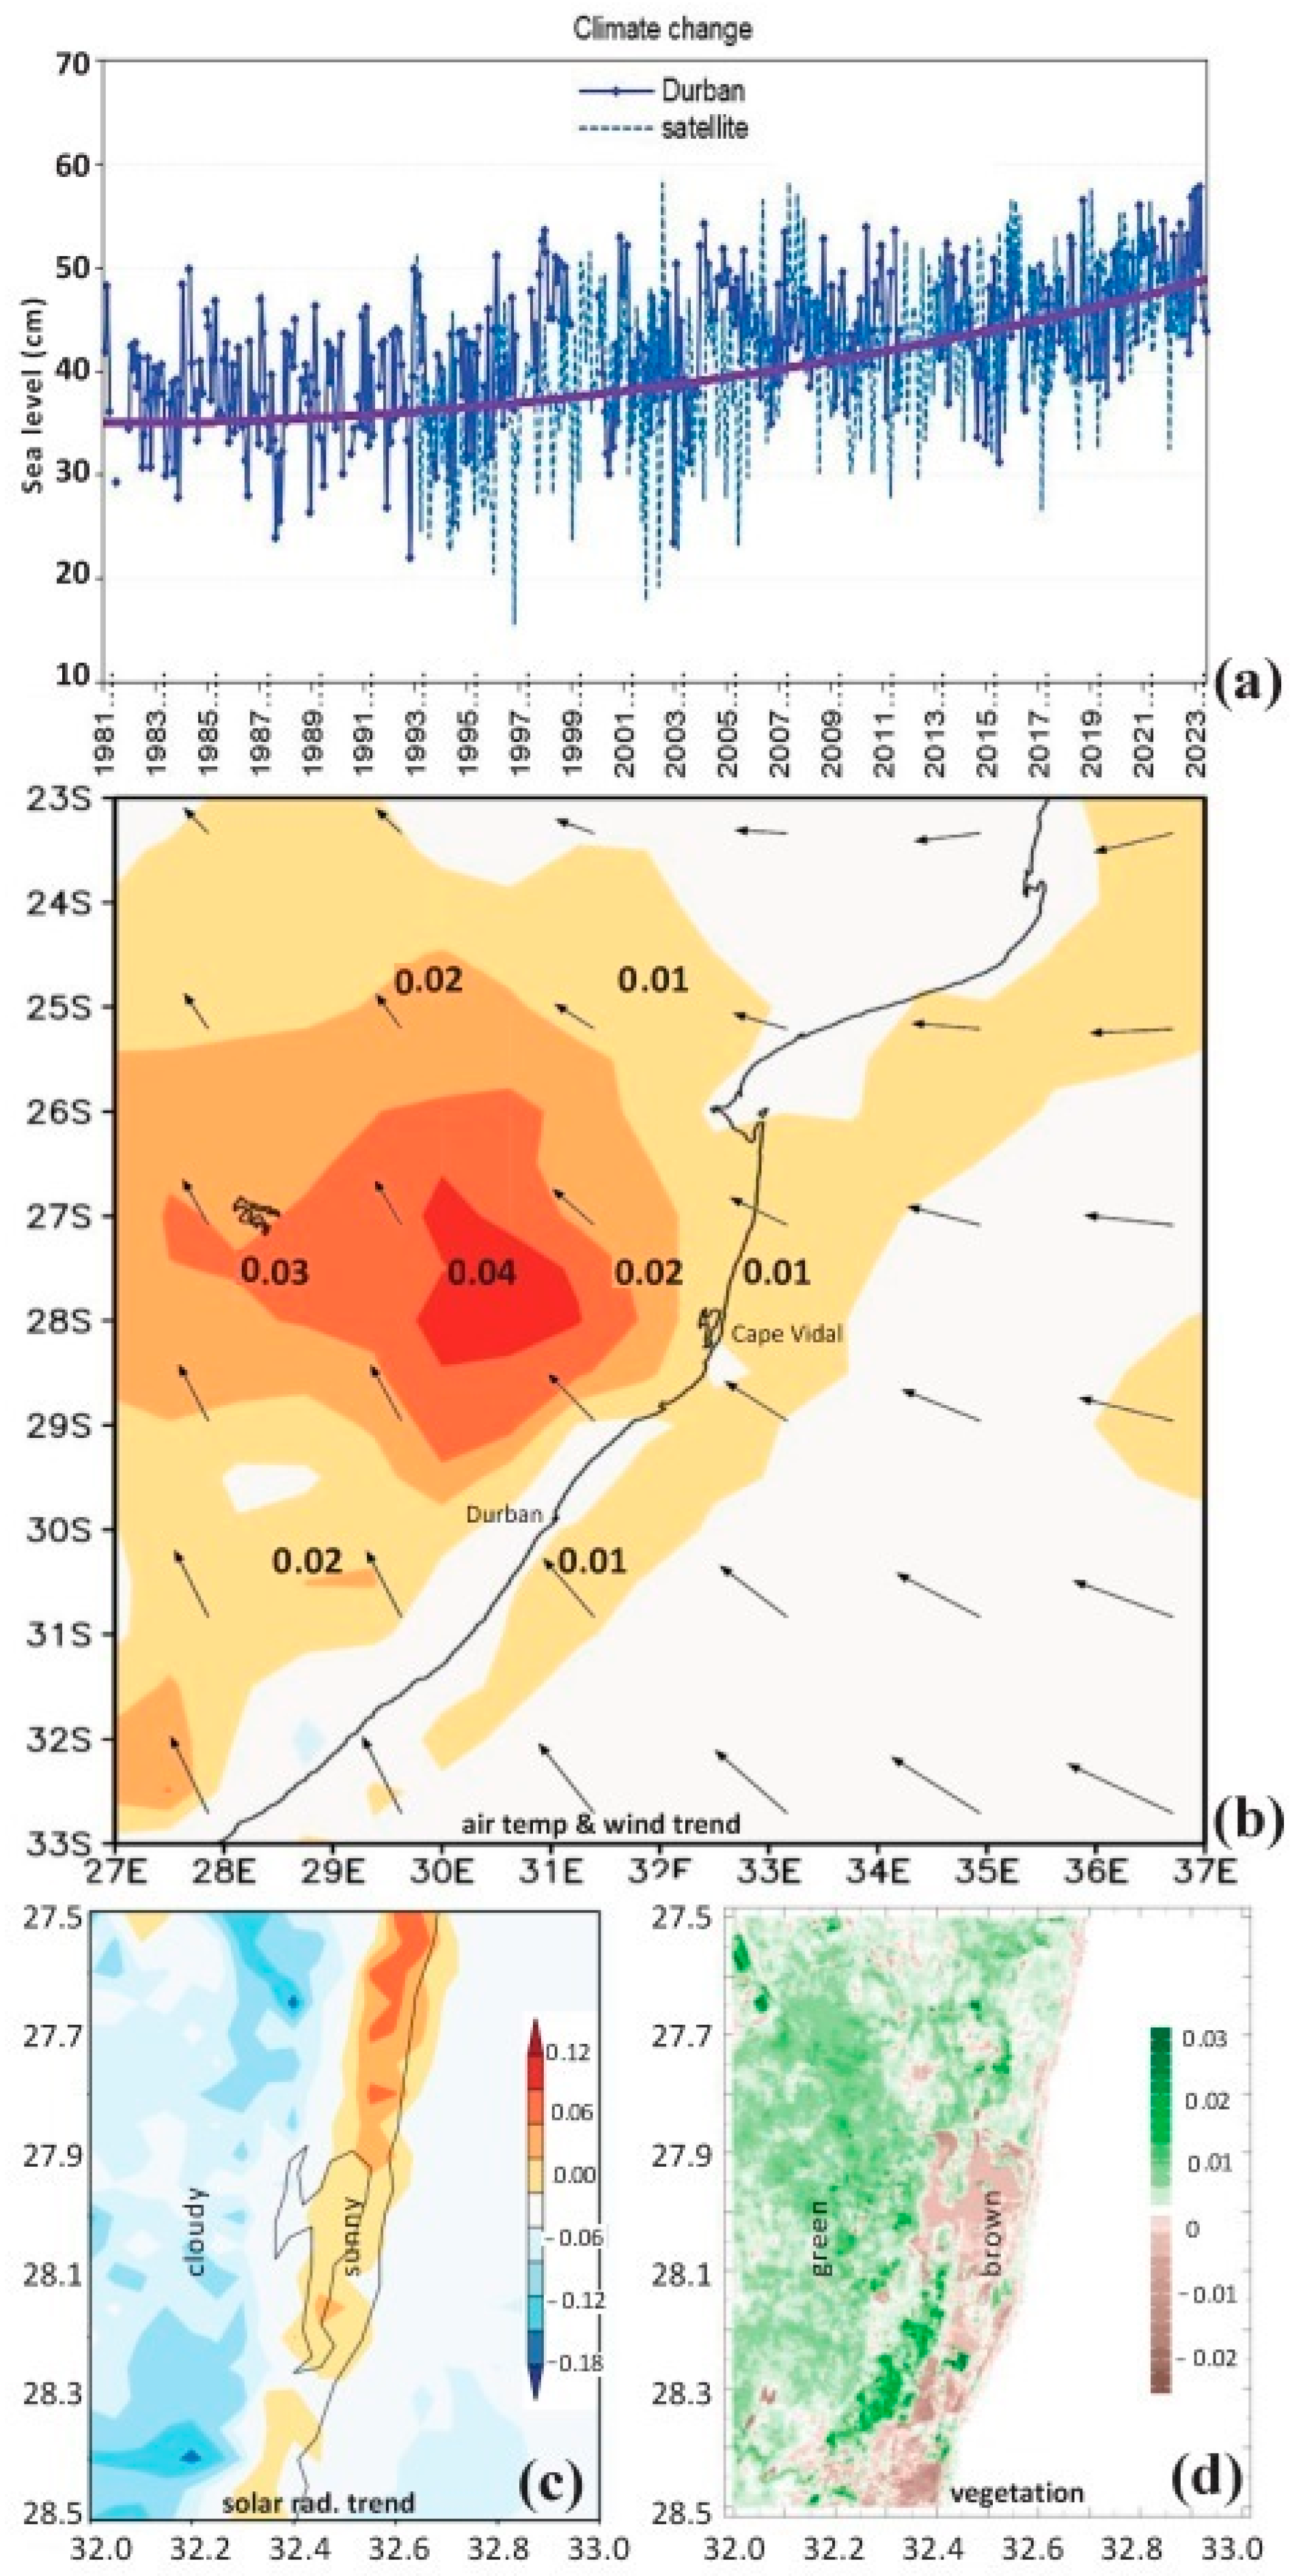
Although rising tides, a warming landscape (Figure 12a,b), and recreational activities could flatten the beachfront dunes, the depletion rate is low at −2.5 m3/yr/m (cf. Figure 7c) from the sweeping action of longshore winds and waves. Another contributor to sedimentation is the convergence of airflow into the back-dune forests. Hand-held surveys identified a sharp reduction in wind speed (−dV/dy= −10−2 s−1), which makes the tall dunes a sediment sink. As they accumulate beach sand and revegetate, growth occurs. The 1:20 slope promotes shedding from blow-outs, evident in aerial photos (Figure 8f and Figure 11b).

4. Concluding Discussion

The beaches near Cape Vidal experience a near-continuous supply of sediments induced by ~0.4 m/s northward surf-zone currents from 1.6 m refracted wind-waves, aided by aeolian transport from tall dunes. There is a 3-to-6-year cycle of summer runoff and winter storms associated with global ENSO. When tropical Pacific and Indian Ocean temperatures are cool, a trough forms over the Mozambique Channel (cf. Figure 4f and Figure 5d,e) bringing wet stormy weather, southerly swells and near-shore transport. Conversely when tropical sea temperatures are warm, subtropical anticyclones induce dry northeasterly winds and aeolian transport (cf. Figure 6c and Figure 9b).
Apart from locally specific outcomes, which highlight the value of red-band reflectivity to understand sediment sources and sinks, the case studies revealed a feature of universal importance. Surface heat, moisture, and momentum fluxes magnify air-land-sea interactions that generate rainfall, wind-waves, near-shore currents, and sand dunes. Numerical models incorporate those at grid-scale, but many processes here are micro-scale. A limitation of the research noted earlier is that V wind and wave indices focus on longshore transport and suggest that beaches are in equilibrium. However further work is needed to analyze cross-shore components and to find ways to replace shear velocity with turbulence in algorithms for sediment transport.
Although marine resources are under pressure, the beaches at Cape Vidal have proved to be resilient, retreating only a few meters over many decades due to public awareness, well-managed beach access [34], and windy weather. Cape Vidal is one of the busiest coastal parks in South Africa, but the human ‘footprint’ is overwhelmed by littoral and aeolian transport. Although tall, forested sand dunes line the coast, there is still a risk of climate change impacts with rising sea levels (+0.5 cm/yr, Figure 12a) and a warmer catchment (+0.03 C/yr) with more sea breezes (0.02 m s−1/yr, Figure 12b) that shift cloudy weather inland (Figure 12c,d). Although multi-year drought and flood sequences may become more intense, ENSO predictability from tropical sea temperatures enables adaptation to cyclical risk, so eco-tourism is better guided on this dynamic coast.

Funding

This research received no direct funding.

Data Availability Statement

Data are available as a spreadsheet by email request to the author.

Acknowledgments

UNESCO supported the initial phase of field work in Coasts and Small Islands, supported by Univ. Zululand Geography staff and students. Remote data were analyzed from NASA-giovanni, IRI-climate library, Climate Explorer-knmi, Univ. Hawaii-adprc, NOAA-ready-arl, Google-Earth, and SA Hydrology websites.

Conflicts of Interest

The author declares no conflict of interest.

Appendix A

Figure A1. Correlation of downstream river-flow with field of summer rainfall to delineate the catchment for landscape hydrology, N = 44.
Coasts 05 00025 g0a1
Figure A2. Surface roughness (m) from numerical weather model GIS, exhibiting low values over the sea and Lake St Lucia.
Coasts 05 00025 g0a2
Figure A3. Scatterplot of daily V wind and wave height near Cape Vidal, N = 10,226.
Coasts 05 00025 g0a3
Figure A4. Surf-zone sediment transport nomogram (adapted from [6]) with median values for summer and winter (blue dots).
Coasts 05 00025 g0a4
Figure A5. Aeolian transport nomogram (adapted from [18]).
Coasts 05 00025 g0a5
Figure A6. Cape Vidal wind power histogram at 1 m level, with threshold labelled.
Coasts 05 00025 g0a6

References

  1. Wright, L.D.; Short, A.D. Morphodynamic variability of surf-zones and beaches: A synthesis. Mar. Geol. 1984, 50, 93–118. [Google Scholar] [CrossRef]
  2. van Rijn, L.C. Prediction of dune erosion due to storms. Coast. Eng. 2009, 56, 441–457. [Google Scholar] [CrossRef]
  3. Smith, A.; Guastella, L.; Botes, Z.; Bundy, S.; Mather, A. Forecasting cyclic coastal erosion on a multi-annual to multi-decadal scale: Southeast African coast. Estuar. Coast. Shelf Sci. 2014, 150, 12010. [Google Scholar] [CrossRef]
  4. Carter, R.W.G.; Jennings, S.C.; Orford, J.D. Headland erosion by waves. J. Coast. Res. 1990, 6, 517–529. [Google Scholar]
  5. Silvester, R.; Hsu, J.R.C. Coastal Stabilization; Prentice Hall: Saddle River, NJ, USA, 1993; 578p. [Google Scholar]
  6. van Rijn, L.C. Unified view of sediment transport by currents and waves II: Suspended transport. J. Hydraul. Eng. 2007, 133, 668. [Google Scholar] [CrossRef]
  7. Humphries, M.S.; Kindness, A.; Ellery, W.N.; Hughes, J.C.; Bond, J.K.; Barnes, K.B. Vegetation influences on groundwater salinity and chemical heterogeneity in a freshwater recharge floodplain wetland in South Africa. J. Hydrol. 2011, 411, 130–139. [Google Scholar] [CrossRef]
  8. Grenfell, S.E.; Ellery, W.N. Hydrology, sediment transport dynamics and geomorphology of a variable flow river: The Mfolozi River South Africa. Water SA 2009, 35, 271–282. [Google Scholar] [CrossRef]
  9. Bjerner, M.; Johansson, J. Economic and Environmental Impacts of Nature-Based Tourism: A Case Study of Ponta do Ouro, Mozambique; Technical Report; Göteborg University: Gothenburg, Sweden, 2001. [Google Scholar]
  10. Tinley, K.L. Coastal Dunes of South Africa; National Scientific Programmes Unit (CSIR): New Delhi, India, 1985; Volume 109, p. 300. [Google Scholar]
  11. Carter, R.W.G. Coastal Environments: An Introduction to the Physical, Ecological and Cultural Systems of Coastlines; Academic Press: London, UK, 1988; 611p. [Google Scholar]
  12. Jury, M.R. Coastal climate and beach dynamics at Ponta do Ouro, Mozambique. Sci. Res. Essays 2015, 10, 1–13. [Google Scholar] [CrossRef]
  13. Kaliraj, S.; Chandrasekar, N.; Magesh, N.S. Impacts of wave energy and littoral currents on shoreline erosion/accretion along the south-west coast of Tamil Nadu. Environ. Earth Sci. 2013, 71, 4523–4542. [Google Scholar] [CrossRef]
  14. Lu, J.; Chen, X.; Tian, L.; Zhang, W. Numerical simulation-aided Modis capture of sediment transport for the Bohai Sea. Int. J. Remote Sens. 2014, 35, 4225–4238. [Google Scholar] [CrossRef]
  15. Ouillon, S.; Douillet, P.; Petrenko, A.; Neveux, J.; Dupouy, C.; Froidefond, J.-M.; Andréfouët, S.; Muñoz-Caravaca, A. Optical algorithms at satellite wavelengths for total suspended matter in tropical coastal waters. Sensors 2008, 8, 4165–4185. [Google Scholar] [CrossRef] [PubMed]
  16. Harrigan, S.; Zsoter, E.; Alfieri, L.; Prudhomme, C.; Salamon, P.; Wetterhall, F.; Barnard, C.; Cloke, H.; Pappenberger, F. Glofas-ERA5 operational global river discharge reanalysis 1979–present. Earth Syst. Sci. Data 2020, 12, 2043–2060. [Google Scholar] [CrossRef]
  17. Gelaro, R.; McCarty, W.; Suárez, M.J.; Todling, R.; Molod, A.; Takacs, L.; Randles, C.A.; Darmenov, A.; Bosilovich, M.G.; Reichle, R.; et al. The modern-era retrospective analysis for research and applications v2 (Merra2). J. Clim. 2017, 30, 5419–5454. [Google Scholar] [CrossRef] [PubMed]
  18. van Rijn, L.C.; Strypsteen, G. A fully predictive model for aeolian sand transport. Coast. Eng. 2020, 156, 103600. [Google Scholar] [CrossRef]
  19. Funk, C.; Peterson, P.; Landsfeld, M.; Pedreros, D.; Verdin, J.; Shukla, S.; Husak, G.; Rowland, J.; Harrison, L.; Hoell, A.; et al. The climate hazards infrared precipitation with stations, a new environmental record for monitoring extremes. Sci. Data 2015, 2, 150066. [Google Scholar] [CrossRef] [PubMed]
  20. Pinzon, J.E.; Tucker, C.J. A non-stationary 1981–2012 AVHRR NDVI time series. Remote Sens. 2014, 6, 6929–6960. [Google Scholar] [CrossRef]
  21. Chassignet, E.P.; Hurlburt, H.E.; Metzger, E.J.; Smedstad, O.M.; Cummings, J.A.; Halliwell, G.R.; Bleck, R.; Baraille, R.; Wallcraft, A.J.; Lozano, C.; et al. US GODAE: Global ocean prediction with the Hybrid coordinate ocean model (Hycom). Oceanography 2009, 22, 64–75. [Google Scholar] [CrossRef]
  22. Tolman, H.L. User manual and system documentation of Wavewatch3. In NCEP Technical Note; US Department of Commerce, NOAA, NWS, NCEP: Washington, DC, USA, 2002; 139p. [Google Scholar]
  23. Jury, M.R. Meteorological controls on big waves south of Africa. Reg. Stud. Mar. Sci. 2019, 27, 100538. [Google Scholar] [CrossRef]
  24. Lee, H.-T. Climate algorithm theoretical basis document: Outgoing longwave radiation (OLR). NOAA’s climate data record program. Tech. Rep. 2014, 111, 2804–2822. [Google Scholar]
  25. Copernicus Marine. Global Ocean Gridded Sea Surface Height L4 Product, European Union Data Store; Copernicus Marine: Toulouse, France, 2023. [Google Scholar] [CrossRef]
  26. Ezemvelo Wildlife. Annual Reports to KZN Provincial Government by the Conservation Service, Durban; Ezemvelo Wildlife: Pietermaritzburg, South Africa, 2019–2023; pp. 110–144. [Google Scholar]
  27. Govender, Y.; Jury, M.R. The local environmental gradient and species richness in a coastal nature reserve in Maputaland South Africa. S. Afr. Geogr. J. 2005, 87, 28–36. [Google Scholar] [CrossRef]
  28. Jury, M.R. Modulation of the marine environment in the Natal Bight. Remote Sens. 2023, 14, 3390. [Google Scholar] [CrossRef]
  29. Corbello, S.; Stretch, D.D. Decadal trends in beach morphology on the east coast of South Africa and likely causative factors. Nat. Hazards Earth Syst. Sci. 2012, 12, 2515–2527. [Google Scholar] [CrossRef]
  30. Psuty, N. Spatial variation in coastal foredune development. In Coastal Dunes: Geomorphology, Ecology and Management for Conservation; Carter, R.W.G., Curtis, T.G.F., Sheehy-Skeffington, M.J., Eds.; Balkema: Hague, The Netherlands, 1992; pp. 3–13. [Google Scholar]
  31. Miller, H.C. Field measurements of longshore sediment transport during storms. Coast. Eng. 1999, 36, 301–321. [Google Scholar] [CrossRef]
  32. van Wellen, E.; Chadwick, A.J.; Mason, T. A review and assessment of longshore sediment transport equations for coarse-grained beaches. Coast. Eng. 2000, 40, 243–275. [Google Scholar] [CrossRef]
  33. Esteves, L.S.; Williams, J.J.; Lisniowski, M.A. Measuring and modelling longshore sediment transport. Estuar. Coast. Shelf Sci. 2009, 83, 47–59. [Google Scholar] [CrossRef]
  34. Murray, J.; Adam, E.; Woodborne, S.; Miller, D.; Xulu, S.; Evans, M. Monitoring shoreline changes along the SW coast of South Africa from 1937 to 2020 using varied data approaches. Remote Sens. 2023, 15, 317. [Google Scholar] [CrossRef]
Figure 1. The study area. (a) Elevation and place names; blue arrows (catchment), inset wind rose (grey) and wave rose (color). Landsat color imagery of (b) Cape Vidal beach—during wave action in Apr 2024 (dashed beach profile) and (c) Umfolozi river mouth—during outflow in Sep 2022 (red dot). (d) Monthly record of gauged Umfolozi river-flow Δ and reanalysis (dashed). (e) Northward view of elevation profile on 28.1S with average: rainfall (cloud, mm/day), potential evaporation (sun, mm/day), marine evaporation (green, mm/day), wind speed (brown dashed contours, m/s), and V current (blue contours, m/s). Profiles in Figure 7c are dashed in (b).
Coasts 05 00025 g001
Figure 2. (a) Hovmöller plot of Modis near-shore red-band reflectivity (32.45–32.65° E) along the coast; the blue arrow on the left identifies the ‘near-shore zone’. (b) Southward aerial photo of Umfolozi mouth in April 2022. (c) Time series of near-shore red-band reflectivity at 28.1–28.4° S (cf. Figure 1a and Figure 7b) and its (d) mean annual cycle with upper and lower quintiles, and suspended sediment concentration estimated from the algorithms of [13,14]. (e) Seasonal average maps of red-band reflectivity (1997–2024) with dashed ‘near-shore zone’.
Coasts 05 00025 g002
Figure 3. Mean annual cycle of (a) catchment rainfall, (b) catchment vegetation index, (c) coastal V wave height, and (d) coastal mixed layer depth with +/− quintiles. Frequency histograms from daily time series of coastal (e) salinity, (f) V wind, (g) V wave height, and (h) V current, north of the Umfolozi river mouth, 1997–2024, N = 10,226.
Coasts 05 00025 g003
Figure 4. (a) Average sea surface temperature (shaded) and currents (vector, largest 1 m/s). (b) Time series of daily maximum catchment rainfall and 18-month filtered anomalies. Daily lag correlations between time series of rain >1 mm/day versus (c) river-flow and (d) V waves, N = 5846. (e) Daily time–space regression maps between catchment rainfall >1 mm/day and net OLR fields lead to lag of −2, 0, +2 days, left-to-right. (f) Seasonal time–space regression maps between summer rainfall and surface air pressure and wind fields, Jan–Mar, Apr–Jun, Jul–Sep, left-to-right, N = 44, R > |0.24|, achieve 95% confidence.
Coasts 05 00025 g004
Figure 5. (a) Time series of monthly catchment vegetation fraction and smoothed variability. (b) Lag correlations (left-to-right) of catchment rainfall vs river-flow, catchment rainfall vs. vegetation, and catchment vegetation vs. coastal red-band reflectivity. Seasonal time–space correlation maps between Jan–Mar vegetation and field of (c) Jan–Mar rainfall and wind, (d) Apr–Jun V wind (shaded) and wind (vectors), and (e) Jan–Mar tropical sea surface temperatures, N = 44, R > |0.24|, achieve 95% confidence.
Coasts 05 00025 g005
Figure 6. (a) Time series of daily wind power and filtered anomalies at Cape Vidal. (b) Mean annual cycle of wind power with +/− quintiles. Seasonal time–space correlation maps between Aug–Oct wind power and field of (c) surface air pressure and (d) tropical sea surface temperature, N = 44, R > |0.24|, achieve 95% confidence. Dashed line in (a) is threshold for aeolian transport.
Coasts 05 00025 g006
Figure 9. Case study of wind event: (a) northward photos of Cape Vidal (arrows = wind direction), (b) map and W–E height section on 28.1S of V wind (shaded) and vectors on 4 November 2018, Mascarene high and gale-force northeasterlies. (c) Hourly time series at Cape Vidal of (left-to-right) wind sticks (toward m/s), sensible heat flux (W/m2), specific humidity (g/kg), and boundary layer height (km) on 4 November 2018, time UTC =local +2. (d) Westward view of satellite lidar aerosol backscatter on 4 November 2018, as height section of wind-borne particulate concentration (µg/m3). Insets in (a) are daytime wind vectors representing 12 m/s airflow on the beach.
Coasts 05 00025 g009
Figure 10. Case study of flood event: (a) daily time series of Umfolozi river-flow (green) and coastal seawater salinity (blue) near the river mouth, with icons denoting V wave > 3 m. (b) Map of 19–20 February 2025 rainfall (shaded), low-level wind (vectors, largest 10 m/s), surface heat flux (red contour > 200 W/m2), pressure cell icons, and wave height and direction (open arrow). (c) Red-band reflectivity >0.1 Sr−1 on 18 January and 8 March 2025 near the Umfolozi river mouth.
Coasts 05 00025 g010
Figure 11. (a) Box-whisker plots of satellite red-band reflectivity northward from Umfolozi to Sodwana. (b) Westward elevation profile of coastal dunes with schematic transport potential, and labels for rainfall (cloud, mm/day), surface wind (brown, m/s), and surf-zone currents (blue arrows).
Coasts 05 00025 g011
Figure 12. Climate change in 1981–2024: (a) monthly time series of sea level with trend, (b) map of surface temperature (C/yr) and wind trend (largest vector 0.02 m s−1 /yr), (c) net solar radiation (W m−2/yr), and (d) vegetation color fraction/yr.
Coasts 05 00025 g012
Table 1. Datasets employed in the analysis; note that references are cited in text.
AcronymName and VariablesResolution
CHIRPS2Climate Hazards Group InfraRed Precipitation v2
Interpolated from gauge + satellite
25 km
monthly
ECEuropean Community
Hydrology reanalysis streamflow
25 km
daily
G. EARTHGoogle Earth digital archiveLocale
~monthly
IN-SITUField surveys at Mabibi
Sand sampling, surf-zone drifters, biodiversity
Point
bi-annual
HYCOM3Hybrid coupled ocean model v3
Sea temp, current, salinity, mixed layer depth
10 km
daily
MERRA2NASA Meteorology reanalysis v2
Wind, air temp, pressure, humidity, evaporation
50 km
daily
MODISModerate Imaging Sensor (satellite)
Land and ocean color: visible reflectivity
1 km
monthly
NOAANational Oceanic & Atmospheric Admin.
Satellite sea temp, net outgoing IR radiation
25 km
weekly
SA HYDROSouth African Hydrology Dept
Gauged streamflow (Umfolozi)
Point
daily
TIDEGauged sea level (Durban)
Satellite altimetry reanalysis
Point
monthly
VIIRSVisible Infrared Imaging Radiometer Suite
satellite ocean color: red-band reflectivity
1 km
daily, monthly
W3Wavewatch ocean reanalysis v3
wave height, period, direction
25 km
daily
Disclaimer/Publisher’s Note: The statements, opinions and data contained in all publications are solely those of the individual author(s) and contributor(s) and not of MDPI and/or the editor(s). MDPI and/or the editor(s) disclaim responsibility for any injury to people or property resulting from any ideas, methods, instructions or products referred to in the content.