Revetment Rock Armour Stability Under Depth-Limited Breaking Waves


Abstract
1. Introduction
1.1. Background
1.2. Thesis
2. Method
2.1. Data
2.2. Physical Modelling
2.2.1. Water Research Laboratory
2.2.2. Delft Hydraulics
3. Results
4. Discussion
4.1. Comparison with Established Formulae
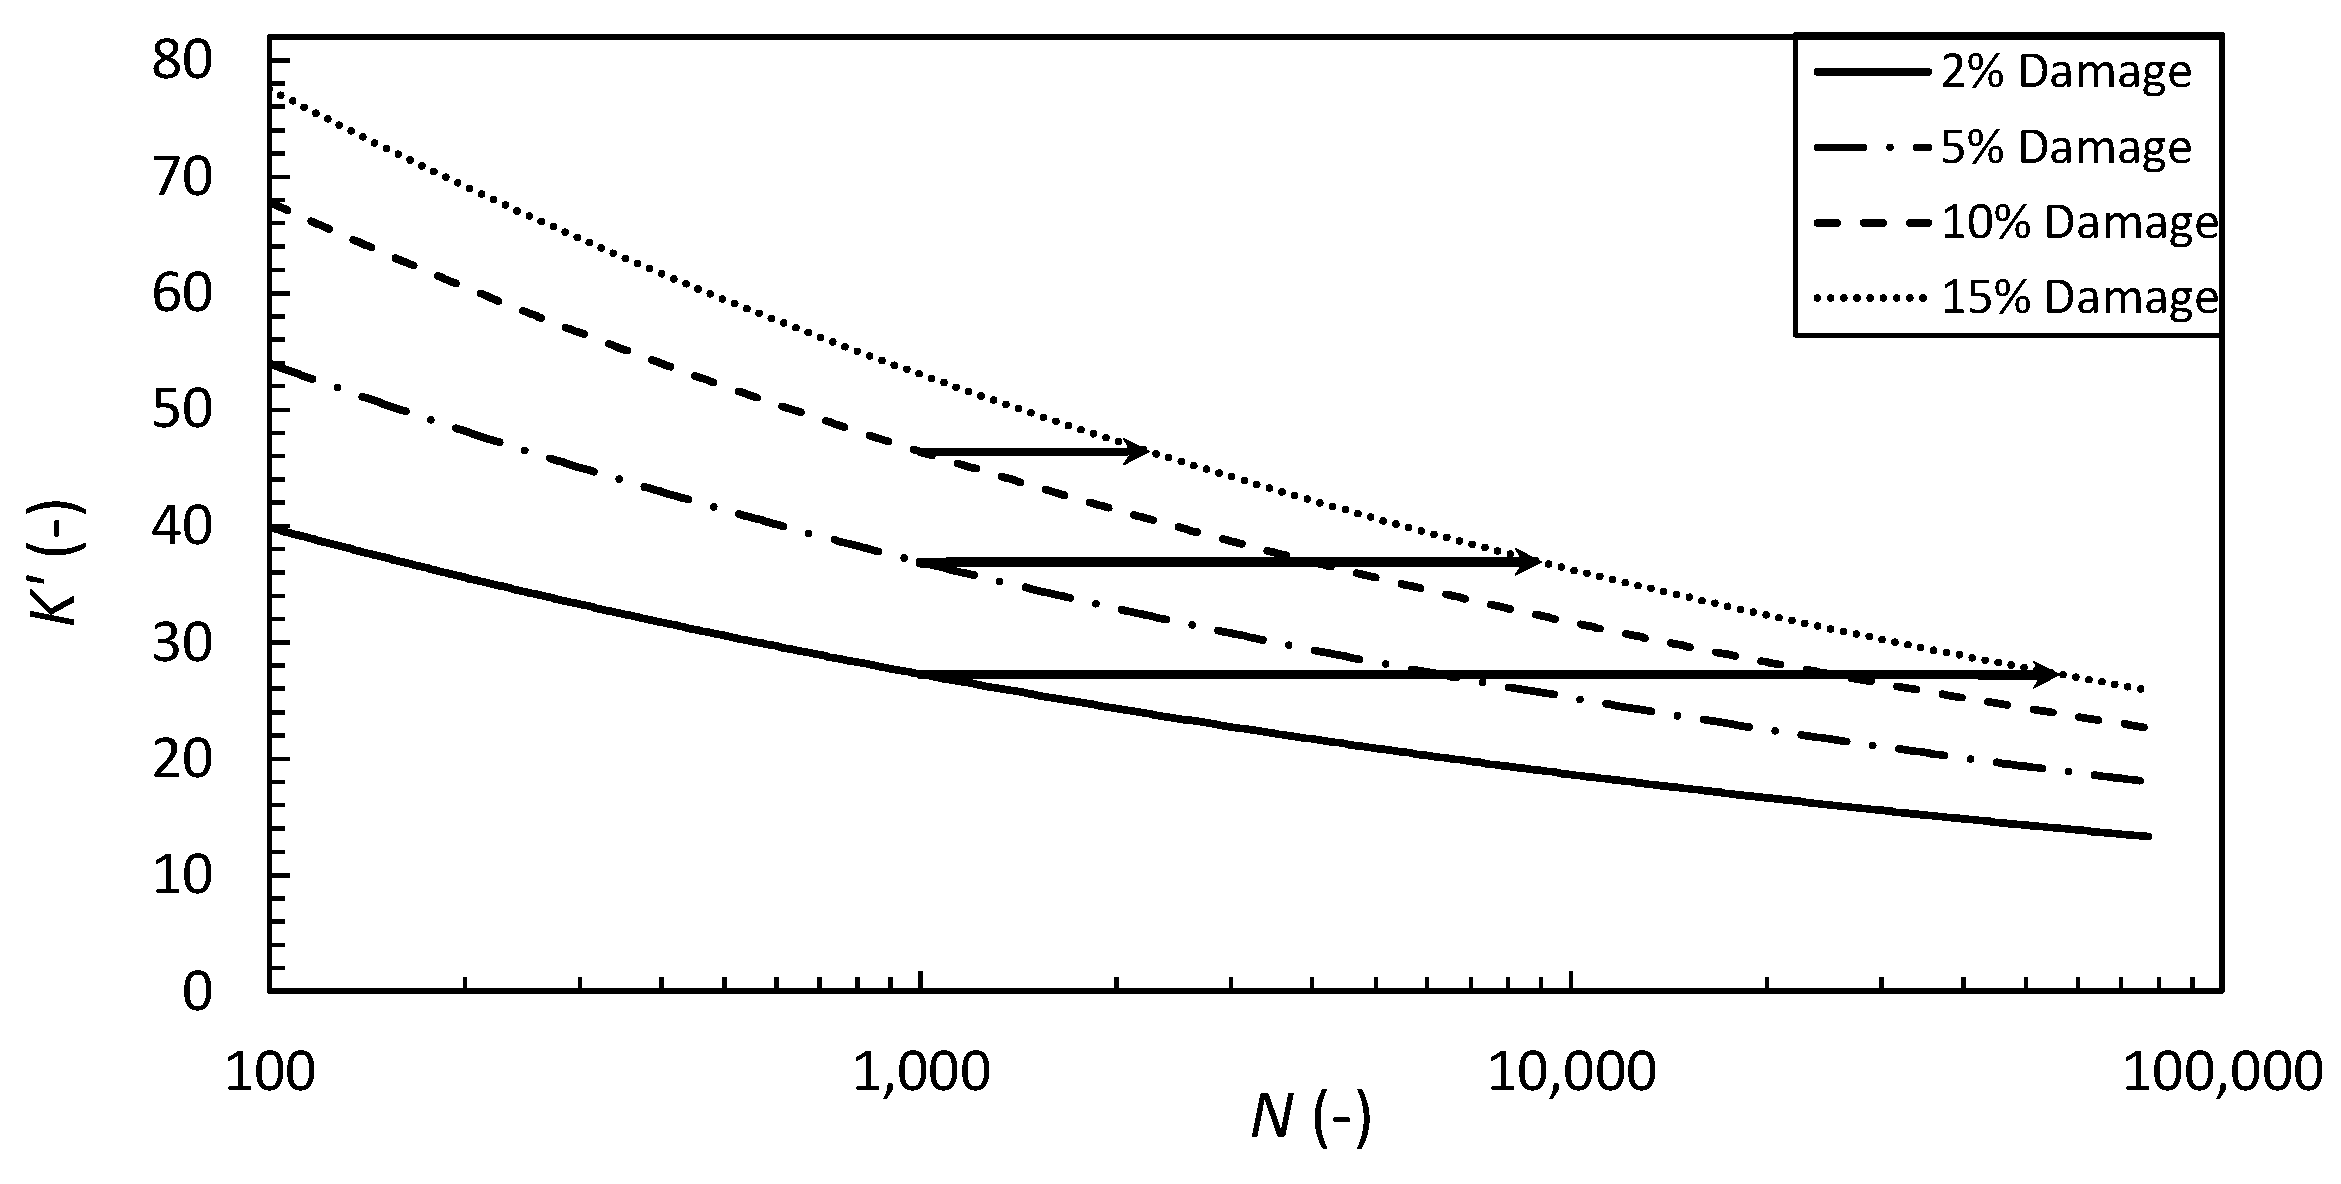
4.2. Storm Duration
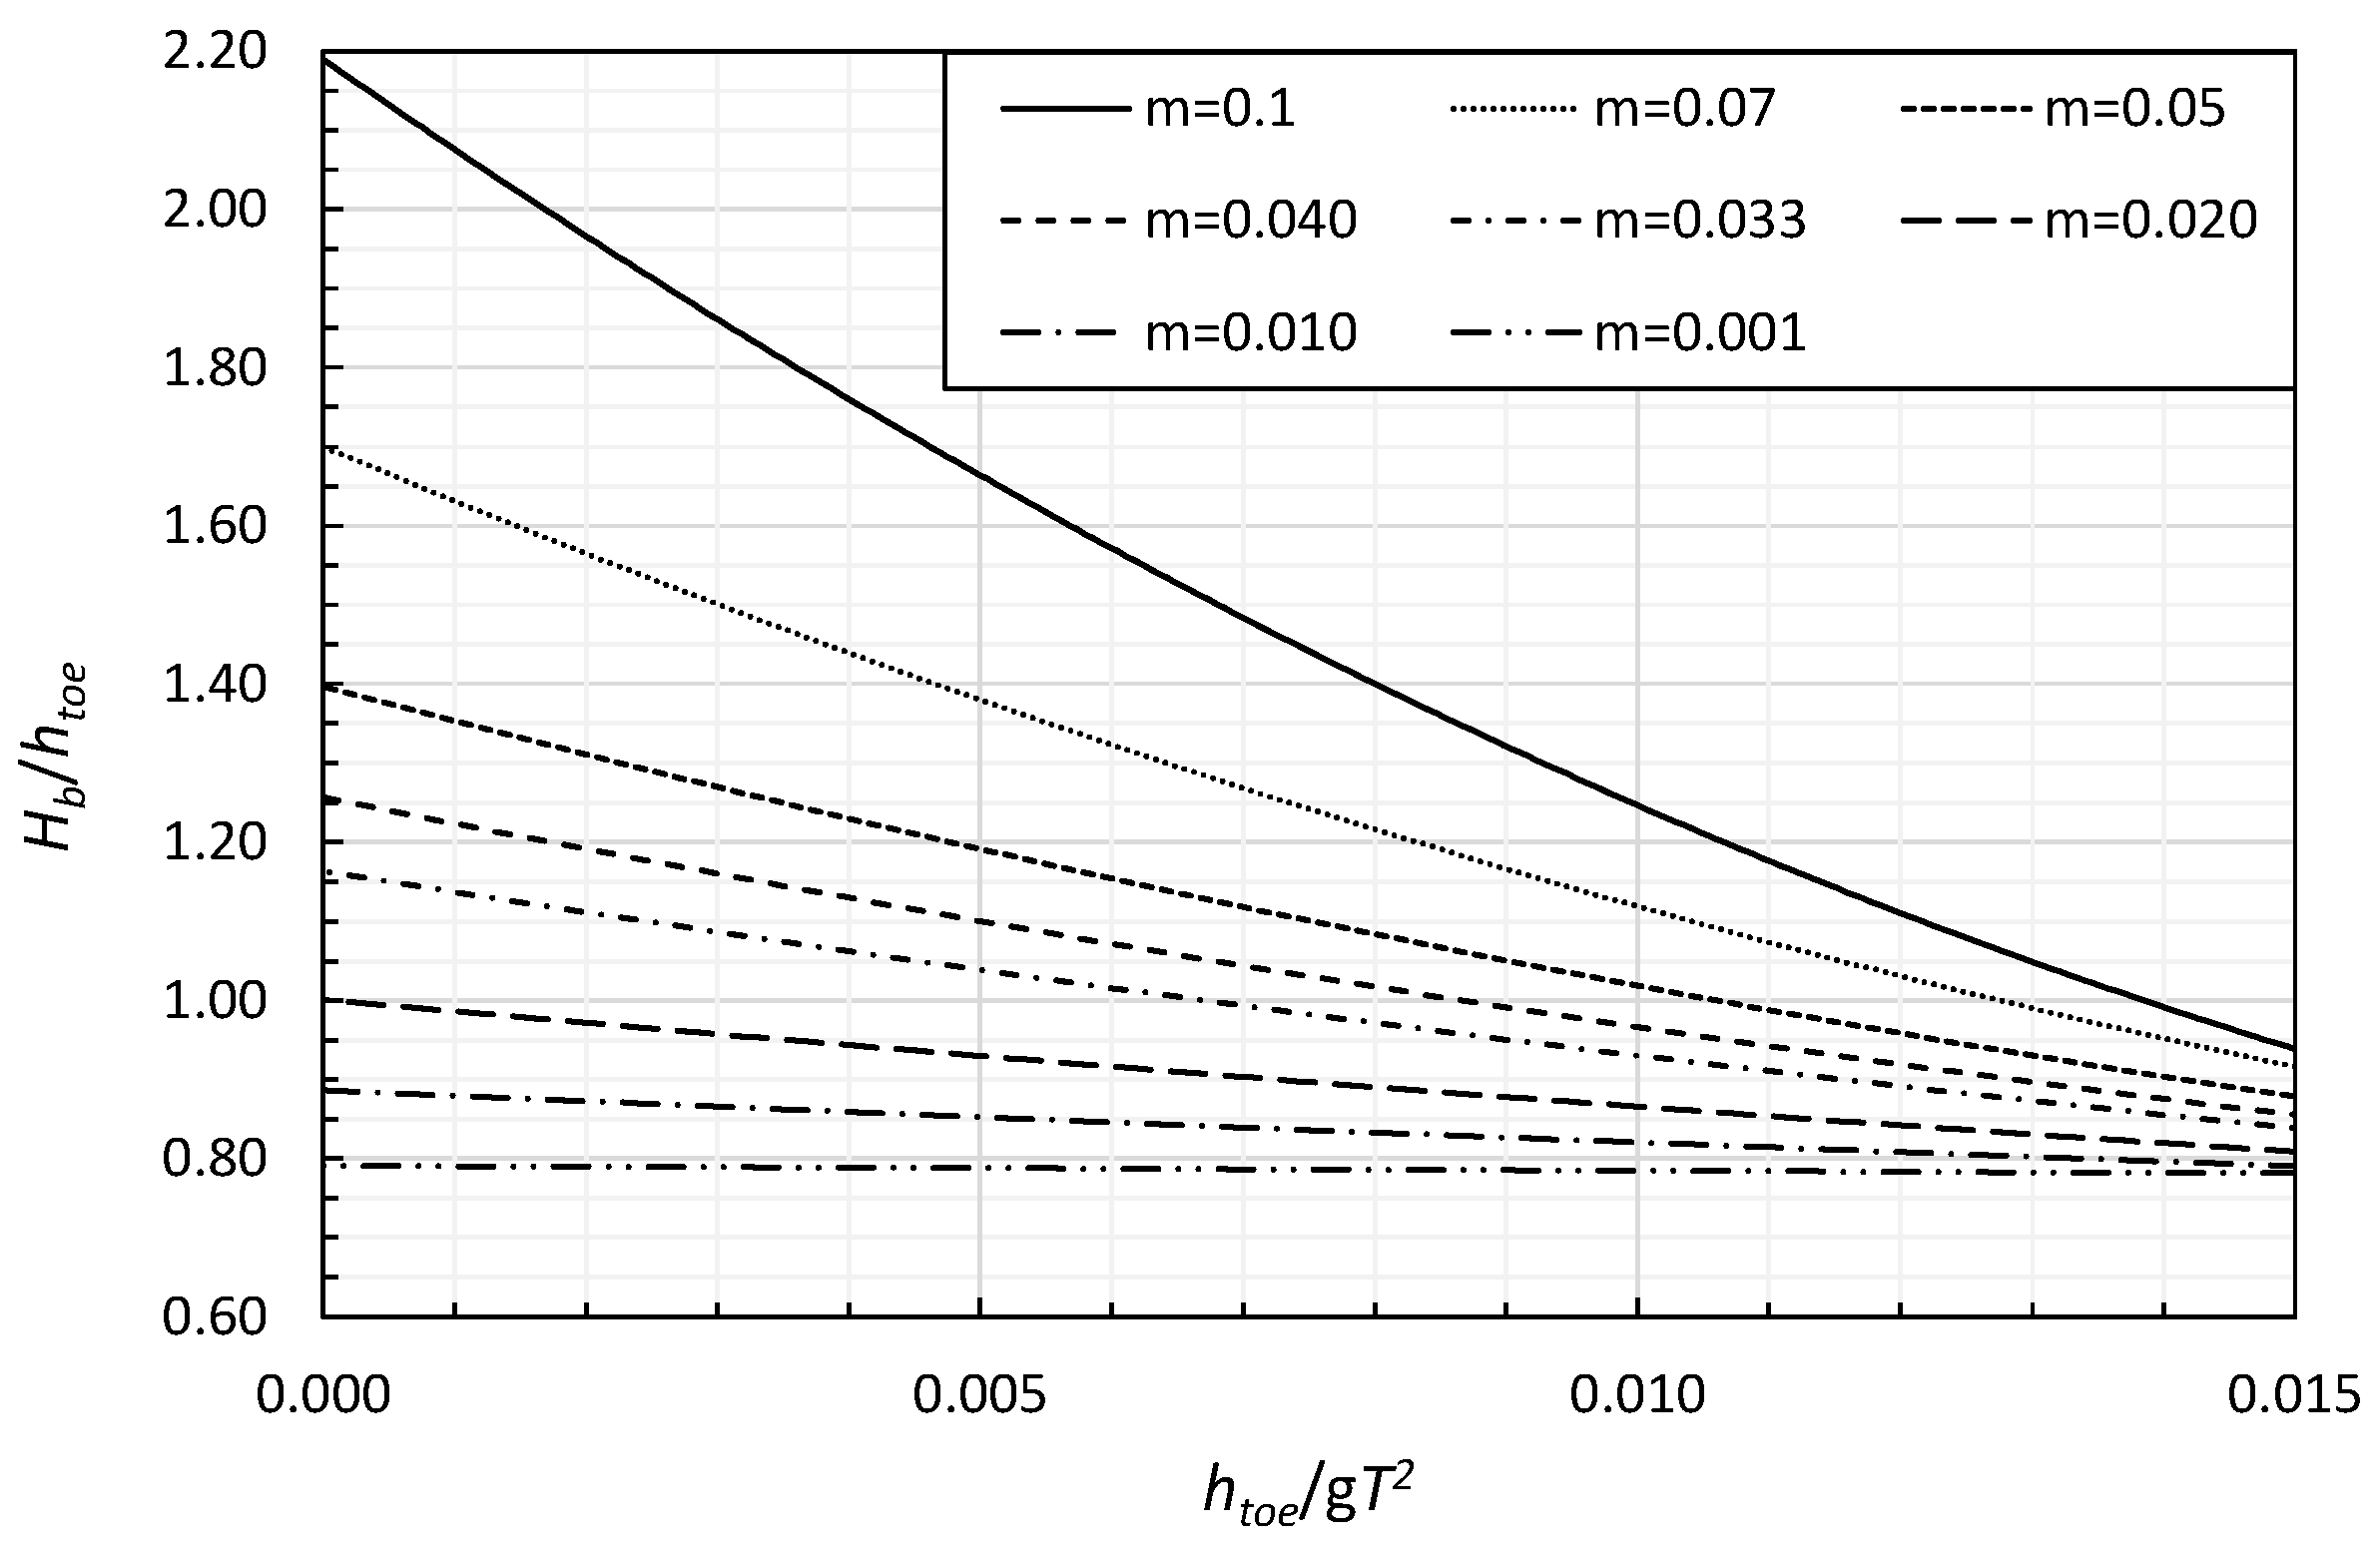
4.3. Seabed Slope
4.4. Limits of Application
- Data are available for only one fronting seabed slope of m = 0.033. A likely range of nearshore seabed slopes could be 0.025 < m < 0.050. Test data for these slopes are not available but may result in a modified formula.
- The predictor is based on a paucity of data, with only 16 suitable test results available. A much larger data set is warranted.
- The shortest wave period used in the models was 1.3 s, which limits a small 1:50 Froude scale model to schematise only prototype wave periods shorter than 8 s. For larger scale models the maximum prototype period schematised could be far shorter. Prototype wave periods may exceed 15 s.
- The smallest significant wave height modelled was 0.04 m, which limits a small 1:50 Froude scale model to schematise wave heights only up to Hs = 2 m. For larger scale models the maximum prototype significant wave height schematised could be far smaller. Depth-limited prototype waves incident upon coastal revetments can exceed Hs = 2 m.
- The lightest model armour rock was M50 = 0.047 kg, which limits a small 1:50 Froude scale model to schematise armour rock only up to M50 = 6 t. For larger scale models the maximum mass of prototype armour rock schematised could be far smaller.
- Much of the data is based on around 1000 zero-crossing waves, which limits a small 1:50 Froude scale model to schematise a storm duration of up to 2 h. For larger scale models the maximum prototype storm duration schematised could be far shorter. Revetments in depth-limited situations are likely to be subjected to much longer storms and a much larger number of waves.
- The predictor is based on results of 2-dimensional flume studies, which do not replicate any 3-dimensional processes that occur in the nearshore surf zone fronting revetments.
- The predictor is based on flume studies that did not consider wave overtopping.
5. Conclusions
Author Contributions
Funding
Institutional Review Board Statement
Informed Consent Statement
Data Availability Statement
Conflicts of Interest
References
- Hudson, R.Y. Laboratory investigations of rubble-mound breakwaters. ASCE Transactions Paper No. 3213, pp. 610–659. Waterw. Harb. Div. 1959, 85, 93–121. [Google Scholar] [CrossRef]
- Van der Meer, J.W. Rock Slopes and Gravel Beaches Under Wave Attack. Ph.D. Thesis, Delft University of Technology, Delft, The Netherlands, 1988; 214p. [Google Scholar]
- Van Gent, M.R.A.; Smale, A.J.; Kuiper, C. Stability of Rock Slopes with Shallow Foreshores. In Proceedings of the Coastal Structures 2003: Proceedings of the Conference, Portland, OR, USA, 26–30 August 2003. [Google Scholar] [CrossRef]
- Foster, D.N.; Gordon, A.D. Stability of armour units against breaking waves. In Proceedings of the 1st Aust. Conference on Coastal Engineering, Sydney, Australia, 14–17 May 1973; pp. 98–107. [Google Scholar]
- Gordon, A.D. Stability of Breakwaters Under the Action of Breaking Waves. Master’s Thesis, University of New South Wales, Sydney, Australia, 1973; 60p. [Google Scholar]
- Van Gent, M.R.A. On the Stability of Rock Slopes, Keynote. In Proceedings of the NATO Advanced Research Workshop on Environmentally Friendly Coastal Protection Structures, Varna, Bulgaria, 25–27 May 2004; pp. 73–92. [Google Scholar]
- Van der Meer, J.W. Rock armour slope stability under wave attack—The Van der Meer formula revisited. J. Coast. Hydraul. Struct. 2021, 1, 8. [Google Scholar] [CrossRef]
- Van der Meer, J.W.; Andersen, T.; Eldrup, M. Rock armour slope stability under wave attack in shallow water. J. Coast. Hydraul. Struct. 2024, 4, 35. [Google Scholar]
- Shen, Z.; Huang, D.; Wang, G.; Jin, F. Numerical study of wave interaction with armour layers using the resolved CFD-DEM coupling method. Coast. Eng. 2024, 187, 104421. [Google Scholar] [CrossRef]
- Sarfaraz, M.; Pak, A. Numerical Investigation of the Stability of Armour Units in Low-Crested Breakwaters using Combined SPH-Polyhedral DEM Method. Fluids Struct. 2018, 81, 14–35. [Google Scholar] [CrossRef]
- Van der Meer, J.W.; Allsop, N.W.H.; Bruce, T.; De Rouck, J.; Kortenhaus, A.; Pullen, T.; Schüttrumpf, H.; Troch, P.; Zanuttigh, B. EurOtop. Manual on Wave Overtopping of Sea Defences and Related Structures. An Overtopping Manual Largely Based on European Research, but for Worldwide Application. 2016. Available online: www.overtopping-manual.com (accessed on 10 January 2025).
- Couriel, E.; Nielsen, A.F.; Jayewardene, I.; McPherson, B. The need for physical models in coastal engineering. Coast. Eng. Proc. 2018, 1, 52. [Google Scholar] [CrossRef]
- Steetzel, H.J. Cross-shore Transport during Storm Surges. Ph.D. Thesis, Delft University of Technology, Delft, The Netherlands, 1993; 294p. [Google Scholar]
- Nielsen, A.F. Design scour levels for dune revetments and seawalls. ASCE J. Waterway Port Coastal Ocean Eng. 2023, 149, 4023005. [Google Scholar] [CrossRef]
- USACE. Shore Protection Manual; Coastal Engineering Research Centre, Waterways Experiment Station, US Army Corps of Engineers: Vicksburg, MI, USA, 1984; Volume 2. [Google Scholar]
- Battjes, J. Surf similarity. Coast. Eng. 1974, 1, 466–480. [Google Scholar] [CrossRef]
- Weggel, J.R. Maximum Breaker Height. Waterw. Harb. Coast. Eng. Div. 1972, 98, 529–548. [Google Scholar]
- Goda, Y. Random Seas and Design of Maritime Structures; World Scientific: Singapore, 2000; p. 443. [Google Scholar]
- Thompson, D.M.; Shuttler, R.M. Riprap Design for Wind Wave Attack, a Laboratory Study in Random Waves; HR Wallingford Report EX 707; HR Wallingford: Wallingford, UK, 1975; p. 129. [Google Scholar]
- Nelson, R.C. Wave Heights in Depth Limited Conditions. In Proceedings of the Sixth Australian Conference on Coastal and Ocean Engineering, Brisbane, Australia, 13–15 July 1983; pp. 210–215. [Google Scholar]
- Riedel, H.P.; Byrne, A.P. Random breaking waves—Horizontal seabed. In Proceedings of the 20th Conference on Coastal Engineering, Taipei, Taiwan, 9–14 November 1986; pp. 903–908. [Google Scholar]
- Sakakiyama, T.; Kajima, R. Scale effect of wave force on armor units. In Proceedings of the 22nd ICCE, ASCE, 1990, Delft, The Netherlands, 2–6 July 1990; pp. 1716–1729. [Google Scholar]
- Shimada, A.; Fujimoto, T.; Saito, S.; Sakakiyama, T.; Hirakuchi, H. Scale effects on stability and wave reflection regarding armor units. In Proceedings of the 20th Conference on Coastal Engineering, Taipei, Taiwan, 9–14 November 1986; pp. 2238–2252. [Google Scholar]
- Yager, R.J. Calculating Drag Coefficients for Spheres and Other Shapes Using C++; Report ARL-TN-612; US Army Research Laboratory, Aberdeen Proving Ground: Adelphi, MD, USA, 2014. [Google Scholar]

| Test Data | Reduced Data | |||||||||
|---|---|---|---|---|---|---|---|---|---|---|
| cotα | T | hb | Hb | D | N | L | (1) Hs | (2) N0x | LHs2/((ΔDn50)3cotα1.5) | |
| (-) | (s) | (m) | (m) | (%) | (-) | (m) | (m) | (-) | (-) | (-) |
| 2 | 1.37 | 0.095 | 0.085 | 3.0 | 2500 | 1.33 | 0.061 | 125,000 | 8.49 × 10⁻⁵ | 14.8 |
| 2 | 1.35 | 0.100 | 0.090 | 6.0 | 3000 | 1.34 | 0.064 | 150,000 | 1.55 × 10⁻⁴ | 16.9 |
| 2 | 1.35 | 0.115 | 0.104 | 18.0 | 3000 | 1.43 | 0.075 | 150,000 | 4.65 × 10⁻⁴ | 24.2 |
| 1.5 | 1.31 | 0.075 | 0.067 | 2.2 | 3000 | 1.13 | 0.048 | 150,000 | 5.68 × 10⁻⁵ | 12.0 |
| 1.5 | 1.37 | 0.084 | 0.077 | 3.4 | 2000 | 1.24 | 0.055 | 100,000 | 1.08 × 10⁻⁴ | 17.6 |
| 1.5 | 1.35 | 0.094 | 0.084 | 8.3 | 4000 | 1.29 | 0.060 | 200,000 | 1.86 × 10⁻⁴ | 21.9 |
| 1.25 | 1.34 | 0.067 | 0.060 | 6.5 | 5000 | 1.09 | 0.043 | 250,000 | 1.30 × 10⁻⁴ | 12.3 |
| 1.25 | 1.35 | 0.077 | 0.069 | 11.6 | 5000 | 1.17 | 0.050 | 250,000 | 2.32 × 10⁻⁴ | 17.7 |
| Test Data | Reduced Data | |||||||
|---|---|---|---|---|---|---|---|---|
| Test | Hm0toe | htoe | Hm0toe/htoe | N | Tp | Smeasured | LH2/((ΔDn50)3cotα1.5) | |
| No. | (m) | (m) | (-) | (-) | (s) | (-) | (-) | (-) |
| Structure 6 cotα = 2 | ||||||||
| 16 | 0.076 | 0.150 | 0.51 | 1193 | 1.981 | 11.97 | 4.3 × 10⁻³ | 33.5 |
| 17 | 0.075 | 0.150 | 0.50 | 1216 | 1.863 | 10.13 | 3.6 × 10⁻³ | 52.1 |
| 18 | 0.063 | 0.125 | 0.50 | 1039 | 1.589 | 7.09 | 2.7 × 10⁻³ | 31.6 |
| 19 | 0.070 | 0.125 | 0.56 | 1286 | 2.471 | 10.34 | 3.6 × 10⁻³ | 33.2 |
| Structure 7 cotα = 4 | ||||||||
| 8 | 0.106 | 0.200 | 0.53 | 1032 | 1.888 | 6.96 | 2.7 × 10⁻³ | 40.5 |
| 9 | 0.111 | 0.200 | 0.56 | 1333 | 3.000 | 12.20 | 4.2 × 10⁻³ | 70.5 |
| 10 | 0.081 | 0.150 | 0.54 | 1017 | 2.584 | 1.72 | 6.7 × 10⁻⁴ | 28.0 |
| 11 | 0.088 | 0.150 | 0.59 | 1068 | 3.038 | 3.55 | 1.4 × 10⁻³ | 38.9 |
| Parameter | Symbol | WRL 1973 | Delft 2003 |
|---|---|---|---|
| Revetment slope | cotα | 1.25, 1.5, 2.0 | 2.0, 4.0 |
| Median rock mass | M50 | 0.064 kg | 0.047 kg |
| Rock Grading | Dn85/Dn15 | 1.3 | 1.4 |
| Seabed slope | m | 0.033 | 0.033 |
| Wave Conditions | Regular | Random | |
| Wave period | Tp | 1.3–1.4 | 1.5–3.0 s |
| Wave height/depth | Hstoe/htoe | 0.64–0.65 | 0.50–0.59 |
| Number of waves | N | 5000 | 1100–1300 |
| Dn50 | htoe | Re | ||||
|---|---|---|---|---|---|---|
| Min. | Max. | Min. | Max. | Min. | Max. | |
| (m) | (m) | (m) | (m) | (-) | (-) | |
| Model | 0.026 | 0.029 | 0.060 | 0.200 | 2.0 × 10⁴ | 4.1 × 10⁴ |
| Prototype for Scale 1:10 | 0.26 | 0.29 | 0.60 | 2.00 | 6.3 × 10⁵ | 1.3 × 10⁶ |
| Prototype for Scale 1:50 | 1.3 | 1.5 | 3.0 | 10.0 | 7.1 × 10⁶ | 1.5 × 10⁷ |
Disclaimer/Publisher’s Note: The statements, opinions and data contained in all publications are solely those of the individual author(s) and contributor(s) and not of MDPI and/or the editor(s). MDPI and/or the editor(s) disclaim responsibility for any injury to people or property resulting from any ideas, methods, instructions or products referred to in the content. |
© 2025 by the authors. Licensee MDPI, Basel, Switzerland. This article is an open access article distributed under the terms and conditions of the Creative Commons Attribution (CC BY) license (https://creativecommons.org/licenses/by/4.0/).
Share and Cite
Nielsen, A.F.; Gordon, A.D. Revetment Rock Armour Stability Under Depth-Limited Breaking Waves. Coasts 2025, 5, 12. https://doi.org/10.3390/coasts5020012
Nielsen AF, Gordon AD. Revetment Rock Armour Stability Under Depth-Limited Breaking Waves. Coasts. 2025; 5(2):12. https://doi.org/10.3390/coasts5020012
Chicago/Turabian StyleNielsen, Alexander F., and Angus D. Gordon. 2025. "Revetment Rock Armour Stability Under Depth-Limited Breaking Waves" Coasts 5, no. 2: 12. https://doi.org/10.3390/coasts5020012
APA StyleNielsen, A. F., & Gordon, A. D. (2025). Revetment Rock Armour Stability Under Depth-Limited Breaking Waves. Coasts, 5(2), 12. https://doi.org/10.3390/coasts5020012