
Analysis of Coastal Environmental Vulnerabilities in the Municipality of Niterói, Rio de Janeiro, Brazil, in the Face of Sea Level Rise Projections

 , , , and
Abstract
1. Introduction
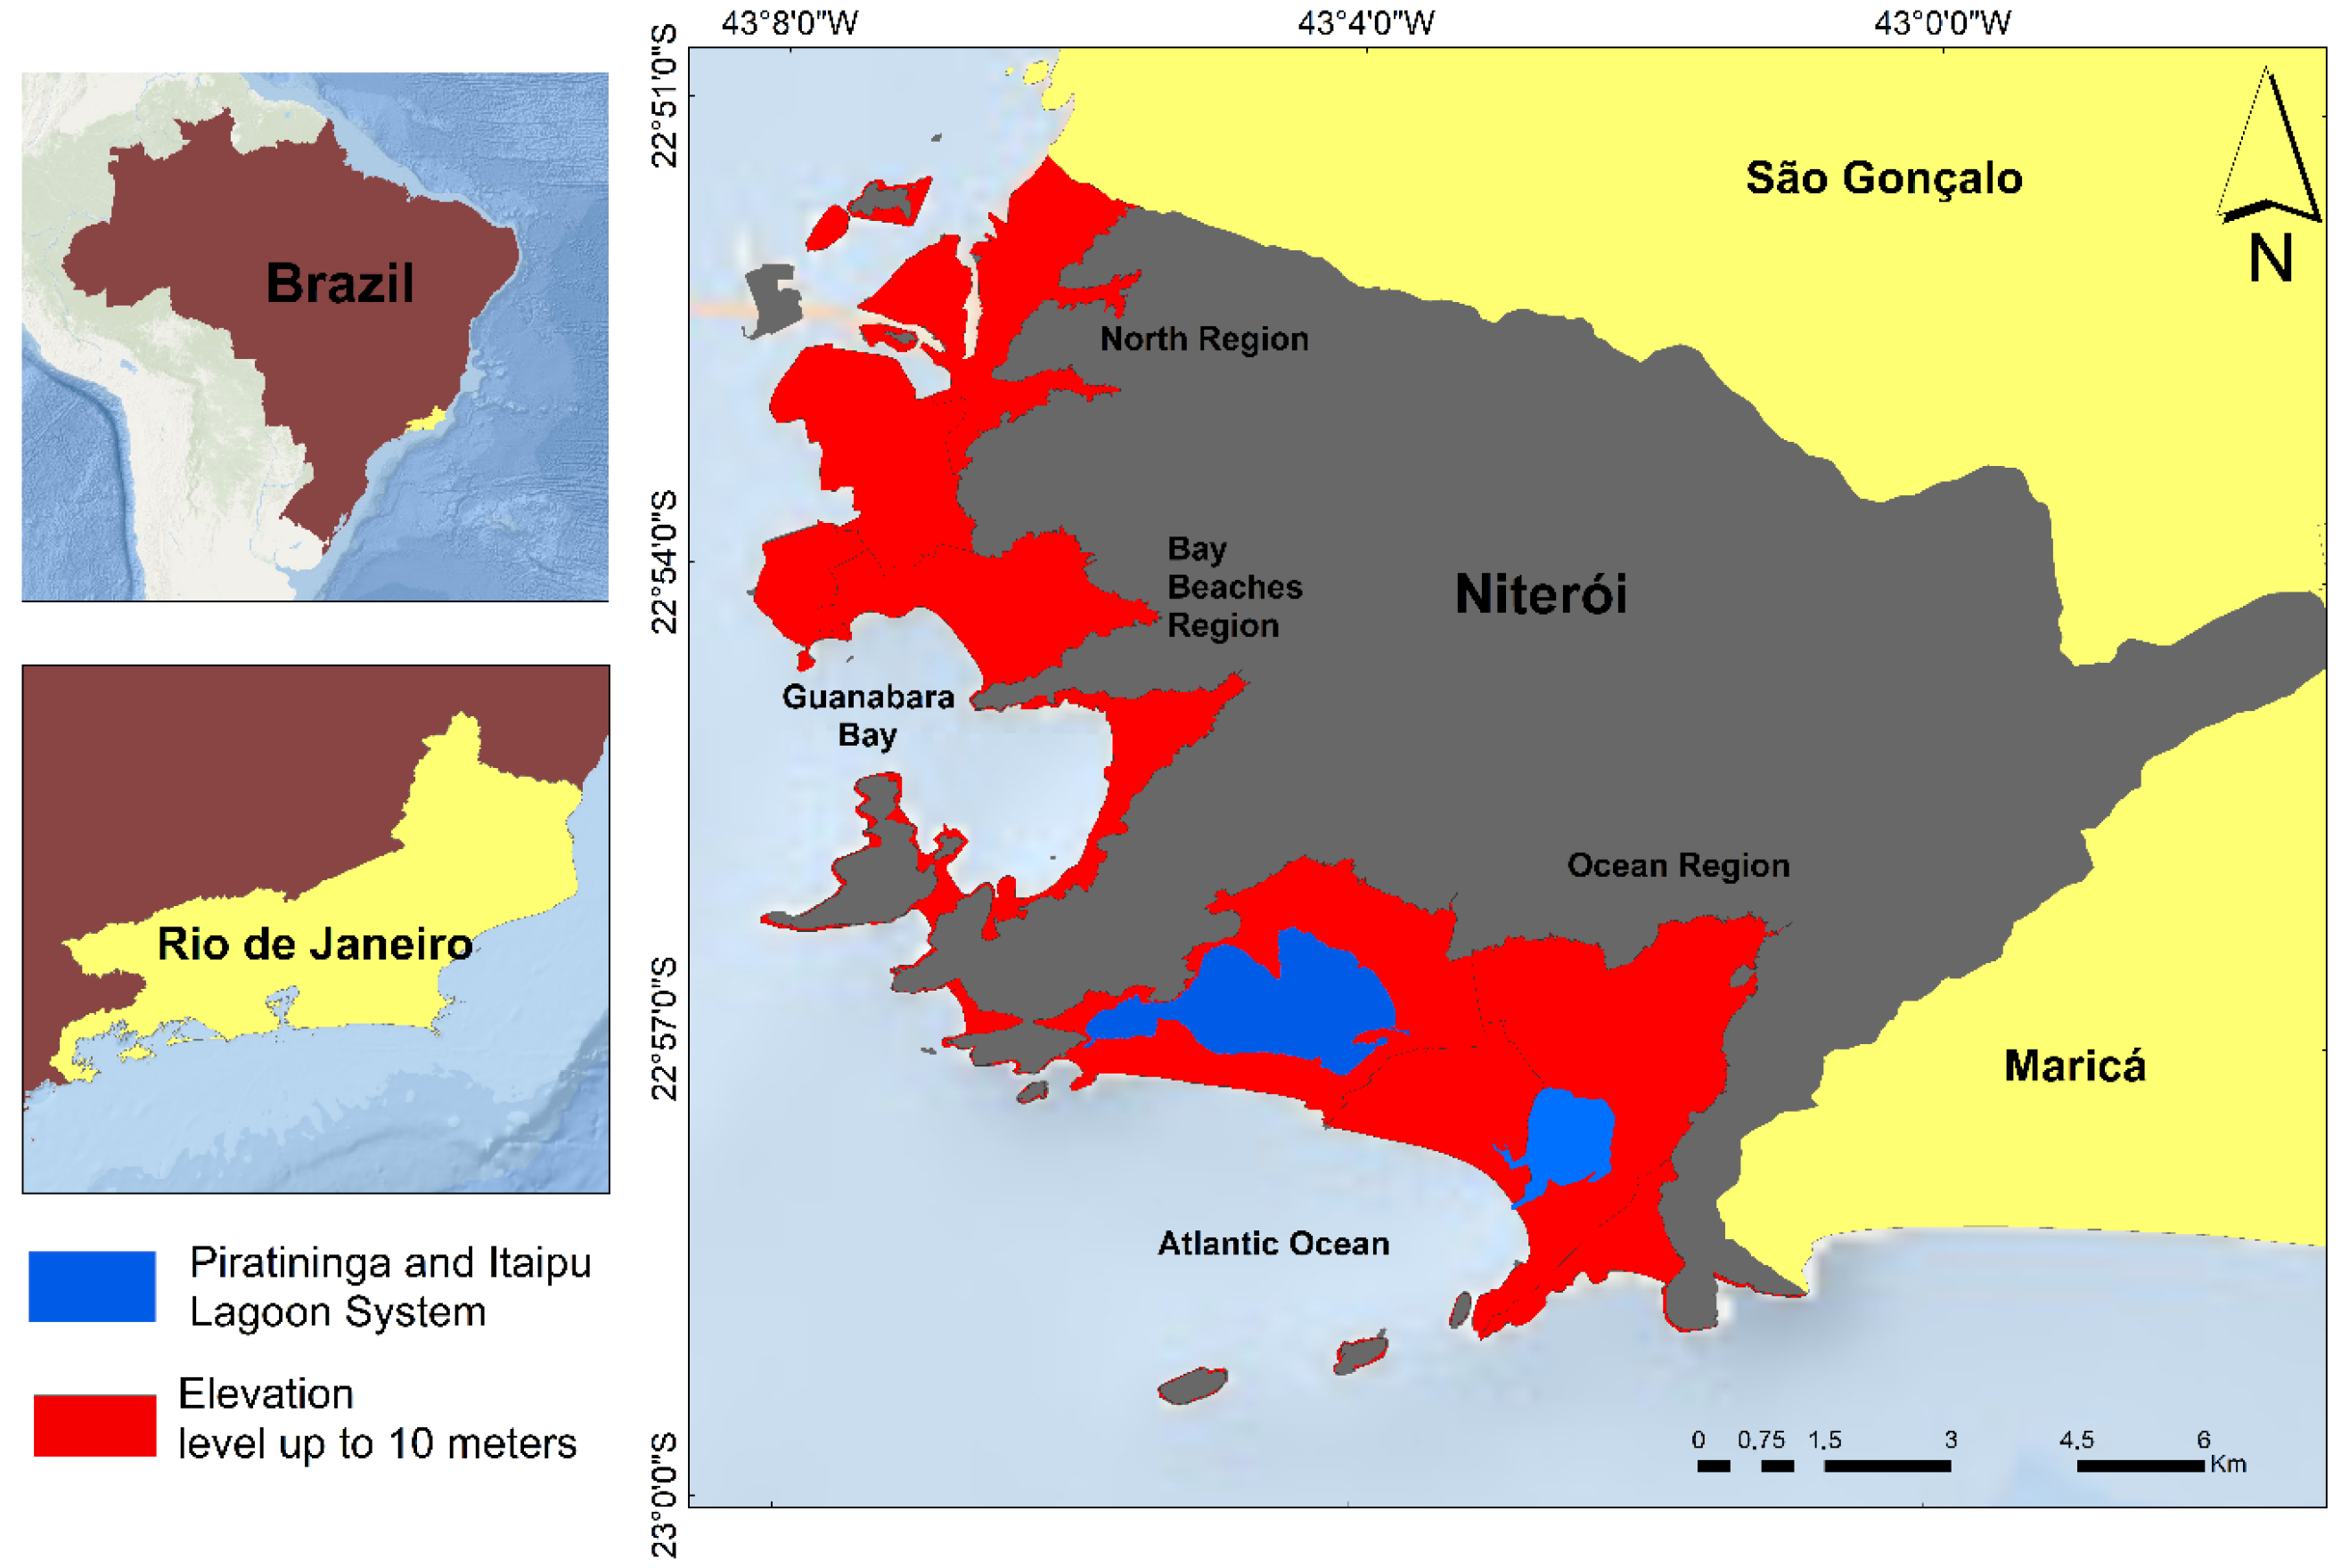
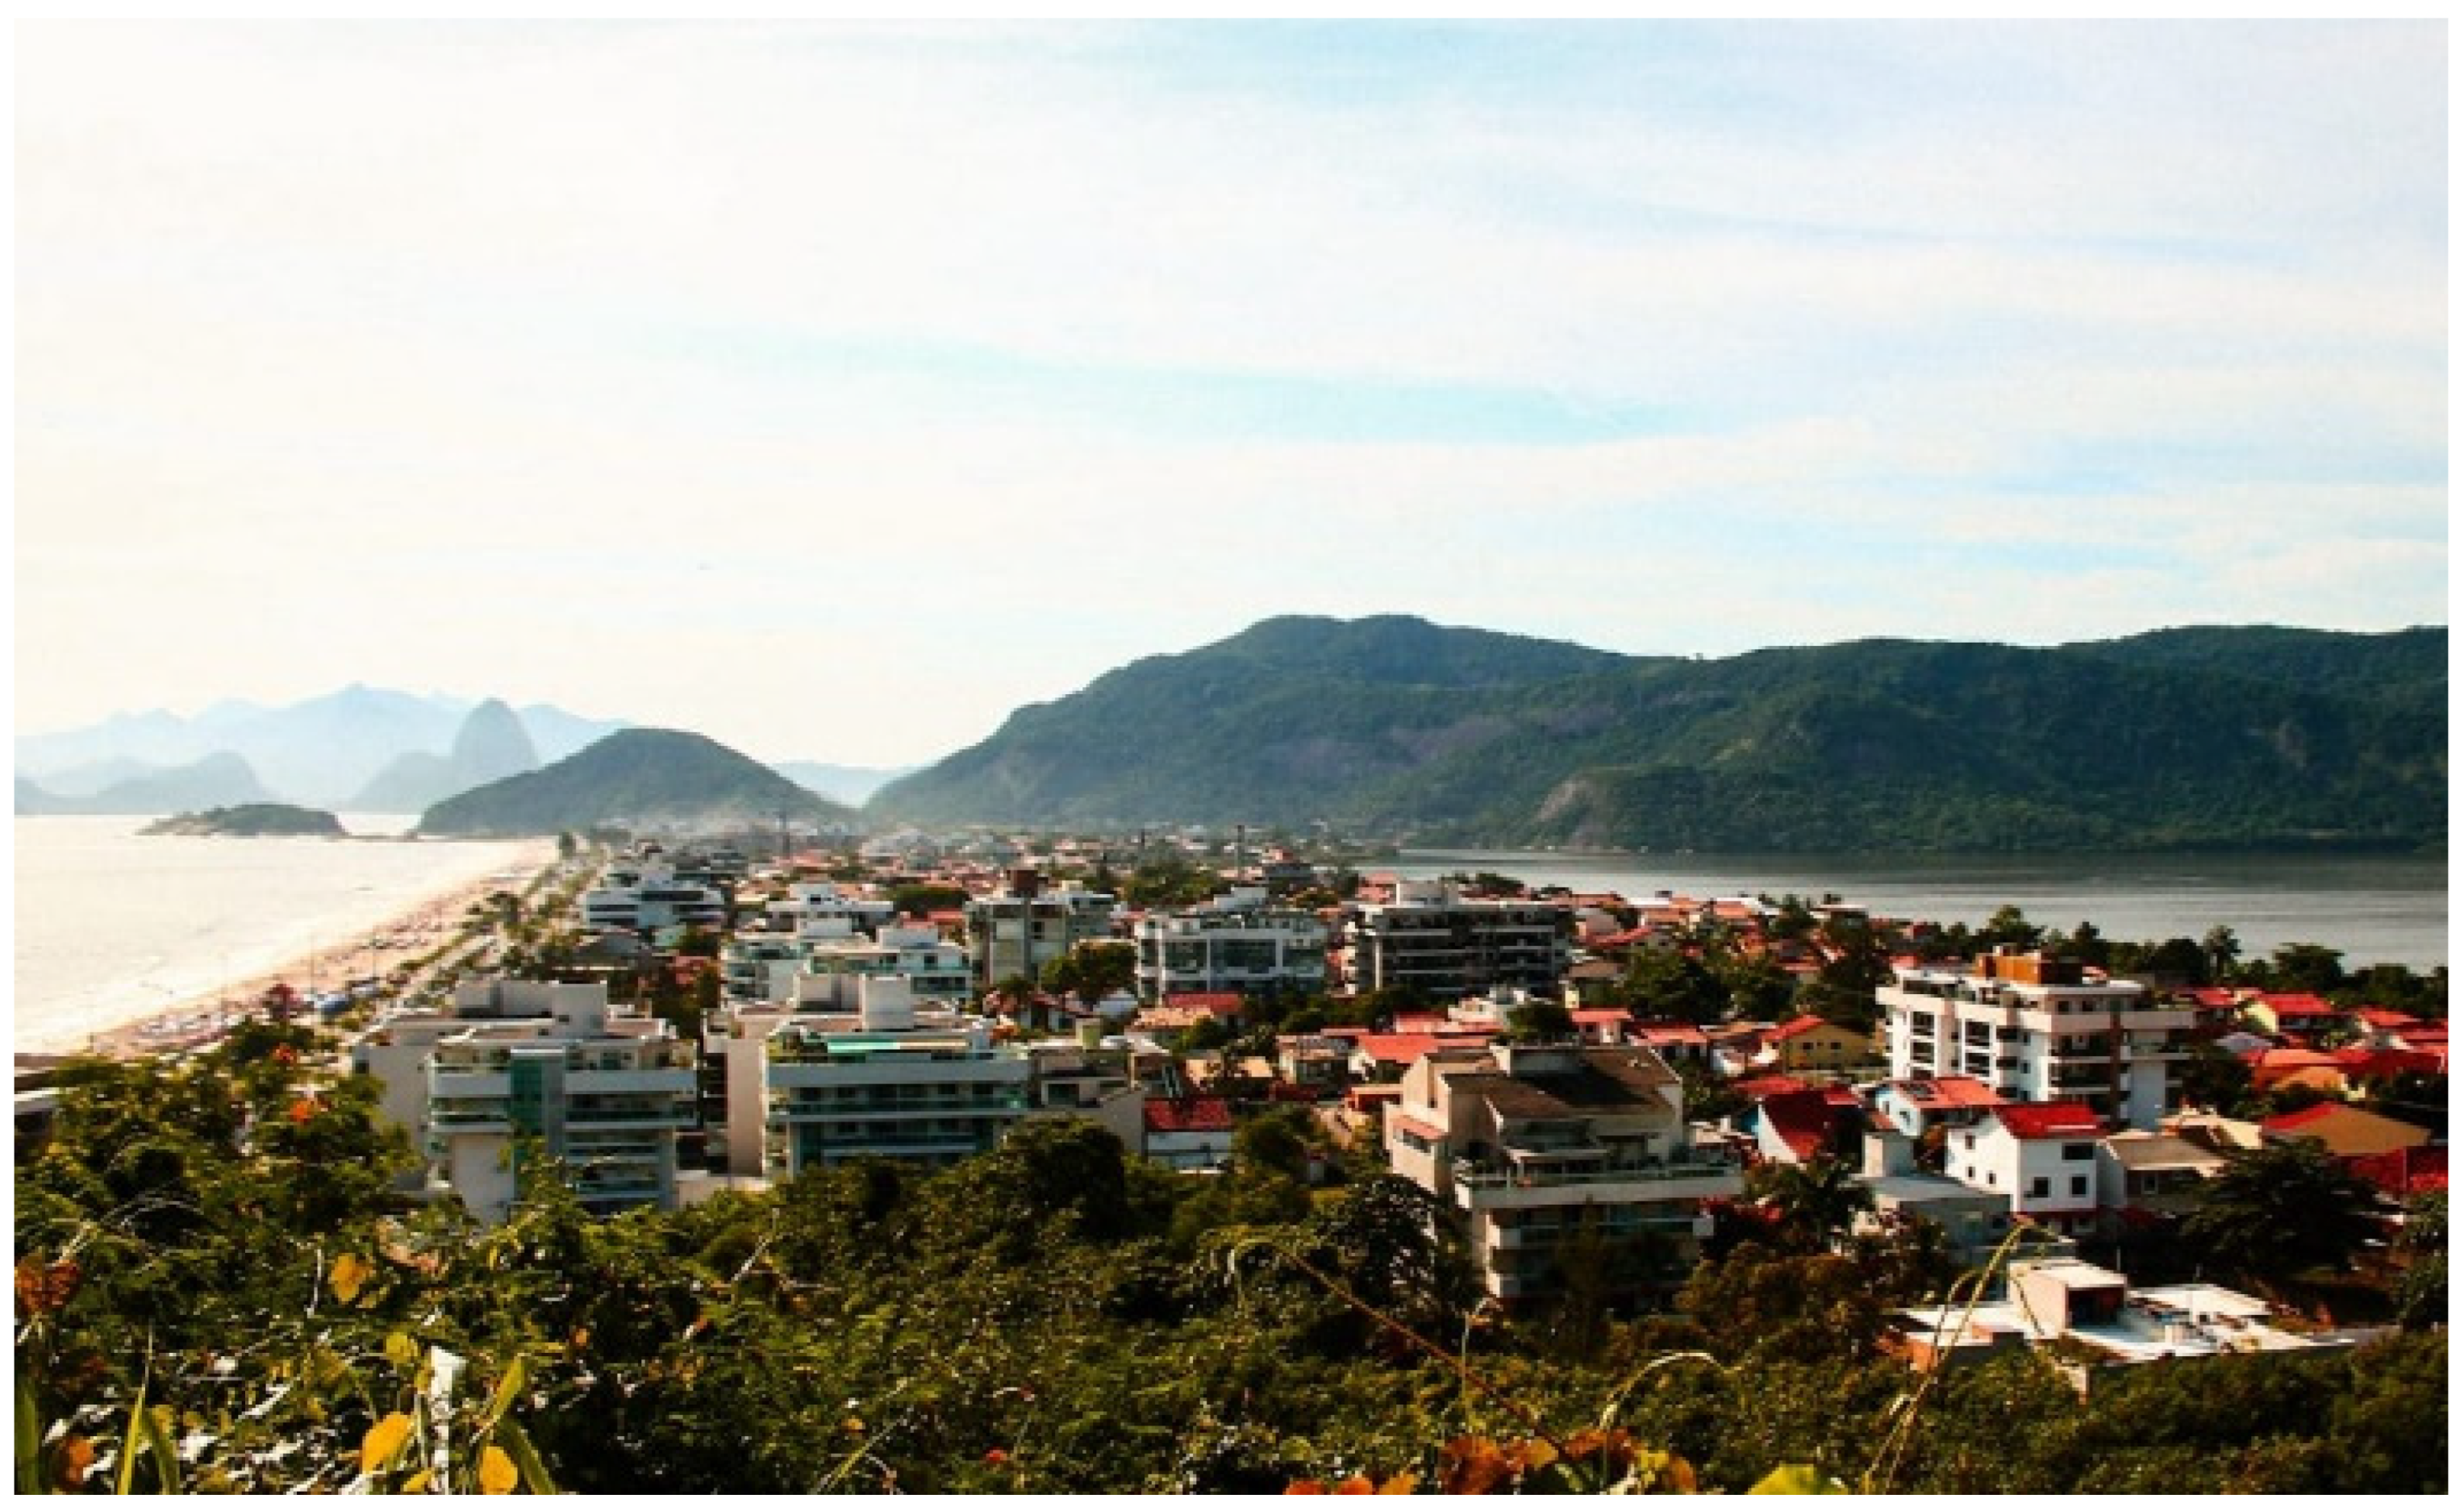
2. Study Area
3. Material and Methods
3.1. Land Use and Land Cover (LU/LC) in the Municipality of Niterói
3.2. Coastal Environmental Vulnerabilities in the Municipality of Niterói
3.3. Adaptation Proposals
4. Results and Discussion
4.1. Land Use and Land Cover (LU/LC) in the Municipality of Niterói
4.2. Vulnerabilities Along the Coastline of the Municipality of Niterói
4.2.1. Natural Physical and Biological Aspects
4.2.2. Socio-Economic Aspects
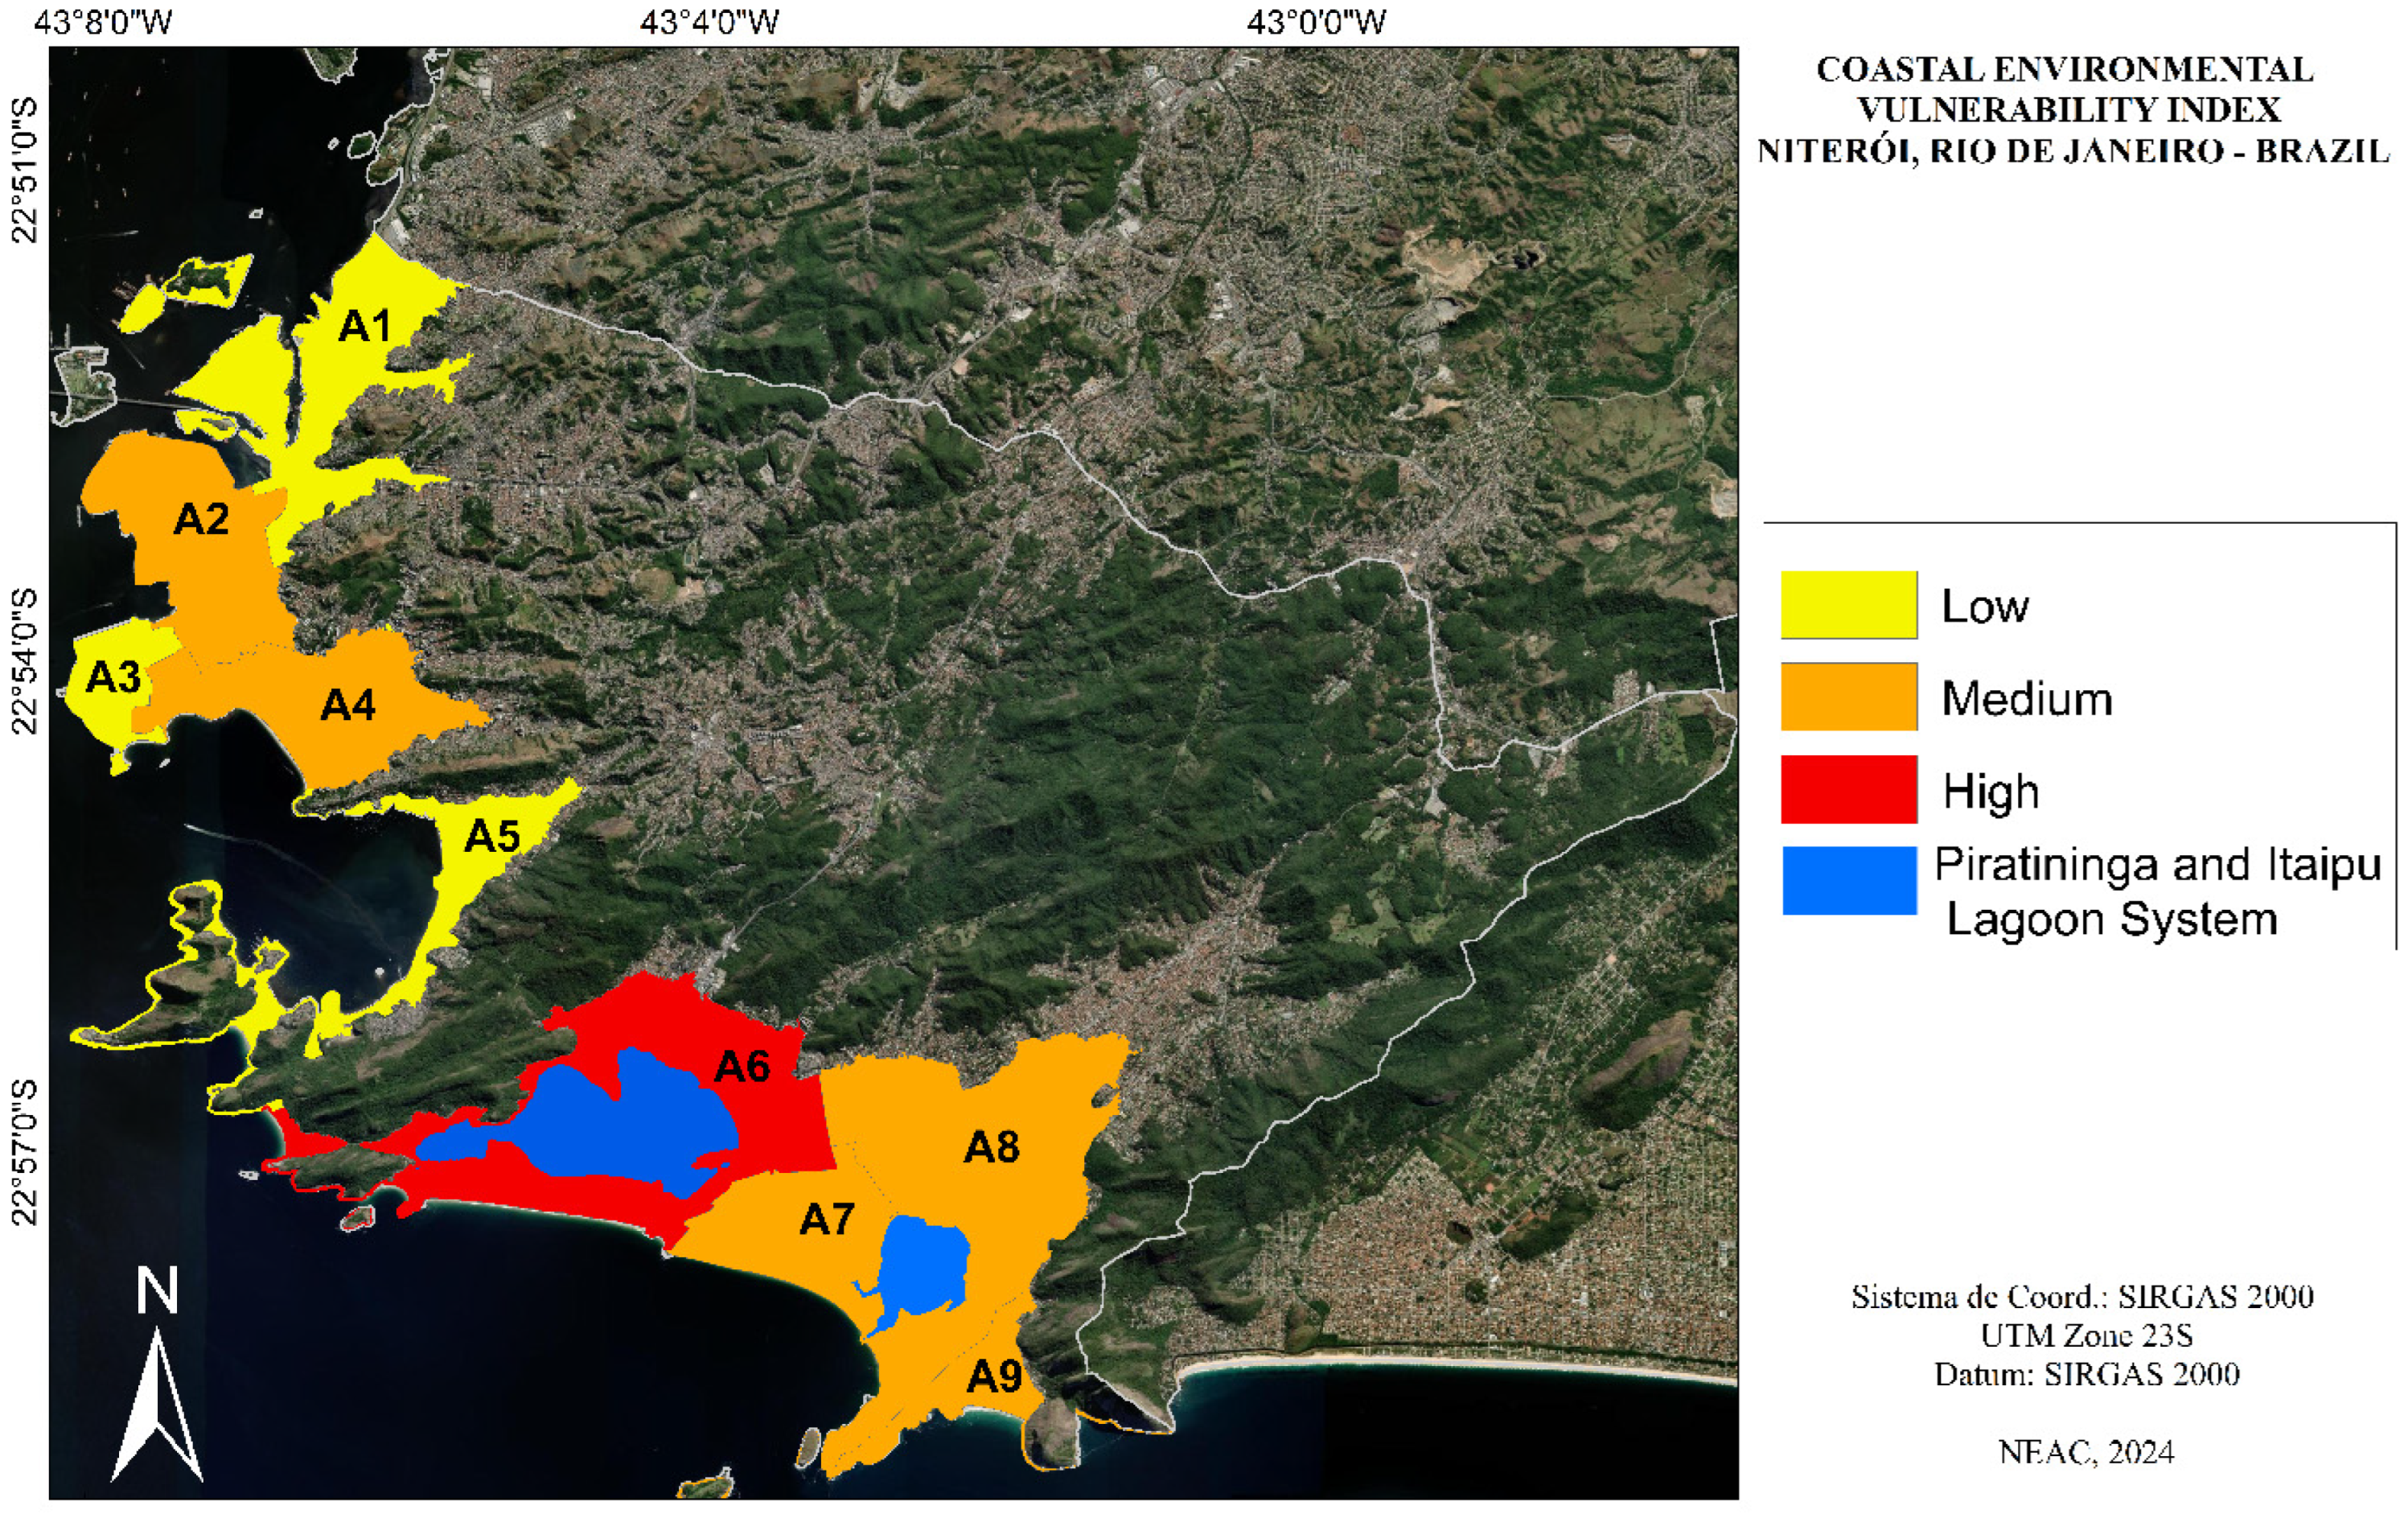
4.2.3. Analysis of Coastal Environmental Vulnerabilities
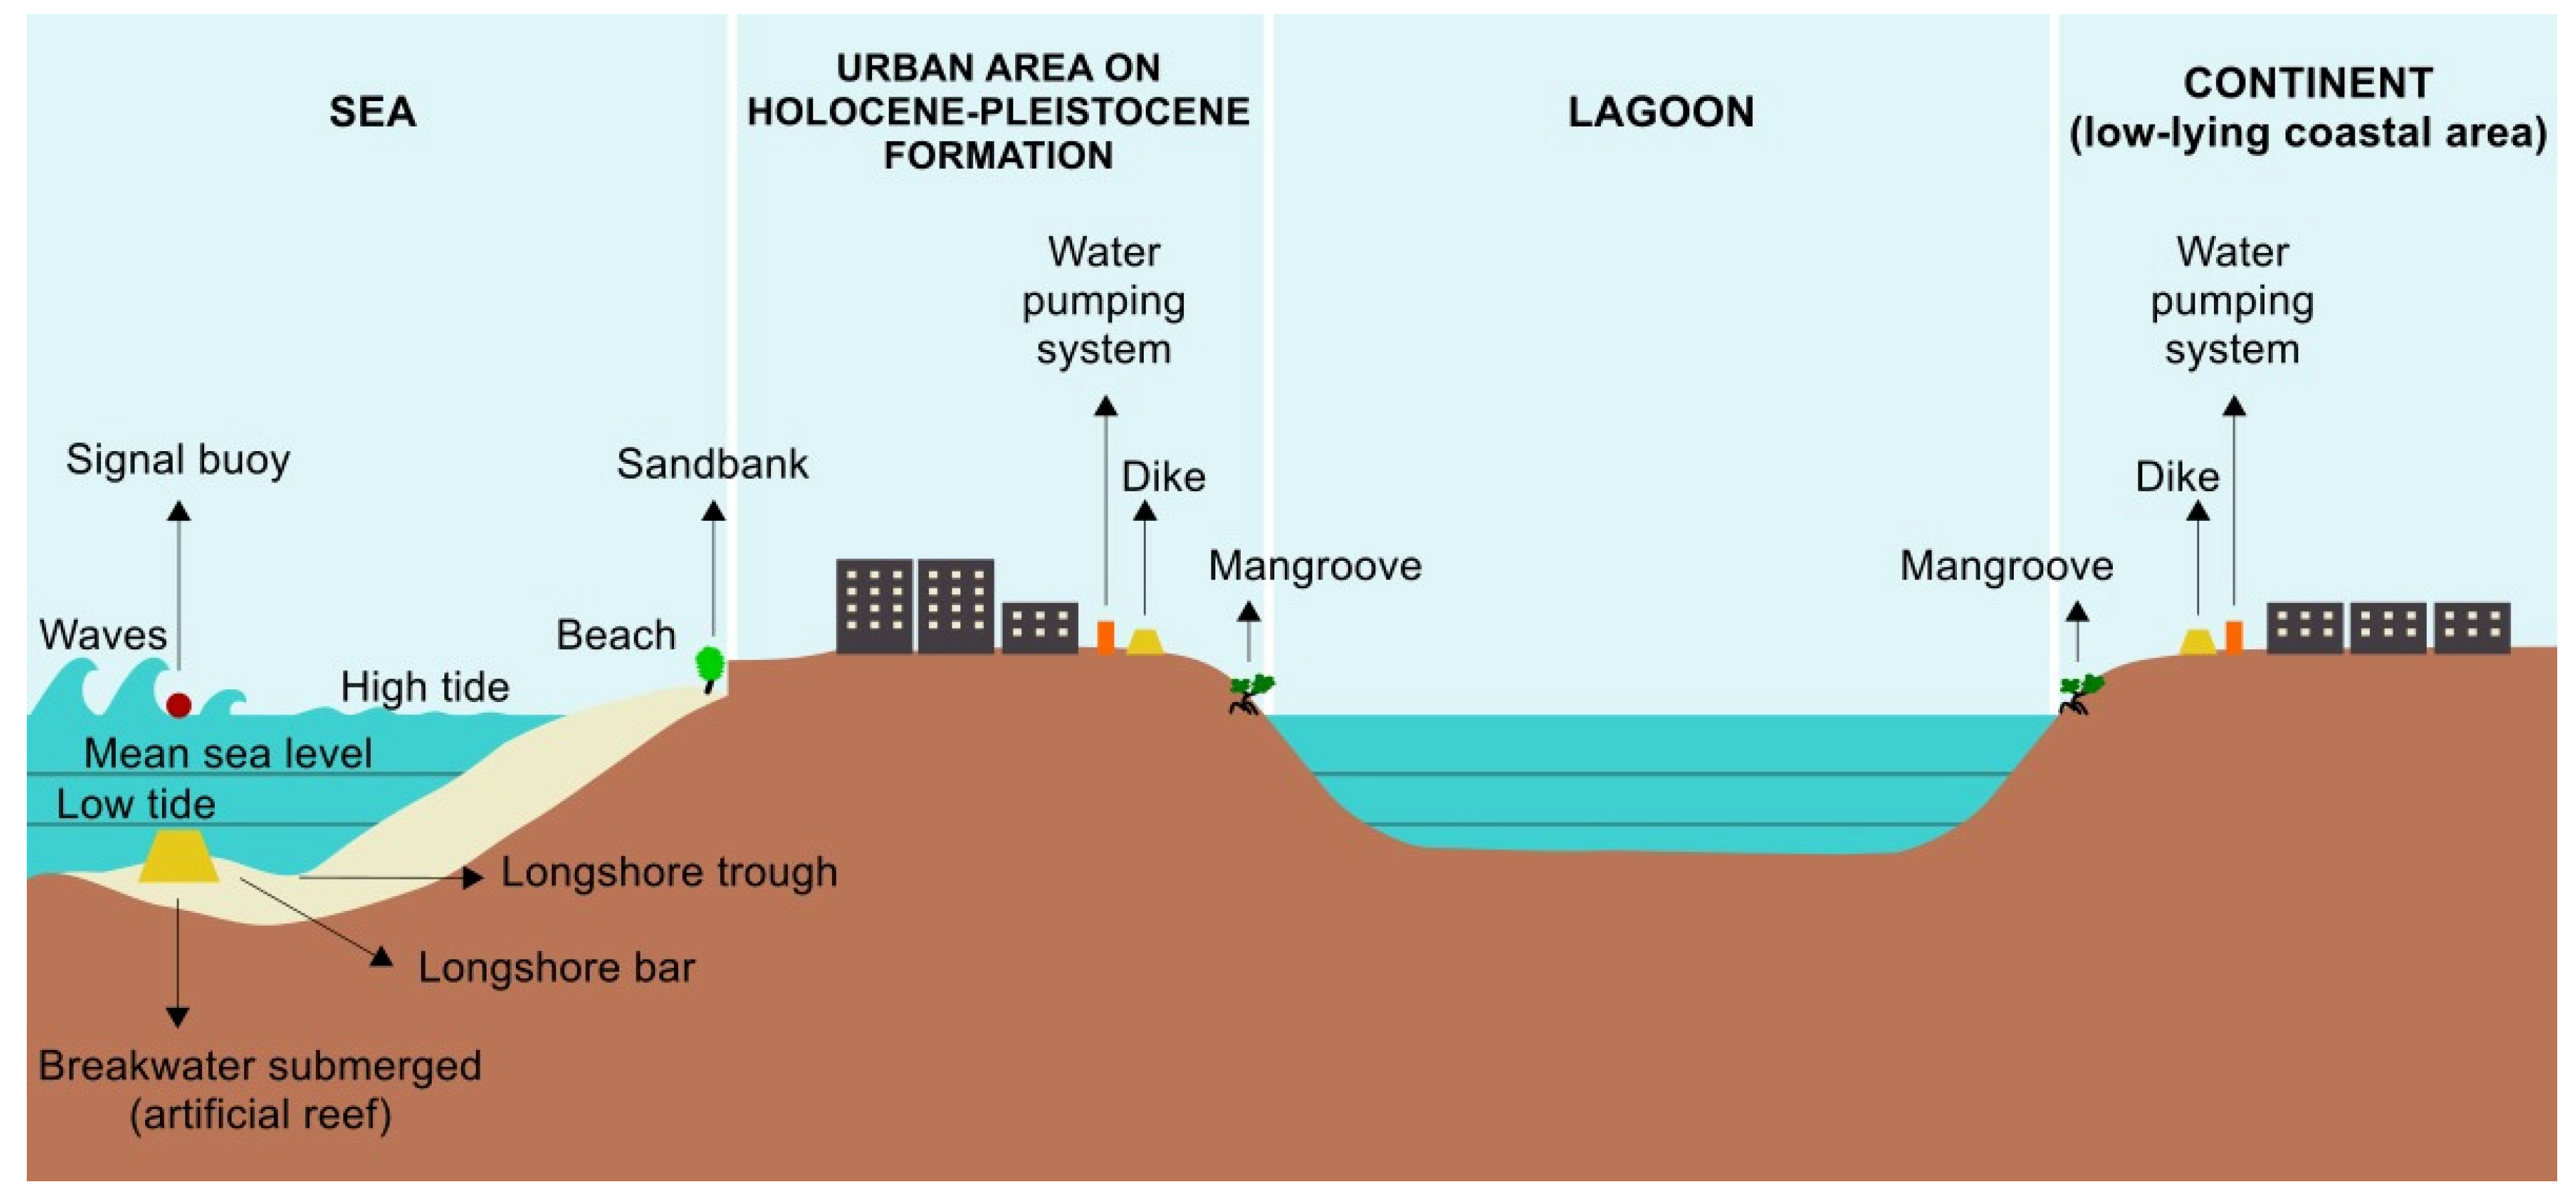
4.3. Adaptation Proposals
5. Conclusions
Author Contributions
Funding
Informed Consent Statement
Data Availability Statement
Conflicts of Interest
References
- Fortunato, A.B.; Clímaco, M.; Oliveira, F.; Oliveira, A.; Sancho, F.; Freire, P. Dinâmica Fisiográfica da Orla Costeira: Estudos de Reabilitação e Protecção (Coastal Dynamics: Rehabilitation and Protection Studies). Rev. Gestão Costeira Integr. (J. Integr. Coast. Zone Manag.) 2008, 8, 45–65. [Google Scholar] [CrossRef]
- Choudri, B.S.; Baawain, M.S.; Ahmed, M.; Al Sidairi, A.K.; Al Nadabi, H. Relative Vulnerability of costal Wilayats to development: A study of Al-Batinah North, Oman. J. Coast. Conserv. 2014, 19, 51–57. [Google Scholar] [CrossRef]
- MMA—Ministério do Meio Ambiente (Ministry of the Environment). A zona costeira e seus múltiplos usos. In Gerenciamento Costeiro. Gestão Territorial (The Coastal Zone and Its Multiple Uses. Coastal Management. Territorial Management); MMA: Brasília, Brasil, 2018. Available online: http://www.mma.gov.br/gestao-territorial/gerenciamento-costeiro.html (accessed on 10 September 2024).
- McGranahan, G.; Balk, D.; Anderson, B. The rising tide: Assessing the risks of climate change and human settlements in low elevation coastal zones. Environ. Urban. 2007, 19, 17–37. [Google Scholar] [CrossRef]
- Nicolodi, J.N.; Petermann, R.M. Mudanças Climáticas e a Vulnerabilidade da Zona Costeira do Brasil: Aspectos ambientais, sociais e tecnológicos (Climate Change and the Vulnerability of Brazil’s Coastal Zone: Environmental, social and technological aspects). Rev. Gestão Costeira Integr. (J. Integr. Coast. Manag.) 2010, 10, 151–177. Available online: https://www.aprh.pt/rgci/pdf/rgci-206_Nicolodi.pdf (accessed on 10 September 2024). [CrossRef]
- IOC—Intergovernmental Oceanographic Commission. Hazard Awareness and Risk Mitigation in Integrated Coastal Management (ICAM), Manual and Guides Nº 50, Dossier Nº 5; UNESCO: Paris, France, 2009. [Google Scholar] [CrossRef]
- Neumann, B.; Vafeidis, A.T.; Zimmermann, J.; Nicholls, R.J. Future Coastal Population Growth and Exposure to Sea-level Rise and Coastal Flooding—A Global Assessment. PLoS ONE 2015, 10, e0118571. [Google Scholar] [CrossRef]
- Hallegatte, S.; Green, C.; Nicholls, R.J.; Corfee-Morlot, J. Future flood losses in major coastal cities. Nat. Clim. Change 2013, 3, 802–806. [Google Scholar] [CrossRef]
- Whal, T.; Brown, S.; Haigh, I.D.; Nilsen, J.E.O. Coastal Sea Levels, Impacts, and Adaptation. J. Mar. Sci. Eng. 2018, 6, 19. [Google Scholar] [CrossRef]
- Nicholls, R.J.; Hanson, S.E.; Lowe, J.A.; Warrick, R.A.; Lu, X.; Long, A.J. Sea-level scenarios for evaluating coastal impacts. WIREs Clim Change 2014, 5, 129–150. [Google Scholar] [CrossRef]
- Parkinson, R.W.; Harlim, P.W.; Meeder, J.F. Managing the Anthropocene marine transgression to the year 2100 and beyond in the State of Florida U.S.A. Clim. Chage 2015, 128, 85–98. [Google Scholar] [CrossRef]
- IPCC—Intergovernmental Panel on Climate Change. Summary for Policymakers. In Climate Change 2023: Synthesis Report; Contribution of Working Groups I, II and III to the Sixth Assessment Report of the Intergovernmental Panel on Climate Change; Core Writing Team, Lee, H., Romero, J., Eds.; IPCC: Geneva, Switzerland, 2023; pp. 1–34. [Google Scholar] [CrossRef]
- IPCC—Intergovernmental Panel on Climate Change. 5th Assessment Report, Climate Change 2013: The Physical Science Basis, Contribution of Working Group I to the Fifth Assessment Report of the Intergovernmental Panel on Climate Change; Cambridge University Press: Cambridge, UK, 2013; Available online: https://www.ipcc.ch/site/assets/uploads/2018/03/WG1AR5_SummaryVolume_FINAL.pdf (accessed on 10 July 2019).
- WMO—World Meteorological Organization. Greenhouse Gas Concentrations Surge Again to New Record in 2023; WMO: Geneva, Switzerland, 2024; Available online: https://wmo.int/news/media-centre/greenhouse-gas-concentrations-surge-again-new-record-2023 (accessed on 19 February 2025).
- WMO—World Meteorological Organization. State of the Global Climate 2023; WMO: Geneva, Switzerland, 2024; Available online: https://library.wmo.int/viewer/68835/download?file=1347_Global-statement-2023_en.pdf&type=pdf&navigator=1 (accessed on 11 September 2024).
- Peric, J.; Grdic, Z.S. Economic Impacts of Sea Level Rise Caused by Climate Change. Tour. South. East. Eur.—ToSEE 2015, 3, 285–294. Available online: https://www.researchgate.net/publication/280579298_ECONOMIC_IMPACTS_OF_SEA_LEVEL_RISE_CAUSED_BY_CLIMATE_CHANGE (accessed on 11 September 2024).
- Rishi, P.; Mudaliar, M. Climate Stress, Behavioral Adaptation and Subjective Well Being in Coastal Cities of India. Am. J. Appl. Psychol. Sci. Educ. Publ. 2014, 2, 13–21. [Google Scholar] [CrossRef]
- Tonmoy, F.N.; El-Zein, A. Vulnerability to sea level rise: A novel local-scale indicator-based assessment methodology and application to eight beaches in Shoalhaven, Austrália. Ecol. Indic. 2018, 85, 295–307. [Google Scholar] [CrossRef]
- Lins-de-Barros, F.M.; Muehe, D. The smartline approach to coastal vulnerability and social risk assessment applied to a segment of the east coast of Rio de Janeiro State, Brazil. J. Coast. Conserv. 2011, 17, 211–223. [Google Scholar] [CrossRef]
- Cazenave, A.; Cozannet, G.L. Sea level rise and its coastal impacts. Earth’s Future 2014, 2, 15–34. [Google Scholar] [CrossRef]
- MMA—Ministério do Meio Ambiente (Ministry of the Environment). Macro Diagnóstico da Zona Costeira e Marinha do Brasil (Macro Diagnosis of Brazil’s Coastal and Marine Zone); MMA: Brasília, Brasil, 2008. Available online: https://antigo.mma.gov.br/gestao-territorial/gerenciamento-costeiro/macrodiagnostico.html (accessed on 15 September 2024).
- MMA—Ministério do Meio Ambiente (Ministry of the Environment). MMA Divulga Municípios da Zona Costeira (MMA Announces Municipalities in the Coastal Zone); MMA: Brasília, Brasil, 2018. Available online: https://www.mma.gov.br/informma/item/15352-definidos-munic%C3%ADpios-da-zona-costeira.html (accessed on 2 October 2024).
- IBGE—Instituto Brasileiro de Geografia e Estatística (Brazilian Institute of Geography and Statistics). Organização do Território. Estrutura Territorial. Municípios Costeiros (Organization of the Territory. Territorial Structure. Coastal Municipalities); IBGE: Rio de Janeiro, Brasil, 2021. Available online: https://www.ibge.gov.br/geociencias/organizacao-do-territorio/estrutura-territorial/34330-municipios-costeiros (accessed on 3 October 2024).
- IBGE—Instituto Brasileiro de Geografia e Estatística (Brazilian Institute of Geography and Statistics). cidades@ (cities@); IBGE: Rio de Janeiro, Brasil, 2022. Available online: https://cidades.ibge.gov.br/brasil (accessed on 5 October 2024).
- CPRM—Companhia de Pesquisas de Recursos Minerais; Serviço Geológico do Brasil (Mineral Resources Research Company. Brazil Geological Service). Programa Levantamentos Geológicos Básicos do Brasil. Geologia do Estado do Rio de Janeiro (Basic Geological Surveys of Brazil Program. Geology of the State of Rio de Janeiro); CPRM: Brasília, Brasil, 2000. Available online: https://rigeo.sgb.gov.br/bitstream/doc/17229/14/rel_proj_rj_geoambiental.pdf (accessed on 15 September 2024).
- Niterói. Lei Nº 3385, de 21 de Janeiro de 2019. Aprova a Política de Desenvolvimento Urbano do Município e Institui o Plano Diretor de Niterói (Law No. 3385, of January 21, 2019. Approves the municipality’s Urban Development Policy and establishes the Niterói Master Plan); Procuradoria Geral do Município de Niterói (Office of the Attorney General of the Municipality of Niterói): Niterói, Brasil, 2019.
- PMN—Prefeitura Municipal de Niterói (Niterói City Hall)/Fundação Getúlio Vargas (Getúlio Vargas Foudation). Leitura Técnica da Revisão do Plano Diretor de Desenvolvimento Urbano de Niterói: Caderno de Mapas (Technical Reading of the Review of Niterói’s Urban Development Master Plan: Map Notebook); Secretaria Municipal de Urbanismo e Mobilidade (Municipal Department of Urbanism and Mobility), PMN: Niterói, Brasil, 2016. Available online: https://urbanismo.niteroi.rj.gov.br/anexos/Plano%20Diretor/Revis%C3%A3o%20PD/diagnostico-tecnico-volume-3-3_caderno_de_mapas.pdf (accessed on 20 September 2024).
- PMN—Prefeitura Municipal de Niterói (Niterói City Hall). Projeto Orla Niterói. Orla do Município de Niterói. Caracterização e Perfis de Orla (Niterói Waterfront Project. Waterfront of the Municipality of Niterói. Waterfront Characterization and Profiles); Secretaria de Urbanismo (Urban Planning Secretariat), PMN: Niterói, Brasil, 2011. Available online: https://pt.slideshare.net/slideshow/plano-de-gesto-integrada-da-orla-martima-niteri-70036364/70036364 (accessed on 25 October 2024).
- EMBRAPA—Empresa Brasileira de Pesquisa Agropecuária (Brazilian Agricultural Research Corporation). Clima (Climate); EMBRAPA: Brasília, Brasil, 2020; Available online: https://www.cnpf.embrapa.br/pesquisa/efb/clima.htm (accessed on 23 May 2020).
- PMN—Prefeitura Municipal de Niterói (Niterói City Hall). Atlas das Unidades de Conservação do Município de Niterói (Atlas of Conservation Units in the Municipality of Niterói); PMN: Niterói, Brasil, 2018; 101p. Available online: https://meioambiente.niteroi.rj.gov.br/atlas-de-niteroi/ (accessed on 15 September 2024).
- IBGE—Instituto Brasileiro de Geografia e Estatística (Brazilian Institute of Geography and Statistics). Censo demográfico 2010 (2010 Demographic census); IBGE: Rio de Janeiro, Brasil, 2018. Available online: https://www.ibge.gov.br/estatisticas/sociais/trabalho/9662-censo-demografico-2010.html?=&t=o-que-e (accessed on 20 December 2018).
- PNUD—Programa das Nações Unidas para o Desenvolvimento (United Nations Development Program). Atlas do Desenvolvimento Humano no Brasil–Atlas Brasil (Atlas of Human Development in Brazil-Atlas Brasil); PNUD: New York, NY, USA, 2017; Available online: http://www.atlasbrasil.org.br/perfil/municipio/330330 (accessed on 5 November 2024).
- PMN—Prefeitura Municipal de Niterói (Niterói City Hall). Sistema de Gestão da Geoinformação da Prefeitua de Niterói—SIGeo (Niterói City Hall’s Geoinformation Management System—SIGeo); Plataforma de geoinformação da Prefeitura de Niterói (Niterói City Hall’s geoinformation platform): Niterói, Brasil, 2020. Available online: http://sigeo.niteroi.rj.gov.br/ (accessed on 9 April 2020).
- Arkema, K.K.; Guannel, G.; Verutes, G.; Wood, S.A.; Guerry, A.; Ruckelshaus, M.; Dareiva, P.; Lacayo, M.; Silver, J.M. Coastal habitats shield people and property from sea-level rise and storms. Nat. Clim. Change 2013, 3, 813–918. [Google Scholar] [CrossRef]
- Brasil. Lei 9.985, de 18 de julho de 2000. Regulamenta o Art.225, § 1º, Incisos I, II, III e VII da Constituição Federal e Institui o Sistema Nacional de Unidades de Conservação da Natureza (Law 9.985, of July 18, 2000. Regulates Art. 225, § 1, Items I, II, III and VII of the Federal Constitution and Establishes the National System of Nature Conservation Units); DOU: Brasília, Brasil, 2000. Available online: http://www.planalto.gov.br/ccivil_03/leis/l9985.htm (accessed on 20 April 2020).
- CONAMA—Conselho Nacional do Meio Ambiente (National Environmental Council). MMA—Ministério do Meio Ambiente (Ministry of the Environment). Resolução Nº 302, de 20 de março de 2002. Dispõe sobre os parâmetros, definições e limites de Áreas de Preservação Permanente, de Reservatórios Artificiais e o Regime de uso do Entorno (Resolution No. 302, of March 20, 2002. Provides for the Parameters, Definitions and Limits of Permanent Preservation Areas, Artificial Reservoirs and the Surrounding Use Regime); CONAMA, MMA: Brasília, Brasil, 2002. Available online: https://conama.mma.gov.br/?option=com_sisconama&task=arquivo.download&id=298 (accessed on 30 April 2020).
- Hauer, M.E. Migration induced by sea-level rise could reshape the US population landscape. Nat. Clim. Change 2017, 7, 321–325. [Google Scholar] [CrossRef]
- Herdy, R.D.; Hauer, M.E. Social Vulnerability projections improve sea-level rise risk assessments. Appl. Geogr. 2018, 91, 10–20. Available online: https://mathewhauer.github.io/papers/2018-AppliedGeographerHardyHauer.pdf (accessed on 3 March 2019). [CrossRef]
- Ribeiro, P.; Ferrão, J.; Seixas, J. Mainstreaming climate adaptation in spatial planning. The case of Baixa Pombalina in Lisbon. Rev. Finisterra 2018, 108, 15–38. [Google Scholar] [CrossRef]
- IPCC—Intergovernmental Panel on Climate Change. Managing the Risks of Extreme Events and Disasters to Advance Climate Change Adaptation. A Special Report of Working Groups I and II of the Intergovernmental Panel on Climate Change; Cambridge University Press: Cambridge, UK, 2012; Available online: https://www.ipcc.ch/site/assets/uploads/2018/03/SREX_Full_Report-1.pdf (accessed on 8 June 2019).
- Muehe, D. Brazilian coastal vulnerability to climate change. Pan-Am. J. Aquat. Sci. 2010, 5, 173–183. Available online: https://panamjas.org/pdf_artigos/PANAMJAS_5(2)_173-183.pdf (accessed on 20 June 2020).
- Elko, N.; Brodie, K.; Stockdon, H.; Nordstrom, K.; Houser, C.; McKenna, K.; Moore, L.; Rosati, J.; Ruggiero, R.T.; Walker, I. Dune management challenges on developed coasts. Shore Beach 2016, 84, 15–28. Available online: https://www.researchgate.net/publication/294924206_Dune_management_challenges_on_developed_coasts (accessed on 20 September 2024).
- Pantusa, D.; D’Alessandro, F.; Frega, F.; Francone, A.; Tomasicchio, G.R. Improvement of a coastal vulnerability index and its application along the Calabria Coastline, Italy. Sci. Rep. 2022, 12, 21959. [Google Scholar] [CrossRef]
- Murali, R.M.; Kumar, P.K.D. Implications of Sea Level Rise Scenarios on Land Use/Land Cover Classes of the Coastal Zones of Cochin, India. J. Environ. Manag. 2014, 148, 124–133. [Google Scholar] [CrossRef]
- Woodruff, J.D.; Irish, J.L.; Camargo, S.J. Coastal flooding by tropical cyclones and sea-level rise. Nature 2013, 504, 44–52. [Google Scholar] [CrossRef]
- Klijn, F.; Kreibich, H.; De Moel, H.; Penning-Rowsell, E. Adaptative flood risk management planning based on a comprehensive flood risk conceptualization. Mitig. Adapt. Strateg. Glob. Change 2015, 20, 845–864. [Google Scholar] [CrossRef]
- USGS—United States Geological Survey. Coastal Vulnerability Assessment of the Northem Gulf of Mexico to Sea-Level Rise and Coastal Change; U.S. Geological Survey: Reston, VA, USA, 2010. Available online: https://pubs.usgs.gov/of/2010/1146/html/methods.html (accessed on 20 October 2020).
- Passos, A.S.; Dias, F.F.; Barros, S.R.S.; Santos, P.R.A.; Souza, C.R.G.; Vargas, R. Sea level rise and its likely impacts: A case study in the coast of Mangaratiba-RJ. Pan-Am. J. Aquat. Sci. 2018, 13, 260–272. Available online: https://panamjas.org/pdf_artigos/PANAMJAS_13(4)_260-272.pdf (accessed on 22 October 2020).
- Jonkman, S.N.; Hillen, M.M.; Nicholls, R.J.; Kanning, W.; Van Ledden, M. Costs of adapting coastal defences to sea-level rise-new estimates and their implication. J. Coast. Res. 2013, 29, 1212–1226. [Google Scholar] [CrossRef]
- Zhang, Y.; Li, W.; Sun, G.; Miao, G.; Noormets, A.; Emanuel, R.; King, J.S. Understanding coastal wetland hydrology with a new regional scale process-based hydrologic model. Hydrol. Process. 2018, 32, 3158–3173. [Google Scholar] [CrossRef]
- Osilieri, P.R.G.; Seoane, J.C.S.; Dias, F.F. Coastal Vulnerability Index revisited: A case study from Maricá, RJ, Brazil. Coastal Vulnerability Index revisto: Estudo de caso para Maricá, RJ, Brasil. Rev. Bras. Cartogr. 2020, 72, 81–99. [Google Scholar] [CrossRef]
- Dada, O.A.; Almar, R.; Morand, P. Coastal vulnerability assessment of the West African coast to flooding and erosion. Sci. Rep. 2024, 14, 890. [Google Scholar] [CrossRef]
- Ferreira, V.L.D.; Pereira, E.S.; Mello, L.P.S.; Silva, R.A.G.; Dias, F.F. Optimistic Scenario of 0.50m Mean Sea Level Rise and Possible Environmental Impacts, Resulting from Tidal Variations, in the City of Niterói, Rio de Janeiro–Brazil. Coasts 2023, 3, 209–226. [Google Scholar] [CrossRef]
- NOAA—National Oceanic and Atmospheric Administration. Global and Regional Sea Level Rise Scenarios for the United States; NOAA/Technical Report NOS CO-OPS083; NOAA: Silver Spring, MD, USA, 2017. Available online: https://tidesandcurrents.noaa.gov/publications/techrpt83_Global_and_Regional_SLR_Scenarios_for_the_US_final.pdf (accessed on 10 July 2019).
- NOAA—National Oceanic and Atmospheric Administration. Reporting on the State of the Climate in 2023; NOAA: Silver Spring, MD, USA, 2024. Available online: https://www.ncei.noaa.gov/news/reporting-state-climate-2023 (accessed on 5 October 2024).
- Simas, C.S.S.; Lima, J.S.; Sales, R.A.C.; Norte, N.N.B.O.; Norte Filho, A.F.; Silva Filho, E.C.; Cavalcanti, C.C.A.T.; Marinho, E.A.; Paiva Júnior, C.A.V.; Souza, A.P.; et al. Desastres naturais e seus impactos nas cidades: Estudo de caso da enchente histórica ocorrida no ano de 2024 no Rio Grande do Sul–Brasil (Natural disasters and their impact on cities: A case study of the historic flood of 2024 in Rio Grande do Sul–Brazil). Contrib. Cienc. Soc. 2024, 17, 1–16. [Google Scholar] [CrossRef]
- Nordstron, K.F.; Jackson, N.L.; Rafferty, P. Mitigating the effects of bulkgeads on the Bay Shore of Fire Island National Seashore. In Puget Sound Shorelines and the Impacts of Armoring—Proceedings of a State of the Science Workshop; Shipman, H., Dethier, M.N., Gelfenbaum, G., Fresh, K.L., Dinicola, R.S., Eds.; US Geological Survey Scientific Investigations Report; US Department of the Interior: Washington, DC, USA, 2010; Volume 5354, pp. 57–64. Available online: https://www.researchgate.net/publication/265223946_Mitigating_the_Effects_of_Bulkheads_on_the_Bay_Shore_of_Fire_Island_National_Seashore/link/571f53d408aeaced788aa79a/download (accessed on 15 October 2020).
- U.S. Army Corps of Engineers. Shore Protection Manual, 4th ed.; Department of the Army, Waterways Experiment Station, Corps of Engineers, Coastal Engineering Research Center; Superintendent of Documents, U.S. Government Printing Office: Washington, DC, USA, 1984; Volume II. Available online: https://luk.staff.ugm.ac.id/USACE/USACE-ShoreProtectionManual1.pdf (accessed on 10 July 2020).
- Mangor, K.; Droken, N.K.; Kaergaard, K.H.; Kristensen, S.E. Shoreline Management Guidelines; DHI: Copenhagen, Denmark, 2017; p. 453. Available online: https://www.dhigroup.com/upload/campaigns/shoreline/assets/ShorelineManagementGuidelines_Feb2017-TOC.pdf (accessed on 11 June 2020).
- IEMA—Instituto Estadual de Meio Ambiente e Recursos Hídricos (State Institute for the Environment and Water Resources). Governo do Estado do Espírito Santo (Government of the State of Espírito Santo). Curso Básico de Percepção de Risco Geológico. Obras de Contenção de Processos Erosivos e Medidas Mitigadoras (Basic Course in Geological Risk Perception. Erosion Containment Works and Mitigation Measures); IEMA: Espírito Santo, Brasil, 2017. Available online: https://defesacivil.es.gov.br/Media/defesacivil/Capacitacao/Material%20Did%C3%A1tico/CBPRG%20-%202017/Obras%20de%20Conten%C3%A7%C3%A3o%20de%20Processos%20Erosivos%20e%20Medidas%20Mitigadoras.pdf (accessed on 22 July 2020).
- Saengsupavanich, C.; Ariffin, E.H.; Yun, L.S.; Pereira, D.A. Environmental impact of submerged and emerged breakwaters. Heliyon 2022, 8, e12626. Available online: https://www.sciencedirect.com/science/article/pii/S2405844022039147 (accessed on 15 November 2024). [CrossRef] [PubMed]
- Zhang, K.; Dittmar, J.; Ross, M.; Bergh, C. Assesment of sea level rise impacts on human population and real property in the Florida Keys. Clim. Change 2011, 107, 129–146. [Google Scholar] [CrossRef]


| Matrix of Coastal Environmental Vulnerabilities | ||||
|---|---|---|---|---|
| Aspects | Indicators | Description | Variables | Score |
| Phisical | Degree of exposure to waves | Types of waterfronts, according to concepts predefined by the Niterói Waterfront Project. In cases where there is a predominance of consolidated rigid urban structures (altered shoreline) or a predominance of rocky material, minimum score was applied. | Predominance of rigid structures. | 1 |
| Sheltered. | 2 | |||
| Semi-sheltered. | 3 | |||
| Exposed. | 4 | |||
| Biological | Percentage of natural areas protected by law susceptible to the effects of flooding | Proportion of conservation/preservation units or permanent protection strips located below the 10-m elevation. In cases where there are no protected areas, a minimum weighting was applied, depending on the occurrence of other plant formations. | Between 0.0% and 24.9%. | 1 |
| Between 25.0% and 49.9%. | 2 | |||
| Between 50.0% and 74.9%. | 3 | |||
| Between 75.0% and 100%. | 4 | |||
| Socio-economic I | Demographic density | Average population density of the census tracts within the analysis areas, within the 10-m altimetric range. Weighting based on the classification adopted by the IBGE—synopsis of census sectors. | Up to 3744.20 inhabitants/km2. | 1 |
| Up to 8253.71 inhabitants/km2. | 2 | |||
| Up to 15,264.27 inhabitants/km2. | 3 | |||
| Above 15,264.27 inhabitants/km2. | 4 | |||
| Socio-economic II | Per capita income | Average income per capita per month in the census tracts included in the analysis areas, within the 10-m altimetric range. Weighting is based on the classification adopted by the IBGE—synopsis of census sectors. Populations with lower incomes classified as more exposed. | Above R$1800.00/inhabitant/month. | 1 |
| Up to R$1800.00/inhabitant/month. | 2 | |||
| Up to R$1300.00/inhabitant/month. | 3 | |||
| Up to R$1000.00/inhabitant/month. | 4 | |||
| Coastal Environmental Vulnerability Index—CEVI | |
|---|---|
| Application of the Formula CEVI = (V1 + V2 + V3 + V 4)/4 | Classification |
| 1.00 ≤ V ≤ 1.25 | Very Low |
| 1.50 ≤ V ≤ 2.00 | Low |
| 2.25 ≤ V ≤ 2.75 | Medium |
| 3.00 ≤ V ≤ 3.50 | High |
| 3.75 ≤ V ≤ 4.00 | Very High |
| Administrative Planning Regions | Areas of Analysis | Neighborhoods |
|---|---|---|
| North | A1 | Barreto, Cubango, Engenhoca, Fonseca, I. Conceição, Santana e São Lourenço. |
| Bay beaches | A2 | Centro, Fátima, Morro do Estado e Ponta d’Areia. |
| A3 | Gragoatá, Boa Viagem e São Domingos. | |
| A4 | Icaraí, Ingá, Pé Pequeno, Santa Rosa e Vital Brasil. | |
| A5 | Cachoeiras, Charitas, Jurujuba e São Francisco. | |
| Oceanic | A6 | Piratininga, Cafubá e Jardim Imbuí. |
| A7 | Camboinhas. | |
| A8 | Itaipu, Maravista e Santo Antônio. | |
| A9 | Itacoatiara. |
| Coastal Environmental Vulnerability Index in the Municipality of Niterói, Rio de Janeiro, Brazil | ||||||||||
|---|---|---|---|---|---|---|---|---|---|---|
| Areas | V1 | Score | V2 | Score | V3 | Score | V4 | Score | Average | Index |
| A1 | Changed | 1 | Insignificant | 1 | 6.927 | 2 | 603.06 | 4 | 2.00 | Low |
| A2 | Changed | 1 | Non-existence | 1 | 8.785 | 3 | 621.78 | 4 | 2.25 | Medium |
| A3 | Changed | 1 | Insignificant | 1 | 6.417 | 2 | 1208.99 | 3 | 1.75 | Low |
| A4 | Semi-sheltered | 3 | Insignificant | 1 | 33.269 | 4 | 1732.22 | 2 | 2.50 | Medium |
| A5 | Changed | 1 | 42.70% | 2 | 7.135 | 2 | 1269.67 | 3 | 2.00 | Low |
| A6 | Exposed | 4 | 94.37% | 4 | 2.418 | 1 | 827.78 | 4 | 3.25 | High |
| A7 | Exposed | 4 | 100% | 4 | 1.291 | 1 | 1674.87 | 2 | 2.75 | Medium |
| A8 | Exposed | 4 | 23.28% | 1 | 2.042 | 1 | 1260.86 | 3 | 2.25 | Medium |
| A9 | Exposed | 4 | 36.02% | 2 | 537 | 1 | 1255.03 | 3 | 2.50 | Medium |
Disclaimer/Publisher’s Note: The statements, opinions and data contained in all publications are solely those of the individual author(s) and contributor(s) and not of MDPI and/or the editor(s). MDPI and/or the editor(s) disclaim responsibility for any injury to people or property resulting from any ideas, methods, instructions or products referred to in the content. |
© 2025 by the authors. Licensee MDPI, Basel, Switzerland. This article is an open access article distributed under the terms and conditions of the Creative Commons Attribution (CC BY) license (https://creativecommons.org/licenses/by/4.0/).
Share and Cite
Ferreira, V.L.D.; Pereira, E.S.; Souza de Mello, L.P.; Silva, R.A.G.; Dias, F.F. Analysis of Coastal Environmental Vulnerabilities in the Municipality of Niterói, Rio de Janeiro, Brazil, in the Face of Sea Level Rise Projections. Coasts 2025, 5, 11. https://doi.org/10.3390/coasts5010011
Ferreira VLD, Pereira ES, Souza de Mello LP, Silva RAG, Dias FF. Analysis of Coastal Environmental Vulnerabilities in the Municipality of Niterói, Rio de Janeiro, Brazil, in the Face of Sea Level Rise Projections. Coasts. 2025; 5(1):11. https://doi.org/10.3390/coasts5010011
Chicago/Turabian StyleFerreira, Vilmar Leandro Dias, Elizabeth Santos Pereira, Lucas Pluvie Souza de Mello, Rodrigo Amado Garcia Silva, and Fábio Ferreira Dias. 2025. "Analysis of Coastal Environmental Vulnerabilities in the Municipality of Niterói, Rio de Janeiro, Brazil, in the Face of Sea Level Rise Projections" Coasts 5, no. 1: 11. https://doi.org/10.3390/coasts5010011
APA StyleFerreira, V. L. D., Pereira, E. S., Souza de Mello, L. P., Silva, R. A. G., & Dias, F. F. (2025). Analysis of Coastal Environmental Vulnerabilities in the Municipality of Niterói, Rio de Janeiro, Brazil, in the Face of Sea Level Rise Projections. Coasts, 5(1), 11. https://doi.org/10.3390/coasts5010011