Article

The Influence of Functional Materials on the Size of the Lipid Vesicles in Beverages

1
Industrial Research Institute, Aomori Prefectural Industrial Technology Research Center, 221-10 Yamaguchi Nogi, Aomori City 030-0142, Aomori, Japan
2
Hachinohe Industrial Research Institute, Aomori Prefectural Industrial Technology Research Center, 1-4-43 Kita-Inter-Kogyodanchi, Hachinohe City 039-2245, Aomori, Japan
3
The United Graduate School of Agricultural Sciences, Iwate University, 3-18-8 Ueda, Morioka City 020-8550, Iwate, Japan
AppliedChem 2023, 3(3), 366-377; https://doi.org/10.3390/appliedchem3030023
Submission received: 4 July 2023 / Revised: 12 July 2023 / Accepted: 17 July 2023 / Published: 19 July 2023

Abstract

:
By investigating the hydrophobic properties and functional components including ethyl caproate (EC), caproic acid (CA), isoamyl acetate (IA), isoamyl alcohol (IAA), isovaleraldehyde (IVA), and procyanidin B2 (PB2) in beverages, one can incorporate them with 1,2-dioleoyl-sn-glycero-3-phosphocholine (DOPC) lipids to create cell-sized lipid vesicles. The aim of this study was to explore the correlation between the concentration of flavors or functional compounds and the size of the lipid vesicles. It was observed that EC, CA, IA, and IAA decreased the size of lipid vesicles. In contrast, IVA and PB2 increased their size. To comprehend this correlation, both the chemical structure of these compounds in relation to DOPC membranes and the fluidity of the membranes were considered. The size of the lipid vesicles was influenced by the molecular interactions between the compounds and DOPC. Those were caused by, in particular, the balance between hydrophobicity and hydrophilicity. Compounds with higher hydrophobicity tended to decrease the size of the lipid vesicles, whereas compounds with greater hydrophilicity had the opposite effect, leading to an increase in size. These findings suggest that the size of lipid vesicles can serve as a potential indicator for rapidly evaluating the concentration of these components in beverages.

1. Introduction

Biological cell membranes consist of phospholipid bilayers [1]. In recent years, there has been growing interest in cell-sized lipid vesicles as a simplified model for studying cell membranes, owing to their resemblance to lipid bilayers [2,3]. These vesicles, with a diameter of approximately 10 µm, are sufficiently large to facilitate real-time observation under a microscope. As a result, cell-sized lipid vesicles, which closely mimic the size and membrane composition of actual cells, have emerged as a valuable model system for investigating cellular membranes [2,3]. The author of this study has investigated the characteristics of membranes containing functional compounds, including oxidized cholesterol, capsaicin, and polyphenols [4,5,6,7,8,9,10,11]. Previous studies have reported interesting findings regarding the effects of oxidized cholesterol and capsaicin on the thermo-responsiveness of lipid vesicles [4,6,7,8,9]. Specifically, these compounds were found to increase the sensitivity of lipid vesicles to changes in temperature, resulting in enhanced dynamic shape changes [4,6,7,8,9]. Additionally, investigations have revealed that polyphenols can induce dynamic shape changes in lipid vesicles [10,11]. The observed patterns of shape changes were found to be dependent on the specific chemical structures of the polyphenols studied [10,11]. These discoveries highlight the complex and diverse interactions between functional compounds and lipid vesicles, shedding light on the mechanisms underlying their effects on membrane properties and dynamics. The insights gained from these studies contribute to our understanding of the behavior of lipid vesicles in the presence of bioactive compounds, paving the way for further research on their potential applications in fields such as drug delivery, biomaterials, and biophysical studies.
Ethyl caproate (EC) and isoamyl acetate (IA) are renowned flavor compounds widely present in various beverages and food products [12,13,14,15]. These flavor components have a well-established reputation for enhancing the overall quality of beverages and foods, leading to efforts aimed at increasing their production. The production pathway for EC and IA has been elucidated [16], and specific strains of yeast that are resistant to cerulenin (for EC production) [12,16,17,18,19] and 5,5,5-trifluoro-DL-leucine (for IA production) [16,20] have been developed to improve their yields.
Sake, a traditional Japanese alcoholic beverage, is produced through the brewing process using rice and various microorganisms, including yeast. During this brewing process, specific techniques are employed to enhance the production of EC and IA, which are key flavor compounds in sake. These techniques include the use of high-quality rice, maintaining low temperatures during fermentation, utilizing specific yeast strains, and carefully determining the optimal timing to halt fermentation. As a result, specialized yeast strains have been developed that exhibit high productivity in generating EC or IA [12,13,14]. EC is derived from the condensation of caproic acid (CA) and ethanol [13], while IA is synthesized from isoamyl alcohol (IAA) through alcohol acyltransferase activity [21]. It should be noted that CA and IAA not only serve as precursors for flavors but are also associated with undesirable taste characteristics [16]. CA is known for its characteristic rancid goaty flavor, which is often considered undesirable in sake production [22]. Similarly, a high concentration of IAA can impart a heavy flavor to sake and negatively impact its overall quality [20]. Additionally, IAA is associated with solvent odors, further contributing to its undesirability [16]. Due to these factors, CA and excessive levels of IAA are generally considered undesirable in sake production.
On the other hand, isovaleraldehyde (IVA), an important flavor compound contributing to cocoa flavors [23], is utilized to enhance the quality of food products. Previous research utilizing nanoscale lipid vesicles has reported that isovaleraldehyde (IVA) exhibits interactions with lipid membranes [24]. These findings suggest that the unique characteristics of IVA can be utilized in the screening and development of functional polymers [24]. However, it is worth mentioning that while some individuals greatly appreciate the presence of IVA in sake, there are others who do not prefer sake with such characteristics.
Procyanidin, in contrast to flavors, is recognized as an important functional compound found in fruits, including apples, fruit juices, and alcoholic beverages derived from fruits. Experimental studies involving high-fat diet experiments have demonstrated that a diet enriched with a substantial quantity of procyanidin derived from black soybeans can effectively prevent lipid accumulation in mice [25]. The research team led by the author has devised a method to concentrate fruit juice obtained from apples for the production of fermented beverages [26,27]. In order to accurately assess the concentration levels, the sugar content and procyanidin levels were measured [26].
The author’s research team investigated the flavors EC, CA, IA, IAA, and IVA to examine their influence on sake production and brewing processes. These flavors exhibit varying strengths and have been found to impact the size of lipid vesicles and their concentration [28,29,30]. These studies aimed to investigate the impact of specific flavors and functional compounds on the size changes of cell-sized lipid vesicles, with the goal of exploring their potential for evaluating the quality of beverages. In summary, the presence of EC, CA, IA, and IAA led to a reduction in the size of lipid vesicles, while IVA caused an increase in size. The author previously conducted research on the size of lipid vesicles containing procyanidin [31]. Interestingly, PB2 was also found to increase the size of lipid vesicles. In the present study, the effects of these functional materials in beverages were compared based on the results of previous studies [28,29,30,31]. This study aims to contribute to our understanding of the interaction between membranes and functional compounds, providing valuable insights in this field. These insights can be useful for potential applications in the quality evaluation of beverages, as well as for research and development in the beverage industry.

2. Materials and Methods

2.1. Materials

1,2-dioleoyl-sn-glycero-3-phosphocholine (DOPC) and isoamyl alcohol (IAA) were obtained from Tokyo Chemical Industry Co Ltd. (Tokyo, Japan). Caproic acid (CA) and chloro-form were acquired from Aldrich (St. Louis, MO, USA) and Kanto-Chemical (Tokyo, Japan), respectively. Ethyl caproate (EC), isoamyl acetate (IA), acetone, methanol, and glucose were obtained from Wako Pure Chemical (Osaka, Japan). Ethanol and procyanidin B2 (PB2) were acquired from FU-JIFILM Wako pure chemical (Osaka, Japan). Ultrapure water obtained from a Millipore Milli-Q purification system (Millipore, Bedford, MA, USA) was used for reagent preparation and the cleaning of glassware. The chemical structures of the compounds used are depicted in Figure 1. Lipid membranes are represented by lipid vesicles, which were prepared using specific materials. The characteristic preparations of these membranes will be explained in the next section.

2.2. Preparation of Lipid Vesicles

The glass test tubes were initially washed with acetone and dried using a draft under a hood. Subsequently, various lipid vesicles, including giant unilamellar vesicles and model membranes/liposomes, were prepared. The natural swelling of dry lipid films was performed following a modified version of a method previously published by our research group [28,29,30,31].
To form thin lipid films, mixtures of lipids (DOPC) and EC, CA, IA, IAA, IVA, or PB2 were dissolved in chloroform in glass test tubes in a nitrogen gas environment and then dried in a vacuum using a vacuum pump (LMP-100, AS ONE CORP., Osaka, Japan) for 3 h. The dried films were then hydrated overnight with ultrapure water at room temperature (20 °C), resulting in a final lipid concentration of 0.2 mM. It is important to note that the formation of unilamellar vesicles is highly sensitive to preparation conditions, and thus the sample preparation conditions were meticulously adjusted. Prior to hydration, the thin lipid films were kept in a vacuum. During the hydration process, the test tubes were double-wrapped with Parafilm and aluminum foil to prevent oxidation. Subsequently, the test tubes were stored in a dark drawer at a constant temperature until observation, which occurred within a week. An image depicting a typical lipid vesicle can be seen in Figure 1H.

2.3. Microscopic Observation of Lipid Vesicls

A 6 µL lipid vesicle solution was prepared following the aforementioned method. The solution was carefully placed in 0.2 mm silicon wells on a glass slide and covered with a small coverslip. Utilizing a phase-contrast microscope (BX53, Olympus, Tokyo, Japan) at room temperature, the lipid vesicles were observed as described in previous studies [28,29,30,31].
For each type of lipid vesicle, a minimum of 30 lipid vesicles were randomly selected for observation, and their diameters were measured. This approach ensured an adequate sample size and helped to mitigate potential biases in the measurements. To validate the results and minimize any possible bias, some experiments were repeated by an independent individual. Additionally, lipid vesicles were prepared using at least three different preparations to confirm the absence of significant biases in each preparation.

2.4. Statistical Analysis

The acquired images were processed using ImageJ software 1.8.0 [32]. For data analysis, a total of 30 independent experiments were conducted, and the results were presented as the mean ± standard error. To compare the size of lipid vesicles, the actual size of each lipid vesicle was divided by the size of the control lipid vesicle in each experiment. Data calculation and statistical analysis were performed using Microsoft Excel 2019.
The diameters of the lipid vesicles exhibited Gaussian distribution profiles, suggesting a normal distribution of data dispersion. As a result, the average size and standard error were utilized to represent the lipid vesicle diameters.

3. Results and Discussion

3.1. Experimental Results

In our previous studies [28,29,30], we prepared lipid vesicles containing various key flavors, including ethyl caproate (EC), caproic acid (CA), isoamyl acetate (IA), isoamyl alcohol (IAA), and isovaleraldehyde (IVA), at concentrations ranging from 10% to 50%. In these studies, we compared the actual sizes of the lipid vesicles. In the present study, we were able to compare the sizes of liposomes from previous studies with the latest results by calculating the size ratios relative to the control lipid vesicles made with 1,2-dioleoyl-sn-glycero-3-phosphocholine (DOPC).
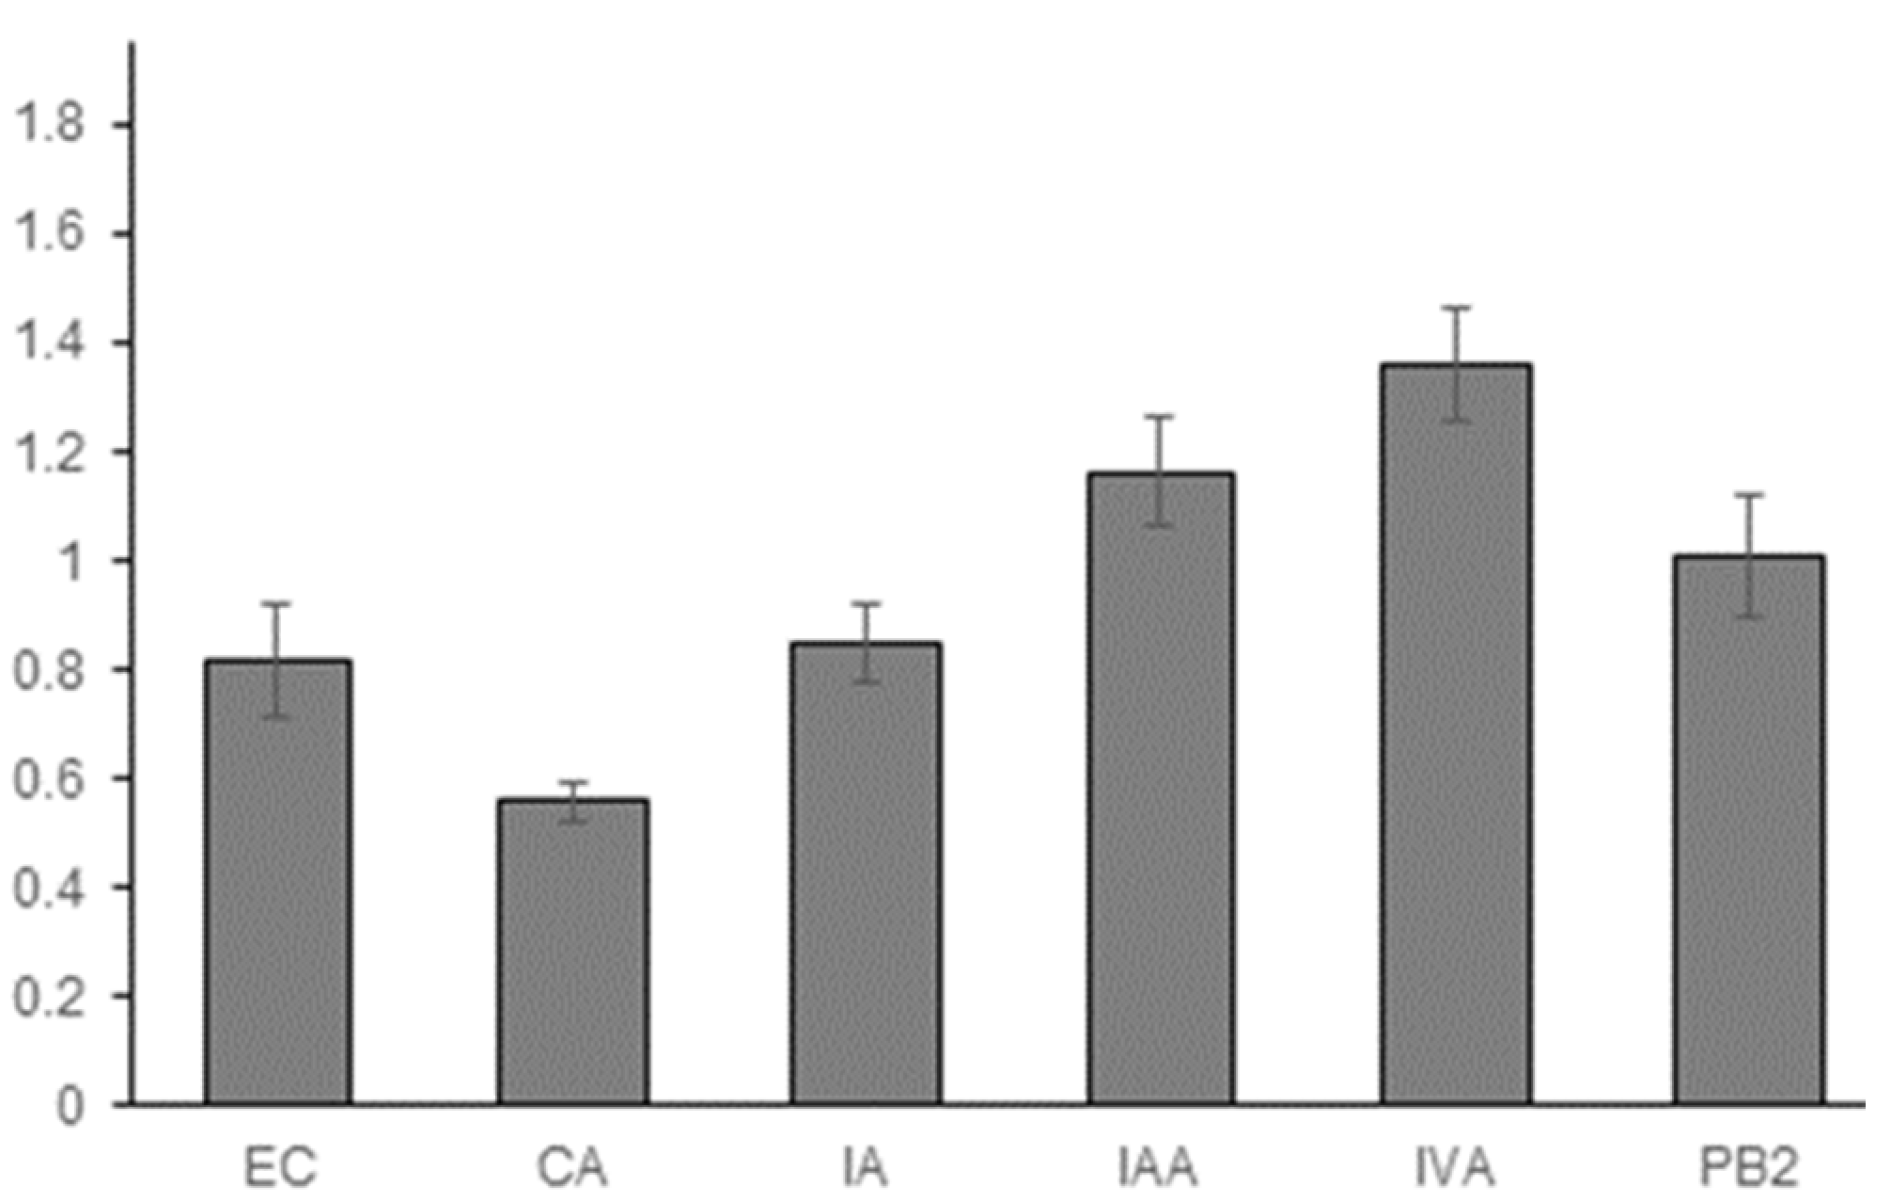
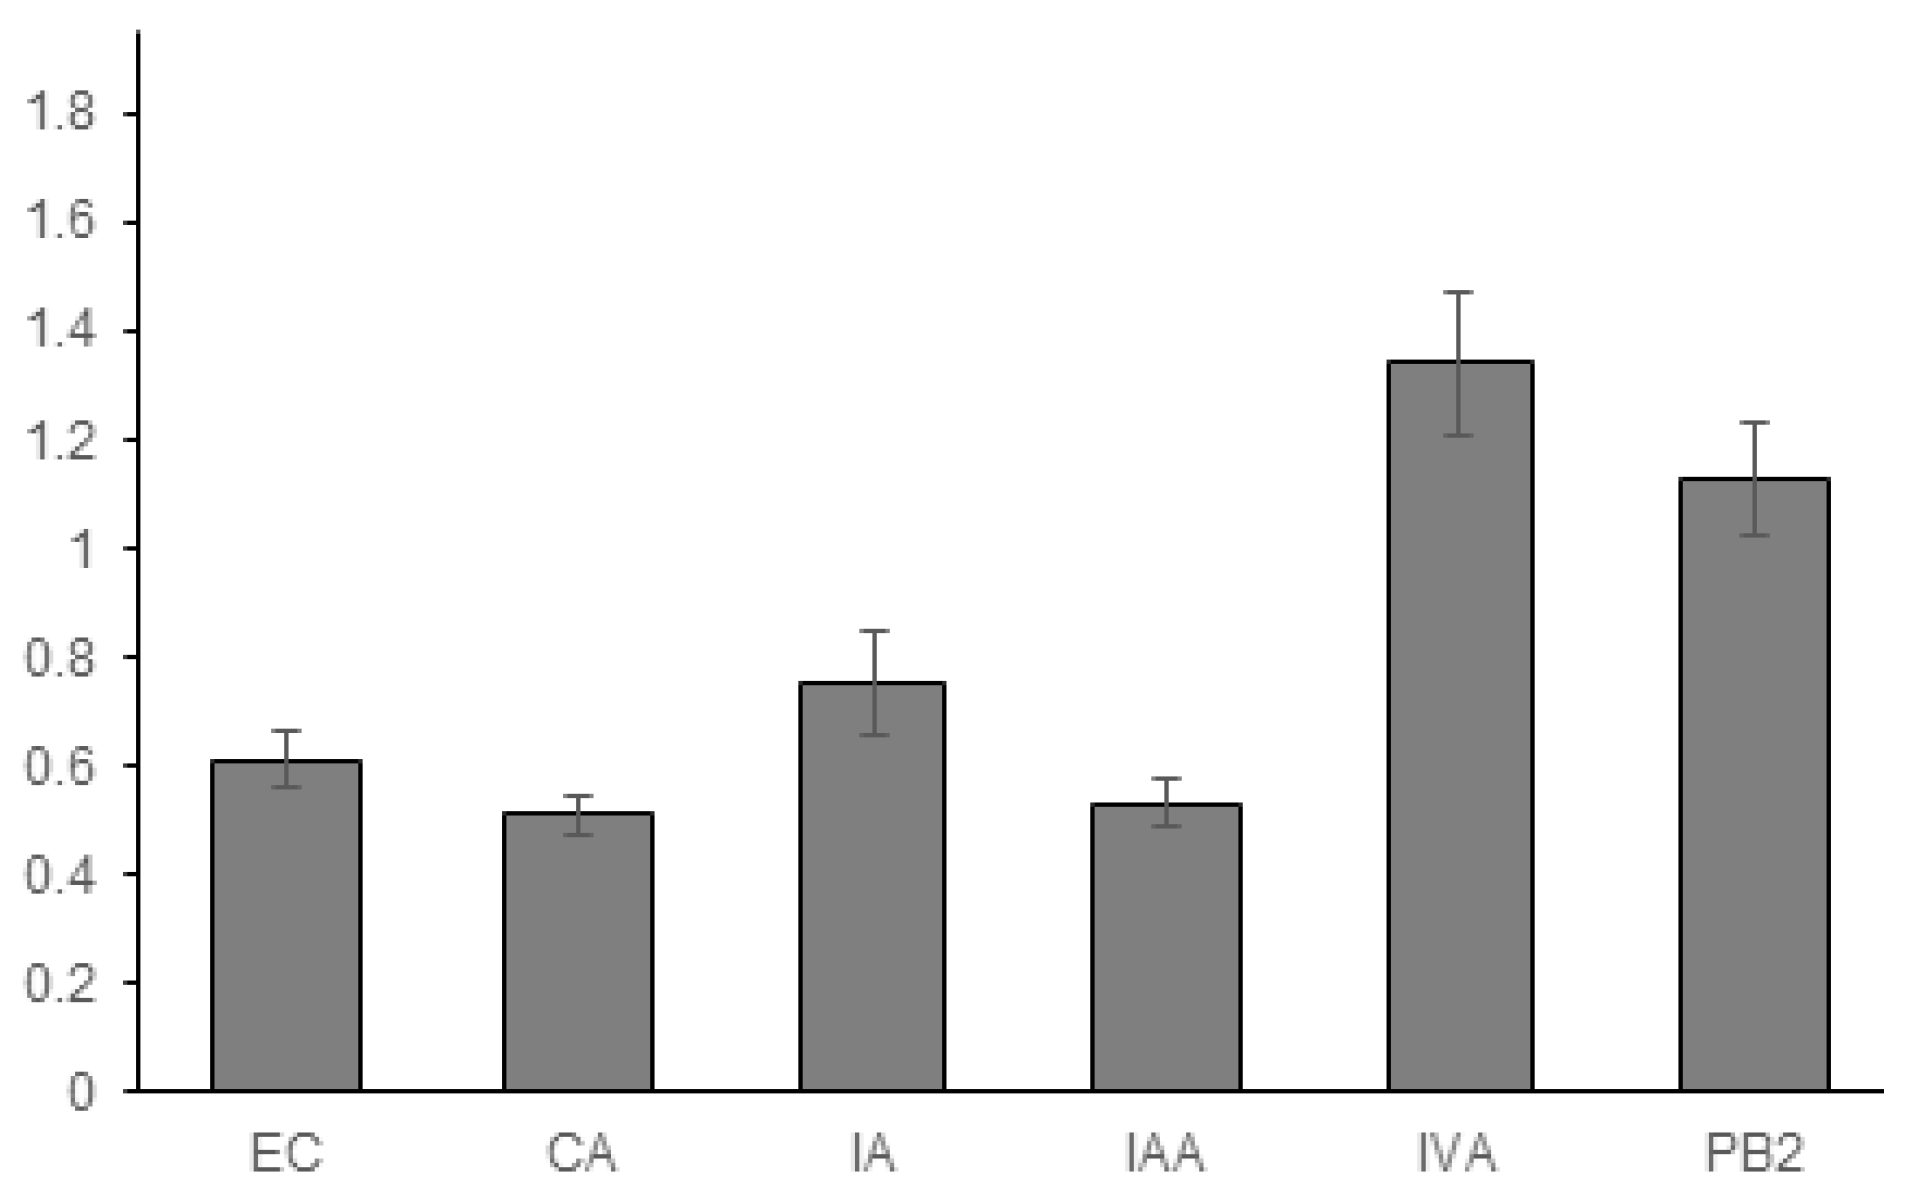
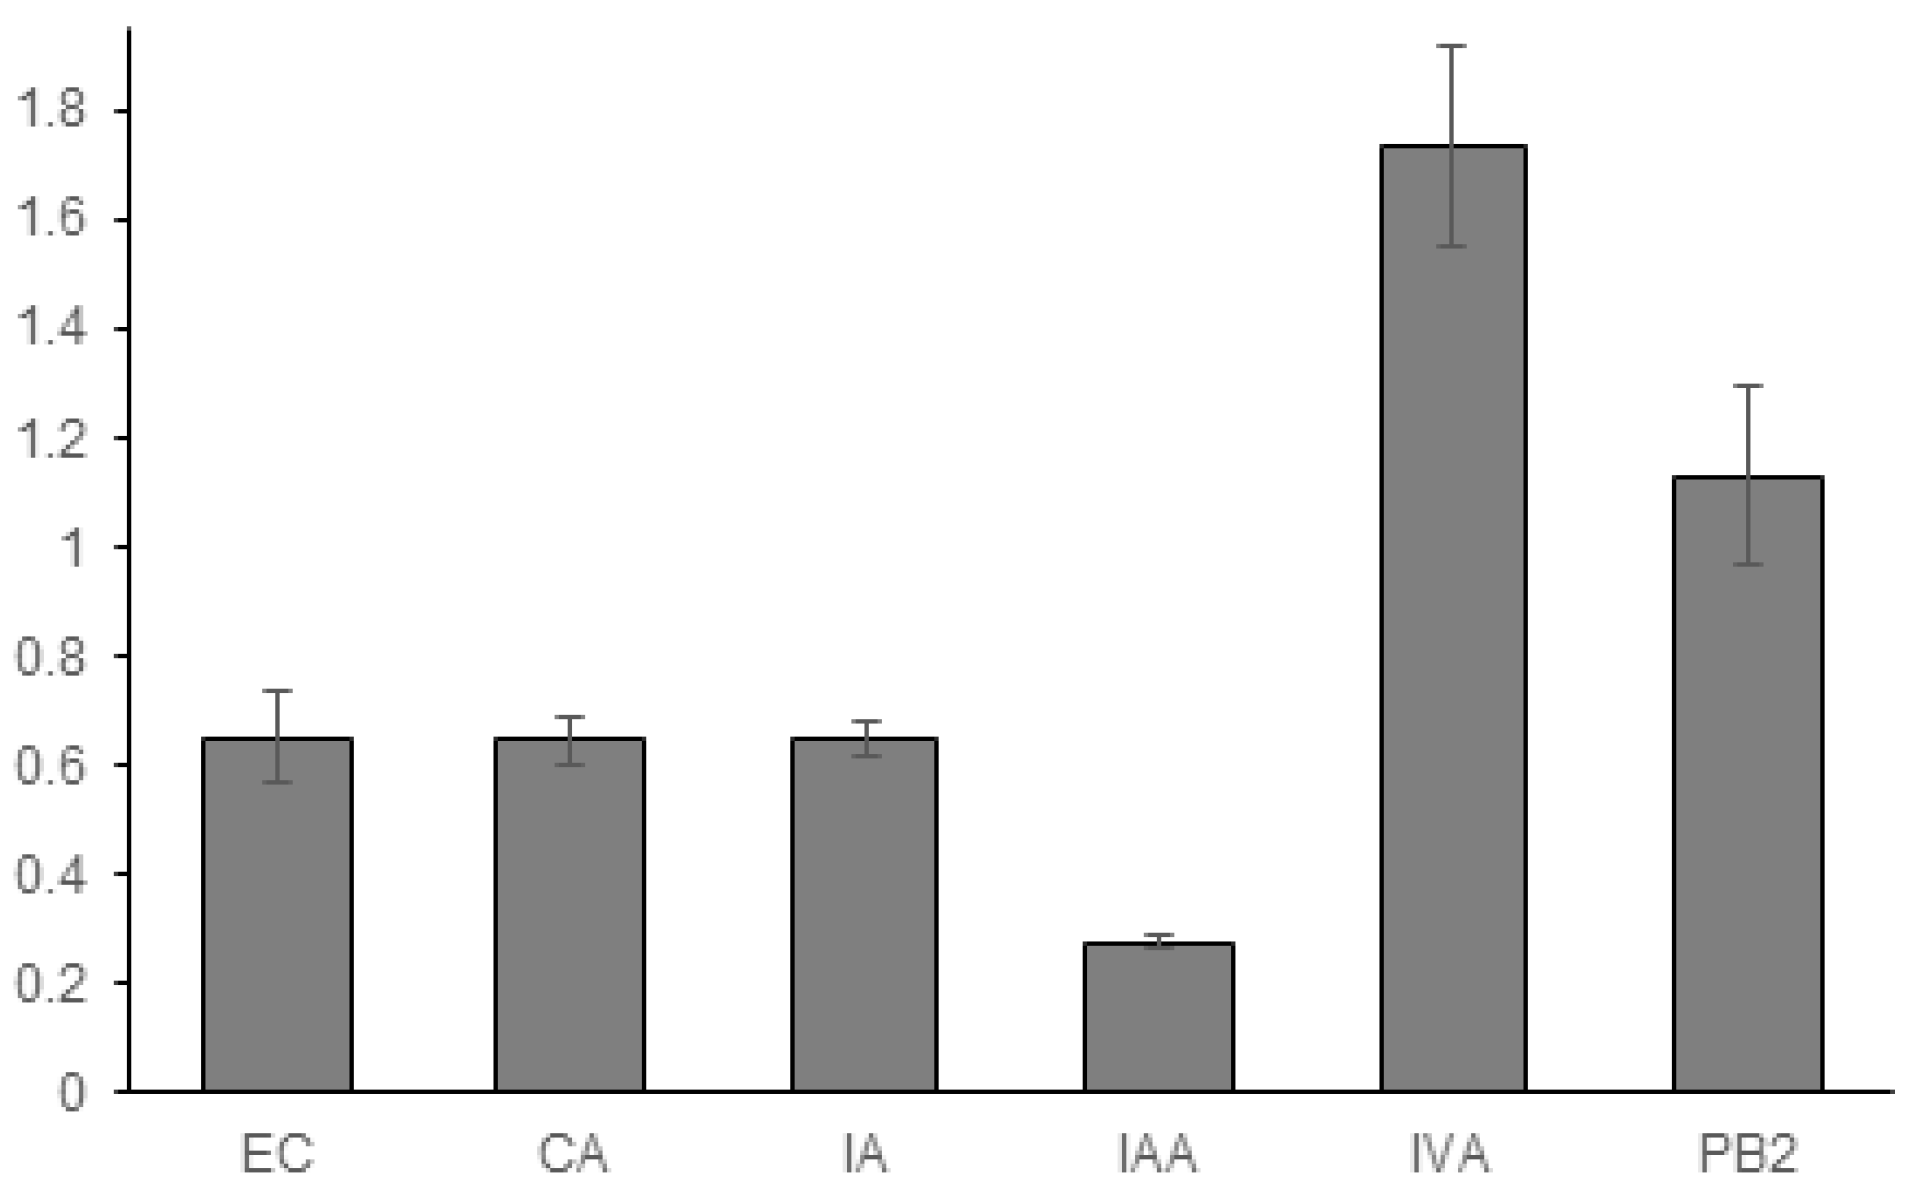
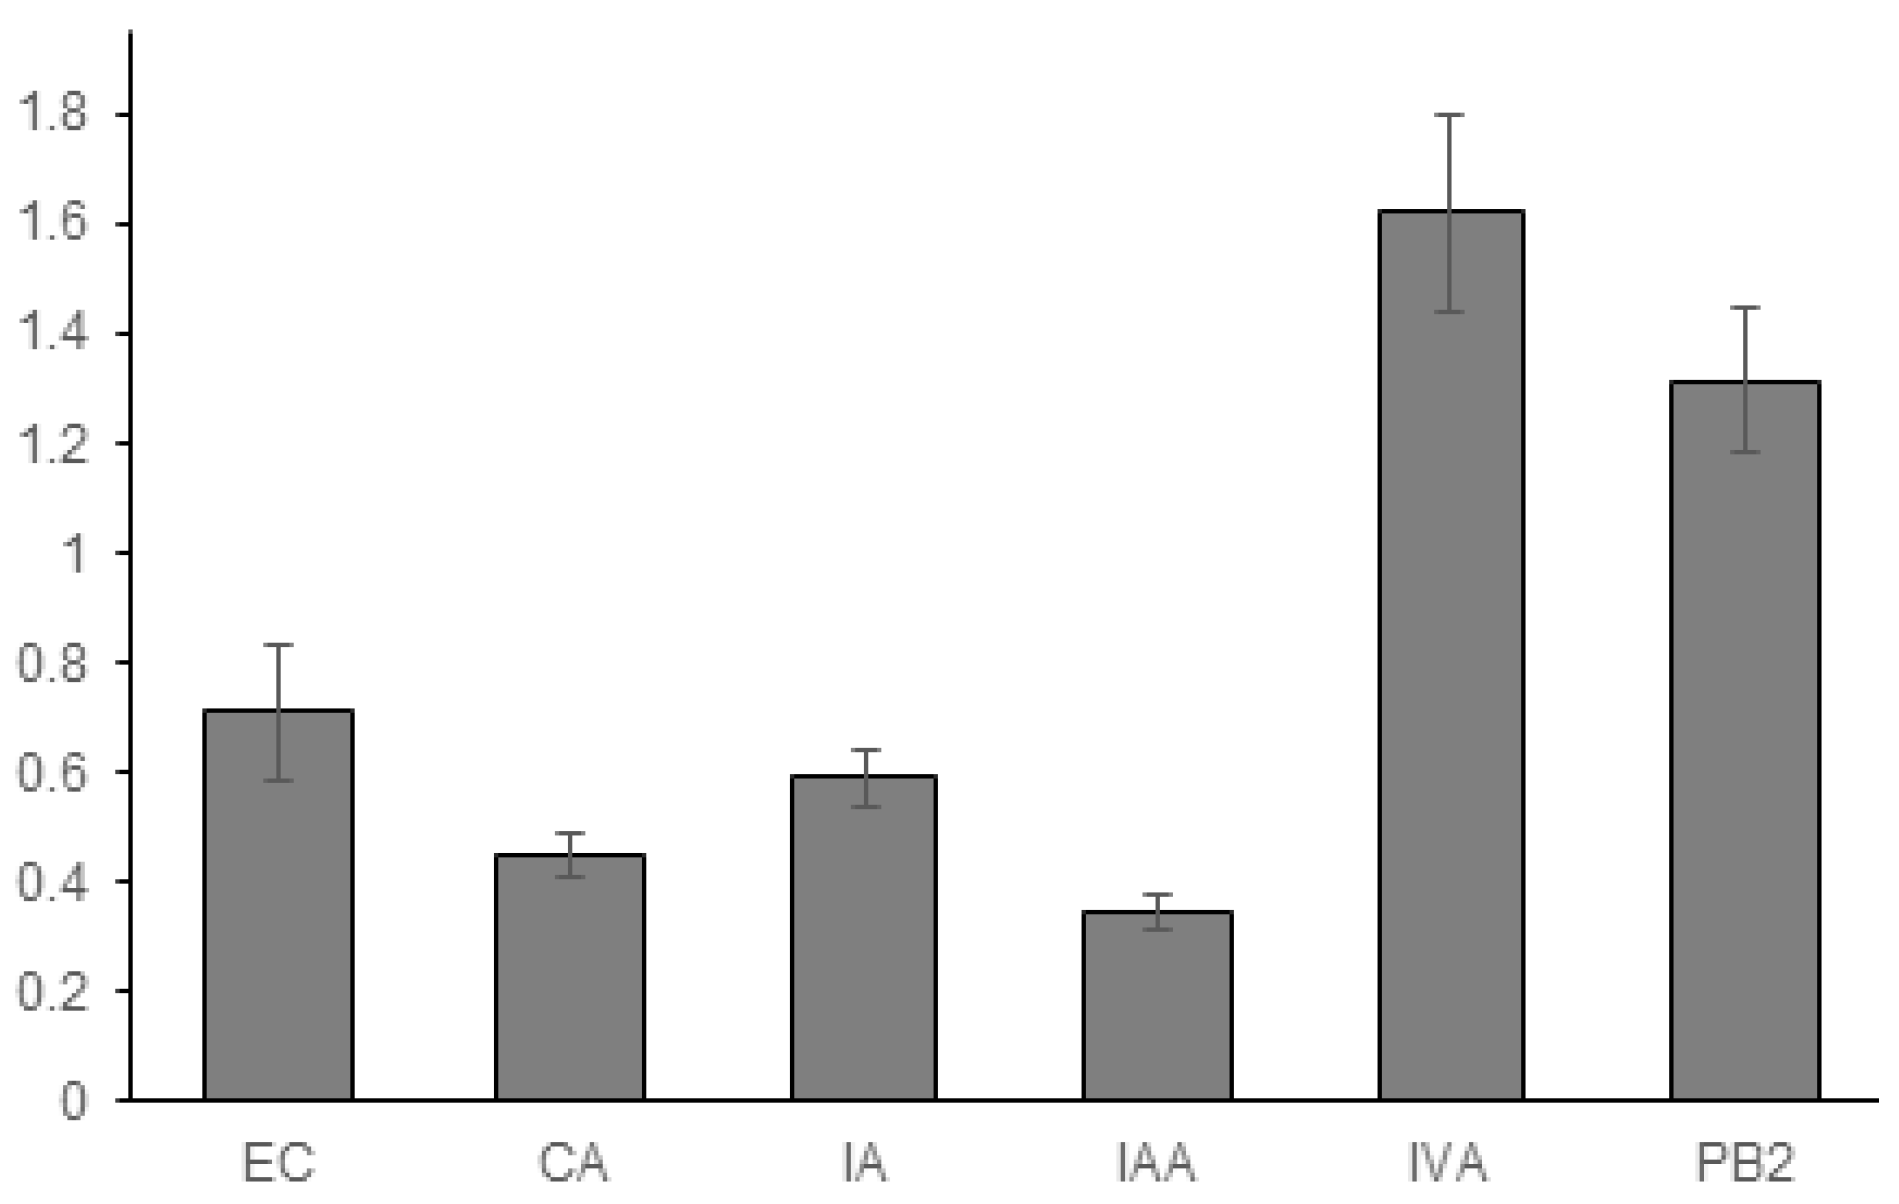
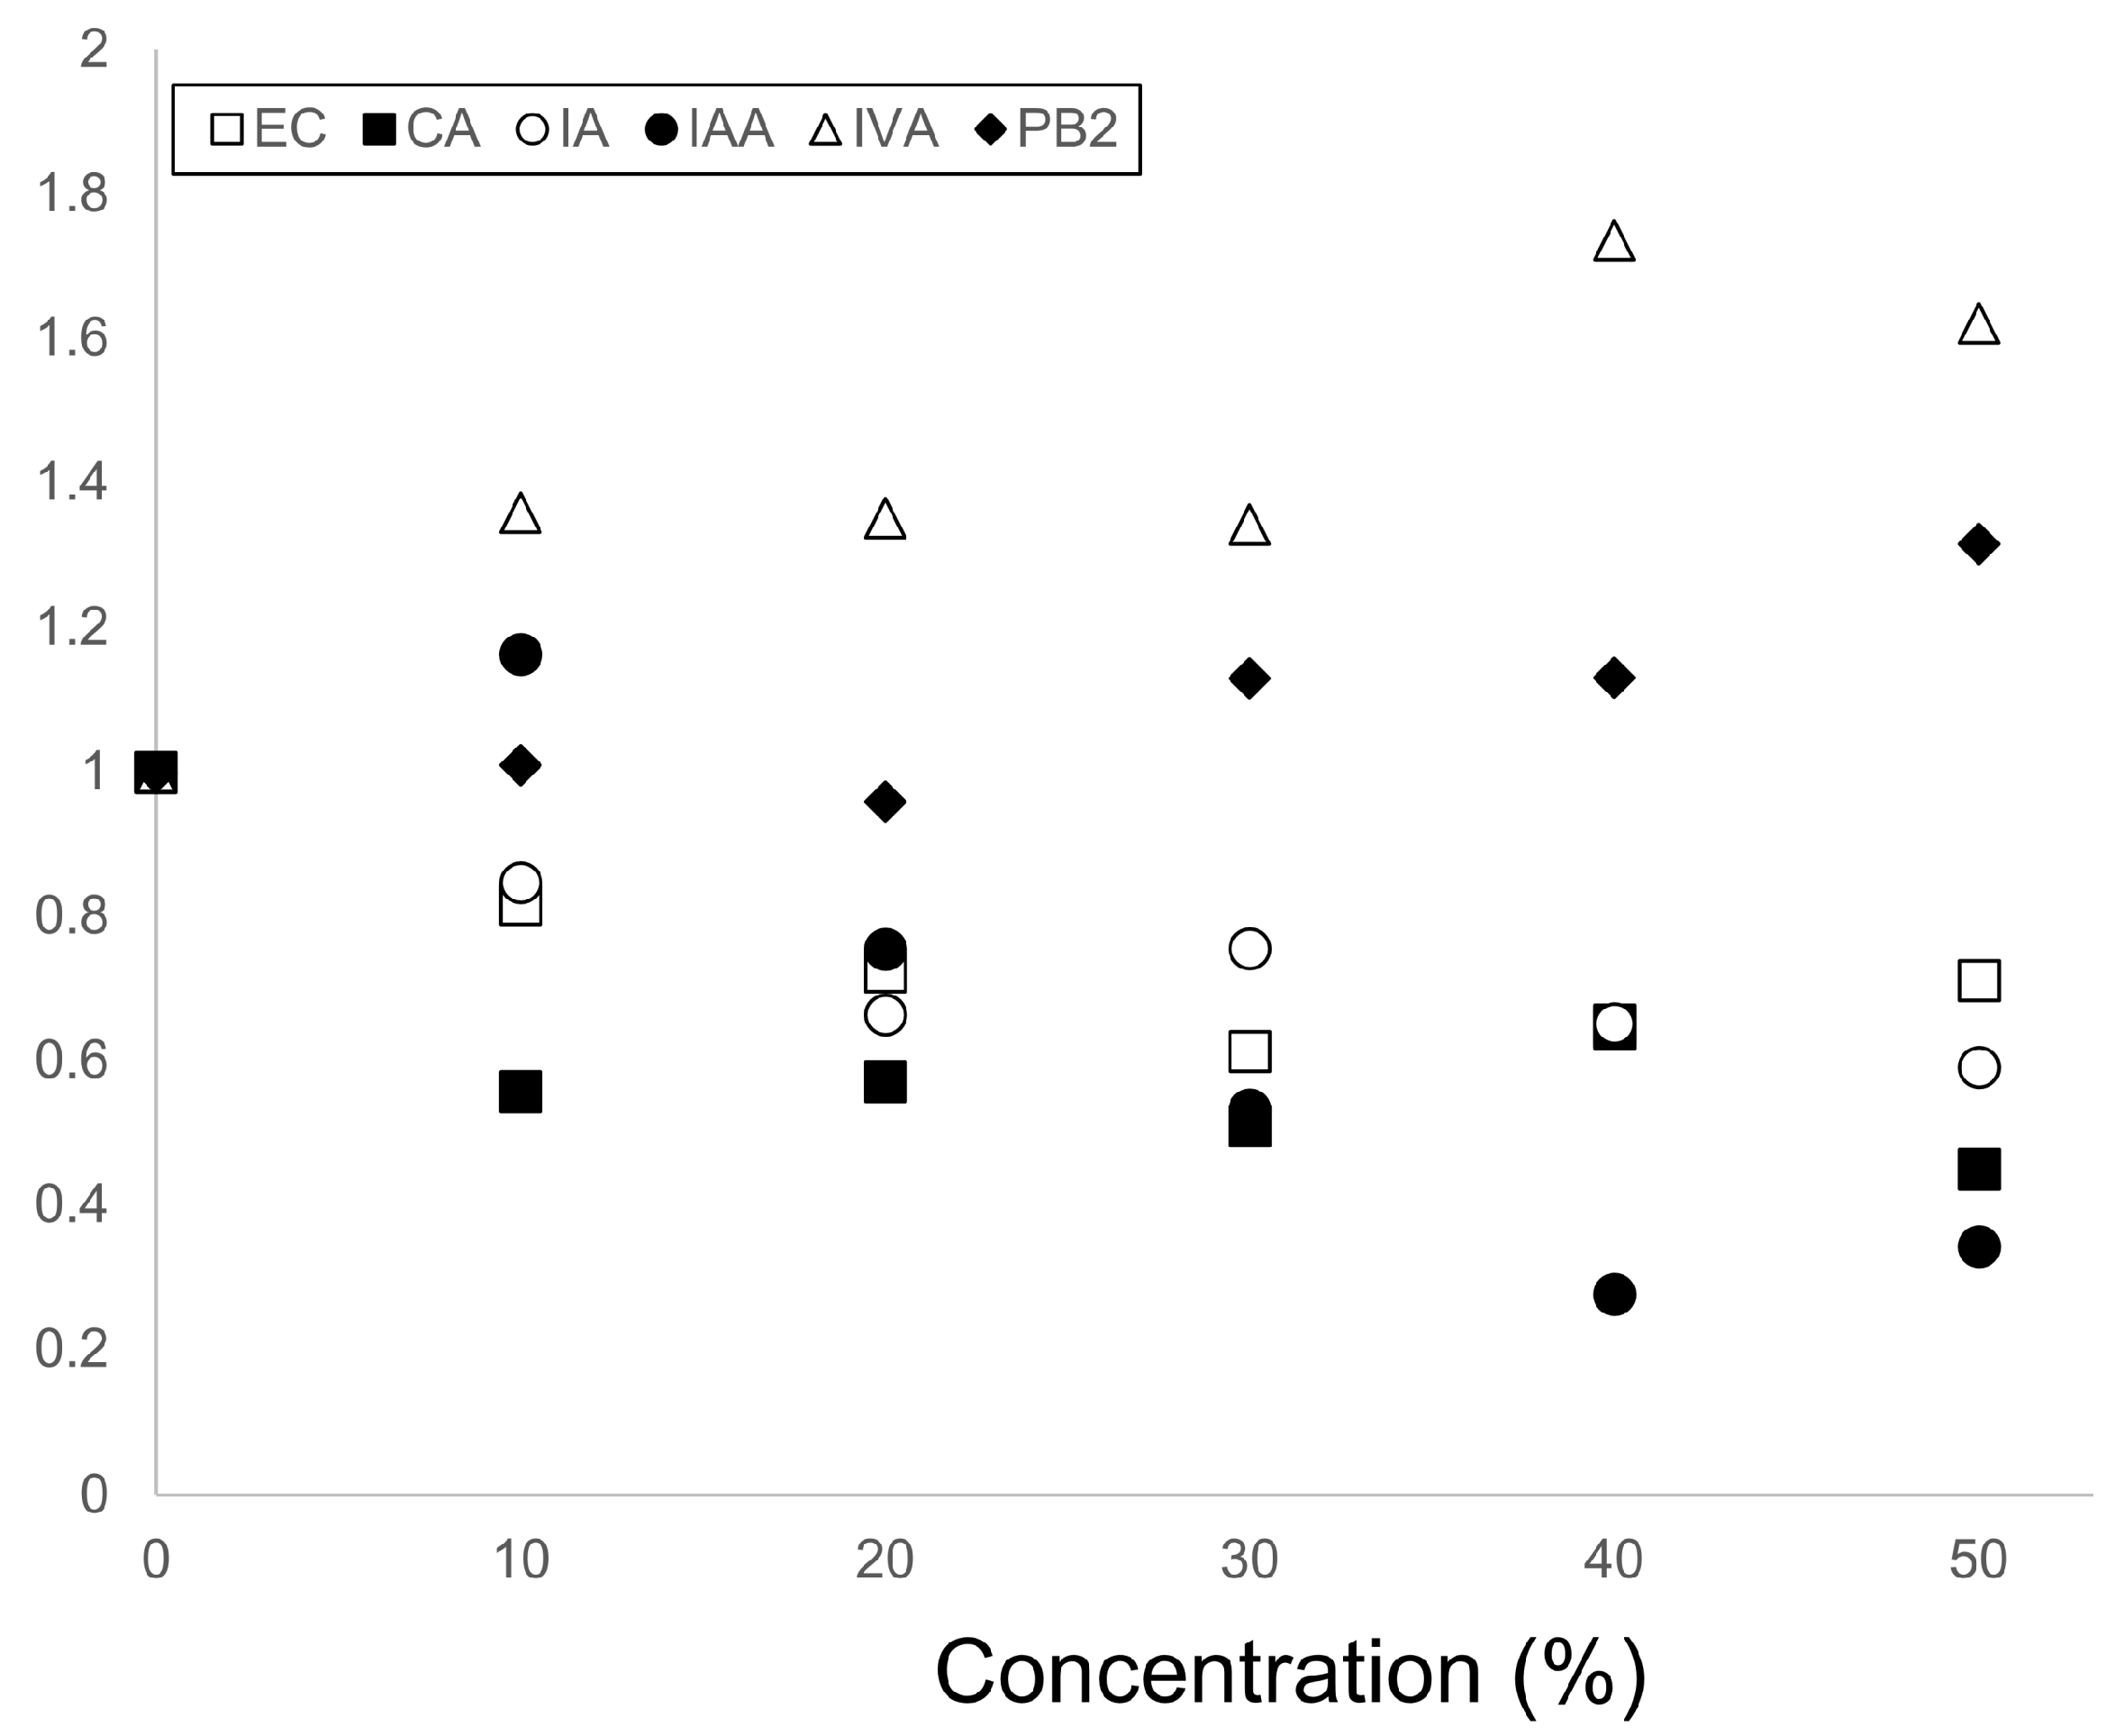
To evaluate the differences in the effects of flavors and functional compounds on the lipid vesicles, I compiled the data at the same concentrations on the membranes. I also created six figures that represent the results at 10% (Figure 2), 20% (Figure 3), 30% (Figure 4), 40% (Figure 5), 50% (Figure 6) concentrations, and a summary figure (Figure 7). Each figure will be explained in detail.
In the lipid vesicle observation experiment at a 10% concentration, as shown in Figure 2, the largest lipid vesicle size was observed in the case of isovaleraldehyde (IVA). At this concentration, isoamyl alcohol (IAA), isovaleraldehyde (IVA), and procyanidin B2 (PB2) had the effect of increasing the size of the lipid vesicles. The effects of IVA and IAA, as well as IAA and PB2, were not particularly significant. However, there was a significant difference in the effects of IVA and PB2.
On the other hand, ethyl caproate (EC), caproic acid (CA), and isoamyl acetate (IA) had the effect of decreasing the size of the lipid vesicles. Among them, the effect of CA in reducing the size was the strongest. The effects of EC and IA on size reduction were not significantly different. However, there was a significant difference in the effects of EC and CA, as well as IA and CA.
Figure 3 presents the observational outcomes of lipid vesicles containing various compounds at a concentration of 20%. Similar to the results for a 10% concentration, the largest lipid vesicles were observed in the presence of isovaleraldehyde (IVA). At this particular concentration, IVA exhibited a size-enhancing effect on the lipid vesicles. Conversely, ethyl caproate (EC), caproic acid (CA), isoamyl acetate (IA), and isoamyl alcohol (IAA) demonstrated a size-reducing effect on the lipid vesicles. Among these compounds, caproic acid (CA) exerted the most potent effect in reducing the size. The effects of ethyl caproate (EC), isoamyl acetate (IA), and isoamyl alcohol (IAA) on size reduction were not significantly distinguishable. However, procyanidin B2 (PB2) did not have a significant impact on the size alteration of the lipid vesicles at a 20% concentration.
In Figure 4, lipid vesicles containing compounds at a 30% concentration were observed, and the largest lipid vesicles were observed in the case of isovaleraldehyde (IVA). At this concentration, both IVA and procyanidin B2 (PB2) had the effect of increasing the size of the lipid vesicles. On the other hand, ethyl caproate (EC), caproic acid (CA), isoamyl acetate (IA), and isoamyl alcohol (IAA) had the effect of decreasing the size of the lipid vesicles. The effects of EC and IA, as well as CA and IAA, on size reduction were not significantly different from each other.
In Figure 5, the examination focused on lipid vesicles containing compounds at a concentration of 40%. The largest lipid vesicles were observed in the presence of isovaleraldehyde (IVA), which exhibited the capability to increase the size of the lipid vesicles at this concentration. Conversely, the presence of ethyl caproate (EC), caproic acid (CA), isoamyl acetate (IA), and isoamyl alcohol (IAA) resulted in a reduction in the size of the lipid vesicles. Among these compounds, isoamyl alcohol (IAA) displayed the most pronounced effect in decreasing the size. The effects of ethyl caproate (EC), caproic acid (CA), and isoamyl acetate (IA) on size reduction did not show significant differences. However, procyanidin B2 (PB2) did not exhibit a significant effect on the size of the lipid vesicles at a 40% concentration.
In Figure 6, lipid vesicles containing compounds at a concentration of 50% were examined, and the largest lipid vesicles were observed in the presence of isovaleraldehyde (IVA). Both isovaleraldehyde (IVA) and procyanidin B2 (PB2) exhibited the ability to increase the size of the lipid vesicles at this concentration. Conversely, the presence of ethyl caproate (EC), caproic acid (CA), isoamyl acetate (IA), and isoamyl alcohol (IAA) resulted in a decrease in the size of the lipid vesicles. The effects of ethyl caproate (EC), isoamyl acetate (IA), caproic acid (CA), and isoamyl alcohol (IAA) on size reduction did not show significant differences from each other.
Figure 7 serves as a summary and comparison of the data on the effects of varying concentrations of different materials on lipid vesicles. Previous studies from our research group have reported the actual diameter values of these lipid vesicles [28,29,30,31]. For the purpose of comparison, the values of each type of lipid vesicle containing various materials were recalculated by dividing them by the corresponding control values obtained from lipid vesicles made with DOPC in each experiment. By revisiting the trends observed in these experimental results, we can draw the following conclusions:
The investigation on the effects of ethyl caproate (EC) concentration revealed that lipid vesicles containing 30% EC had the smallest average diameter [28]. In the case of caproic acid (CA) effects, it was found that lipid vesicles containing 50% CA had the smallest average diameter [28]. Examining the effects of isoamyl acetate (IA) concentration on lipid vesicle diameter, it was observed that the smallest average diameters were obtained with 50% IA-containing vesicles. Furthermore, concentrations of 20%, 30%, 40%, and 50% IA resulted in smaller vesicles compared to those without IA [29]. While 10% concentrations of isoamyl alcohol (IAA) and IA did not significantly affect vesicle diameter, concentrations higher than 30% of both IAA and IA had an impact on lipid vesicle size. Notably, IAA (>30%) exhibited a greater effect in decreasing vesicle diameter compared to IA [29]. Investigating the effects of isovaleraldehyde (IVA) concentration on lipid vesicle size, it was observed that the largest average size was observed with 40% IVA-containing vesicles. Lipid vesicles with IVA concentrations of 10%, 20%, 30%, 40%, and 50% were larger than those without IVA [30]. Similarly, procyanidin B2 (PB2) consistently increased the size of lipid vesicles, particularly at concentrations higher than 30%. Lipid vesicles containing PB2 were larger than those without PB2 [31]. In summary, (1) the compounds EC, CA, IA, and IAA decreased the size of lipid vesicles. (2) IVA and PB2 increased the size of lipid vesicles. (3) The smallest vesicle diameters were observed at 30% EC, 50% CA, 50% IA, 40% IAA, 0% IVA, and 0% PB2 concentrations. These findings provide insights into the impact of concentration changes in different materials on the size of lipid vesicles.

3.2. Discussion of Molecular Properties

To understand this correlation, both the chemical structure of these compounds in relation to DOPC membranes and the fluidity of the membranes are discussed in the following section.
First, these results can be attributed to the molecular properties of these compounds, specifically their hydrophobicity and hydrophilicity. The decrease in lipid vesicle size induced by EC, CA, IA, and IAA is likely due to their relatively more hydrophobic properties. Despite the presence of ester bonds in EC and IA, a carboxyl group in CA, and a hydroxyl group in IAA, these compounds have longer hydrophobic carbon chains (Figure 1B–E), enabling stronger hydrophobic interactions with the lipid chains of DOPCs in the membrane layer. This leads to tighter packing and results in smaller lipid vesicles. In contrast, the increase in lipid vesicle size caused by IVA and PB2 can be attributed to their relatively stronger hydrophilicity. IVA has a shorter hydrophobic carbon chain and a hydrophilic formyl group, while PB2 contains hydrophobic ring structures and 10 hydroxy groups (Figure 1F,G). These compounds exhibit weaker interactions with the lipid chains of DOPCs in the membrane layer, leading to looser packing and larger lipid vesicles. Although we considered incorporating graphical representations, such as diagrams or charts, to visually depict the effects of different compounds on vesicle size, the available information was insufficient to create such figures. However, we previously drew a figure illustrating the increase in lipid vesicles caused by IVA [33]. This figure serves as a model depicting how flavors and functional materials are inserted into the lipid bilayer of the vesicle membrane.

3.3. Influence of Membrane Fluidity

The size of lipid vesicles can be influenced by the fluidity of membranes, as previously discussed [29,30,31]. This idea was initially proposed in the context of lipid droplets, where it was found that saturated phospholipids, such as DSPC, formed larger monolayer droplets compared to unsaturated phospholipids like DOPC [34]. This article suggested that the reduced energy cost for fusion and the formation of larger droplets led to instability in the DSPC monolayer compared to DOPC. In our research, we have also considered the relationship between the diameter of lipid vesicles and the shape and packing of membrane molecules [7,28,29]. In a previous study conducted by our group, we constructed lipid vesicles containing combinations of EC and CA, as well as IA and IAA [29]. We found that in the case of lipid vesicles containing EC and CA, the diameter of the vesicles might be regulated by membrane fluidity. However, the IA and IAA system did not demonstrate a direct influence on membrane fluidity [29]. Therefore, we hypothesized that the diameter of lipid vesicles may be regulated by the balance between fluidity and molecular packing on the membranes [29]. Furthermore, strong molecular packing can lead to increased curvature, resulting in a reduction in the diameter of lipid vesicles [7,28,29]. Conversely, strong molecular packing can also decrease membrane fluidity, making the membranes unstable and prone to fusion, leading to the formation of larger lipid vesicles [34]. Thus, the diameter of lipid vesicles is likely determined by the balance between these factors. It should be noted that our method for creating lipid vesicles is the gentle natural swelling method from a dried lipid film. This method does not allow for precise control over the insertion of molecules into specific layers of the membranes. In contrast, droplet methods [35,36] offer the ability to accurately position compounds within a specific layer or symmetrically/asymmetrically insert them into a membrane. We plan to explore the application of this method in our future research, as studying the factors that influence the localization of flavor compounds is both significant and exciting.
Indeed, the change in the size of liposomes can have significant effects on their physicochemical properties and biological functions. For example, the size alteration can impact the resistance properties of liposomes against osmotic pressure, as demonstrated in previous research [37]. Additionally, changes in liposome size can affect the localization of molecules, such as DNA, within the liposomes, thus influencing their biological functions [38]. In recent years, our research group has made interesting observations regarding the relationship between yeast cell size and the production of specific flavor molecules [28,29]. Similar phenomena have also been reported in genome-edited yeast strains [39]. This suggests that functional compounds, such as EC, CA, IA, IAA, and PB2, may have an influence on cellular physiological functions related to lipid metabolism. These compounds could interact with phospholipids, leading to changes in fluidity or lipid packing through molecular interactions. These alterations in lipid properties can then impact various cellular processes, including receptor activation and signaling pathways. Overall, the effects of functional compounds on liposome size and lipid metabolism are likely to have broader implications for cellular physiology and could be important for understanding the mechanisms underlying the modulation of biological functions by these compounds. Further research is needed to unravel the specific molecular interactions and signaling pathways involved in these processes.
The study by Wang et al. revealed that procyanidin and related compounds can downregulate the activity of enzymes involved in lipid metabolism by perturbing lipid rafts and reducing the expression of genes coding for these enzymes [40]. This phenomenon is attributed to the interactions between procyanidin derivatives and lipid molecules, which leads to decreased receptor activation and subsequent effects on lipid metabolism. Additionally, I have reported that PB2 can reduce membrane phase separation in cell-sized lipid vesicles composed of DOPC, DPPC, and cholesterol [41]. This finding suggests that PB2 influences the size of lipid vesicles containing DOPC through lipid interactions.
Furthermore, I have investigated the effects of EC and IVA on phase separation in lipid vesicles composed of DOPC, DPPC, and cholesterol, as well as DOPC, DPPC, and ergosterol [42]. Interestingly, both EC and IVA were found to decrease phase separation in lipid vesicles composed of different lipid compositions, despite their opposite effects on vesicle size observed in the present study. This suggests that EC and IVA may have similar effects on membrane phase separation, despite their differences in hydrophobic and hydrophilic properties.
Based on the results from the present study and previous investigations on phase separation, it appears that compounds that decrease vesicle size (such as EC, CA, IA, and IAA) and compounds that increase vesicle size (such as IVA and PB2) may have similar effects on phase separation. Therefore, detecting the types of compounds present may be useful for predicting changes in vesicle size. However, it is important to note that the studies conducted thus far have focused on homogeneous lipid vesicles composed of specific lipid compositions (such as DOPC only) or phase-separated lipid vesicles with limited lipid compositions. To optimize compound detection, it is necessary to explore a wider range of lipid types and compositions.

4. Conclusions

In this study, we investigated the effects of flavors and functional compounds present in beverages on the size of lipid vesicles. By incorporating these compounds with the lipid DOPC, we observed a correlation between their concentrations and the size of the vesicles. Our analysis revealed that the size of the vesicles was influenced by the molecular interactions between the compounds and DOPC, specifically the balance between hydrophobicity and hydrophilicity. Compounds with higher hydrophobicity tended to decrease the vesicle size, while those with higher hydrophilicity tended to increase it. These findings suggest that the size of lipid vesicles can serve as an indicator for evaluating the concentration of different compounds in beverages. Additionally, we discussed the potential biological roles and functions of these compounds. Overall, our study contributes to the knowledge in the fields of physical chemistry, analytical chemistry, and biological chemistry.

Funding

This research was supported by the Konica Minolta Imaging Science Encouragement Award, the Shorai Foundation for Science and Technology, a JSPS KAKENHI Grant Number JP20K19699 from the Japan Society for the Promotion of Science (JSPS), and grants from the Aomori Prefectural Industrial Technology Research Center for a research challenge and third term research project.

Institutional Review Board Statement

Not applicable.

Informed Consent Statement

Not applicable.

Data Availability Statement

The data that support the findings of this study are available from the corresponding author upon reasonable request.

Acknowledgments

The author would like to express gratitude to M. Omori for their valuable technical assistance.

Conflicts of Interest

The author declares no conflict of interest. The funders had no role in the design of the study; in the collection, analyses, or interpretation of data; in the writing of the manuscript; or in the decision to publish the results.

References

  1. Singer, S.J.; Nicolson, G.L. The Fluid Mosaic Model of the Structure of Cell Membranes. Science 1972, 175, 720–731. [Google Scholar] [CrossRef] [PubMed]
  2. Hamada, T.; Yoshikawa, K. Cell-Sized Liposomes and Droplets: Real-World Modeling of Living Cells. Materials 2012, 5, 2292–2305. [Google Scholar] [CrossRef]
  3. Dimova, R.; Stano, P.; Marques, C.M.; Walde, P. Preparation methods for giant unilamellar vesicles. In The Giant Vesicle Book; Dimova, R., Marques, C.M., Eds.; CRC Press: Boca Raton, FL, USA, 2022; pp. 3–20. [Google Scholar]
  4. Vestergaard, M.C.; Yoda, T.; Hamada, T.; Akazawa (Ogawa), Y.; Yoshida, Y.; Takagi, M. The effect of oxycholesterols on thermo-induced membrane dynamics. Biochim. Biophys. Acta Biomembr. 2011, 1808, 2245–2251. [Google Scholar] [CrossRef] [PubMed] [Green Version]
  5. Yoda, T.; Vestergaard, M.C.; Hamada, T.; Le, P.T.M.; Takagi, M. Thermo-induced Vesicular Dynamics of Membranes Containing Cholesterol Derivatives. Lipids 2012, 47, 813–820. [Google Scholar] [CrossRef]
  6. Vestergaard, M.C.; Yoda, T.; Hamada, T.; Akazawa, Y.; Yoshida, Y.; Takagi, M. Thermo-responsiveness of auto-oxidized cholesterol-containing lipid membranes, observed in real-time. In Proceedings of the 2011 International Symposium on Micro-NanoMechatronics and Human Science, Nagoya, Japan, 6–9 November 2011; pp. 451–455. [Google Scholar]
  7. Phan, H.T.T.; Hata, T.; Morita, M.; Yoda, T.; Hamada, T.; Vestergaard, M.C.; Takagi, M. The effect of oxysterols on the interaction of Alzheimer’s amyloid beta with model membranes. Biochim. Biophys. Acta Biomembr. 2013, 1828, 2487–2495. [Google Scholar] [CrossRef] [Green Version]
  8. Yoda, T.; Phan, H.T.T.; Vestergaard, M.C.; Hamada, T.; Takagi, M. Thermo-induced Dynamics of Membranes and Liquid Crystals Containing Cholesterol Derivatives. In Proceedings of the 2012 International Symposium on Micro-NanoMechatronics and Human Science (MHS), Nagoya, Japan, 4–7 November 2012; pp. 87–92. [Google Scholar]
  9. Sharma, N.; Phan, H.T.T.; Yoda, T.; Shimokawa, N.; Vestergaard, M.C.; Takagi, M. Effects of Capsaicin on Biomimetic Membranes. Biomimetics 2019, 4, 17. [Google Scholar] [CrossRef] [Green Version]
  10. Chahal, B.; Vestergaard, M.C.; Yoda, T.; Morita, M.; Takagi, M. Structure-Dependent Membrane Interaction and bioactivity of Flavonoids with Lipid Bilayers. In Proceedings of the 2012 International Symposium on Micro-NanoMechatronics and Human Science (MHS), Nagoya, Japan, 4–7 November 2012; pp. 106–110. [Google Scholar]
  11. Phan, H.T.T.; Yoda, T.; Chahal, B.; Morita, M.; Takagi, M.; Vestergaard, M.C. Structure-dependent interactions of polyphenols with a biomimetic membrane system. Biochim. Biophys. Acta Biomembr. 2014, 1838, 2670–2677. [Google Scholar] [CrossRef] [Green Version]
  12. Ichikawa, E.; Hosokawa, N.; Hata, Y.; Abe, Y.; Suginami, K.; Imayasu, S. Breeding of a sake yeast with improved ethyl hexanoate productivity. Agric. Biol. Chem. 1991, 55, 2153–2154. [Google Scholar]
  13. Ichikawa, E. Sake yeast with improved ethyl caproate productivity. Nihon Jozo gakkaishi 1993, 88, 101–105. (In Japanese) [Google Scholar]
  14. Akita, O. Breeding of sake yeast producing a large quantity of aroma. Nihon Jozo gakkaishi 1992, 87, 621–625. (In Japanese) [Google Scholar]
  15. Verstrepen, K.J.; Derdelinckx, G.; Dufour, J.P.; Winderickx, J.; Thevelein, J.M.; Pretorius, I.S.; Delvaux, F.R. Flavor-active esters: Adding fruitiness to beer. J. Biosci. Bioeng. 2003, 96, 110–118. [Google Scholar] [CrossRef] [PubMed]
  16. Tsutsumi, H. Seishu kōbo no kōki seisei no kenkyū (Study on aroma production of sake yeast). Seibutsu-Koggakaishi 2011, 12, 717–719. (In Japanese) [Google Scholar]
  17. Tsutsumi, S.; Mochizuki, M.; Sakai, K.; Ieda, A.; Ohara, R.; Mitsui, S.; Ito, A.; Hirano, T.; Shimizu, M.; Kato, M. Ability of Saccharomyces cerevisiae MC87-46 to assimilate isomaltose and its effects on sake taste. Sci. Rep. 2019, 9, 13908. [Google Scholar] [CrossRef] [PubMed] [Green Version]
  18. Aritomi, K.; Hirosawa, I.; Hoshida, H.; Shigi, M.; Nishizawa, Y.; Kashiwagi, S.; Akada, R. Self-cloning yeast strains containing novel FAS2 mutations produce a higher amount of ethyl caproate in Japanese sake. Biosci. Biotechnol. Biochem. 2004, 68, 206–214. [Google Scholar] [CrossRef] [Green Version]
  19. Goshima, T.; Nakamura, R.; Kume, K.; Okada, H.; Ichikawa, E.; Tamura, H.; Hasuda, H.; Inahashi, M.; Okazaki, N.; Akao, T.; et al. Identification of a mutation causing a defective spindle assembly checkpoint in high ethyl caproate- producing sake yeast strain K1801. Biosci. Biotechnol. Biochem. 2016, 80, 1657–1662. [Google Scholar] [CrossRef] [Green Version]
  20. Ashida, S.; Ichdcawa, E.; Suginami, K.; Imayasu, S. Isolation and application of mutants producing sufficient isoamyl acetate a sake flavor component. Agric. Biol. Chem. 1987, 51, 2061–2065. [Google Scholar]
  21. Mason, A.B.; Dufour, J. Alcohol acetyltransferases and the significance of ester synthesis in yeast. Yeast 2000, 16, 1287–1298. [Google Scholar] [CrossRef]
  22. Blanco, C.A.; Andrés-Iglesias, C.; Montero, O. Low-alcohol beers: Flavor compounds, defects, and improvement strategies. Crit. Rev. Food Sci. 2016, 56, 1379–1388. [Google Scholar] [CrossRef]
  23. Tian, H.Y.; Zhang, J.; Sun, B.G.; Huang, M.Q.; Li, J.R.; Han., J.X.X. Preparation of natural isovaleraldehyde by the Maillard reaction. Chin. Chem. Lett. 2007, 18, 1049–1052. [Google Scholar] [CrossRef]
  24. Priegue, J.M.; Crisan, D.N.; Martínez-Costas, J.; Granja, J.R.; Fernandez-Trillo, F.; Montenegro, J. In situ functionalized polymers for siRNA delivery. Angew. Chem. 2016, 128, 7618–7621. [Google Scholar] [CrossRef] [Green Version]
  25. Kanamoto, Y.; Yamashita, Y.; Nanba, F.; Yoshida, T.; Tsuda, T.; Fukuda, I.; Nakamura-Tsuruta, S.; Ashida, H. A Black Soybean Seed Coat Extract Prevents Obesity and Glucose Intolerance by Up-regulating Uncoupling Proteins and Down-regulating Inflammatory Cytokines in High-Fat Diet-Fed Mice. J. Agric. Food Chem. 2011, 59, 8985–8993. [Google Scholar] [CrossRef] [PubMed]
  26. Yoda, T.; Miyaki, H.; Saito, T. Effect of container shape on freeze concentration of apple juice. PLoS ONE 2021, 16, e0245606. [Google Scholar] [CrossRef] [PubMed]
  27. Yoda, T.; Miyaki, H.; Saito, T. Freeze concentrated apple juice maintains its flavor. Sci. Rep. 2021, 11, 12679. [Google Scholar] [CrossRef] [PubMed]
  28. Yoda, T.; Ogura, A.; Saito, T. Influence of Ethyl Caproate on the Size of Lipid Vesicles and Yeast Cells. Biomimetics 2020, 5, 16. [Google Scholar] [CrossRef] [PubMed]
  29. Yoda, T.; Saito, T. Size of Cells and Physicochemical Properties of Membranes are Related to Flavor Production during Sake Brewing in the Yeast Saccharomyces cerevisiae. Membranes 2020, 10, 440. [Google Scholar] [CrossRef]
  30. Yoda, T.; Yamada, Y.; Chounan, Y. Effects of isovaleraldehyde on cell-sized lipid bilayer vesicles. Biophys. Chem. 2021, 279, 106698. [Google Scholar] [CrossRef]
  31. Yoda, T. Direct Observation of Cell-sized Liposomes Containing a Functional Polyphenol Procyanidin B2 from Apple. ChemistrySelect 2022, 7, e01808. [Google Scholar] [CrossRef]
  32. Image, J. A Soft-Ware for Image Analysis, It Was Download from Official Site. Available online: https://imagej.nih.gov/ij/download.html (accessed on 12 July 2023).
  33. Graphical Abstract of Ref. 30. Available online: https://ars.els-cdn.com/content/image/1-s2.0-S0301462221001812-ga1_lrg.jpg (accessed on 12 July 2023).
  34. Arisawa, K.; Mitsudome, H.; Yoshida, K.; Sugimoto, S.; Ishikawa, T.; Fujiwara, Y.; Ichi, I. Saturated fatty acid in the phospholipid monolayer contributes to the formation of large lipid droplets. Biochem. Biophys. Res. Commun. 2016, 480, 641–647. [Google Scholar] [CrossRef]
  35. Hamada, T.; Miura, Y.; Komatsu, K.; Kishimoto, Y.; Vestergaard, M.; Takag, M. Construction of asymmetric cell-sized lipid vesicles from lipid-coated water-in-oil micro-droplets. J. Phys. Chem. B 2008, 112, 14678–14681. [Google Scholar] [CrossRef]
  36. Morita, M.; Onoe, H.; Yanagisawa, M.; Ito, H.; Ichikawa, M.; Fujiwara, K.; Saito, H.; Takinoue, M. Droplet-Shooting and Size-Filtration (DSSF) Method for Synthesis of Cell-Sized Liposomes with Controlled Lipid Compositions. ChemBioChem 2015, 16, 2029–2035. [Google Scholar] [CrossRef]
  37. Ohno, M.; Hamada, T.; Takiguchi, K.; Homma, M. Dynamic behavior of giant liposomes at desired osmotic pressures. Langmuir 2009, 25, 11680–11685. [Google Scholar] [CrossRef] [PubMed]
  38. Hamada, T.; Fujimoto, R.; Shimobayashi, S.F.; Ichikawa, M.; Takagi, M. Molecular behavior of DNA in a cell-sized compartment coated by lipids. Phys. Rev. E 2015, 91, 062717. [Google Scholar] [CrossRef] [PubMed] [Green Version]
  39. Chadani, T.; Ohnuki, S.; Isogai, A.; Goshima, T.; Kashima, M.; Ghanegolmohammadi, F.; Nishi, T.; Hirata, D.; Watanabe, D.; Kitamoto, K.; et al. Genome editing to generate sake yeast strains with eight mutations that confer excellent brewing characteristics. Cells 2021, 10, 1299. [Google Scholar] [CrossRef]
  40. Wang, R.; Dang, M.; Zhu, W.; Li, C. Galloyl Group in B-type proanthocyanidin dimers was responsible for its differential inhibitory activity on 3T3-L1 preadipocytes due to the strong lipid raft-perturbing potency. J. Agric. Food Chem. 2021, 69, 5216–5225. [Google Scholar] [CrossRef] [PubMed]
  41. Yoda, T. The Flavonoid Molecule Procyanidin Reduces Phase Separation in Model Membranes. Membranes 2022, 12, 943. [Google Scholar] [CrossRef] [PubMed]
  42. Yoda, T. Phase-Separated structures of sake flavors-containing cell model membranes. Chem. Biodiver. 2023, 20, e202200750. [Google Scholar] [CrossRef]
Figure 1. The following compounds were used to construct membranes: (A) 1,2-dioleoyl-sn-glycero-3-phosphocholine (DOPC), (B) ethyl caproate (EC), (C) caproic acid (CA), (D) isoamyl acetate (IA), (E) isoamyl alcohol (IAA), (F) isovaleraldehyde (IVA), (G) procyanidin B2 (PB2) and, (H) cell-sized lipid vesicles.
Appliedchem 03 00023 g001
Figure 2. Lipid vesicle diameters at 10% concentration. The graph illustrates the diameters of lipid vesicles containing various compounds, namely ethyl caproate (EC), caproic acid (CA), isoamyl acetate (IA), isoamyl alcohol (IAA), isovaleraldehyde (IVA), and procyanidin B2 (PB2), at a concentration of 10%. The mean values and standard errors are depicted. Each value is calculated by dividing the size of the lipid vesicle by that of the control lipid vesicle containing 1,2-dioleoyl-sn-glycero-3-phosphocholine (DOPC) in each experiment.
Appliedchem 03 00023 g002
Figure 3. Lipid vesicle diameters at 20% concentration. The graph illustrates the diameters of lipid vesicles containing various compounds, namely ethyl caproate (EC), caproic acid (CA), isoamyl acetate (IA), isoamyl alcohol (IAA), isovaleraldehyde (IVA), and procyanidin B2 (PB2), at a concentration of 20%. The mean values and standard errors are depicted. Each value is calculated by dividing the size of the lipid vesicle by that of the control lipid vesicle containing 1,2-dioleoyl-sn-glycero-3-phosphocholine (DOPC) in each experiment.
Appliedchem 03 00023 g003
Figure 4. Lipid vesicle diameters at 30% concentration. The graph illustrates the diameters of lipid vesicles containing various compounds, namely ethyl caproate (EC), caproic acid (CA), isoamyl acetate (IA), isoamyl alcohol (IAA), isovaleraldehyde (IVA), and procyanidin B2 (PB2), at a concentration of 30%. The mean values and standard errors are depicted. Each value is calculated by dividing the size of the lipid vesicle by that of the control lipid vesicle containing 1,2-dioleoyl-sn-glycero-3-phosphocholine (DOPC) in each experiment.
Appliedchem 03 00023 g004
Figure 5. Lipid vesicle diameters at 40% concentration. The graph illustrates the diameters of lipid vesicles containing various compounds, namely ethyl caproate (EC), caproic acid (CA), isoamyl acetate (IA), isoamyl alcohol (IAA), isovaleraldehyde (IVA), and procyanidin B2 (PB2), at a concentration of 40%. The mean values and standard errors are depicted. Each value is calculated by dividing the size of the lipid vesicle by that of the control lipid vesicle containing 1,2-dioleoyl-sn-glycero-3-phosphocholine (DOPC) in each experiment.
Appliedchem 03 00023 g005
Figure 6. Lipid vesicle diameters at 50% concentration. The graph illustrates the diameters of lipid vesicles containing various compounds, namely ethyl caproate (EC), caproic acid (CA), isoamyl acetate (IA), isoamyl alcohol (IAA), isovaleraldehyde (IVA), and procyanidin B2 (PB2), at a concentration of 50%. The mean values and standard errors are depicted. Each value is calculated by dividing the size of the lipid vesicle by that of the control lipid vesicle containing 1,2-dioleoyl-sn-glycero-3-phosphocholine (DOPC) in each experiment.
Appliedchem 03 00023 g006
Figure 7. Diameters of lipid vesicles containing various compounds. The graph depicts the diameters of lipid vesicles containing various compounds, namely ethyl caproate (EC, represented by white squares), caproic acid (CA, represented by black squares), isoamyl acetate (IA, represented by white circles), isoamyl alcohol (IAA, represented by black circles), isovaleraldehyde (IVA, represented by white triangles), and procyanidin B2 (PB2, represented by black rhombuses) at different concentrations ranging from 0% to 50%. Each data point represents the calculated ratio of the size of the lipid vesicle to that of the control lipid vesicle containing 1,2-dioleoyl-sn-glycero-3-phosphocholine (DOPC) in each experiment.
Appliedchem 03 00023 g007
Disclaimer/Publisher’s Note: The statements, opinions and data contained in all publications are solely those of the individual author(s) and contributor(s) and not of MDPI and/or the editor(s). MDPI and/or the editor(s) disclaim responsibility for any injury to people or property resulting from any ideas, methods, instructions or products referred to in the content.