
Geochemical Characterization of Nyamyumba Hot Springs, Northwest Rwanda

 , ,
, ,  , and
, and
Abstract
:1. Introduction
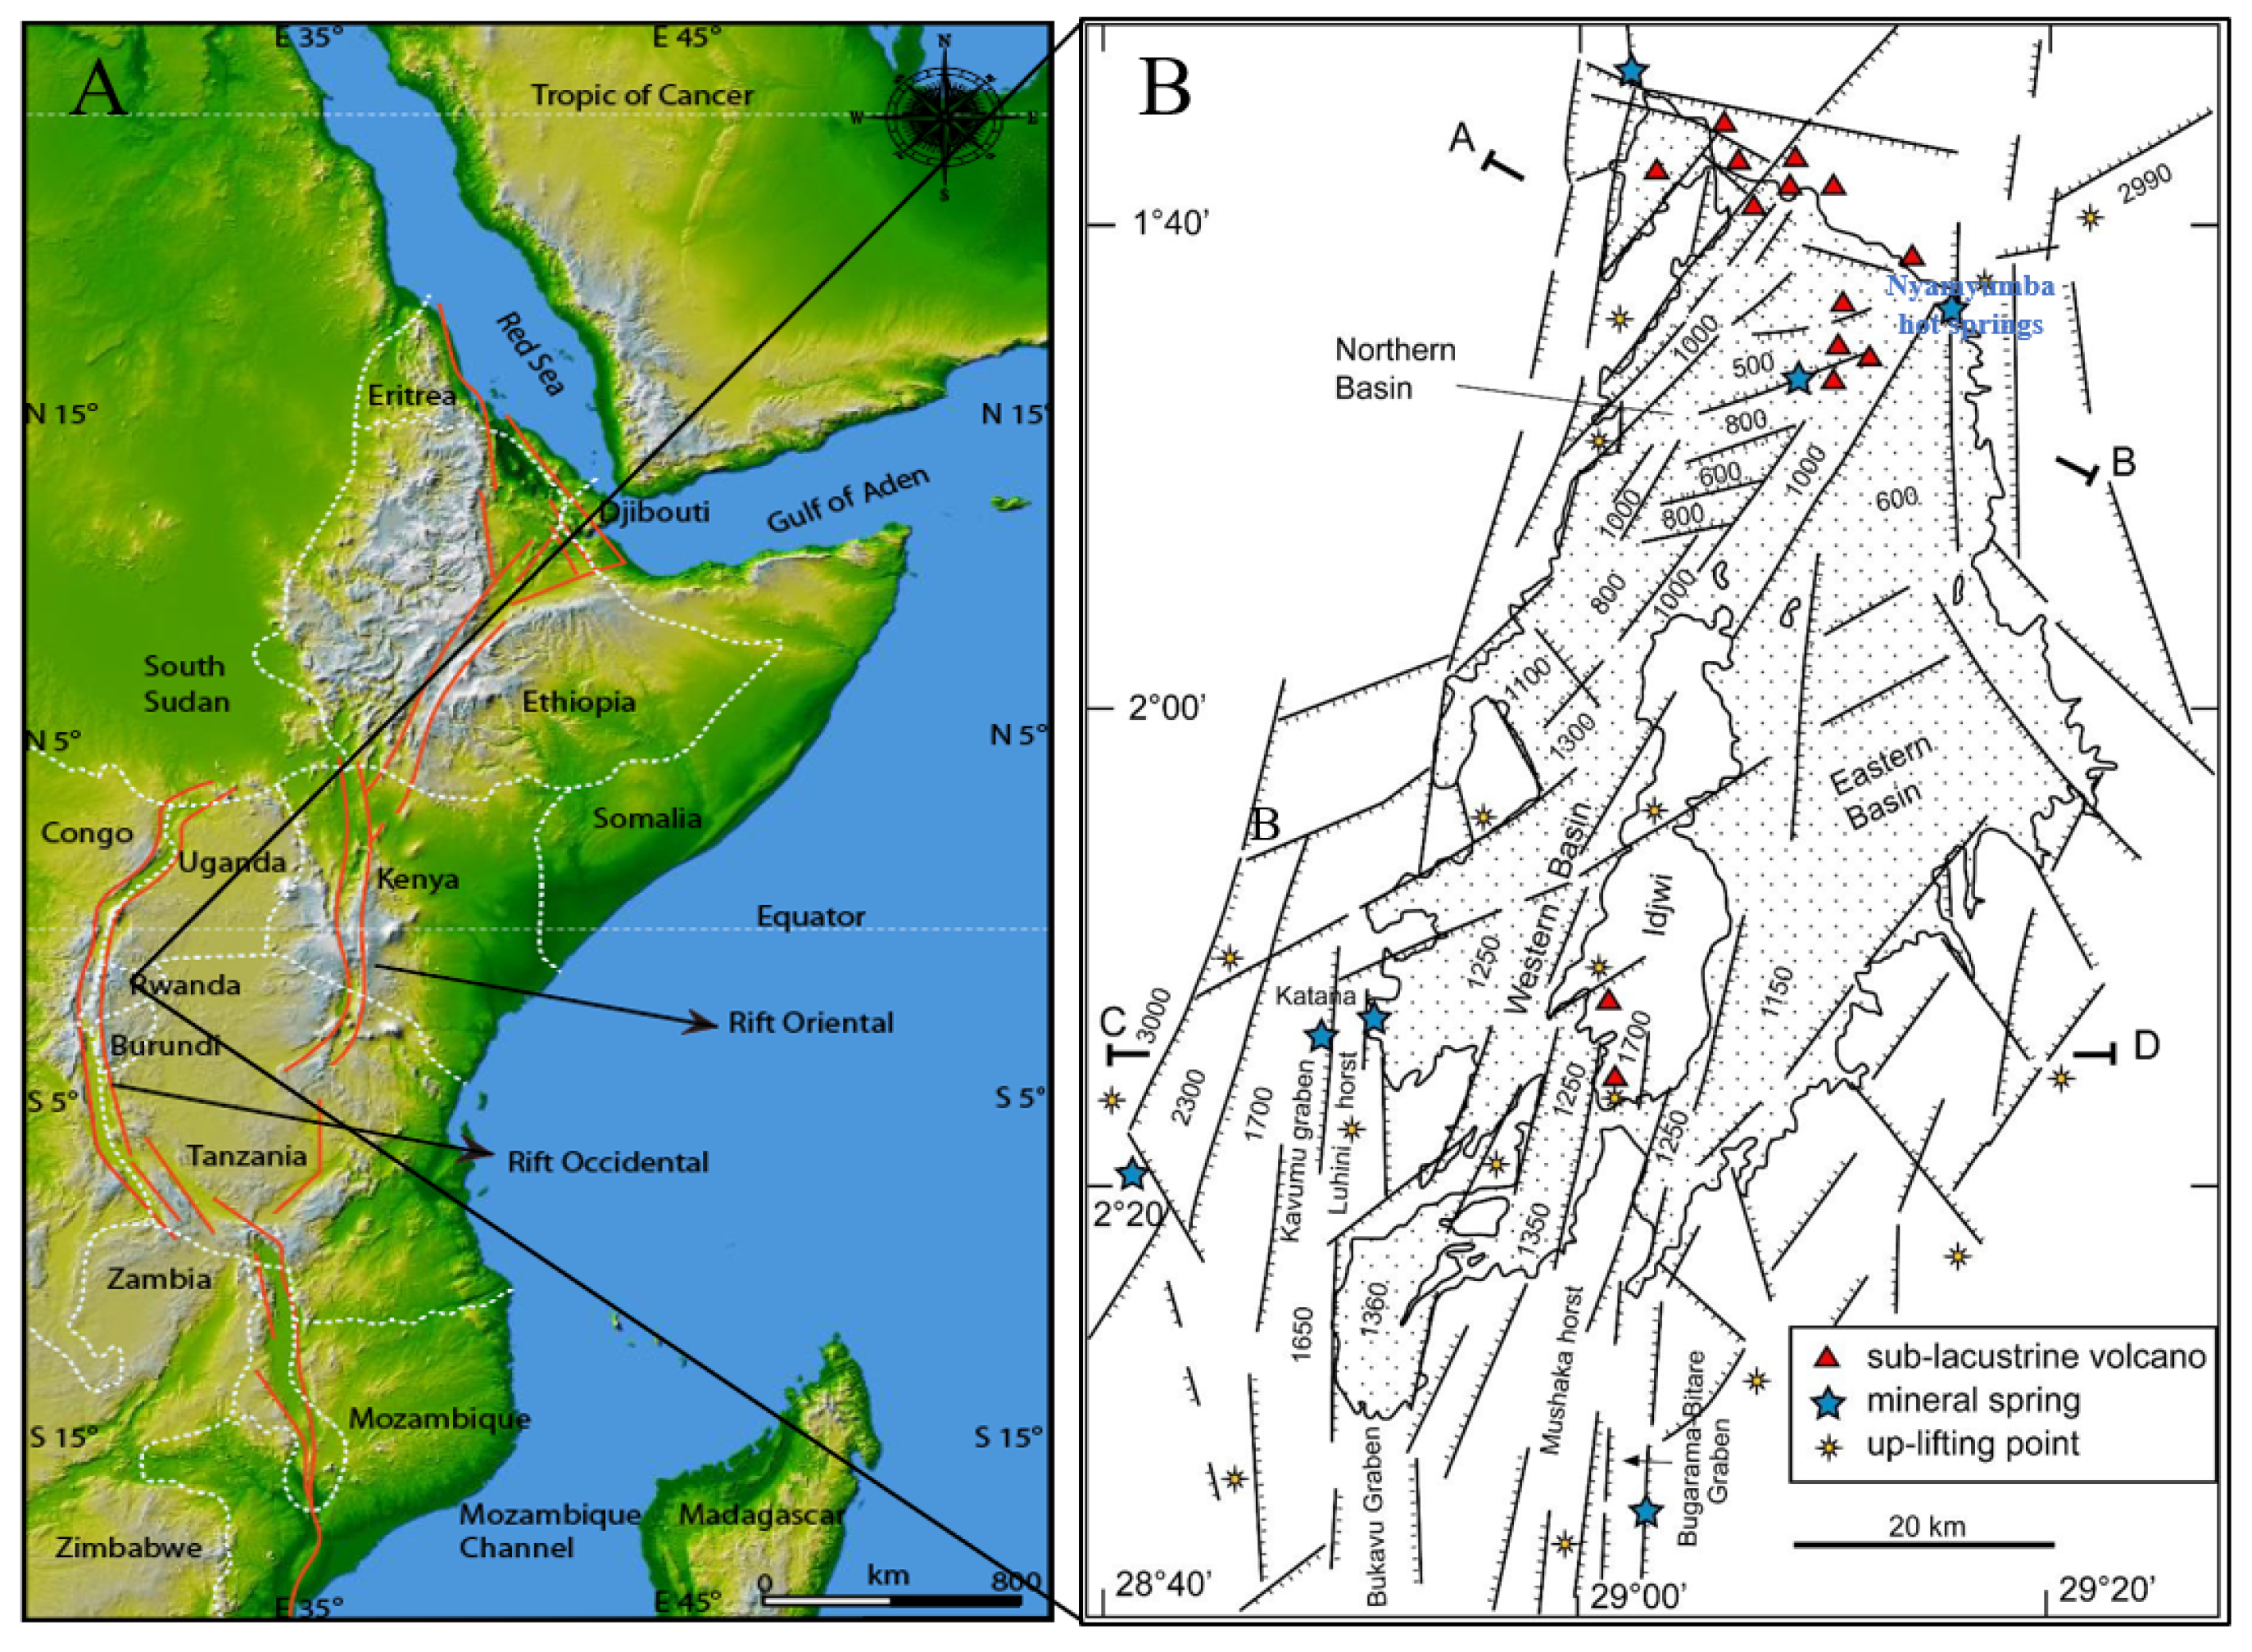
2. Geological and Geochemical Background of the Area
3. Methods
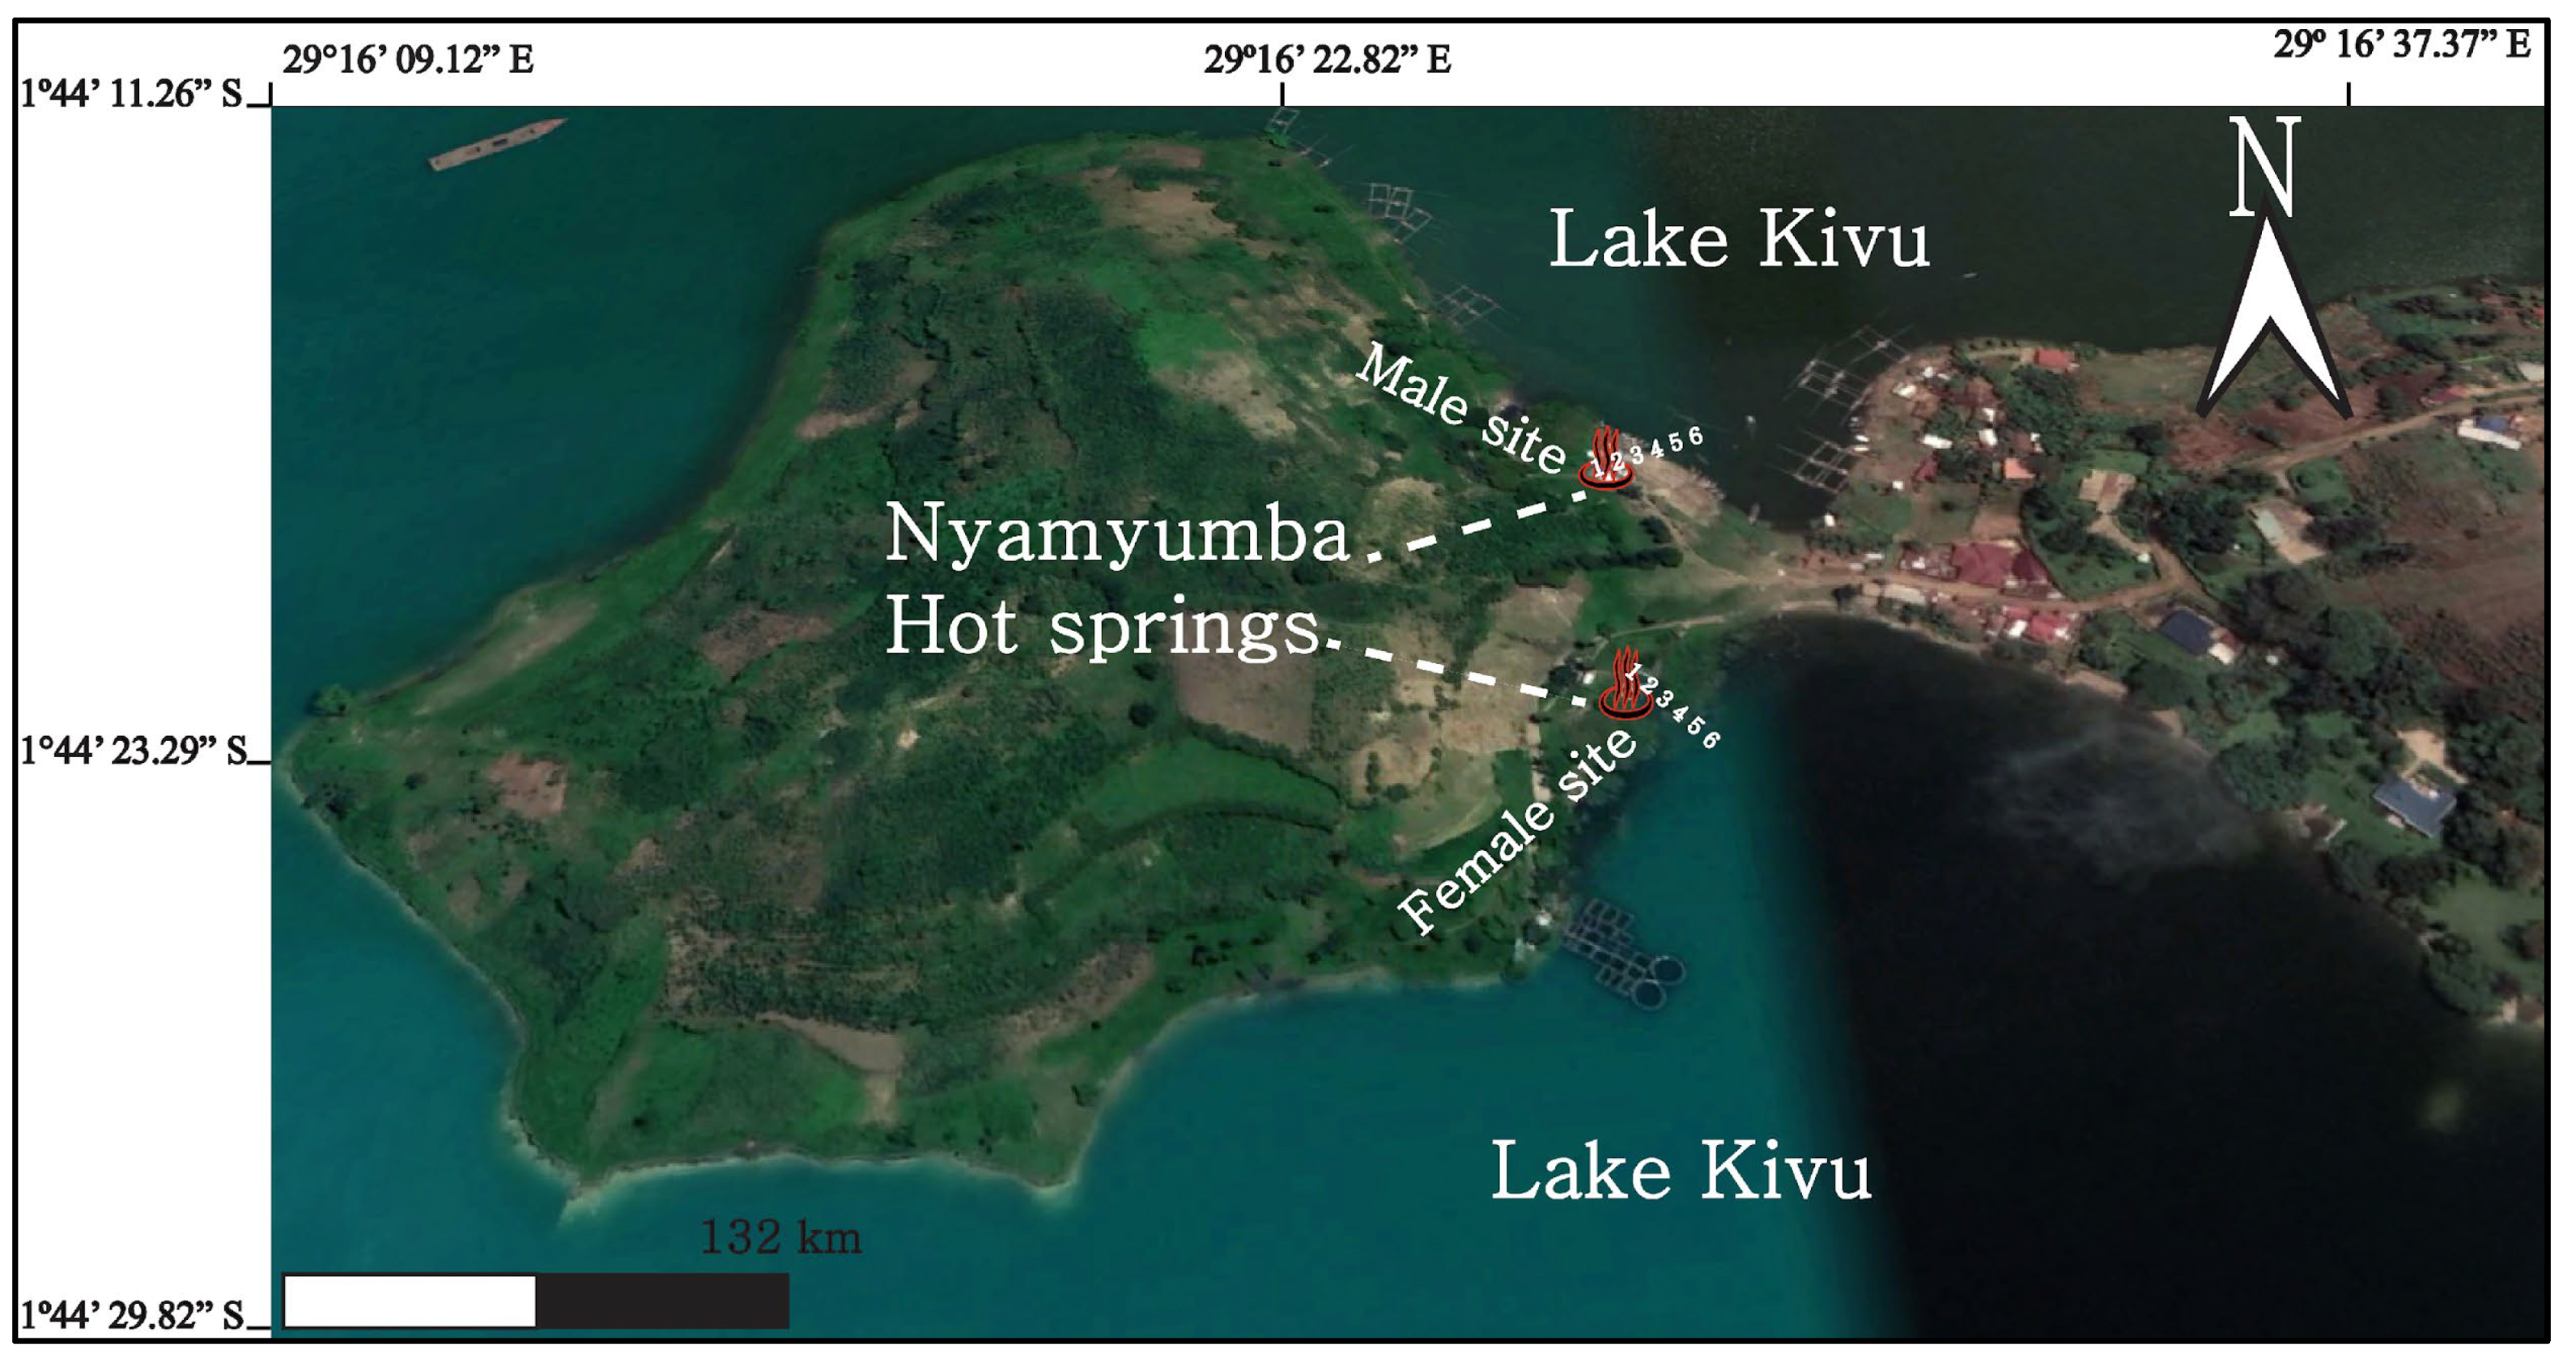
3.1. Sampling Procedure
3.2. Analytical Procedure
- mg/L NH3 = ((mg/L NH3–N × percent NH3 of water sample at a given temperature and pH) ÷ 100) × 1.2 [27].
4. Results
5. Discussion
6. Conclusions
Author Contributions
Funding
Institutional Review Board Statement
Informed Consent Statement
Data Availability Statement
Acknowledgments
Conflicts of Interest
References
- Cox, A.; Shock, E.L.; Havig, J.R. The transition to microbial photosynthesis in hot spring ecosystems. Chem. Geol. 2011, 280, 344–351. [Google Scholar] [CrossRef]
- Farmer, J. Hydrothermal systems: Doorways to early biosphere evolution. GSA Today 2000, 10, 1–9. [Google Scholar]
- Drake, B.; Campbell Kathleen, A.; Rowland, J.; Guido, D.; Browne, P.; Rae, A. Evolution of a dynamic paleo-hydrothermal system at Mangatete, Taupo Volcanic Zone, New Zealand. J. Volcanol. Geotherm. Res. 2014, 282, 19–35. [Google Scholar] [CrossRef]
- White, D.E.; Brannock, W.; Murata, K. Silica in hot-spring waters. Geochim. Cosmochim. Acta 1956, 10, 27–59. [Google Scholar] [CrossRef]
- Des Marais, D.J.; Walter, M.R. Terrestrial hot spring systems: Introduction. Astrobiology 2019, 19, 1419–1432. [Google Scholar] [CrossRef] [PubMed] [Green Version]
- Parenteau, M.N.; Cady, S.L. Microbial biosignatures in iron-mineralized phototrophic mats at Chocolate Pots hot springs, Yellowstone National Park, United States. Palaois 2010, 25, 97–111. [Google Scholar] [CrossRef]
- Zhang, L.; Wang, Y.; Miao, X.; Gan, M.; Li, X. Geochemistry in geologic CO2 utilization and storage: A brief review. Adv. Geo-Energy Res. 2019, 3, 304–313. [Google Scholar] [CrossRef]
- Van der Sloot, H.A.; Hoede, D. Comparison of pH Static Leach Test Data with ANC Test Data; Netherlands Energy Research Foundation: Petten, The Netherlands, 1997. [Google Scholar]
- Seki, Y.; Nakajima, T.; Kamioka, H.; Kinai, Y.; Manaka, M.; Tsukimura, K. Discharged water from deep wells in the eastern Kanto region. J. Balneol. Soc. Jpn. 2004, 54, 1–24. [Google Scholar]
- Jolie, E. Geothermal Exploration in the Virunga Prospect, Northern Part of Rwanda. In Proceedings of the World Geothermal Congress, Bali, Indonesia, 25–29 April 2010. [Google Scholar]
- Baioumy, H.; Nawawi, M.; Wagner, K.; Arifin, M.H. Geochemistry and geothermometry of non-volcanic hot springs in West Malaysia. J. Volcanol. Geotherm. Res. 2015, 290, 12–22. [Google Scholar] [CrossRef]
- Capasso, G.; D’Alessandro, W.; Favara, R.; Inguaggiato, S.; Parello, F. Interaction between the deep fluids and the shallow groundwaters on Vulcano island (Italy). J. Volcanol. Geotherm. Res. 2001, 108, 187–198. [Google Scholar] [CrossRef]
- Han, D.M.; Liang, X.; Jin, M.G.; Currell, M.J.; Song, X.F.; Liu, C.M. Evaluation of groundwater hydrochemical characteristics and mixing behavior in the Daying and Qicun geothermal systems, Xinzhou basin. J. Volcanol. Geotherm. Res. 2010, 189, 92–104. [Google Scholar] [CrossRef]
- Shi, Z.; Liao, F.; Wang, G.; Xu, Q.; Mu, W.; Sun, X. Hydrogeochemical characteristics and evolution of hot springs in eastern Tibetan Plateau geothermal belt, Western China: Insight from multivariate statistical analysis. Geofluids 2017, 2017, 6546014. [Google Scholar] [CrossRef]
- Gupta, A.K.; Nicol, K. The use of sulfur in dermatology. J. Drugs Dermatol. 2004, 3, 427–431. [Google Scholar] [PubMed]
- Levin, J.; Miller, R. A guide to the ingredients and potential benefits of over-the-counter cleansers and moisturizers for Rosacea patients. J. Clin. Aesthetic Dermatol. 2011, 4, 31–49. [Google Scholar]
- Pouclet, A.; Bellon, H.; Bram, K. The Cenozoic volcanism in the Kivu rift: Assessment of the tectonic setting, geochemistry, and geochronology of the volcanic activity in the South-Kivu and Virunga regions. J. Afr. Earth Sci. 2016, 121, 219–246. [Google Scholar] [CrossRef] [Green Version]
- Ebinger, C.J.; Sleep, N.H. Cenozoic magmatism throughout east Africa resulting from impact of a single plum. Nature 1998, 395, 788–791. [Google Scholar] [CrossRef]
- Furman, T.; Bryce, J.; Rooney, T.; Hanan, B.; Yirgu, G.; Ayalew, D. Heads and Tails: 30 Million years of the Afar plume. In the Afar Volcanic Province within the East African Rift System; Yirgu, G., Ebinger, C.J., Maguire, P.K.H., Eds.; Geological Society; Special Publications: London, UK, 2006; Volume 259, pp. 95–119. [Google Scholar]
- Rogers, N.W.; Macdonald, R.; Fitton, J.G.; George, R.W.W.; Smith, M.; Barreiro, B.A. Two mantle plumes beneath the East African rift system; Sr, Nd and Pb isotope evidence from Kenya Rift basalts. Earth Planet. Sci. Lett. 2000, 176, 387–400. [Google Scholar] [CrossRef]
- Wood, D.A. Structure, Paleolimnology and Basin History of the East Kivu Graben, Lake Kivu, Rwanda. Master’s Thesis, Syracuse University, Syracuse, NY, USA, 2014. [Google Scholar]
- Ebinger, C.; Bechtel, T.; Forsyth, D.; Bowin, C. Effective elastic plate thickness beneath the East African and Afar plateaux, and dynamic compensation of the uplifts. J. Geophys. Res. 1989, 94, 2883–2901. [Google Scholar] [CrossRef]
- Bahati, G.; Pang, Z.; Ármannsson, H.; Isabirye, E.M.; Kato, V. Hydrology and reservoir characteristics of three geothermal systems in western Uganda. Geothermics 2005, 34, 568–591. [Google Scholar] [CrossRef]
- Degens, E.T.; von Herzen, R.P.; Wong, H.K.; Deuser, W.G.; Jannasch, H.W. Lake Kivu: Structure, chemistry and biology of an East African rift lake. Geol. Rundsch. 1973, 62, 245–277. [Google Scholar] [CrossRef]
- Gomaa, M.M. Salinity and water effect on electrical properties of fragile clayey sandstone. Appl. Water Sci. 2020, 10, 116. [Google Scholar] [CrossRef] [Green Version]
- Tassi, F.; Vaselli, O.; Montegrossi, G.; Huertas, A.D. Water and gas chemistry at Lake Kivu (DRC): Geochemical evidence of vertical and horizontal heterogeneities in a multi basin structure. Geochem. Geophys. Geosyst. 2009, 10. [Google Scholar] [CrossRef]
- Hach. Ammonia Nitrogen Test Kit. 2015. Available online: https://www.hach.com/p-nitrogen-ammonia-test-kit-model-ni-sa/2428700.DOC326.98.00007 (accessed on 28 February 2015).
- WHO. Guidelines for Safe Recreational Water Environments: Coastal and Freshwaters; World Health Organization: Geneva, Switzerland, 2003; Volume 1. [Google Scholar]
- World Health Organization. Guidelines for Drinking-Water Quality; World Health Organization: Geneva, Switzerland, 2004; Volume 1. [Google Scholar]
- Abiona, O.O.; Sanni, L.O.; Awonorin, S.O. Chemical properties of water sources for cassava processing in selected areas of Southwest Nigeria. J. Food Agric. Environ. 2004, 2, 223–224. [Google Scholar]
- WHO. Guidelines for Drinking-Water Quality [Electronic Resource]: Incorporating First Addendum. 2006. Available online: http://www.who.int/water_sanitation_health/dwq/gdwq0506begin.pdf (accessed on 26 January 2007).
- Hu, X.; Pollack, B.J.; Melissa, M.R.; Paul, M.A.; Zhangxian, O. Long-Term Alkalinity Decrease and Acidification of Estuaries in northwestern Gulf of Mexico. Environ. Sci. Technol. 2015, 49, 3401–3409. [Google Scholar] [CrossRef] [PubMed]
- Dariusz, D. Silica origin and solubility in groundwater from the weathered zone of sedimentary rocks of the Intra-Sudetic Basin, SW Poland. Acta Geol. Pol. 2005, 55, 445–462. [Google Scholar]
- Drever, J.I.; Vance, G.F. Role of soil organic acids in mineral weathering processes. In the Role of Organic Acids in Geological Processes; Lewan, M.D., Pittman, E.D., Eds.; Springer: Berlin/Heidelberg, Germany, 1994. [Google Scholar]
- Al-Rehaili, A.M. Comparative chemical clarification for silica removal from RO groundwater feed. Desalination 2003, 159, 21–31. [Google Scholar] [CrossRef]
- Davis, N.S. Silica in streams and groundwater. Am. J. Sci. 1964, 262, 870–891. [Google Scholar] [CrossRef]
- Al Dahaan, S.; Al-Ansari, N.; Knutsson, S. Influence of groundwater hypothetical salts on electrical conductivity and total dissolve solids. Engineering 2016, 8, 823–830. [Google Scholar] [CrossRef] [Green Version]
- Hategekimana, F.; Ndikuryayo, J.D.; Habimana, E.; Mugerwa, T.; Kakonkwe, C.; Rwabuhungu, R.D. Lake Kivu Water Chemistry Variation with Depth Over Time, Northwestern Rwanda. RJESTE 2020, 3, 1–20. [Google Scholar] [CrossRef]
- Karbeka, M.; Botahala, L.; Duka, P. Analysis of mineral content in Hot Spring Water samples in Tubbe and Aramaba Village, Pantar Tengah District, Alor-NTT. In IOP Conference Series: Materials Science and Engineering; IOP Publishing: Bristol, UK, 2020; Volume 823, p. 012051. [Google Scholar]
- Alley, W.M. Regional Ground-Water Quality; Al-Rehaili, M., Abdullah, Eds.; Comparative Chemical Clarification for Silica Removal from RO Groundwater Feed; John Wiley & Sons: Hoboken, NJ, USA, 1993; pp. 21–31, desalination159. [Google Scholar]
- Hamzah, Z.; Rani, N.L.A.; Saat, A.; Wood, A.K. Determination of hot springs physico-chemical water quality potentially use for balneotherapy. Malays. J. Anal. Sci. 2013, 17, 436–444. [Google Scholar]
- Raykar, P.V.; Fung, M.C.; Anderson, B.D. The role of protein and lipid domains in the uptake of solutes by human stratum-corneum. Pharm. Res. 1988, 5, 140–150. [Google Scholar] [CrossRef] [PubMed]


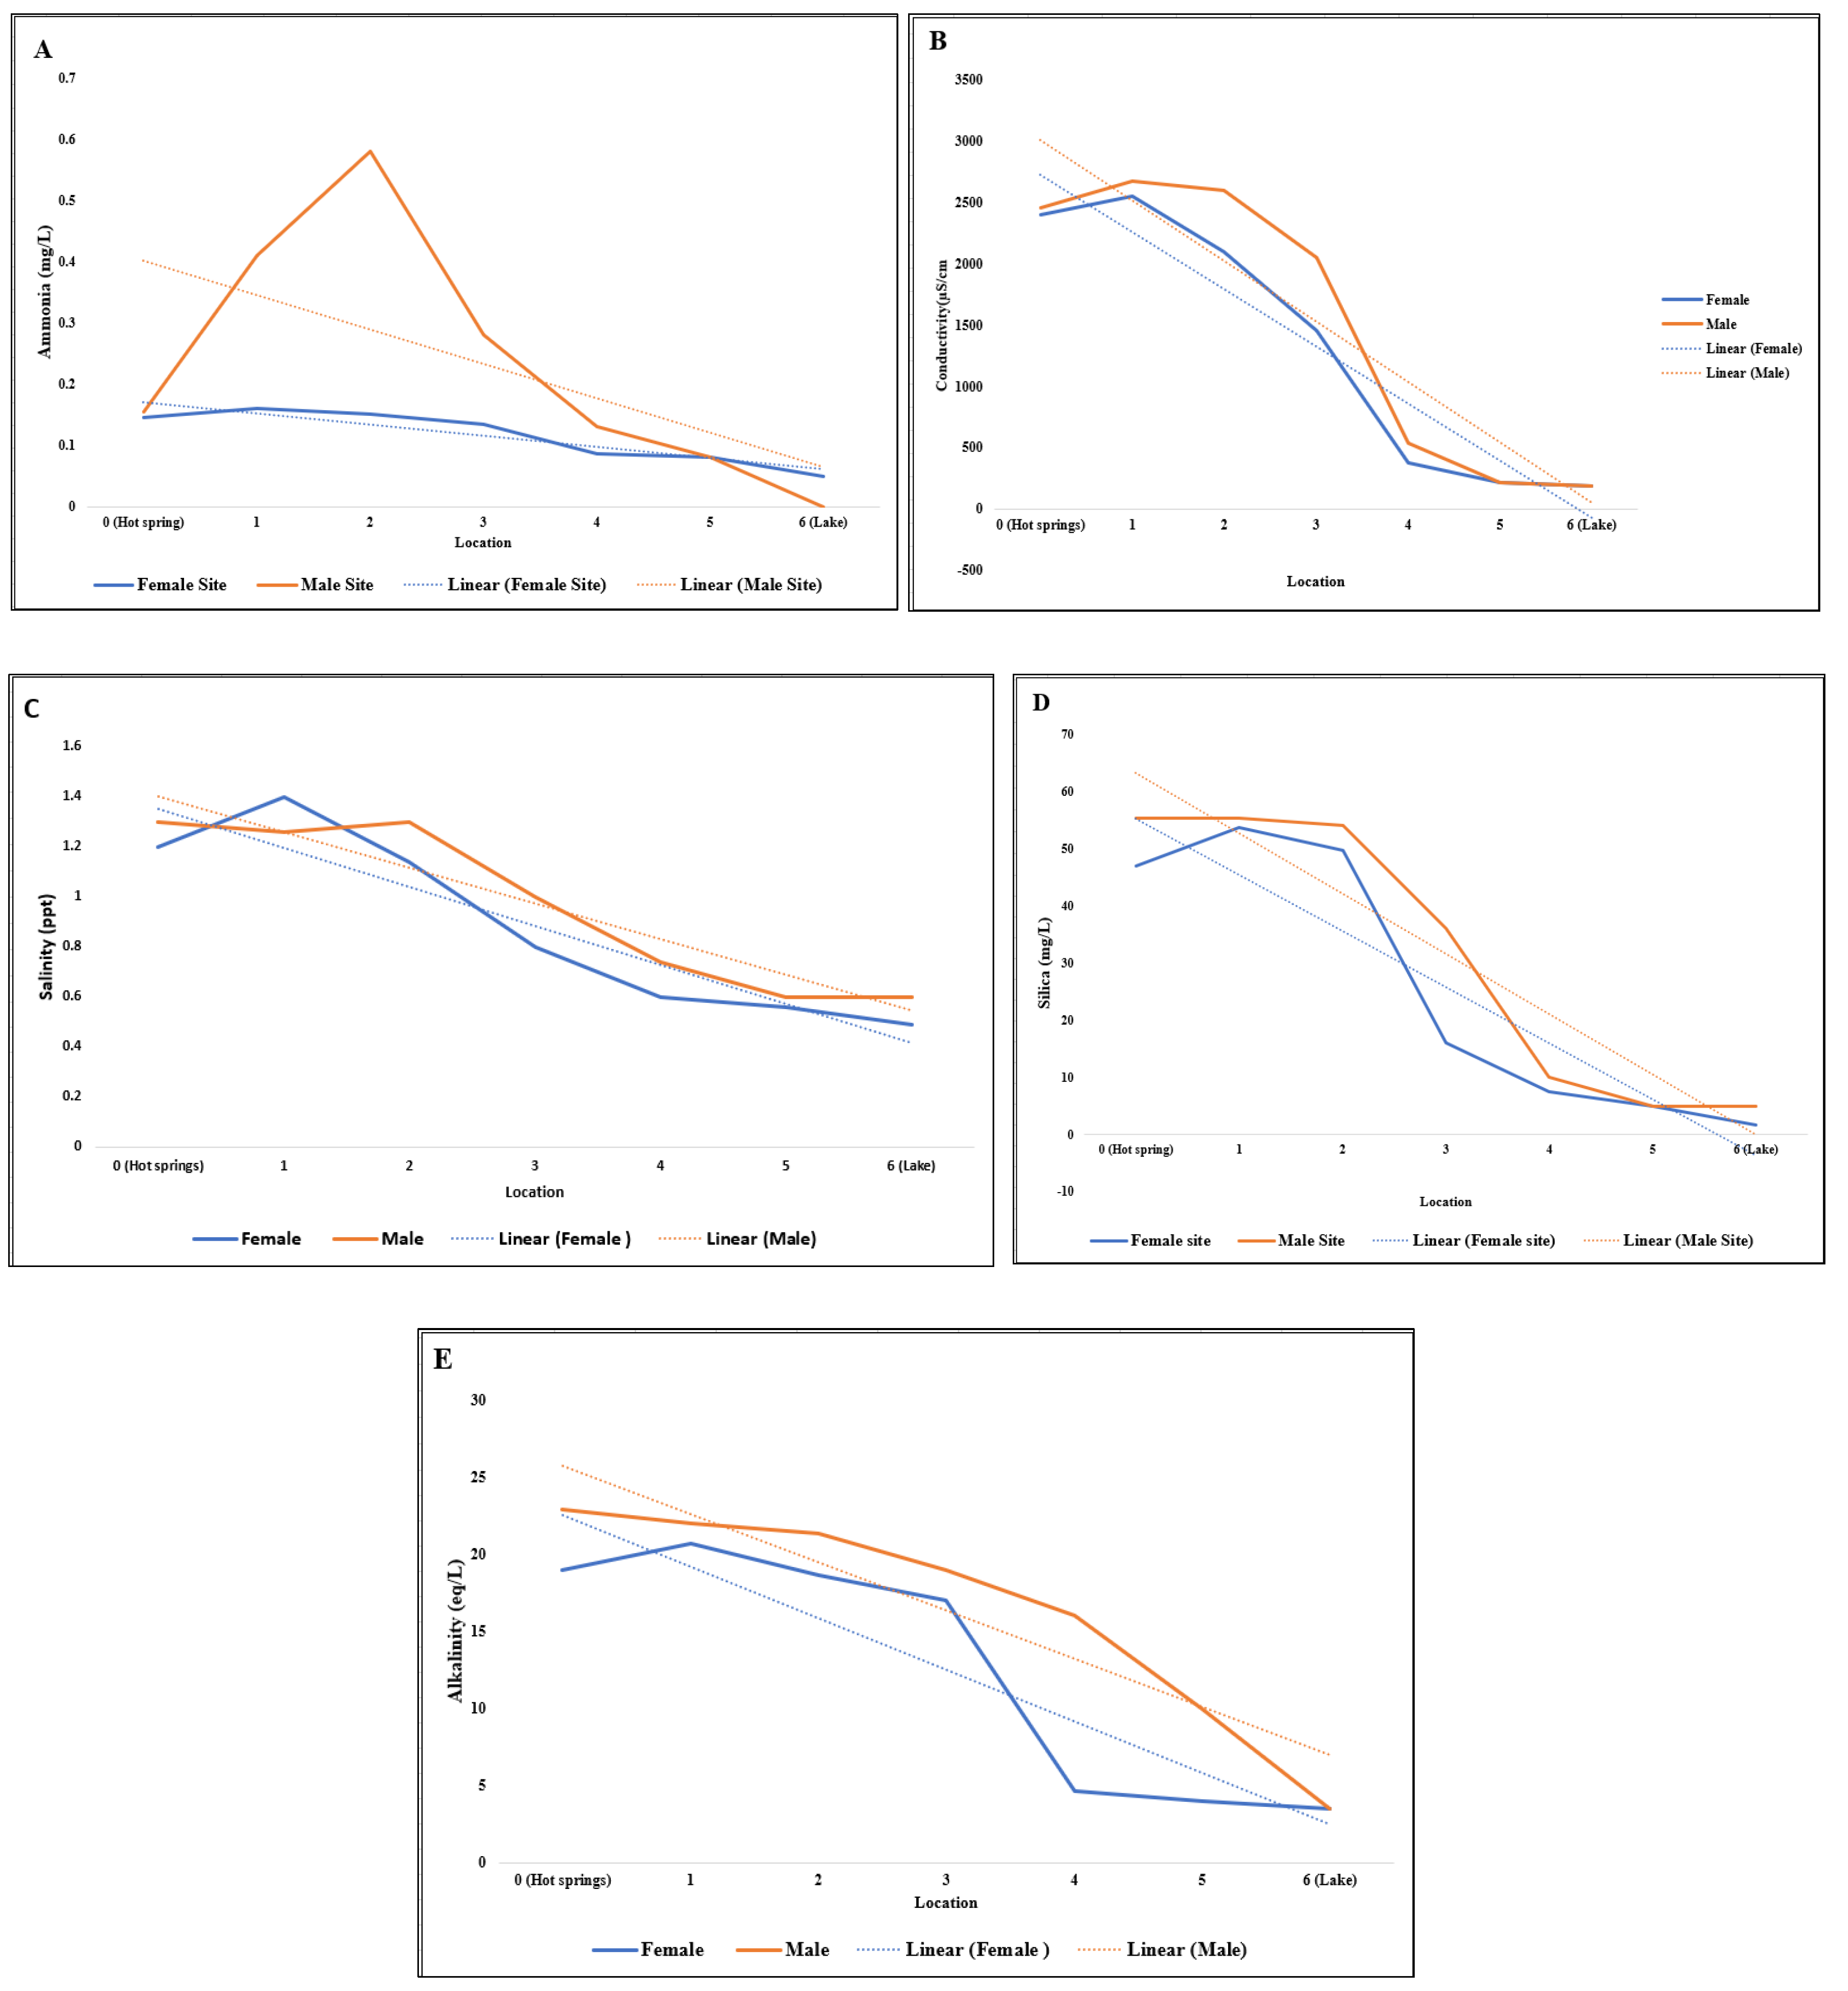
| Parameter/ Location | Ammonia (mg/L) | Silica (mg/L) | Conductivity (µs/cm) | Salinity (ppt) | Alkalinity (eq/L) |
|---|---|---|---|---|---|
| 0 (Hot springs) | 0.145 | 47 | 2400 | 1.2 | 19 |
| 1 | 0.16 | 53.7 | 2550 | 1.4 | 20.7 |
| 2 | 0.15 | 49.6 | 2100 | 1.14 | 18.7 |
| 3 | 0.135 | 16 | 1450 | 0.8 | 17.0 |
| 4 | 0.087 | 7.5 | 375 | 0.6 | 4.6 |
| 5 | 0.08 | 5 | 210 | 0.56 | 4.0 |
| 6 (Lake) | 0.05 | 1.7 | 185 | 0.49 | 3.5 |
| Parameter/ Location | Ammonia (mg/L) | Silica (mg/L) | Conductivity (µs/cm) | Salinity (ppt) | Alkalinity (eq/L) |
|---|---|---|---|---|---|
| 0 (Hot springs) | 0.15 | 53.7 | 2470 | 1.3 | 22.0 |
| 0.16 | 57.0 | 2450 | - | 23.8 | |
| 1 | 0.41 | 55.3 | 2670 | 1.26 | 22.0 |
| 2 | 0.58 | 54 | 2600 | 1.3 | 21.4 |
| 3 | 0.28 | 36 | 2050 | 1.0 | 19.0 |
| 4 | 0.13 | 10 | 540 | 0.74 | 16.0 |
| 5 | 0.08 | 5 | 210 | 0.6 | 10.0 |
| 6 (Lake) | 0 | 5 | 185 | 0.6 | 3.5 |
| Parameter/ Location | Ammonia (mg/L) | Silica (mg/L) | Conductivity (µs/cm) | Salinity (ppt) | Alkalinity (eq/L) | Iron (mg/L) | Phosphate (mg/L) | Sulfate (mg/L) |
|---|---|---|---|---|---|---|---|---|
| Source | 0.152 | 52.57 | 2440 | 1.25 | 21.6 | 0.2 | 0.31 | 75.7 |
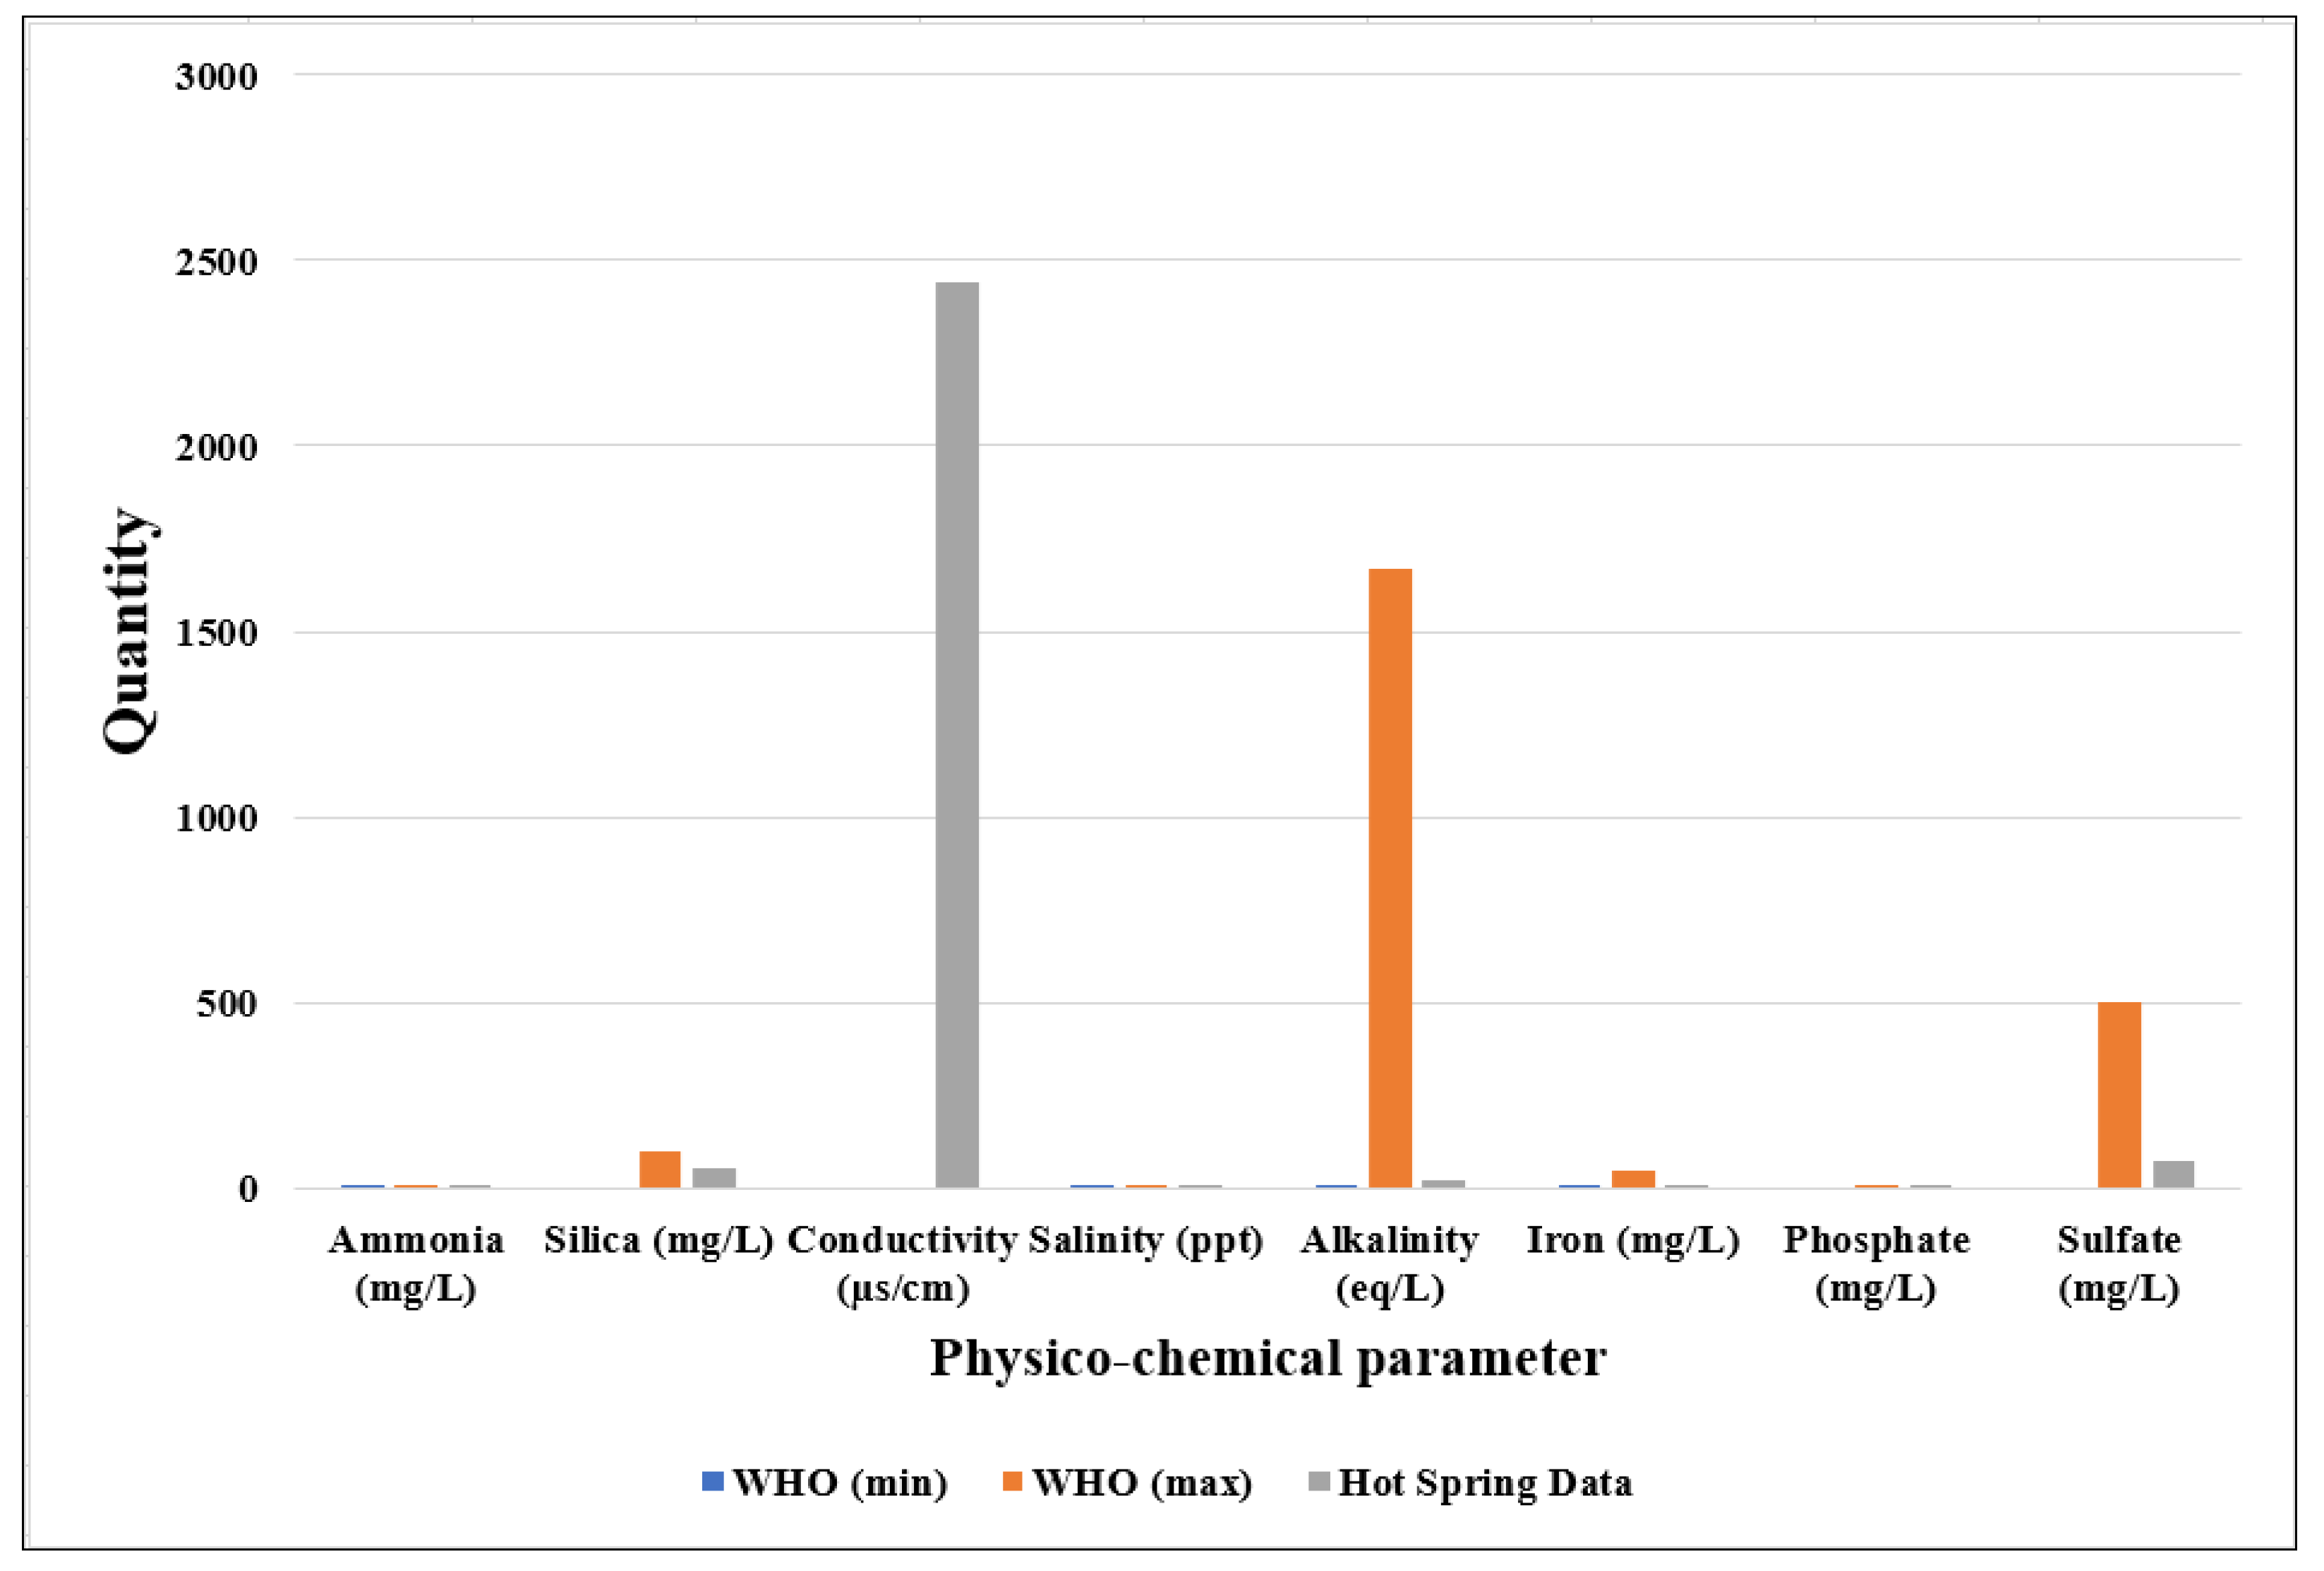
| No | Chemicals | WHO (Min) | WHO (Max) | Hot Spring Data | Reference |
|---|---|---|---|---|---|
| 1 | Ammonia (mg/L) | 0.2 | 3 | 0.152 | [28,29] |
| 2 | Silica (mg/L) | - | 100 | 52.57 | [30] |
| 3 | Conductivity (µs/cm) | - | - | 2440 | |
| 4 | Salinity (ppt) | 0.3 | 1.7 | 1.25 | [28] |
| 5 | Alkalinity (eq/L) | 2.7 | 1668 | 21.6 | [28,31] |
| 6 | Iron (mg/L) | 0.5 | 50 | 0.2 | [29] |
| 7 | Phosphate (mg/L) | - | 5 | 0.31 | [29] |
| 8 | Sulfate (mg/L) | - | 500 | 75.7 | [29] |
Publisher’s Note: MDPI stays neutral with regard to jurisdictional claims in published maps and institutional affiliations. |
© 2022 by the authors. Licensee MDPI, Basel, Switzerland. This article is an open access article distributed under the terms and conditions of the Creative Commons Attribution (CC BY) license (https://creativecommons.org/licenses/by/4.0/).
Share and Cite
Hategekimana, F.; Mugerwa, T.; Nsengiyumva, C.; Byiringiro, F.V.; Rwatangabo, D.E.R. Geochemical Characterization of Nyamyumba Hot Springs, Northwest Rwanda. AppliedChem 2022, 2, 247-258. https://doi.org/10.3390/appliedchem2040017
Hategekimana F, Mugerwa T, Nsengiyumva C, Byiringiro FV, Rwatangabo DER. Geochemical Characterization of Nyamyumba Hot Springs, Northwest Rwanda. AppliedChem. 2022; 2(4):247-258. https://doi.org/10.3390/appliedchem2040017
Chicago/Turabian StyleHategekimana, Francois, Theophile Mugerwa, Cedrick Nsengiyumva, Fils Vainqueur Byiringiro, and Digne Edmond Rwabuhungu Rwatangabo. 2022. "Geochemical Characterization of Nyamyumba Hot Springs, Northwest Rwanda" AppliedChem 2, no. 4: 247-258. https://doi.org/10.3390/appliedchem2040017
APA StyleHategekimana, F., Mugerwa, T., Nsengiyumva, C., Byiringiro, F. V., & Rwatangabo, D. E. R. (2022). Geochemical Characterization of Nyamyumba Hot Springs, Northwest Rwanda. AppliedChem, 2(4), 247-258. https://doi.org/10.3390/appliedchem2040017