Review

The Past, Present and Future in Tube- and Paper-Based Colorimetric Gas Detectors

1
Komyo Rikagaku Kogyo K. K., 1-8-28 Shimonoge, Takatsu-Ku, Kanagawa, Kawasaki City 213-0006, Japan
2
Kitagawa America, 200 Wanaque Avenue, Suite 204, Pompton Lakes, NJ 07442, USA
*
Author to whom correspondence should be addressed.
AppliedChem 2021, 1(1), 14-40; https://doi.org/10.3390/appliedchem1010003
Submission received: 8 July 2021 / Revised: 31 July 2021 / Accepted: 4 August 2021 / Published: 18 August 2021

Abstract

:
Colorimetric gas detectors have been widely applied in many fields such as environmental sciences, industrial hygiene, process control, forensic science and indoor air quality monitoring. They have a history of about 100 years and include devices such as gas detector tubes and paper-based gas detectors. The sensitivity and selectivity of the colorimetric gas detector are relatively high compared to other types of gas detectors such as semiconductor, catalytic combustion and electrochemical gas detectors. Detection of gas concentration can be performed by the naked eye in some colorimetric gas detectors. These methods do not require an electrical power source and are simple, so they are suitable for field operations. This review introduces the history and provides a general overview of the development in the research of colorimetric gas detectors. Recently, the sensitivity and selectivity of colorimetric gas detectors have improved. New materials such as enzymes or particles with a large surface area have been utilized to improve selectivity and sensitivity. Moreover, new gas detectors without toxic materials have been developed to reduce the environmental load. At present, there is a rapid development of IoT sensors in many industrial fields, which might extend the applications of colorimetric gas detectors in the near future.

1. Introduction

Gas detectors have been developed to protect human life, property and the environment. They are widely applicable and convenient for users who are not specialists in this field.
In World War I, animals such as dogs, birds and snails were used to alert people to the presence of toxic gases or oxygen deficiency [1] (p. 5) [2]. The operator confirmed the presence of toxic gases from the abnormal behavior of these animals. These were called “animal detectors”. However, some animals are not sensitive to toxic gases. Moreover, it is not easy to confirm the information as to the presence of toxic gases from these animals.
The development of simplified detectors for mustard agent was attempted with selenious acid, iodine pentoxide or hydrogen sulfide based on the principle of chemical discoloration. However, none of these detectors were perfected before the end of World War I [1] (p. 4).
A gas detector tube method was developed in the USA in 1918. Hoover et al. developed the first detector tube for carbon monoxide (CO). The gas detector tube method consists of a manual aspirating sampling pump and a disposable gas detector tube. The color of a chemical reagent in a glass tube changes upon reaction with CO. That tube was only used for qualitative detection as quantitative measurement was not yet possible [3]. Kitagawa developed a detector tube that was able to quantify hydrogen sulfide (H2S) gas concentration in 1946 [4]. Today, many companies have expanded the product line of detector tubes capable of detecting more than 300 different gases.
A gas sensing paper and color intensity reader for the gas monitoring system using a color reaction was developed in 1940 [5]. The degree of color change of the gas detection paper was monitored as a function of the intensity of the reflected light from a lamp. A tape-type gas detection paper monitor has a continuous monitoring and alarm capability [6].
A gas detection paper method is a visual detector and does not need any other extra devices for its operation [7]. Some gas detection paper can be used as a “passive sampler”. The sampler is designed like a badge and clips to a worker’s body for personal sampling. It can also be placed in an appropriate location in the area to be sampled. After several hours, the sampler is simply detached from the worker’s body and transferred to a photometer for measurement of gas concentration [8].
Recently, biosensors for detecting various gases have been developed to improve the selectivity for target gases. Enzymes with high selectivity are used for gas detectors. The color of detection paper is changed by enzymatic reaction. Gas concentration can be read by the naked eye and can be measured by a photometer [9,10].
Colloidal silica gel possesses many superior properties because of its large surface area [11]. In particular, the reactivity of a sensing material coated with colloidal silica can be changed because of its high surface-to-volume ratio. Colloidal silica-decorated materials such as particles or paper are sensing materials with high sensitivity.
As a recent trend, research on gas sensors using Internet of Things (IoT) and smartphone technology has been reported. In the future, the digitization of gas sensing will be promoted with the development of IoT [12,13]. These applications will have broad market prospects for gas sensing such as in industrial safety and process control.
In this present review, the highlights of the history and new technology of tube- and paper-based colorimetric gas detectors are introduced. Colorimetric gas detectors are a simple, easy to operate and rapid technique without expensive devices or specified skilled operators for analytical chemistry.
The application of these colorimetric gas detectors in collaboration with new materials and IoT technology is very bright.

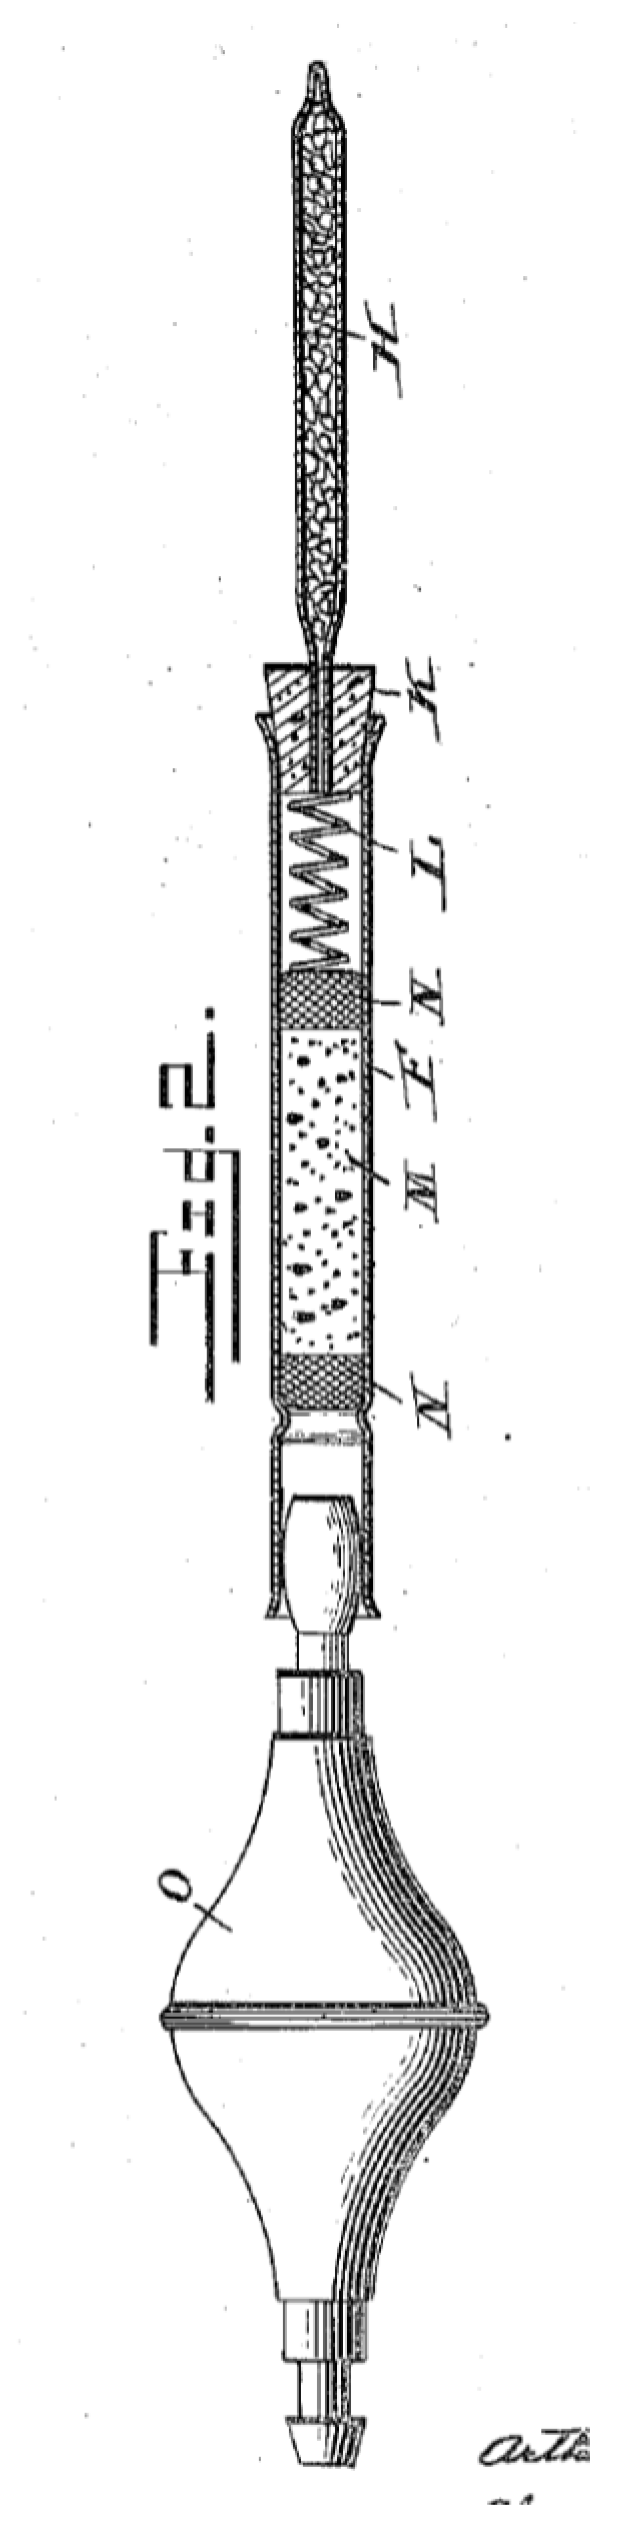
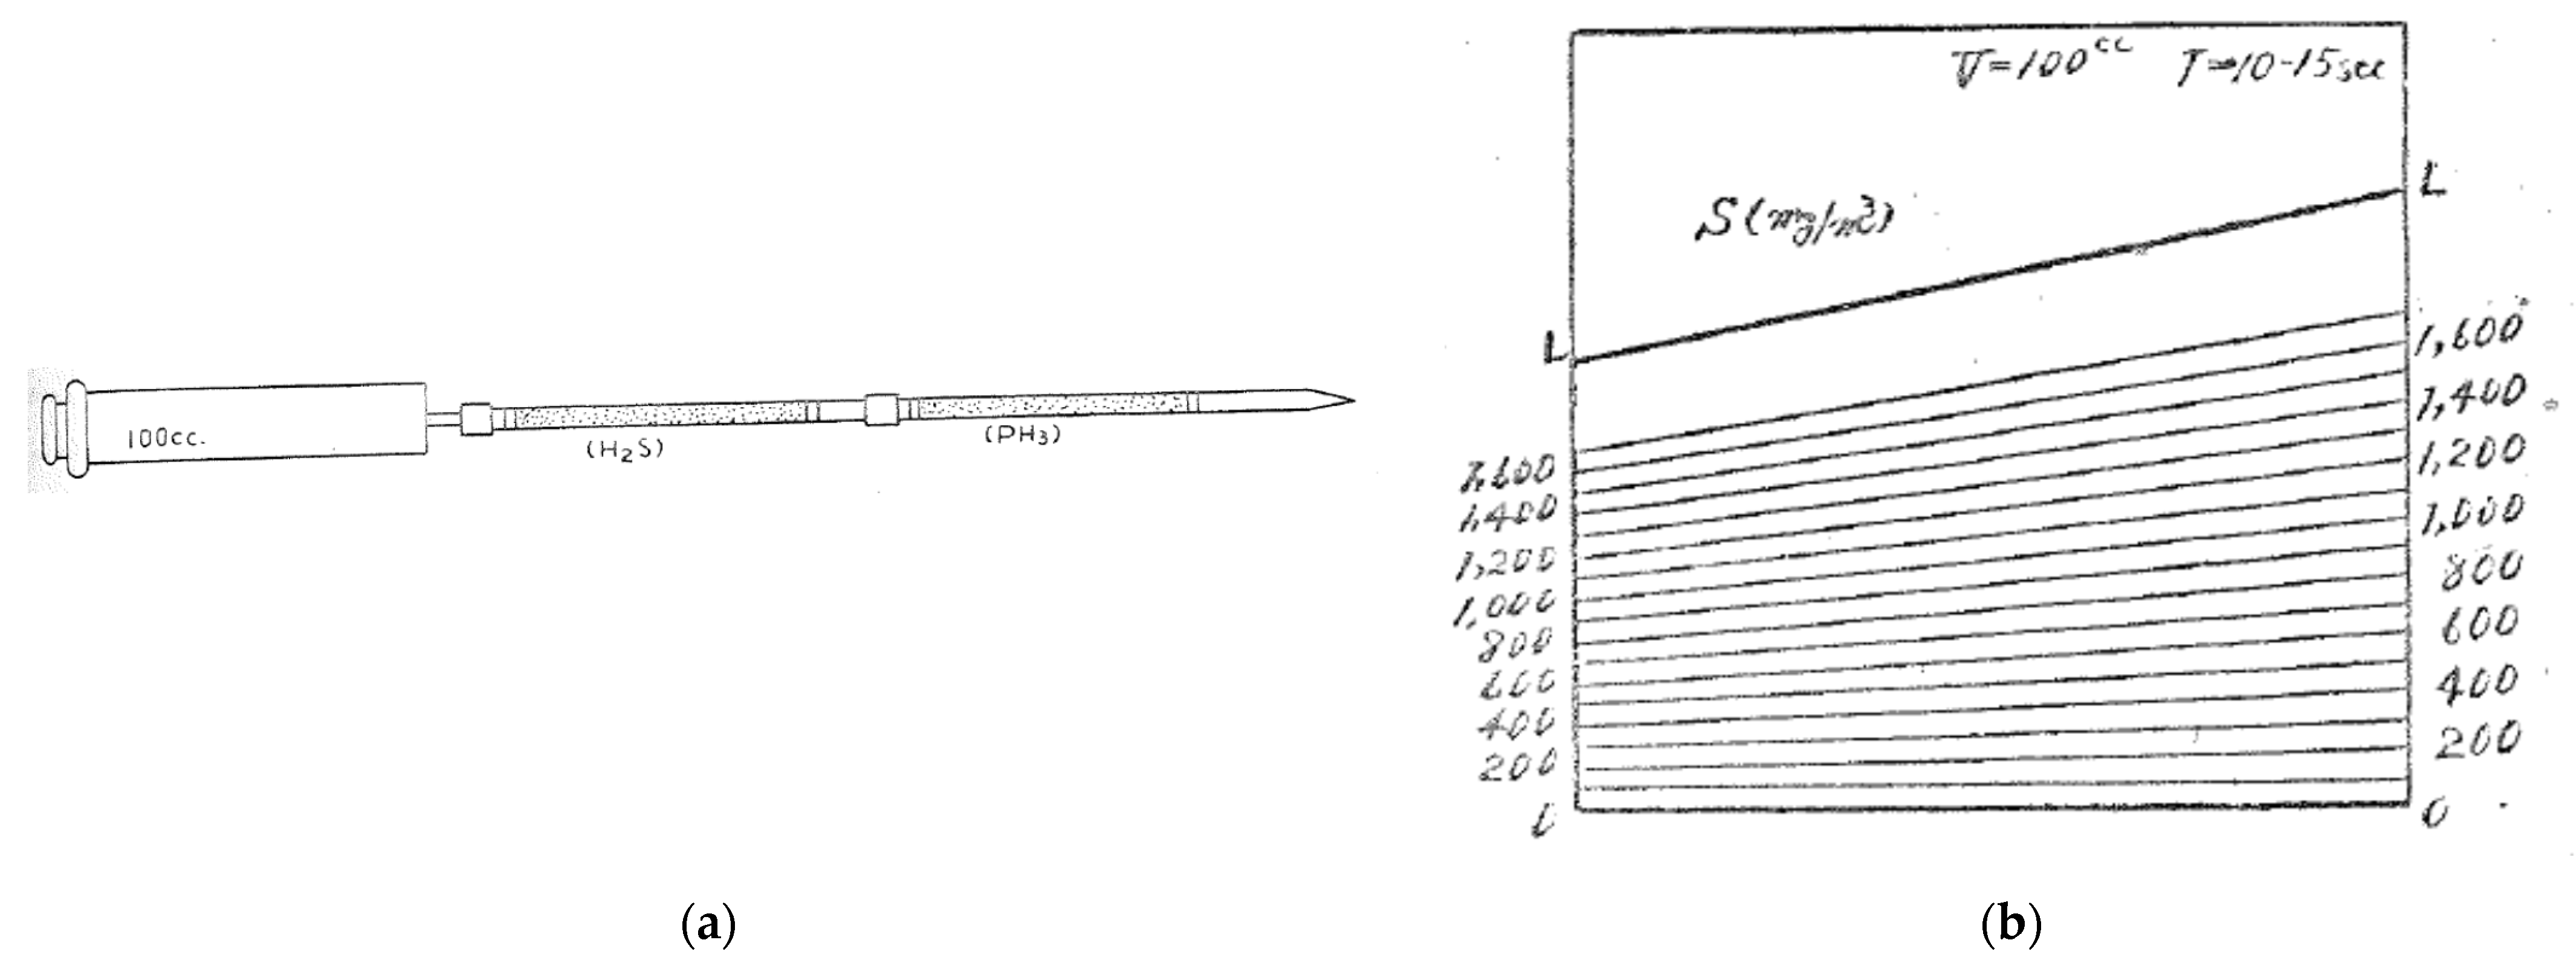
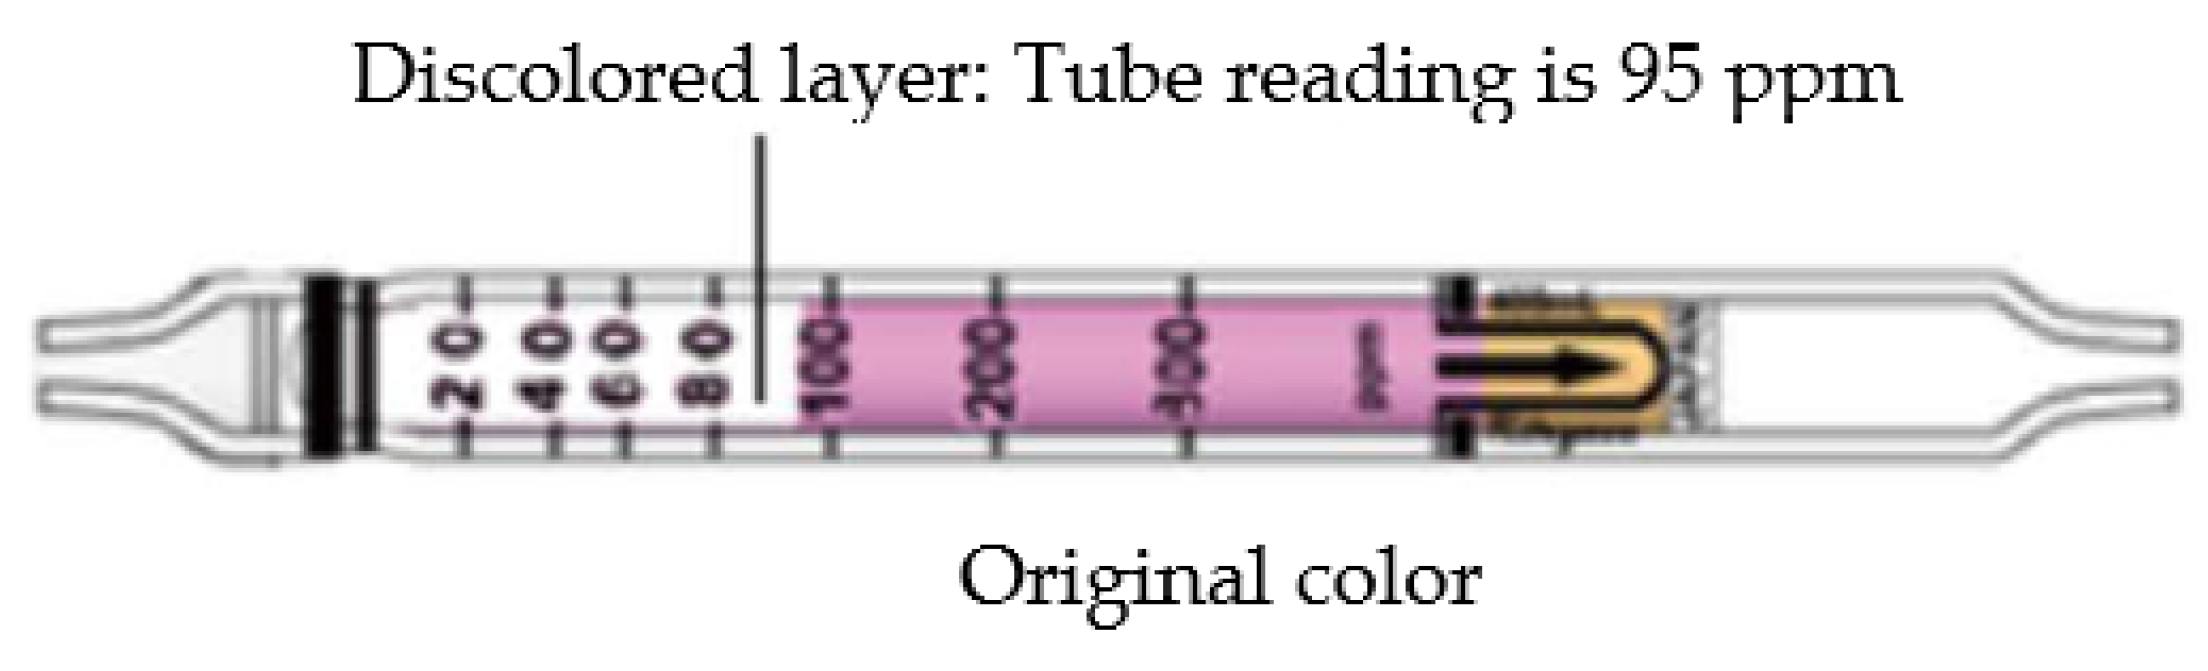
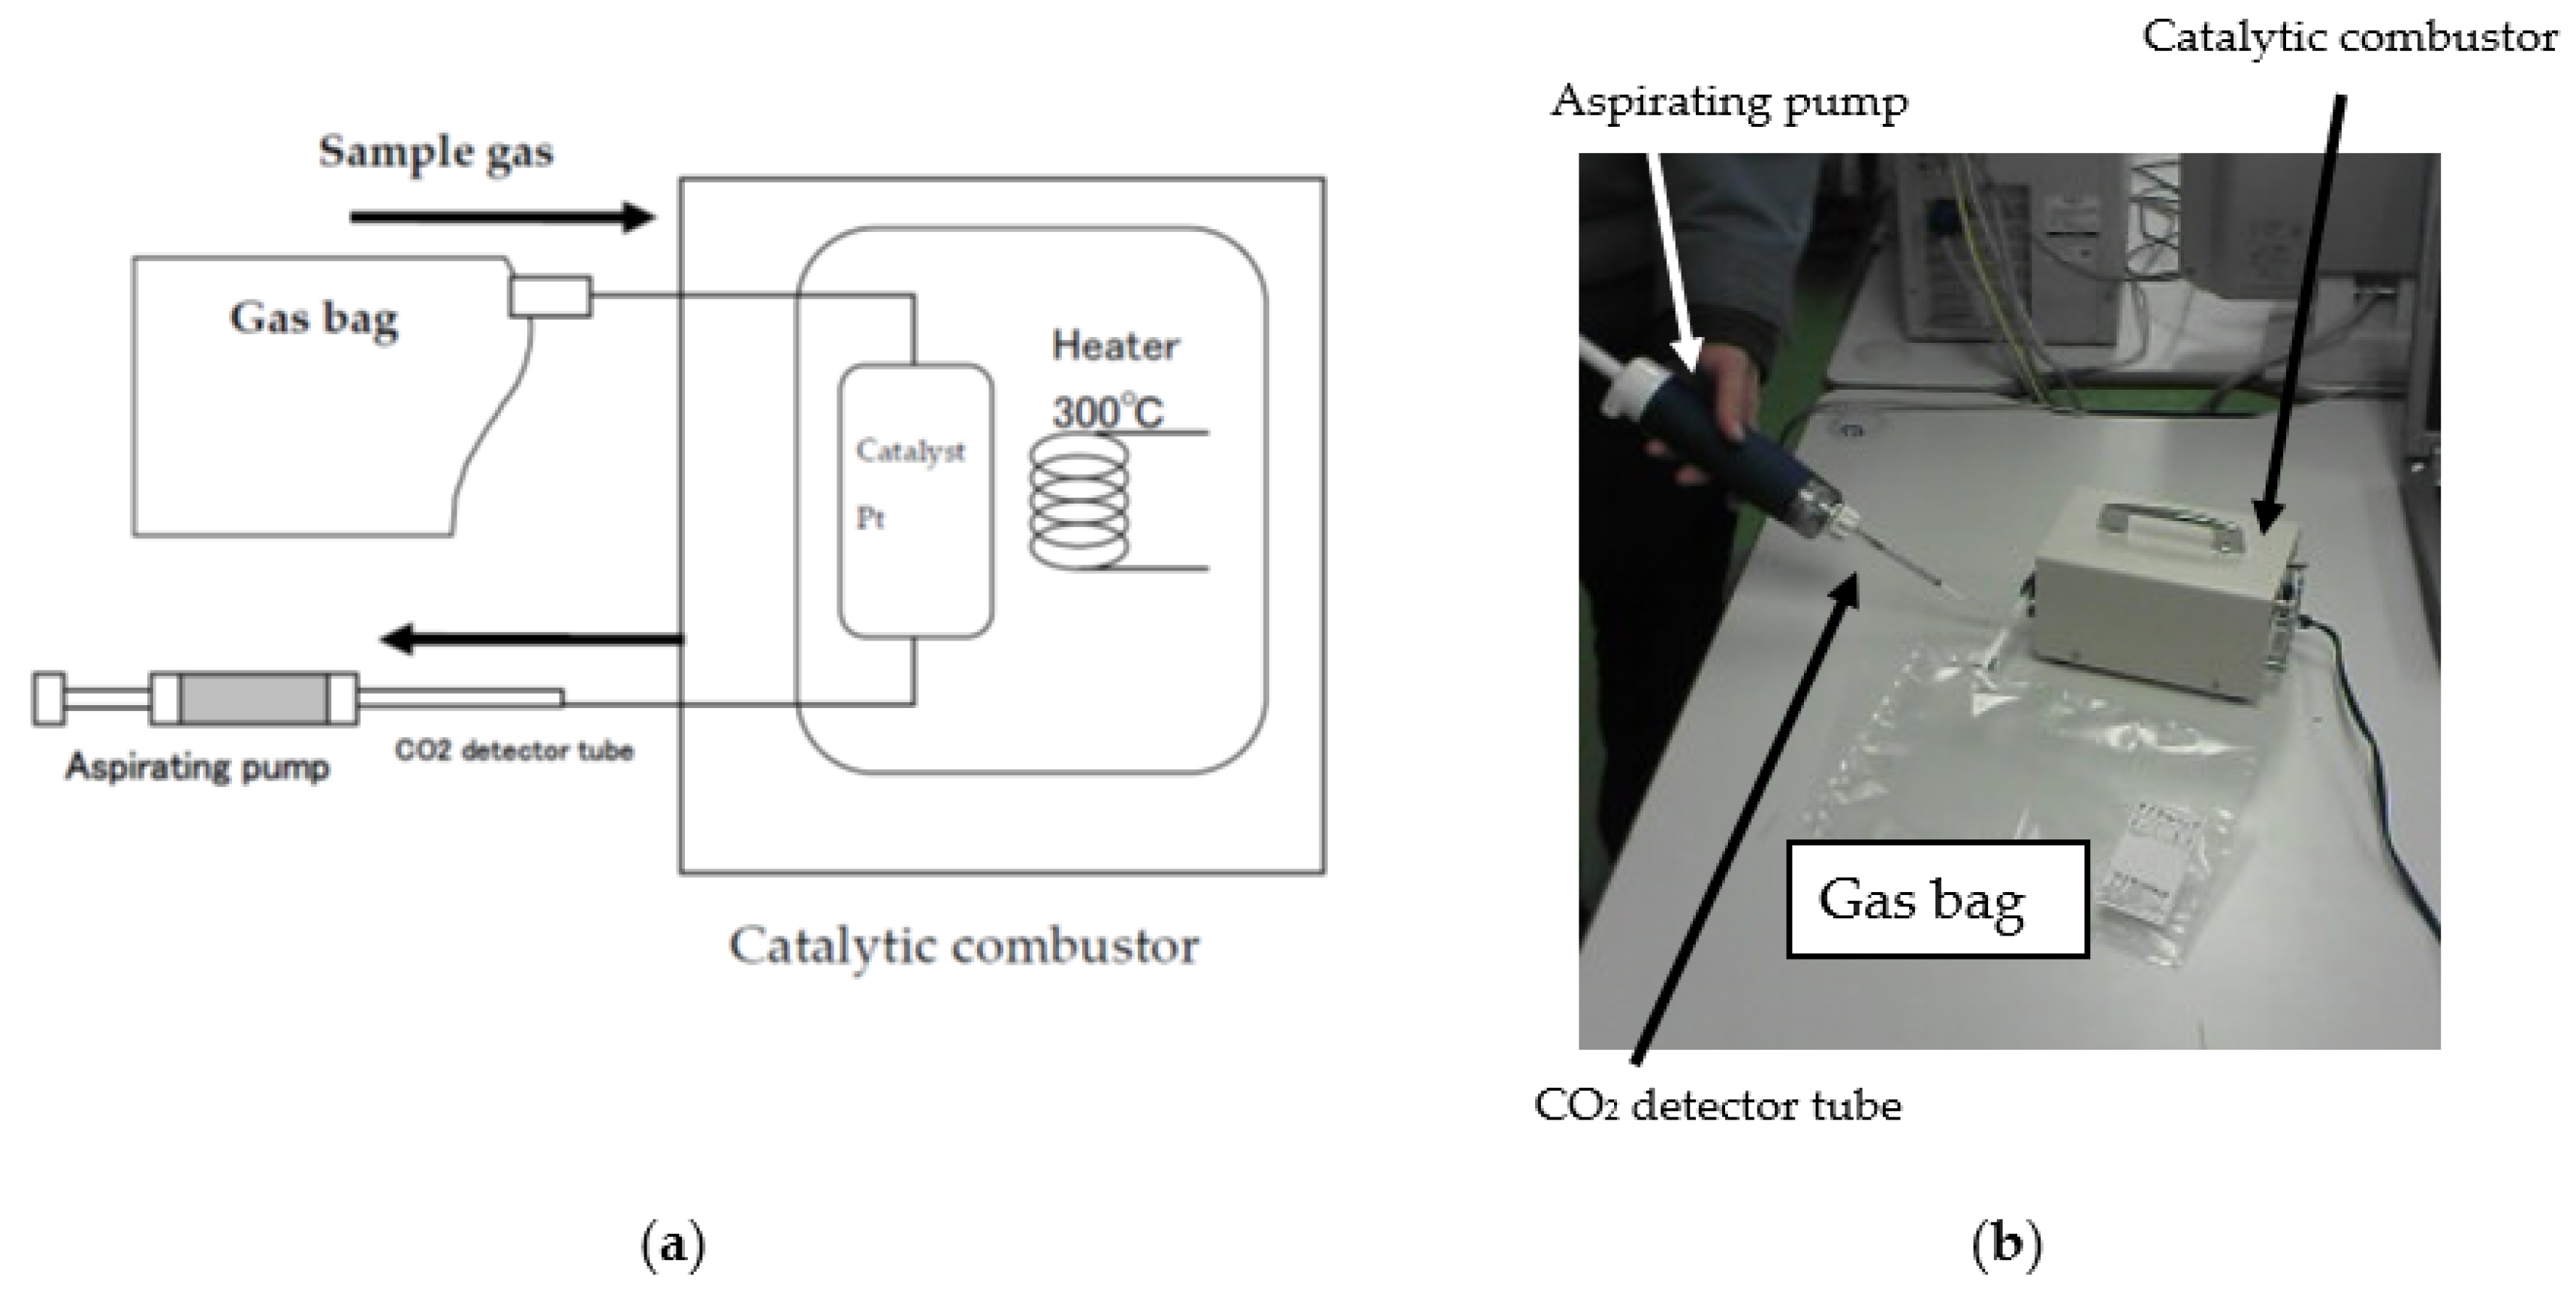
2. Gas Detector Tube Method

The gas detector tube method was developed by A.B. Lamb and C.R. Hoover in 1918. They developed a simplified CO detector for mines, industrial plants, etc. A mixture of pumice stone, fuming sulfuric acid and iodic anhydride was used as a chemical reagent in the glass tube. Both ends of the tube were hermetically sealed with flame. Before measurement, both ends of the detector tube were opened with an ampoule cutter.
A rubber bulb was attached to the end of the tube to force gas through the tube (Figure 1). The chemical reagent for the detection of CO was in the glass tube, where the presence of CO would cause the characteristic color change from white to brown. The color of the tube changed instantly at a concentration of 1% and changed within 15 s at a concentration of 0.01%. This tube was only used for qualitative detection [3]. Because the amount and flow rate of gas was not controlled, there was no stable relationship between discoloration and gas concentration. Therefore, quantitative measurement was not yet possible.
Kitagawa developed a detector tube that can quantify H2S gas concentration from the length of the discolored layer in 1946 [4]. In order to control the process during fertilizer production, it was necessary to easily measure H2S, which is a catalytic poison. The amount and flow rate of gas through the tube were controlled in this method. The sample gas was sent into the detector tube at a definite velocity (1 min) and volume (100 mL) with a piston-type sampling pump and rubber tubing, as shown in Figure 2a.
The chemical reagent was made of lead acetate and silica gel particle. This reagent was loaded into a glass tube with a 3 mm inner diameter. If H2S exists in the sample, the detector tube changes immediately from its white original color to dark brown from the gas inlet side and shows a distinct length of the discolored layer when gas sampling is finished. The length of the discolored layer is proportional to the concentration of H2S in the sample gas. The measurement of a discolored length enables the determination of the concentration of H2S with the concentration chart shown in Figure 2b.
This method was confirmed with an accuracy of ±5%.
Nowadays, the aspirating pump and direct reading tube method have been used for gas detector tubes, as shown in Figure 3. By pulling the pump handle, the pressure inside the pump is reduced, and the sample gas is aspirated into the pump through the detector tube. Sampling velocity is controlled by the pressure drop of the detector tube.
The gas concentration scale is printed directly on the detector tube. This makes it convenient for taking gas measurements on-site because the tube is read just like a thermometer (Figure 4).
Temperature can affect the measurement in several ways: (1) an increase or decrease in the sample volume due to temperature change, (2) a change in the quantity of gas absorbed by the detecting reagent and (3) a change in the rate in which the detecting reagent reacts with the gases. These effects can overlap each other, causing the length of the discolored layer in the detector tube to increase or decrease, or they can offset one another, thereby having no effect on the measurement result. Some gas detector tubes that can be affected by the temperature are provided with a temperature correction table as part of the instruction manual of the detector tube.
The detecting reagents in gas detector tubes are formulated to react uniquely with the gas to be measured. However, detector tubes can also show a similar reaction (color change) with another gas having similar properties. A coexisting gas can have a similar or different color change. It is necessary to be aware of a color change different from that stated in the instruction manual of the detector tube.
Nowadays, more than 300 different gases and vapors such as CO2, CO, O2, O3, HCN, HCl, NOx, SO2, H2O, H2O2, NH3, Cl2, H2 and VOCs can be measured using the gas detector tube method [16]. This method is used in various fields such as industrial hygiene [17,18], fire prevention [19], forensics science [20], atmospheric environment [21], indoor air quality [22], odor measurement [23] and science education [24,25,26].
The detector tube has been improved to measure ultralow concentrations of gas with an electric sampling pump (Figure 5a). The sensitivity is improved by increasing the volume of the sample being drawn [22,27]. The formaldehyde (HCHO) detector tube using hydroxylamine as a reaction reagent can detect down to 0.08 ppm (World Health Organization standard [28]) of HCHO gas for prevention of sick building syndrome (SBS). The sampling time is 30 min and the sampling volume is 9 L. In addition, a detector tube with improved sensitivity has been developed by increasing the surface area of the reagent carrier. A detection reagent was prepared using quartz sand coated with colloidal silica to increase the surface area as a carrier. The detector tube for acetic acid and formic acid was developed by using this method. That detector tube can measure a concentration as low as 10 to 1000 μg/m3 (Figure 5b). The sampling time is 60 min and the sampling volume is 12 L [11].
A simplified detection method based on thermal desorption (TD) coupled to a gas detector tube (TD-GD method) was developed to improve the sensitivity of the gas detector tube method in 2000 [29]. The TD-GD method is based on the absorption of the VOCs in a charcoal tube and then thermally desorbing them. A large amount of gas is sampled and concentrated in the charcoal tube with an electric sampling pump. The VOCs are desorbed with heat and are detected with a gas detector tube (Figure 6). The detector tube is based on the principle that toluene gas reacts with iodine pentoxide producing a brown-colored product, iodine. This method is able to detect down to 0.012 ppm (50 μg/m3) of toluene gas, a lower concentration than the WHO guideline value (0.07 ppm) for indoor air [28]. It can be utilized in the control and prevention of SBS.
Total volatile organic compounds (TVOCs) that cause suspended particulate matter (SPM) and oxidants have been used as a pollution index of the atmospheric environment [30]. The Japanese Air Pollution Control Act has an emission regulation for exhaust TVOCs from factories. However, the composition ratio of VOCs in the exhausted gases always differs depending on the factory’s process of manufacturing. Because the sensitivity of simple methods such as gas detector tubes differs depending on the type of VOC, the simple gas detector cannot measure the absolute concentration (mg/m3, ppm) of mixed VOC gases in principle.
The catalytic combustion gas detector method (CC-GD method) was developed to detect TVOCs with a gas detector tube [31]. TVOCs are oxidized by a heated catalyst at 300 °C to produce CO2 as shown in Equation (1). Generated CO2 is measured with a gas detector tube for CO2 (Figure 7a,b).
  Catalyst ( Pt )   at   300 ° C Various   VOCs + O 2   Carbon   Dioxide   C 7 H 8 ( Toluene )   7 CO 2 100   ppm 700   ppm
Various VOCs are oxidized and produce an amount of CO2 in accordance with the carbon amount of each VOC. As an example, 100 ppm of toluene is oxidized to 700 ppm of CO2. A pH indicator is used as the reaction reagent in the CO2 detector tube. Sample gas is collected in a gasbag. Background CO2 in the bag is measured as a blank. The gasbag, catalytic combustor and gas detector tube are then connected as shown in Figure 7a. Sample gas in the gasbag is aspirated into the gas detector tube through the catalytic combustor. VOCs are decomposed into carbon dioxide by heated catalysis and then measured as CO2. The concentration of background CO2 in the blank is subtracted from the concentration of CO2 that passed through the catalytic combustor to determine the concentration of TVOCs.
The concentration of TVOCs measured by the CC-GD method can be confirmed by a gas chromatography–flame ionization detection (GC-FID) method. The results are displayed in Table 1. The concentration of VOCs obtained by the CC-GD method was in good agreement with that of the GC-FID method.
Toxic heavy metals such as mercury or chromium oxide (VI) (Cr(VI)) are used for gas detector tube reaction reagents as shown in Equations (2)–(4) [32,33,34]. Mercury chloride (HgCl2) is used for the detection of PH3, H2S, mercaptans and so on. Cr(VI) is used for the detection of VOCs as an oxidizer in detector tubes. The color of mercury and Cr(VI) in the detector tubes changes upon reaction with target gases. Figure 8 and Figure 9 show a gas detector tube that contains mercury and Cr(VI) as an example. However, these metals are toxic and regulated in many countries to prevent environmental pollution [35].
H 2 S + HgCl 2   HgS + 2   HCl 2   White     Black  
  PH 3 + 3 HgCl 2 P ( HgCl ) 3 + 3 HCl White     Yellow
The reagent color of the detector tube changes with HCl and a pH indicator.
VOCs + Cr 6 + + H 2 SO 4   Cr 3 + + Oxidation   product Yellow   or   orange Pale   blue   or   brown
The color change depends on the design of the chemical reagent.
Recently, detector tubes that do not use toxic heavy metals have been developed to reduce the environmental load. In particular, mercury and its compounds are regulated in many countries to prevent mercury poisoning. More than 140 countries agreed in the Minamata Convention on Mercury by the UNEP to prevent the emission of mercury [37]. Therefore, detector tubes using gold chloride have been developed, but the price of gold is high and it is not preferred as a reagent material for the product.
Then, gas detector tubes for PH3 and H2S detection made without mercury and gold were developed. Silver was chosen as an indicator for PH3 and H2S detection because silver is a well-described reagent and good for environmental load reduction [36,38].
Figure 10 shows a PH3 gas detector tube with silver sulfate as an example. The measurement range of the detector tube is 10–700 ppm. The sampling time is one minute and the sampling volume is 100 mL. The chemical reaction is shown in Equation (5).
2 PH 3 + 3 Ag 2 SO 4 2 Ag 3 PO 4 + 3 H 2 SO 4     White   Brown
Gas detector tubes for VOC detection without Cr(VI) have been developed [15]. Potassium manganate (VII) (KMnO4) was chosen as an indicator because it is a well-described VOC oxidizer and its environmental impact potential is relatively low. The white discolored layer on the purple detector tube with KMnO4 increased as vapor concentrations of alcohols (ethanol, methanol and 2-propanol) increased in a range of 0–300 ppm. Figure 11 shows a gas detector tube for alcohols as an example. The sampling time is three minutes and the sampling volume is 100 mL. This method is based on the principle that alcohols react with KMnO4 to produce a colorless product (Equation (6)).
Mercury and Cr(IV) continue to be used in some gas detector tubes for the detection of certain other gases such as HCN or VOCs even today. Moreover, lead oxide has also been used as an oxidizer in detector tubes. Novel principles without requiring these toxic materials for gas detector tubes should be developed to reduce the environmental load.
Alcohols + KMnO 4 K + + MnO 2 + Oxidation   product Purple White
Possible oxidation products: carboxylic acid.
Kubota et al. developed the inorganic qualitative gas detector using five types of discoloration reagents together in a single tube for one-time measurement (Figure 12) [39,40]. The color of the reagents changes upon reaction with various inorganic gases. Inorganic gas can be qualitatively detected based on the combination of color changes in the tube (Figure 13). Organic gases also can be detected with chemical reagents for organic gases using a similar principle [40].
Most gas detector tubes are made with a glass tube filled with a chemical reagent particle. The length of the tube depends on the manufacturer; however, it is often about 80–120 mm. Small detector tube systems have been required, and the splintering of detector tube glass might cause an injury. Therefore, a gas detector tube in a small chip was developed. The chip (50 mm × 10.5 mm × 5 mm) contains 10 measurement capillaries filled with a chemical reagent for gas detection (Figure 14a) [41,42]. When the chip (Figure 14b) is inserted into the analyzer, all information required for the measurement is transferred to the handy size analyzer by means of a bar code on the chip. Gas concentration is measured from the discoloration time of the tube with the photometer in the analyzer. The measurement results are interpreted and corrected under the operating temperature specification automatically. This system can be used to measure 35 different gases and vapors.
SECTION CHEMICAL   REACTION   PRINCIPLES   A By   reacting   with   Phosphoric   acid ,   PH   indicator   is   discoloured .   2 NH 3   + H 3 PO 4     ( NH 4 ) 2 HPO 4 B By   reacting   with   an   Alkaline ,   PH   indicator   is   discoloured .   SO 2   + 2 NaOH     Na 2 SO 3 + H 2 O C By   reacting   with   o - Toluidine ,   Nitro - o - Toluidine ( Dyestuff )   is   liberated . D By   reacting   with   Lead   Acetate ( II ) ,   Lead   sulphide   is   produced .   H 2 S   + Pd ( CH 3 COO ) 2     PdS + 2 CH 3 COOH E Potasium   disulphide   palladate   ( II )   is   reduced   and   Palladium   is   liberated .   CO   + K 2 Pd ( SO 3 ) 2 K 2 ( SO 3 ) 2 PdCO   K 2 ( SO 3 ) 2 PdCO     CO 2 + SO 2 + K 2 SO 3

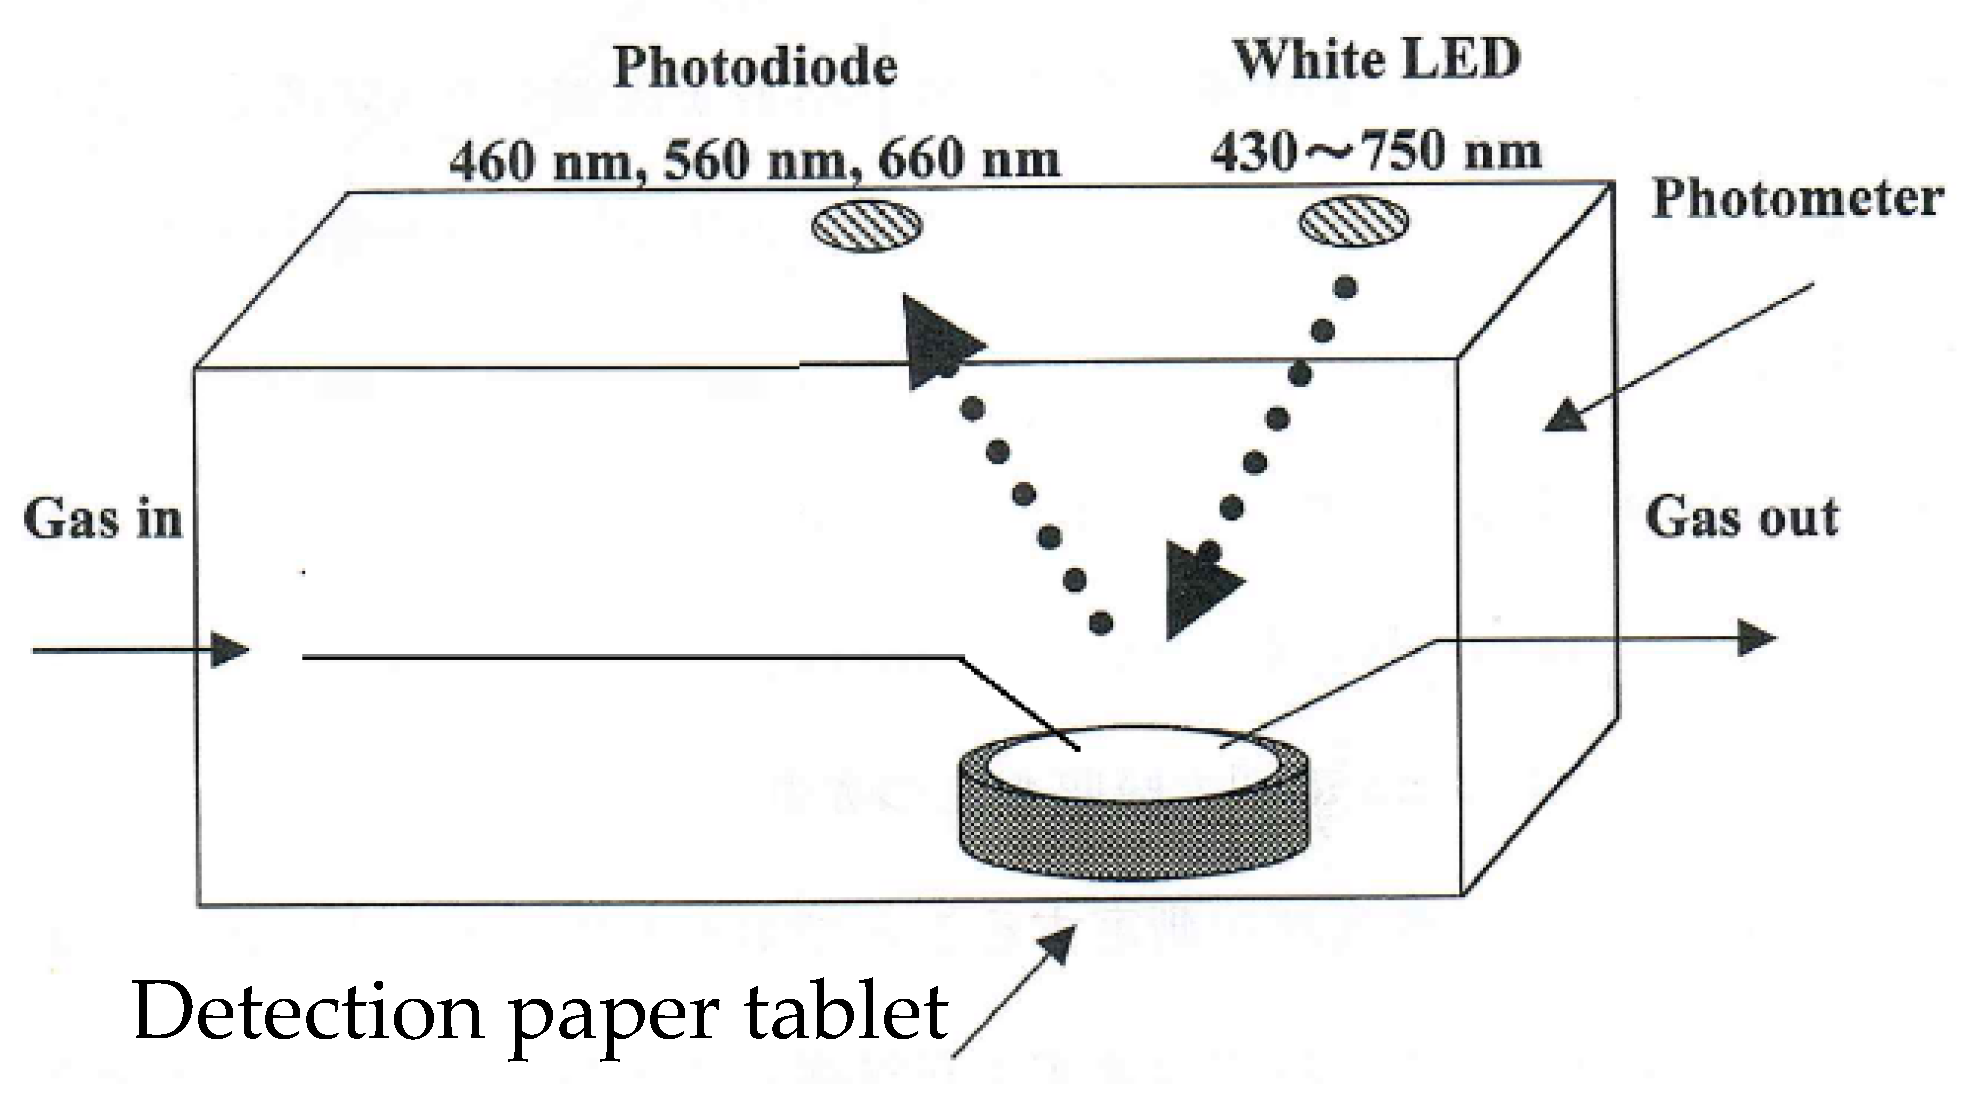
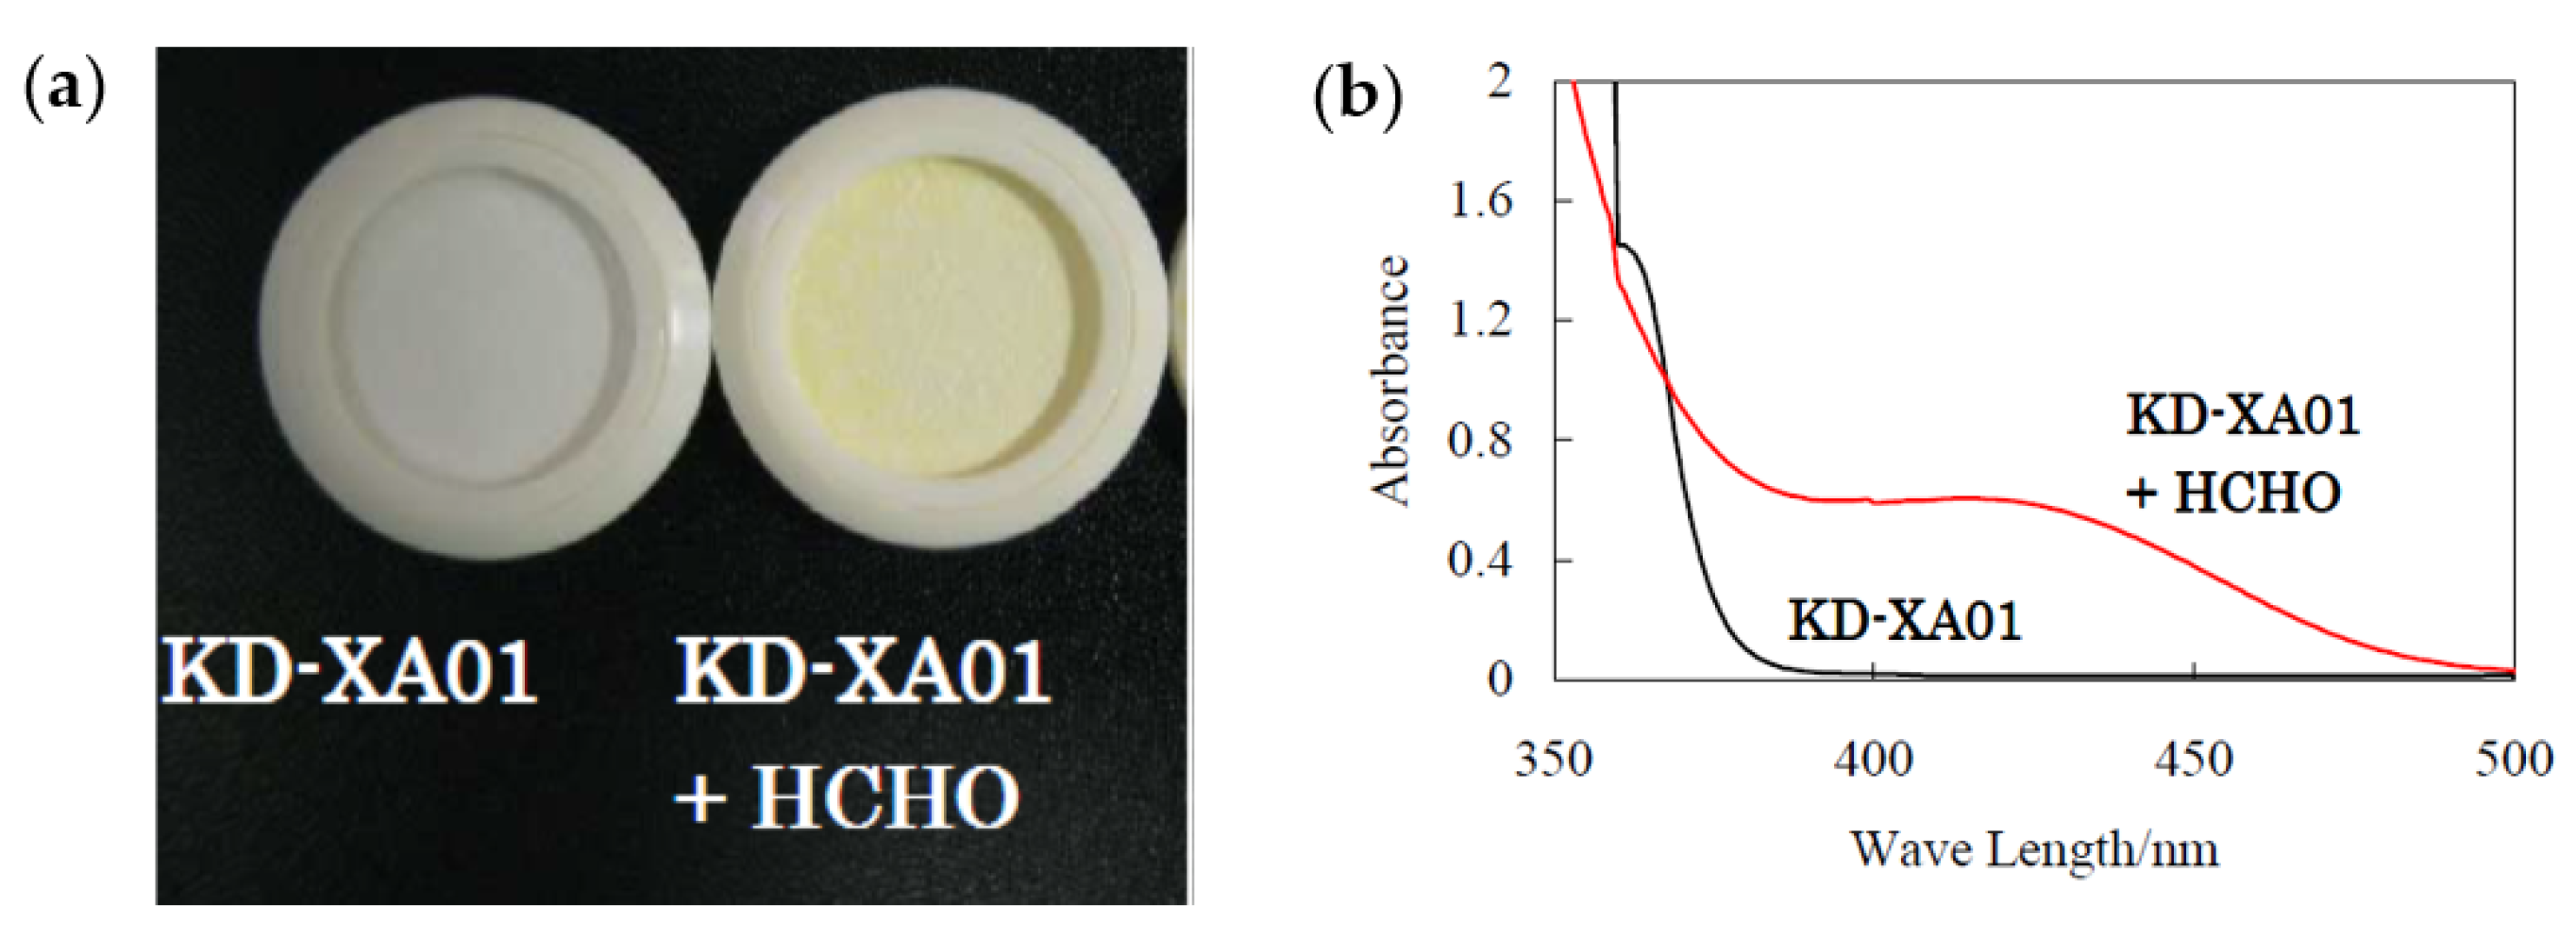
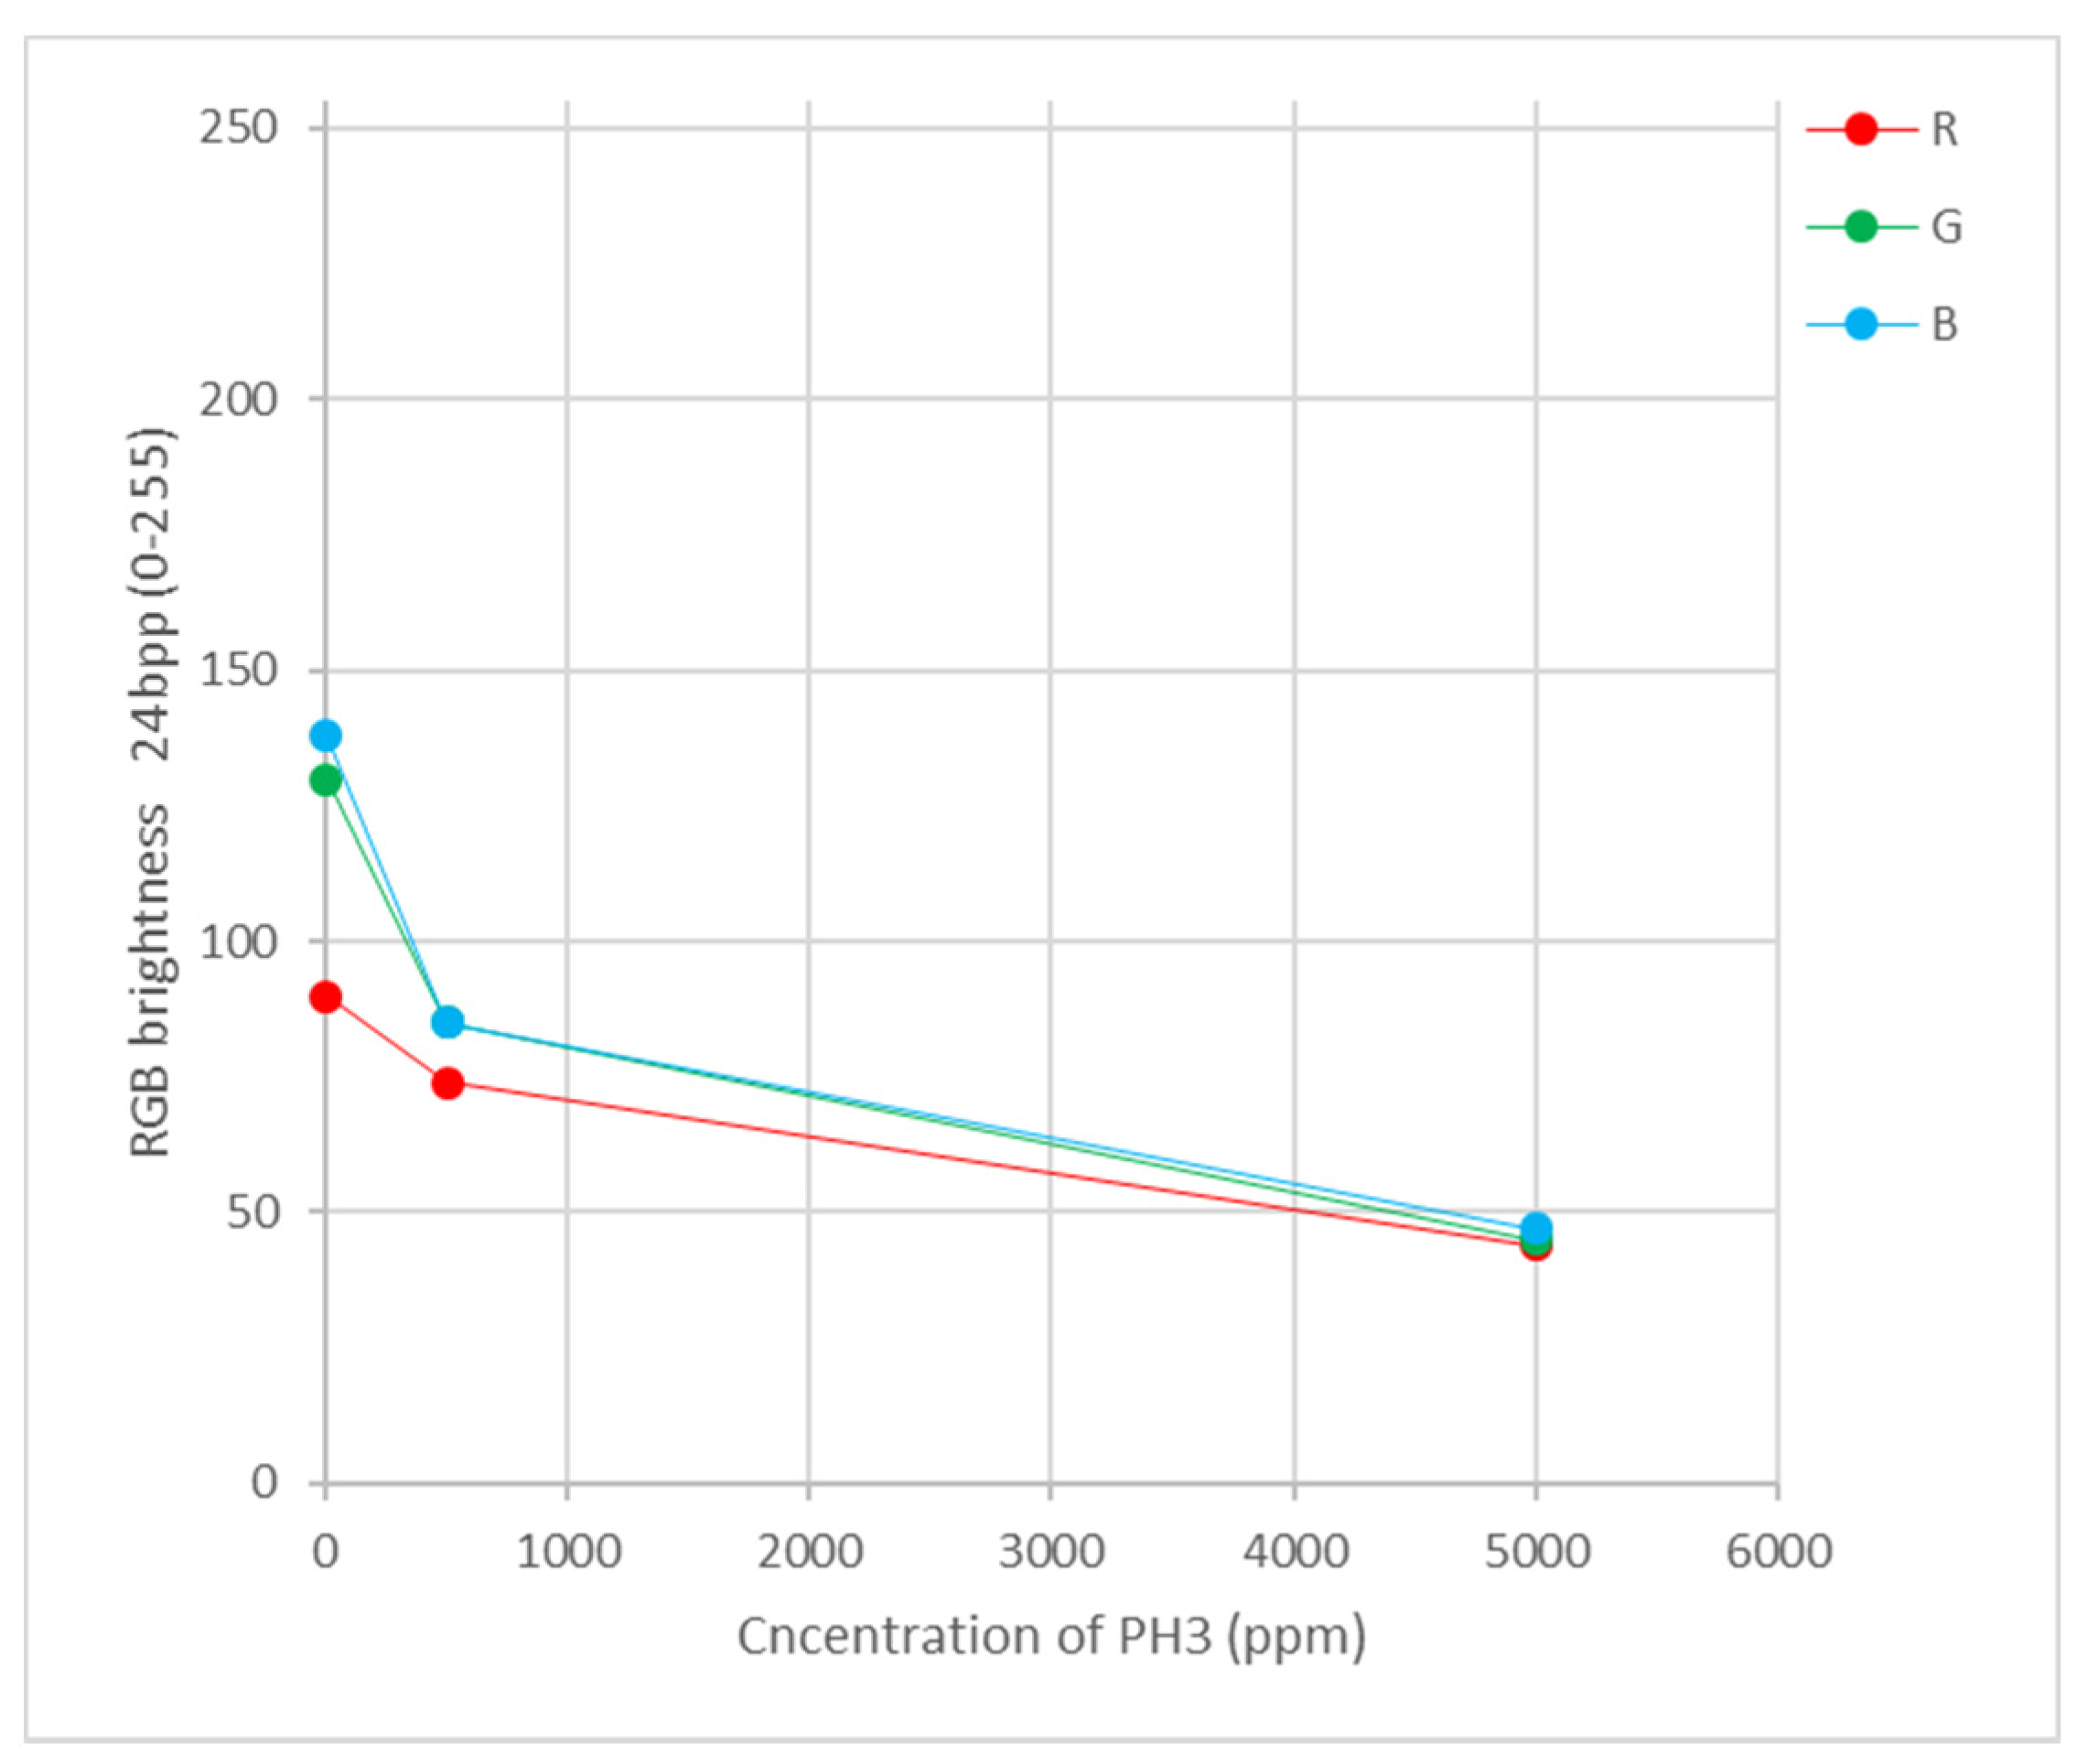
3. Gas Sensing Paper and Color Intensity Reader for a Gas Monitoring System

Gas detector tubes have a great advantage in terms of selectivity and rapidity for practical analysis compared to other types of gas detectors such as semiconductor, combustible and electrochemical gas sensors because they use a selective chemical detection principle [23]. However, detector tubes are spot testers and not adequate for continuous detection.
The tape monitor method was developed for continuous gas detection method using a colorimetric principle that has gas selectivity [5,43,44]. The gases in the sample react with the chemical reagent in the tape to produce the chemical reaction product, and hence the color of the tape changes much like it does in a detector tube. The sample gas is drawn through the sampling chamber at a constant flow rate (e.g., 400 mL/min) using an air pump in the detector. The degree of color change is recorded by measuring the relative light reflected off of the tape. The length of tape exposed to the sample is renewed by moving the tape every measurement interval (Figure 15). Measurement interval depends on the gas detector design (e.g., 5 min, 30 min).
Nakano et al. developed the HCHO gas detector using the tape monitor method [45,46]. The dried tape contained silica gel and was impregnated with a processing solution containing hydroxylamine sulfate. Methyl Yellow (pH indicator) was used as the detection reagent. When an air sample including HCHO was exposed to the cellulose tape, the color of the tape changed from yellow to red. The degree of color change was proportional to the concentration of HCHO, and it was recorded by measuring the intensity of reflected light at 555 nm. The tape could detect down to 0.08 ppm of HCHO (WHO standards for indoor air quality control [28]) with a sampling time of 30 min.
The chemical reaction of this method is shown in Equation (8).
2 HCHO + ( NH 2 OH ) 2 · H 2 SO 4 2 H 2 C = NOH + H 2 SO 4 + H 2 O
The Methyl Yellow pH indicator on the tape changed color by reacting with the sulfuric acid that was produced by the reaction of hydroxylamine sulfate reagent with the HCHO. The response of the tape was interpreted using the following equation:
Response   ( %   of   voltage   drop ) = ( V 0 V 1 )   /   V 0 × 100
where V0 is the voltage before gas sampling and V1 is the voltage after gas sampling.
The tape used above does not respond to CO, NOx, CO2 and VOCs such as toluene and xylene. HCl and aldehydes give a response; however, the interference of these gases is not a serious problem for monitoring ambient air.
Various tapes for gases such as HCN [47], Cl2 [6], NH3 [48], HCl [49], H2S [50], silane [51], PH3 and AsH3 [52] have been developed. This method is simple, specific and recommended for continuous gas detection in the field.
A circle detection paper tablet and the measurement of the relative light reflected has been developed as spot sample and detection method. However, this method is not adequate for continuous detection, although it is suitable for portable gas detection applications due to its small size. Figure 16 shows an example of a detection paper tablet.
The detection paper on the tablet is exposed to sample gas using an air pump in the photometer. The degree of color change ias recorded by measuring the reflected light with a photodiode and LED (Figure 17).
A portable HCHO gas detector was developed using a reagent “KD-XA01”(4-amino-4-phenylbut-2-en-2-on) in a dried state on the detection paper tablet. HCHO reacted with KD-XA01, and the color of the detection paper changed to yellow. The degree of the color change was recorded by measuring the relative intensity of reflected light at 400 nm with a gas detection device called an FP-30 (photometer and sampling pump). The flow rate of the sample gas was 250 mL/min [53,54,55]. The reaction of HCHO and KD-XA01 is presented in Figure 18. The KD-XA01-based method showed no significant response towards various VOCs or aldehydes other than HCHO, assuring high reliability. The limit of detection was 0.05 ppm after a 5-min test.
A NO2 detector was also developed using the FP-30 [56]. N-1-Naphthylethylenediamine dihydrochloride on the detection paper reacted with NO2 to give a color change to yellow. The degree of color change of paper from white to yellow was monitored as a function of the intensity of the reflected light (λ = 475 nm) of an LED. The limit of the detection was 0.01 ppm when the sampling time was 30 min, and the flow rate of sample gas was 250 mL/min. This device is useful for the detection of NO2 in a room using an exhaust room discharge type heater.
Another type of HCHO gas detector for SBS was developed with a significantly short sampling time. 4-Amino hydrazine-5-mercapto-1,2,4-triazole (AHMT) reagent was chosen as an indicator for HCHO detection because AHMT is a well-described reagent with a high sensitivity and selectivity towards HCHO [57]. A disposable circular glass paper on a chip and hanging drop kit were developed for simple and routine use. The glass paper was impregnated with AHMT and detected HCHO concentrations in air at less than 0.08 ppm in 3 min. The limit of detection was 0.04 ppm.
Before detection, 50 μL of AHMT solution and 50 μL of KOH solution (1:1) were dropped on the glass paper. Then, the reagents on the glass paper were exposed to HCHO gas in a photometer (Figure 19a). An air pump was installed in this photometer. The degree of the color change was recorded by measuring the relative intensity of reflected light at 550 nm. The flow rate of sample gas was 200 mL/min. HCHO reacted with AHMT and KOH, and the color of the reagent solutions changed to purple in 3 min (Figure 19b).
This AHMT-based method exhibits high sensitivity and a short measurement time since the liquid reagent and HCHO gas react on the glass paper. In Figure 20, the AHMT-based method was compared with a conventionally used hydroxylamine-based one. The AHMT-based method is more sensitive and has a shorter sampling time than the hydroxylamine-based method.
The reaction of HCHO and AHMT is presented in Figure 21.
Moreover, the AHMT-based method was not affected by the presence of various aldehydes other than HCHO, VOCs, acidic or alkaline gases.
A toluene gas detector was also developed with the photometer in Figure 19a [58]. This detector is based on the principle that toluene reacts with iodine pentoxide (I2O5) to produce a brown-colored product, iodine (Figure 22). I2O5 solution (50 μL) was pipetted onto the glass paper filter, which was subsequently placed into the photometer. Immediately after, the reagent solution was exposed to toluene gas for a duration of 30 min at a flow rate of 480 mL/min. The product is detected by measuring the intensity of reflected light at 460 nm. The degree of color change is proportional to the concentration of toluene gas. This detector is able to detect down to 0.05 ppm toluene, a lower concentration than the WHO guideline value (0.07 ppm) for indoor air. The chemical reaction of this method is shown in Equation (10).
C 6 H 5 CH 3 + I 2 O 5 I 2 + Oxidation   products
Possible oxidation products: C6H5CHO, C6H5COOH.
The measurement results using a photometer in this section are interpreted and corrected under the operating temperature range specification automatically.

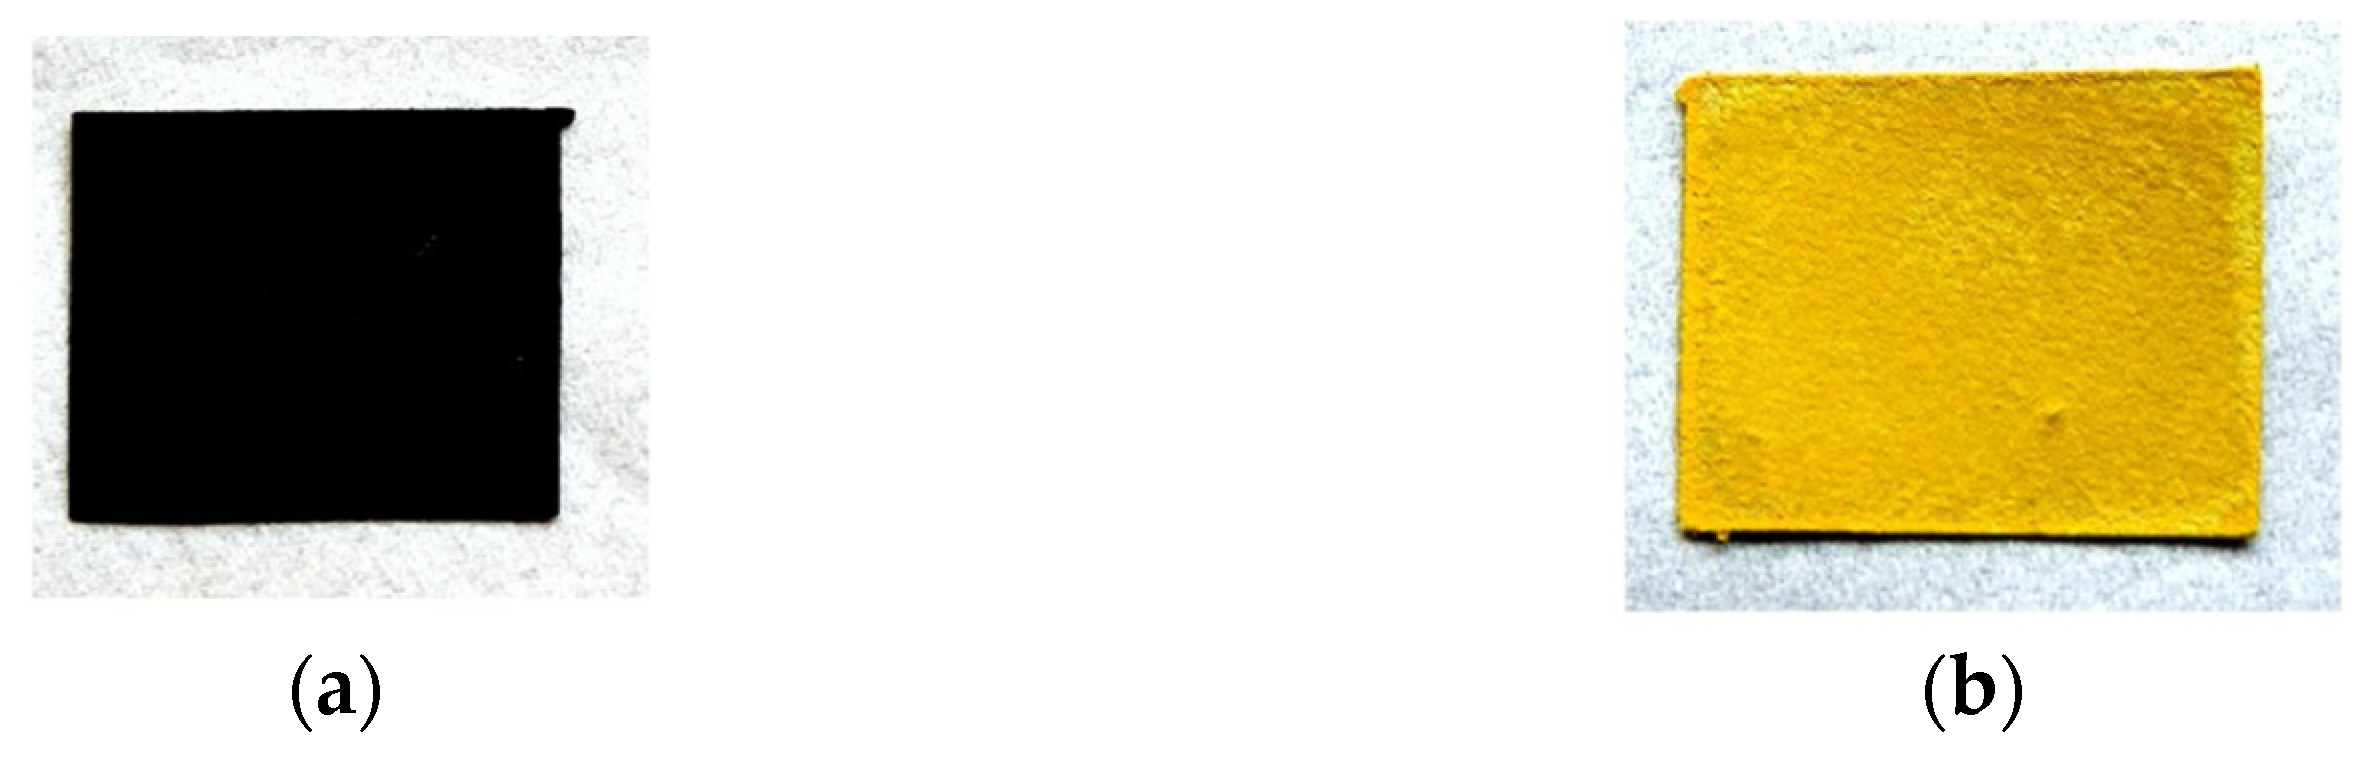
4. Passive Sampling Detection Paper Method

Generally, a passive sampling detection paper method is not sensitive compared to an active sampling method that uses an air pump. Passive sampling is better for qualitative detection and not quantitative measurement. However, the detection paper method is extremely easy to use, does not need electronic devices and is maintenance-free. The detector paper in the chemical agent analyzer kit “M10” was used for the detection of most chemical warfare agents except for nerve agents in 1945 [1] (p. 11).
A test strip capable of detecting low concentrations of chlorine gas in air was developed for use in detecting chlorine gas leaks in 1946. This strip was used for industrial hygiene [59]. Orthotoluidine was used as a detecting reagent for chlorine detection. It can detect chlorine gas at less than 4 ppm and preferably less than 2 ppm, and it retains its sensitivity for relatively long periods of time, on the order of months, when properly stored.
Early methods for the detection of phosgene utilized absorption into a solution that changes color (4-(4′-nitrobenzyl)-pyridine) and stabilizes the color (N-phenyl benzene). The absorbance was then read on a spectrophotometer [60]. Badges that change color upon exposure to phosgene are commercially available for industrial hygiene. The badge for phosgene determination was developed with a paper strip impregnated with 4-(4′-nitrobenzyl)-pyridine and N-phenyl benzylamine. Wernaer et al. developed a badge that has three indicators for rapid recognition of the dose of reactive gas. The surface of each window is covered with a film with different permeability. Each of the three indicators is designed to discolor with low (<5ppm min−1), medium (50–80 ppm min−1) and high (100–150 ppm min−1) concentrations of gases. Since checking the discoloration of the three windows is easier than reading the density from a color standard chart, the amount of phosgene can be checked immediately [61].
A test strip for HCHO was developed for indoor air quality control with KD-XA01 [56]. The color of the test strip changed to yellow upon exposing it to HCHO gas (Figure 23). Most of the passive sampling methods such as the test strip need several hours to detect gas concentrations of less than 1 ppm due to their low sensitivity. However, low sensitivity has advantages for long-term measurements, such as in the detection of threshold limit values—time-weighted average (TLVs-TWA) of a typical work shift of 8 h [62].
The test strip methods can be prone to analyst error, as it is not easy to read the measured value from the paper or interpret a color change. Kawamura et al. developed a method to obtain quantified results using passive detection paper and a photometer as shown in Figure 19a [8] (p. 59–83). The method was based on the principle that HCHO reacts with KD-XA01 to produce a yellow color (Figure 24a).
The discoloration is recorded by measuring the intensity of reflected light at 460 nm using a photodiode after 8 h exposure of the paper to atmospheric air.
The calibration graph of HCHO was linear between 0.04 and 0.57 ppm HCHO after 8 h sampling. Thus, this method can be used to detect HCHO at the TLV-TWA exposure value of 0.1 ppm set by ACGIH in the work environment for 8 h.
The passive detection paper sampler was designed like a badge and clips to a worker’s collar for personal sampling (Figure 25). It could also be placed in an appropriate location in the area to be sampled. After 8 h, the sampler was simply detached from the worker’s collar, and the paper was transferred to a photometer for detection of HCHO gas.
Maruo et al. also developed a HCHO detector with a colorimetric passive detection element in a portable photometer for indoor air monitoring [63]. The rutidine derivative that was formed as a yellow product of the reaction between β-diketone and HCHO was stable in the porous glass block (sensor element, 8 mm × 8 mm × 1 mm). The detection limit was 5 ppb per hour, and it was estimated it took about 1 h to detect a HCHO concentration of 94%. The sensor device was small and easy to use and it successfully carried out hourly HCHO monitoring.
The sensitivity of many detection papers is low. However, fast-response paper-based visual color change film for efficient ammonia detection was developed [7]. Inexpensive and disposable rapid detection film was made using perovskite halide CH3NH3PbI3 (MAPI) to detect the presence of NH3 by color change, where the black-colored MAPI film (on the paper) changes to yellow color in the presence of a very low concentration of NH3 gas (Figure 26). The mechanism by which the color changes is based on the complete degradation of MAPI to PbI2, a solid with distinct yellow color, upon exposure to NH3. The color change to yellow-colored PbI2 is a structural phase transition that occurs due to the interaction of MAPI with NH3.
According to the experimental observations, the film could detect gas concentrations of 10 ppm with a visual color change within a response time of around 12 s (Figure 27).
The response time of the film is very fast compared to reported NH3 sensors using other materials. The film works at room temperature and shows a rapid response that is faster than the response of electrical sensors available commercially for the same gas (Table 2).
They used paper with a high porosity as a substrate. As a result, the morphologies are different, and in their case, the nanorod-like structure is responsible for the fast response towards NH3 (Figure 28). The MAPI film was easy to fabricate via a wet chemistry route, and being a visual color change detection film, it does not need any other extra equipment for its operation. This film has a long shelf-life (180 days at room temperature) and almost constant performance for detection.

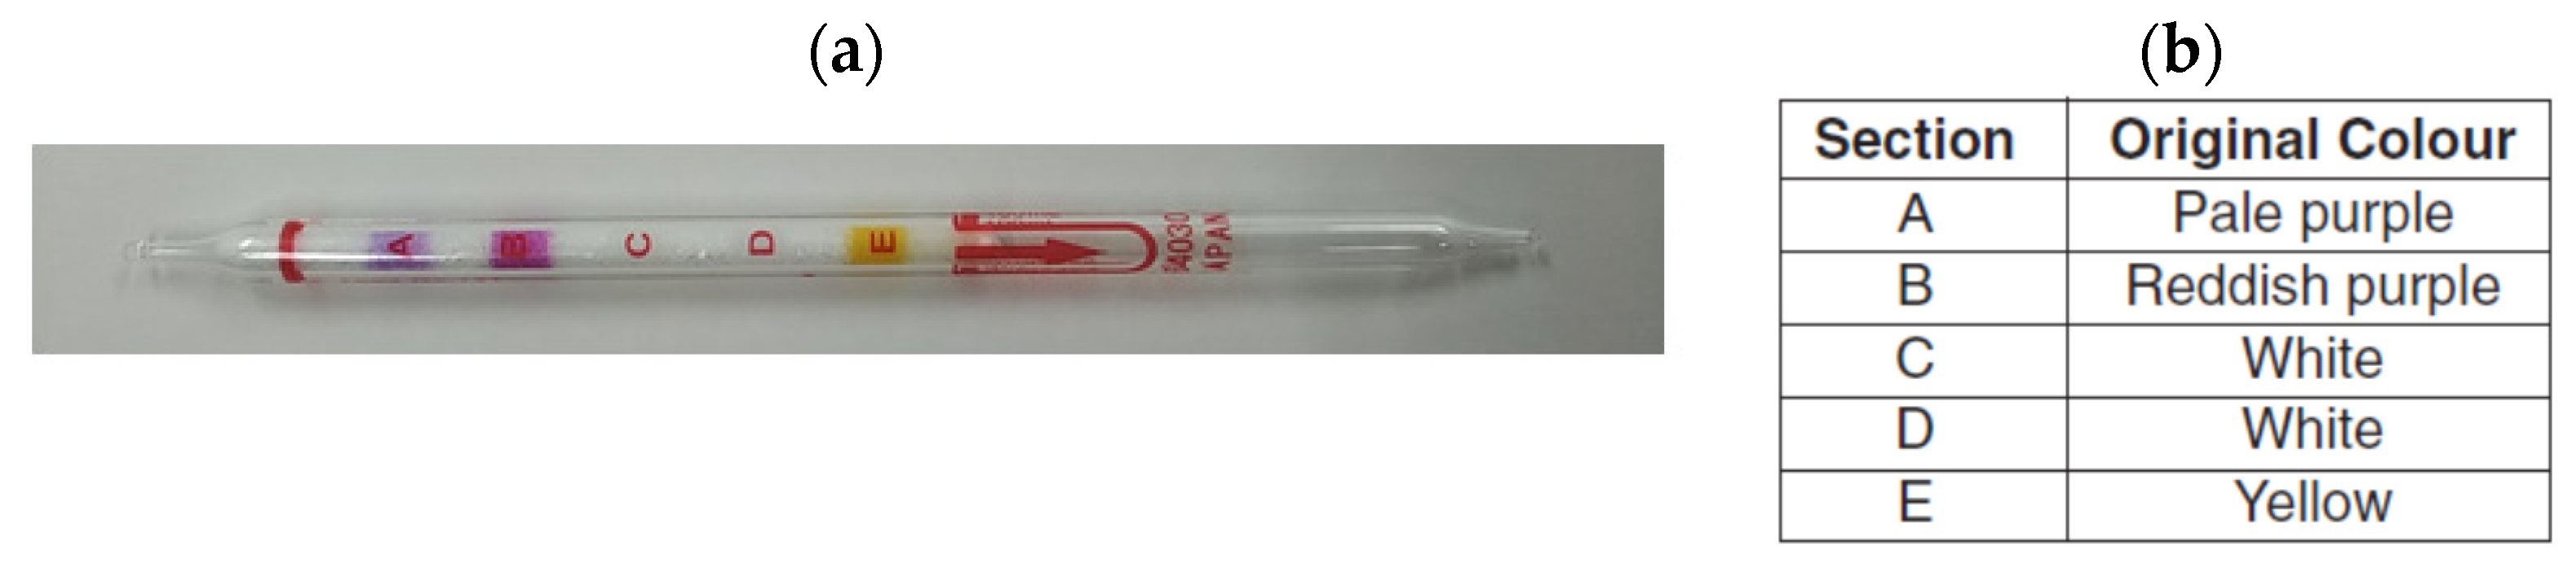
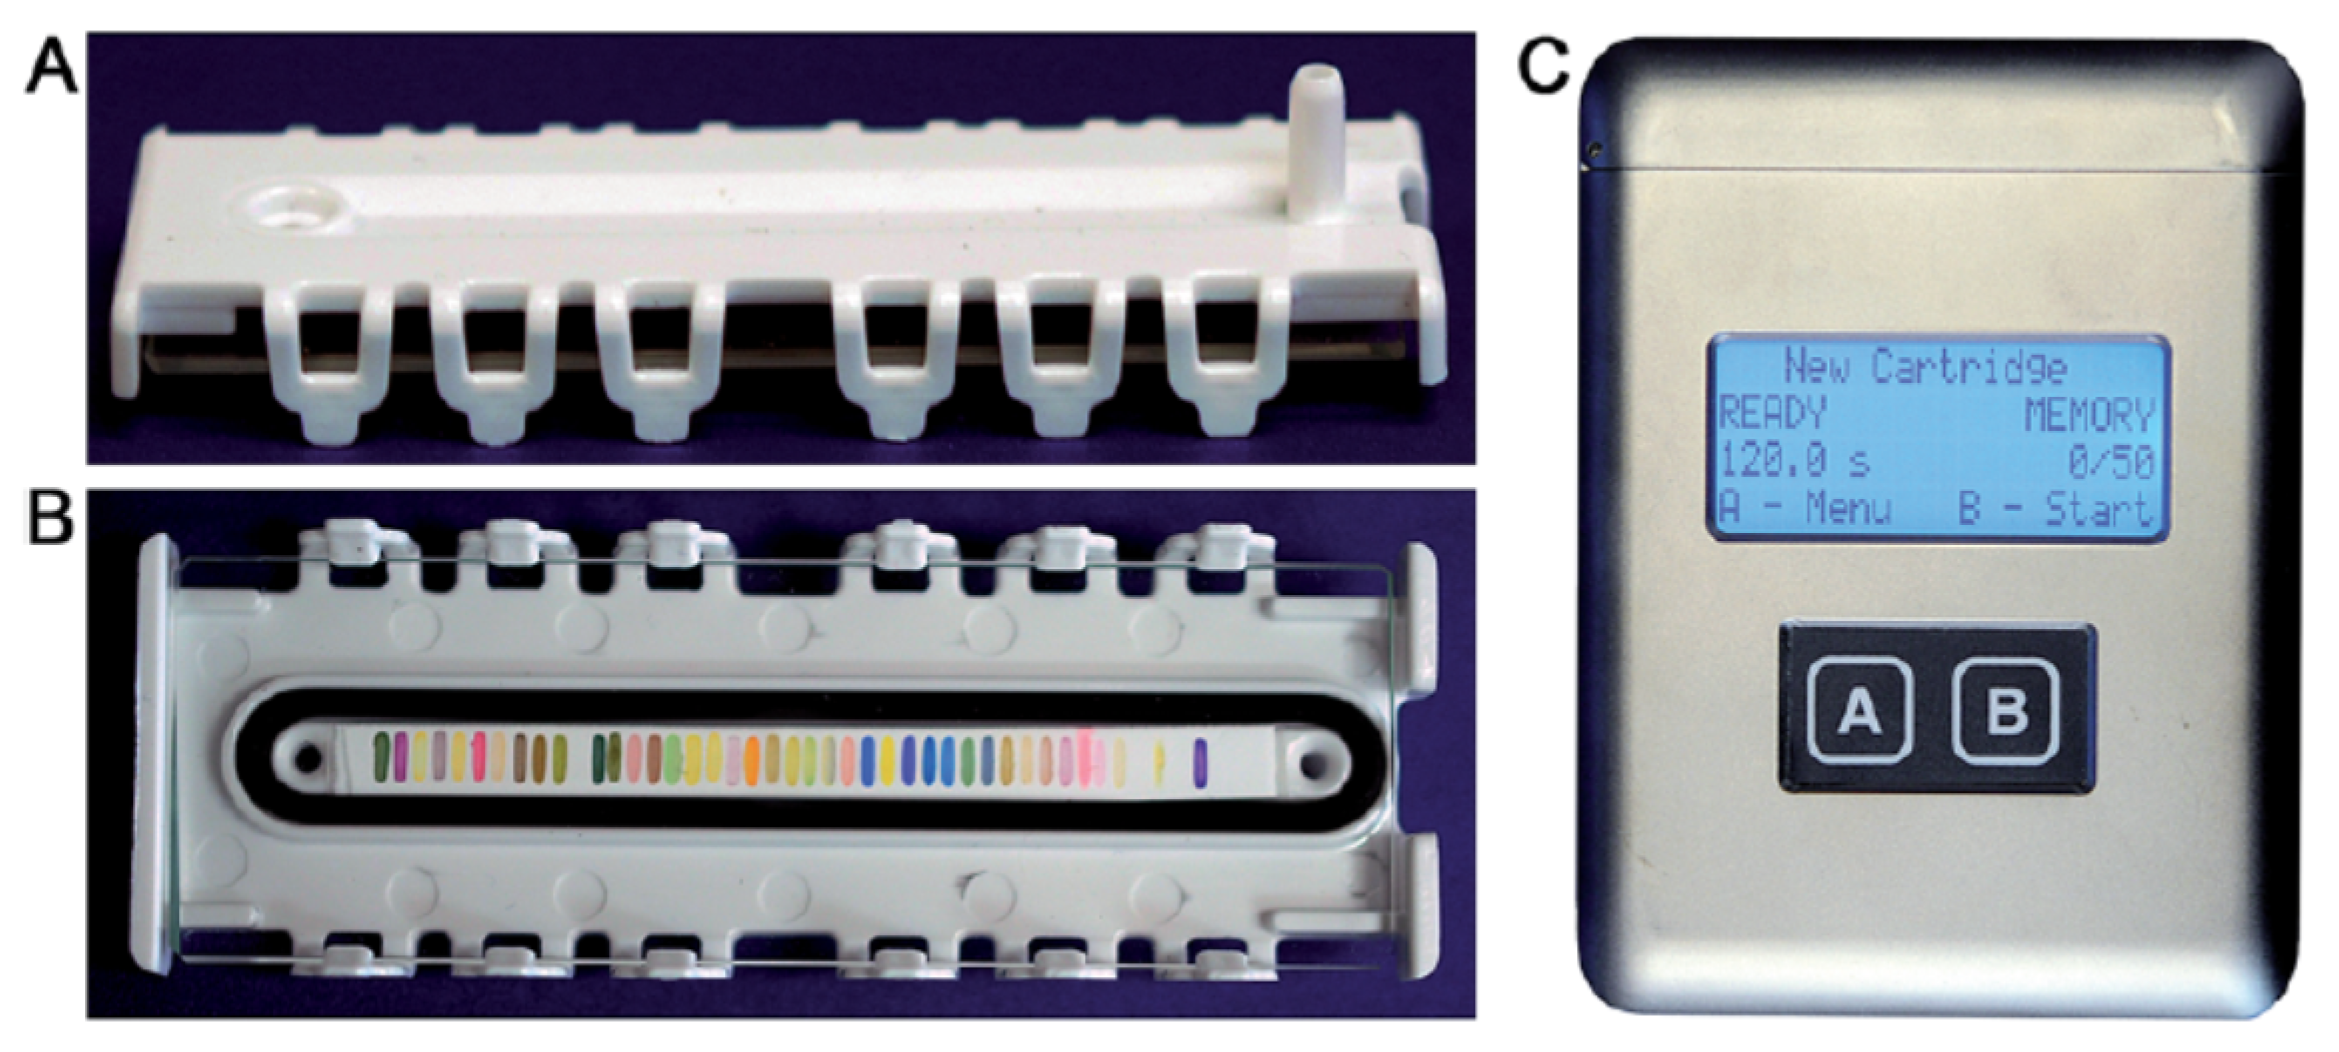
5. Colorimetric Sensor Arrays

The development of optoelectronic nose sensors using colorimetric array chips has also been reported. Since the judgment is made using many reagents (for instance, Fe2+ redox, several types of pH indicators, Schiff test, nitro-sensitive, solvatochromic, metal–dye chromogens), the gas selectivity can be improved for toxic and explosive gases.VOCs such as ammonium nitrate, 2,4-dinitrotoluene and H2O2 can be qualitatively determined from the patterning of the sensor array (Figure 29). It has also been reported that discoloration can be determined by reading with a charge-coupled device (CCD) camera [64,65]. Sensors have also been reported that can identify the ppm levels of vapors of 20 toxic industrial gases, including PH3, HCN and fluorine, using a colorimetric 36-component sensor array [66,67].
In the future, the use of these sensors will improve the performance of even commercially available gas detectors.

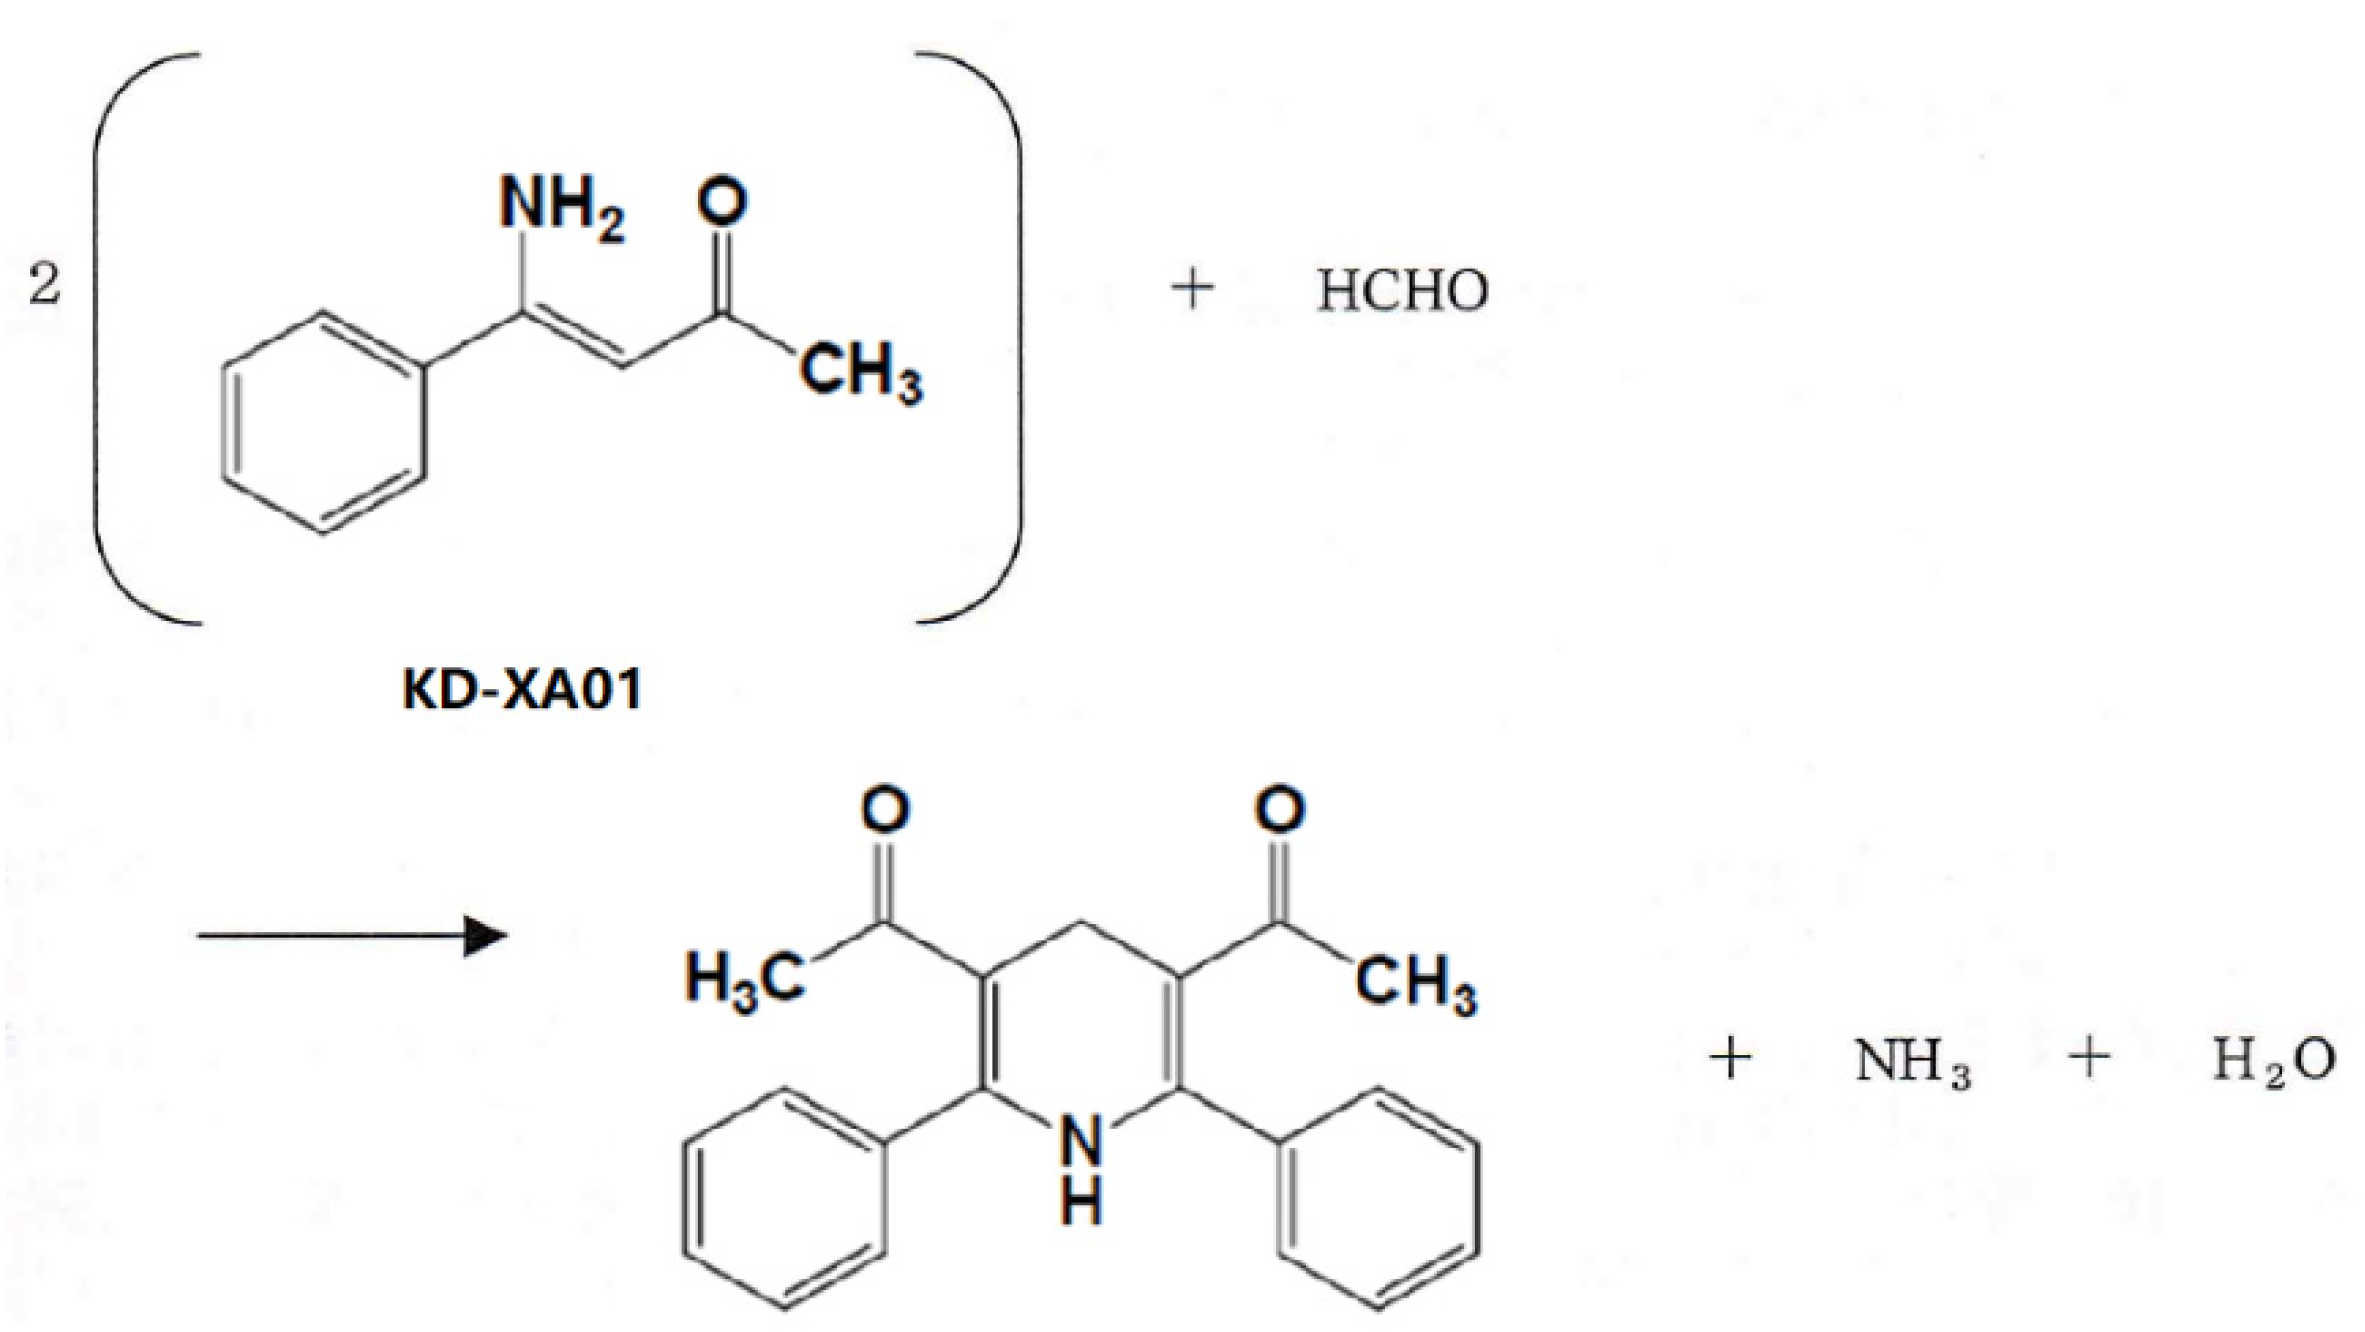
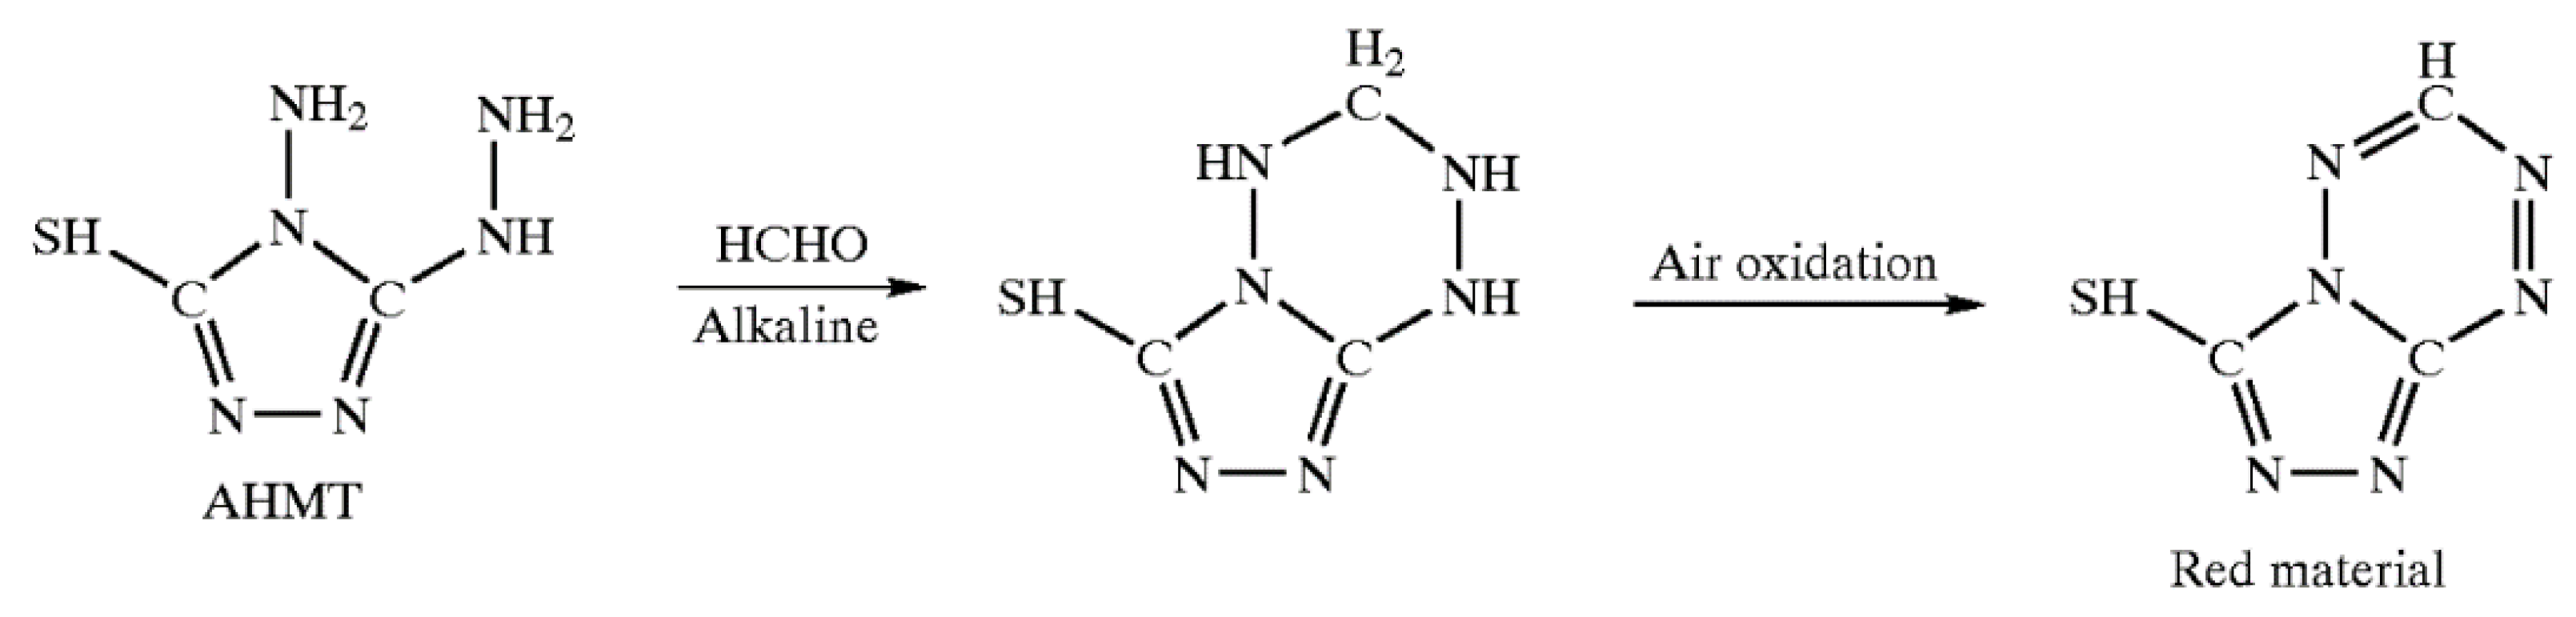
6. Colorimetric Gas Detector with Biomaterial

The biosensor method is useful to improve the selectivity of the detector because biomaterials such as enzymes and antibodies have high substrate specificity.
Mitsubayashi et al. developed bio-sniffers for gaseous chemicals (trimethylamine, methyl mercaptan, HCHO, ethanol, etc.) with metabolizing enzymes as chemical recognition proteins. The sniff devices monitor the concentration change of the gas-phase chemical with high selectivity because of enzyme specificity. An optical approach (Sniff-cam) allows one to visualize the spatiotemporal concentration change of chemical vapor such as body odor or wine ethanol. These gas sensors possessed high selectivity for analyte vapor in the presence of other gas-phase chemicals and gave a negligible response to these other chemicals [9,68]. Enzymatic reaction of these detectors was as follows:
Monoamine   oxidases R - CH 2 - NH 3 + + H 2 O     O 2 R - CHO - NH 4 + + H 2 O 2
A ruthenium organic complex was immobilized on the tip of an oxygen-sensitive optical fiber. The oxygen concentration can be quantified by the quenching phenomenon of the fluorescence reaction (excited light wavelength: 470 nm, fluorescence wavelength: 600 nm) due to the formation of an electrified transfer complex with oxygen molecules.
HCHO   dehydrogenase   (FALDH) HCHO + NAD + + H 2 O     HCOOH + NADH + H +
In the presence of HCHO, FALDH uses oxidized nicotinamide adenine dinucleotide (NAD+) as an electron acceptor to produce formic acid and reduced NADH. Since NADH has fluorescence characteristics (ex.: 340 nm, fl.: 491 nm), HCHO could be detected by fluorescence measurement using UV-LED.
Alcohol   oxidases R - CH 2 OH + O 2   R - CHO + H 2 O 2  
Using a mesh in which alcohol oxidase and horseradish peroxidase were immobilized and an electron-multiplying CCD camera was used, luminol luminescence associated with the enzyme reaction was imaged. The enzyme mesh was moistened with a luminol solution and reacted with ethanol gas in a dark room. Ethanol could be detected by photographing the luminescence by the enzyme with the electron-multiplying CCD.
Yanagisawa et al. developed a HCHO gas detector with HCHO dehydrogenase using the principle of a passive emission colorimetric sensor (PECS) to measure the emission rates of HCHO from various surfaces in residential houses [10]. PECS is a very small device (diameter: 23 mm, thickness: 3.2 mm). PECS consists of a PET body and a test paper, which turns red by enzyme reaction (HCHO dehydrogenase, NAD+, NADPH oxidase diaphorase, 4-iodonitrotetrazolium violet) in the presence of HCHO. At the beginning of the measurement, one drop of pure water is put into the PECS. The PECS is placed on indoor materials, and 30 min later the coloration can be measured by visual observation or absorption photometry.
Gas detector tubes using cholinesterase have been developed for the detection of nerve agents such as phosphate esters. Acetic acid is produced by the reaction of choline oxidase and acetylcholine. A pH indicator, cholinesterase, acetylcholine and a capsule containing water are loaded into the gas detector tube. The capsule is broken during measurement to allow the enzyme to react with acetylcholine. In the absence of a nerve agent that inhibits cholinesterase, the acetic acid produced reacts with the pH indicator and the detector tube is discolored. In the presence of nerve agents, the enzymatic activity of cholinesterase is inhibited, acetic acid is not produced and the detector tube is not discolored [69].
A kit for sensing phosphoric ester has also been developed (Figure 30). This sensing method uses dried cholinesterase or acetylcholinesterase, choline oxidase, peroxidase and water. The dry enzyme pad is brought into contact with the sample gas, and then water is added to the dry enzyme pad. After that, when the enzyme pad and the drying reagent pad are brought into contact with each other, the enzyme reacts with acetylcholine (substrate), and choline oxidase generates hydrogen peroxide. The color of the pad changes from white to blue by enzymatic reaction [70]. In the presence of nerve agents, the enzymatic activity of acetylcholinesterase or cholinesterase is inhibited, H2O2 is not produced and the reagent pad is not discolored.
The enzymatic reaction of discoloration is as shown in Figure 31.

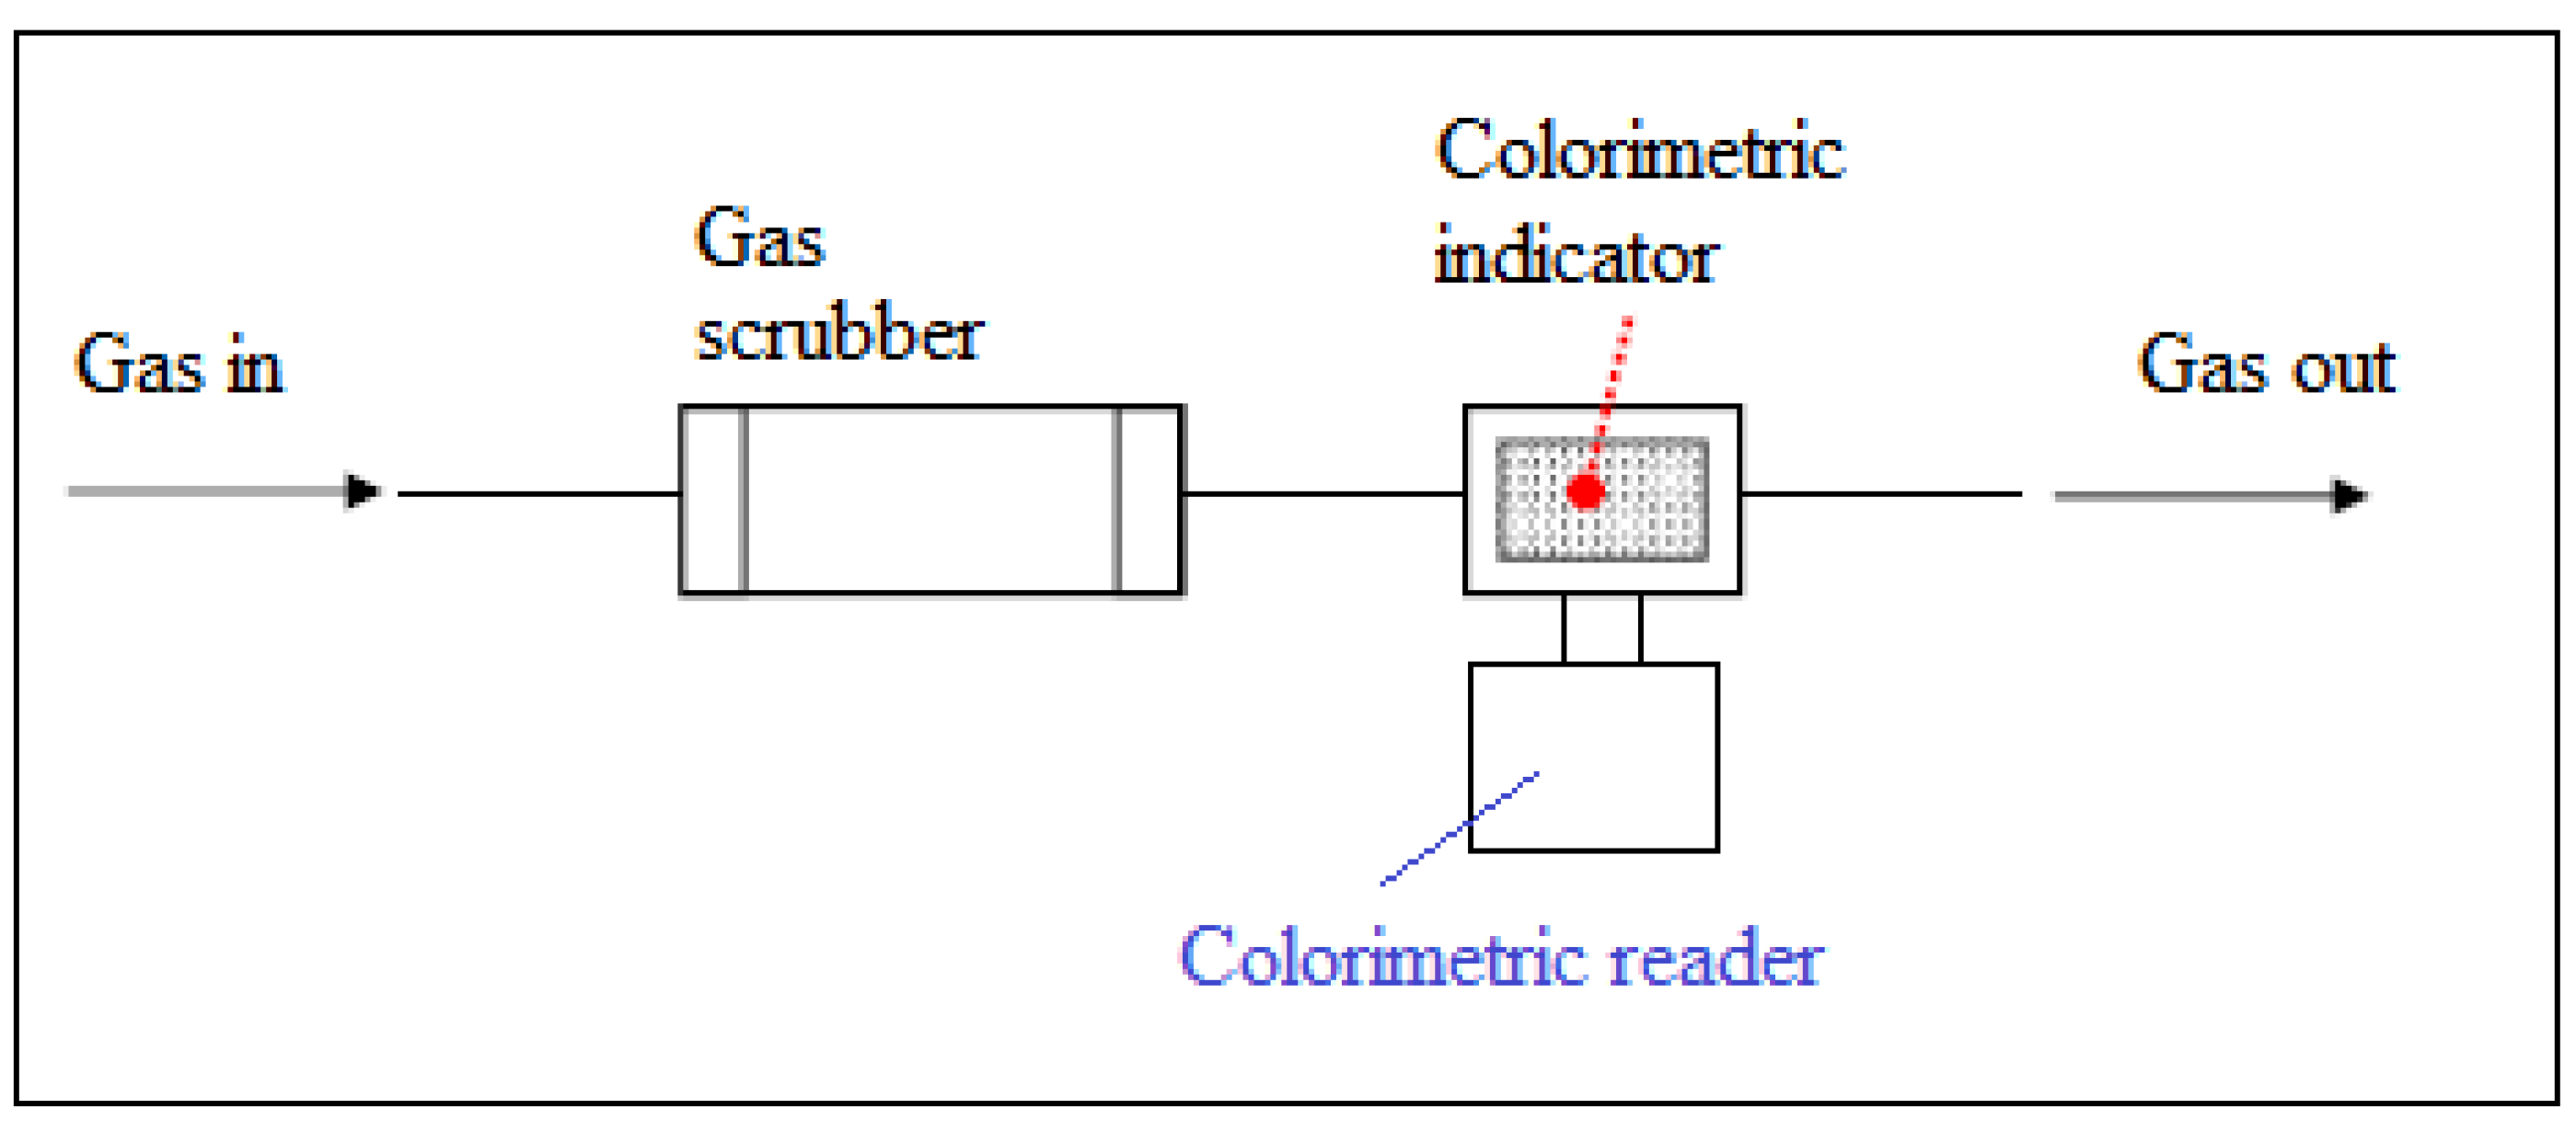
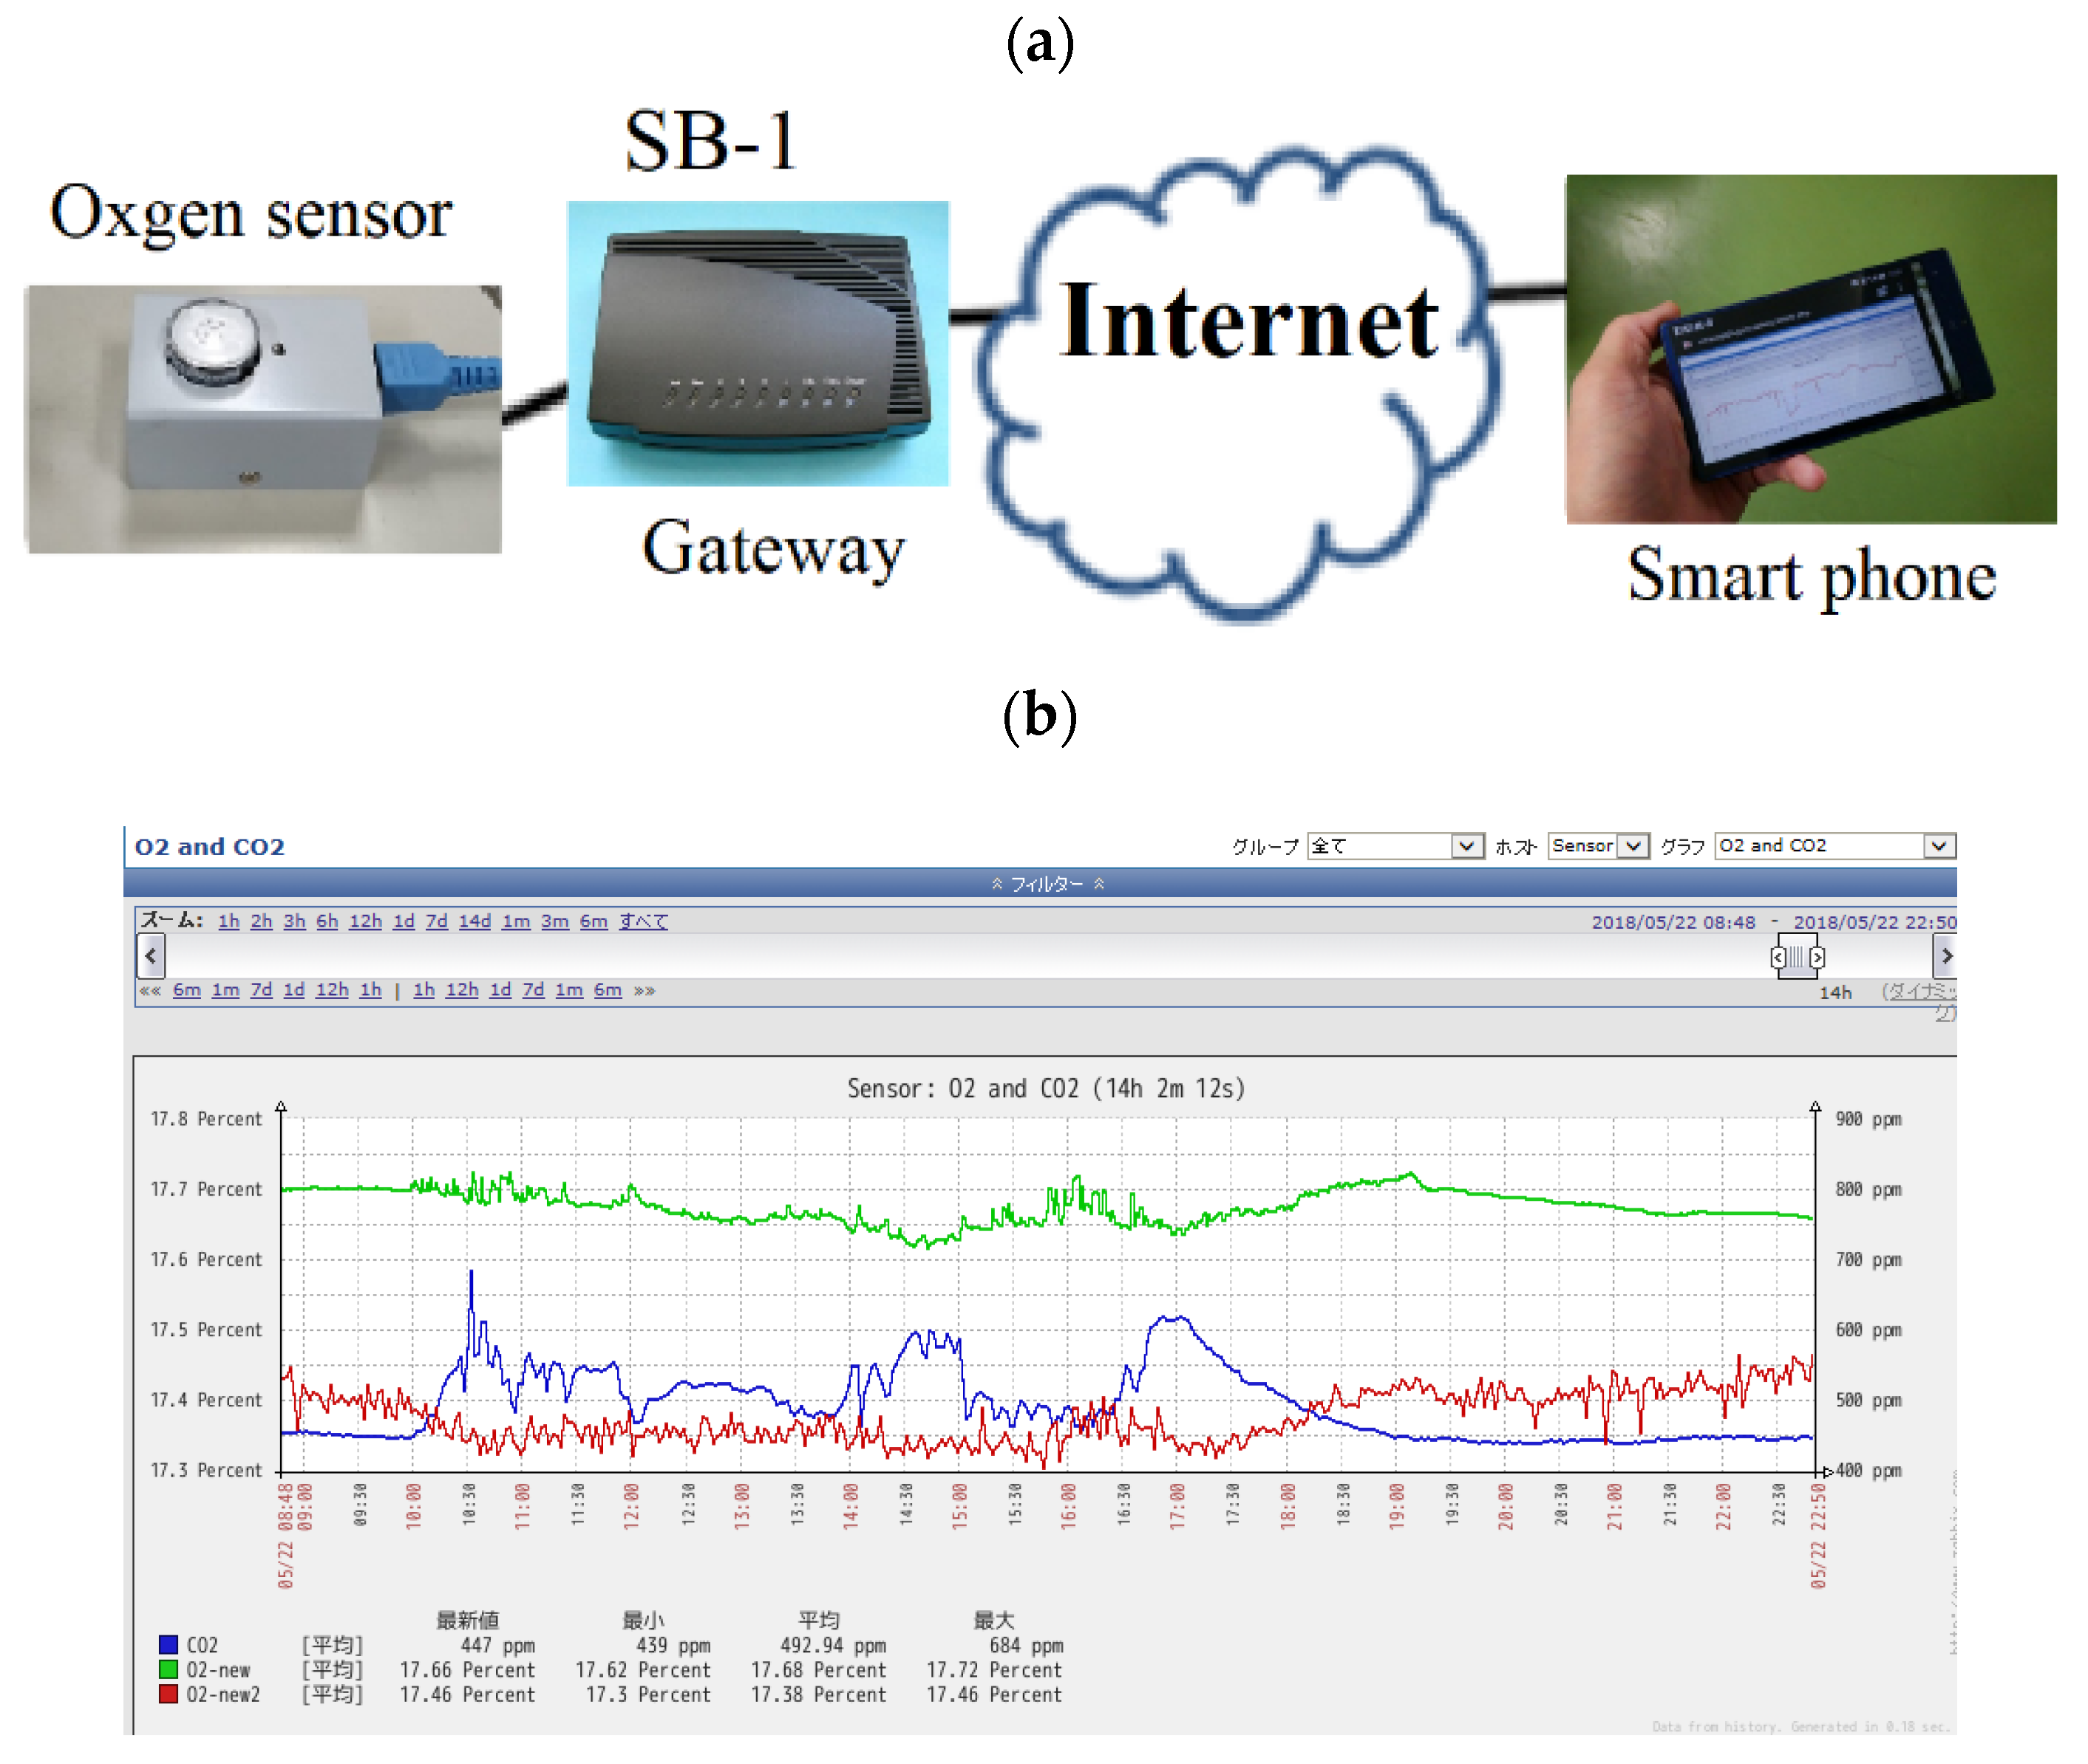
7. Colorimetric Gas Detector and ICT Technology

Recently, smartphone colorimetric gas detectors have been developed. Rachel et al. proposed a thread sensor with a fabrication method for the stable entrapment of optically responsive dyes on a thread substrate. It is proposed to develop a detection system that can be integrated into clothing [71]. The dyes 5,10,15,20-tetraphenyl-21H,23H-porphine manganese(III) chloride (MnTPP), methyl red (MR) and bromothymol blue (BTB) were used for the detection of NH3 and HCl. Their optical approach utilizes a smartphone to extract and track changes in the RGB signal of the acquired images of the thread to detect the presence of an analyte. These threads could detect 50–1000 ppm of NH3 and HCl gases (Figure 32).
The threads were shown to be stable over time, even with agitation in a centrifuge. This is attributed to the dual-step fabrication process that entraps the dye with polydimethylsiloxane (PDMS) coating in a stable manner. The facile fabrication of colorimetric gas-sensing washable threads is ideal for the next generation of smart textiles and intelligent clothing.
Colorimetric gas indicators for toxic gas scrubbers have been used in many factories [72,73]. The color of the indicator changes upon reaction with the toxic gas that has passed through the scrubber. Monitoring of the relative depletion of the scrubbing medium in a scrubber can be carried out with endpoint detection using a colorimetric indicator and reader (Figure 33).
Figure 34 shows the color detection of the PH3 indicator for a scrubber using a smartphone camera (RGB information). Copper nitrate was used as the indicator reagent to detect the PH3. The color of the indicator changes from blue to grey upon reaction with PH3. Discoloration of the indicator provided RGB color information using the smartphone camera.
Optical detection offers advantages over other sensing techniques, as scanners and smartphones can image and analyze the color difference with a color sensor. In particular, the utilization of a smartphone is useful in terms of promoting the Internet of Things (IoT) in the field of gas detection. This is because the data can easily be sent to the internet through the smartphone.
Recently, many researchers have tried to develop gas detectors with IoT technology [12,13]. Kawamura et al. developed an O2 monitoring system using a galvanic oxygen sensor and gateway (Silent system SB-1) for IoT sensing. Oxygen sensors are connected with LAN cable to the gateway (Figure 35a). Monitoring results are sent to the data server through the Internet gateway. They utilized open-source software and platforms (Amazon Web Service, AWS and ZABBIX) for the data server and monitoring software to reduce the cost of the monitoring system (Figure 35b). However, this is not a colorimetric gas detector.
João et al. proposed an IoT system with a multigas smart sensor for various industrial fields (Figure 36) [74]. The devices used in these studies utilize semiconductor, electrochemical and optical sensors, not colorimetric sensors. The development of colorimetric gas detectors for IoT has been delayed. This is because many colorimetric gas detectors utilize chemical reactions (usually irreversible reactions), so the sensor part is often disposable and not suitable for continuous measurement [74,75].
However, many types of gas sensors are needed to promote IoT. The gas detectors of the tape monitor method are suitable for continuous measurement. Chenwen et al. developed a gradient-based colorimetric array sensor (GCS) for O3 with indigo carmine, citric acid and silica gel pieces (13 mm × 30 mm). The sensing reagents were printed on the substrate as straight lines, each with a length of 8 mm and a width of 0.3 mm. The lateral transport of analytes across a colorimetric sensor surface creates a color gradient that shifts along the transport direction over time. GCS tracks the gradient shift and converts it into analyte concentration. Differing from conventional colorimetric sensors that expose the whole sensing surface to analytes, GCS has a greatly extended lifetime. The sensor was able to continuously monitor the O3 concentration in the atmosphere for 24 h [75].
These devices will be used as gas detectors in IoT in the future.

8. Comparison of Various Gas Detector Technologies

The sensitivity and selectivity of the colorimetric gas detectors are relatively high compared to other types of gas detectors such as semiconductor, combustible, electrochemical and photon ionization (Table 3).
Gas detectors with semiconductor sensors can measure reducing/oxidizing gases because the conductivity of semiconductor materials changes in accordance with changes in gas concentration. This is caused by the adsorption and desorption of oxygen and the reaction between surface oxygen and gases. Gas detectors with combustible gas sensors can only measure combustible gases because the reaction principle is combustion. Moreover, since the detection is based on combustion, the gas selectivity is low. The sensitivity of the combustible sensor is low, and it is not suitable for low concentration measurement. Gas detectors with electrochemical sensors can have a certain degree of gas selectivity by adjusting the electrical potential. However, there are fewer than 100 types of gas that can be measured using electrochemical sensors. They cannot measure nearly as many types of gases as colorimetric gas detectors can measure. Moreover, oxygen is required for gas measurements on semiconductor, combustible and electrochemical gas sensors. Most colorimetric gas detectors do not require oxygen.
A gas detector with a photon ionization detector can have a certain degree of gas selectivity by changing the UV lamp type (voltage). There are three types of commonly used lamp voltages (9.8, 10.6 and 11.7 eV), but they are not sufficient to improve selectivity by much. There are more than 300 types of gases that can be measured with photon ionization.
The colorimetric gas detector is highly sensitive, and some products can measure the concentration down to part-per-billion levels. The gas selectivity depends on the chemical reagents used. It is possible to improve gas selectivity by using chemical reagents with high selectivity. In principle, more than 30 types of reagent reaction principles are used. This is significantly more than other types of gas detectors and can easily be applied if new reagents become available in the future. This feature is an advantage when developing a new gas detector. In addition, colorimetric gas detectors currently commercially available can measure more than 300 types of gases [80,81,82,83,84,85,86,87,88,89,90].
The disadvantage of colorimetric gas detectors is that the detection component is often a disposable product, so many products are not suitable for continuous measurement or data transfer. However, tape monitor products [43,44,45,46,47,48,49,50,51,52] and continuously usable colorimetric gas sensors [75] are capable of continuous measurement and data transfer and do not have such drawbacks. Moreover, single-use disposable products have an impact on the environment. In the future, we should develop a colorimetric gas detector that can be recycled and has a low environmental impact.

9. Conclusions

A review of various colorimetric gas detectors was presented. The history of devices such as detector tubes, tape monitor methods, photometer-type gas detectors and detector paper was discussed, as was the current situation and the direction to be taken in the future.
In the future, to reduce the environmental load, products that do not use harmful substances such as heavy metals (Cr, mercury) will be desired. In order to improve the sensitivity, it is effective to use a material with a large surface area, and further research is needed. Gas detectors should be promoted in IoT. Some colorimetric gas detectors, such as tape monitoring, can perform continuous measurements. It is necessary to promote the IoT of these products and further promote their utilization in the ubiquitous sensor network.
The colorimetric gas detector is highly sensitive and selective and has a large number of measurable gas species. No other gas detector with such characteristics can be found.
More research utilizing these advantages of the colorimetric gas detector should be conducted in order to improve the field of gas detection.

Author Contributions

Conceptualization, K.K. and K.M.; investigation, resources, writing—original draft preparation, K.K. and L.K.; writing—review and editing, L.K.; visualization, K.K.; supervision, K.M. and L.K. All authors have read and agreed to the published version of the manuscript.

Funding

This research received no external funding.

Institutional Review Board Statement

Not applicable.

Informed Consent Statement

Not applicable.

Data Availability Statement

Not applicable.

Conflicts of Interest

The authors declare no conflict of interest.

References

  1. Jeffrey, K.S.; World War, I. The History of Chemical and Biological Detectors, Alarms, and Warning Systems; Kathleen, S.C., Ed.; Army Chemical and Biological Defense Command: Aberdeen, MD, USA, 2000. [Google Scholar]
  2. Angel, A.; Phil, B.; Vincenzo, C.; Christina, F.; Roger, G.; Janusz, L.; Arvid, N.; Milan, P.; Danilo, R. Hazard mitigation and preventive measures. In Hazards of Inert Gases and Oxygen Depletion; Revision of IGC Doc 44/00/E; European Industrial Gases Association Aisbl: Brussels, Belgum, 2009; p. 7. [Google Scholar]
  3. Lamb, A.B.; Hoover, C.R. Gas Detector. U.S. Patent 1,321,062, 28 December 1918. [Google Scholar]
  4. Kitagawa, T. Research of rapid gas detection method. J. High. Press. Gas. Saf. Inst. Jpn. 1948, 12, 2–12. [Google Scholar]
  5. Douglas, V.M.; Lawewnce, T.J.; Charleston, W.V. H2S recorder. U.S. Patent 2,232,622, 23 May 1940. [Google Scholar]
  6. Hirayama, S.; Nagashima, K.; Nakano, N. A Monitoring Tape for Chlorine Gas with N, N-Diethyl-p-Phenylenediamine Sulfate. J. Environ. Chem. 2000, 10, 867–871. [Google Scholar] [CrossRef]
  7. Maity, A.; Ghosh, B. Fast response paper based visual color change gas sensor for efficient ammonia detection at room temperature. Sci. Rep. 2018, 8, 16851. [Google Scholar] [CrossRef] [PubMed]
  8. Kawamura, K. Research on the Development and Practical Application of Gas Sensors for Sick Building Syndrome. Ph.D. Dissertation, Japan Advanced Institute of Science and Technology, Ishikawa, Japan, 2004. [Google Scholar]
  9. Mitsubayashi, K. Bio-sniffers and Sniff-cam based on human disease and metabolism for gaseous chemicals. J. Jpn. Assoc. Odor Environ. 2015, 46, 200–208. [Google Scholar] [CrossRef]
  10. Shinohara, N.; Kajiwara, T.; Ochiai, S.; Fujii, M.; Kobayashi, T.; Uchi, T. Ynagagisawa. Development of a Detector to Measure Emission Rates of Formaldehyde using Enzyme Reaction and Measurement of Reflectance Indoor Environment. J. Soc. Indoor Environ. Jpn. 2007, 9, 75–81. [Google Scholar]
  11. Saegusa, S.; Suzuki, M. Gas Detector Tube. Japanese Patent JP5081046, 19 March 2014. [Google Scholar]
  12. Gomes, J.; Rodrigues, J.J.; Rabêlo, R.A.; Kumar, N.; Kozlov, S. IoT-Enabled Gas Sensors: Technologies, Applications, and Opportunities. J. Sens. Actuator Netw. 2019, 8, 57. [Google Scholar] [CrossRef] [Green Version]
  13. Kawamura, K.; Okada, S.; Nakamoto, S. Cloud-Based IoT monitoring system for Oxygen. In Proceedings of the RSC Tokyo International Conference, Chiba, Japan, 6–7 September 2018; p. 34. [Google Scholar]
  14. Kitagawa, T. Rapid analysis of phosphine and hydrogen sulphide in acetylene. J. Japan Chem. Ind. Soc. 1951, 33, 1–10. [Google Scholar]
  15. Kawamura, K.; Ohkuma, H.; Miyazawa, K. Development of a Chromium-free Gas Detector Tube for Alcohols. Anal. Sci. 2021, 37, 387–391. [Google Scholar] [CrossRef]
  16. JIS K 0804:2014 Gas Detector Tube Measurement System (Length-of-Stain Type); Japanese Standards Association: Tokyo, Japan, 2014.
  17. ISO 17621:2015 Workplace Atmospheres—Short Term Detector Tube Measurement Systems—Requirements and Test Methods; The International Organization for Standardization: Geneva, Switzerland, 2015.
  18. Azuma, M.; Endo, Y.; Miyazaki, T.; Hikita, Y.; Ikeda, H.; Morita, Y.; Hara, I.; Araki, S. Efficacy of a Detector Tube Method in Formaldehyde Measurement. Ind. Health 2003, 41, 306–312. [Google Scholar] [CrossRef] [Green Version]
  19. Ishizawa, F.; Hirano, H. Development of a New Type Detector Tube for Light Mineral Oils. Bull. Jpn. Assoc. Fire Sci. Eng. 2005, 55, 29–32. [Google Scholar]
  20. Norimine, E.; Ishiwata, T.; Ishizawa, F.; Saegusa, S. Development of a Biodiesel Fuel Detector Tube. Bull. Jpn. Assoc. Fire Sci. Eng. 2009, 59, 56–60. [Google Scholar]
  21. Kobayashi, Y.; Abe, T.; Takeno, H.; Kanno, S.; Fukui, S.; Naito, S. Investigation on the contribution of engine exhausts to urban atmospheric pollution at a street of heavy traffic density in Yokohama. Bunseki Kagaku 1963, 12, 1057–1062. [Google Scholar] [CrossRef] [Green Version]
  22. Hori, M.; Uda, K.; Yang, J.P. Determination of low-concentration formaldehyde in indoor air with discriminator and detector tube. Bunseki Kagaku 1998, 47, 405–410. [Google Scholar] [CrossRef] [Green Version]
  23. Kawamura, K. Chapter 3 Gas detector tube. In New Information and Proposal for Modern Control Technology; Korai, H., Takatori, H., Eds.; Technosystems: Tokyo, Japan, 2019; pp. 245–248. [Google Scholar]
  24. Kawamura, K.; Honma, H.; Iwasaki, T.; Tanisho, S. Development of the Apparatus for Cellulosic Bio-Ethanol learning and Establishment of Its Procedure. Chem. Educ. J. 2009, 12, 2. [Google Scholar]
  25. Kelimu, A.; Hori, M.; Watanabe, Y.; Takashima, T. Development of an Apparatus for Model Experiment of Ozone Depletion and Establishment of Its Procedure. Chem. Educ. 2006, 54, 106–109. [Google Scholar]
  26. Kelimu, A.; Hori, M. Study on Application of Model Experiment Device for Ozone Layer Depletion to Classes. Chem. Educ. 2008, 17, 14–24. [Google Scholar]
  27. Kawamura, K.; Honma, H. Challenge to advance gas detector tube. Safety Digest. 2010, 56, 24–28. [Google Scholar]
  28. The WHO European Centre for Environment and Health, Bonn Office. Formaldehyde. In WHO Guidelines for Indoor Air Quality: Selected Pollutants; WHO Regional Office for Europe: Copenhagen, Denmark, 2010; pp. 103–142. [Google Scholar]
  29. Kawamura, K. Gas detector tube and measurement of odor. J. Jpn. Assoc. Odor Environ. 2019, 50, 371. [Google Scholar]
  30. Katsumata, M. Discharge Control Measures for Volatile Organic Compounds. J. Jpn. Assoc. Odor Environ. 2008, 39, 364–369. [Google Scholar] [CrossRef] [Green Version]
  31. Kawamura, K.; Honma, H. Novel simplified VOC measurement methods for voluntary action on Air Pollution Control Law. Environ. Meas. Technol. 2006, 33, 14–21. [Google Scholar]
  32. Website of Komyo Rikagaku Kogyo. Available online: https://www.komyokk.co.jp/pdata/tpdf/120SE_1.pdf (accessed on 25 May 2021).
  33. Kitagawa, T.; Ogawa, T. A rapid method for the determination of phosphine and hydrogen sulfide in acetylene. Denki Kagaku 1951, 19, 258–261. [Google Scholar]
  34. Kitagawa, T.; Wright, B.M. A quantitative detector-tube method for breath-alcohol estimation. Br. Med. J. 1962, 2, 652–653. [Google Scholar] [CrossRef] [PubMed] [Green Version]
  35. Tchounwou, P.B.; Yedjou, C.G.; Patlolla, A.K.; Sutton, D.J. Molecular. Clin. Environ. Toxicol. 2012, 101, 133–164. [Google Scholar]
  36. Kawamura, K.; Saegusa, S.; Miyazawa, K. Development of a Gas Detector tube for Phosphine based on Silver without Mercury. In Proceedings of the RSC Tokyo International Conference, Makuhari, Japan, 5 September 2019; p. 55. [Google Scholar]
  37. Website of Minamata Convention on Mercury. Available online: http://www.mercuryconvention.org/ (accessed on 20 May 2021).
  38. Saegusa, S.; Suzuki, M. Detecting Tube. JP Patent 6196803, 4 December 2014. [Google Scholar]
  39. Kubota, R. Qualitative Toxic Gas Detector Tube. Japanese Patent JP59-194066U1, 14 July 1983. [Google Scholar]
  40. Website of Komyo Rikagaku Kogyo. Available online: https://www.komyokk.co.jp/pdata/tpdf/131_1.pdf (accessed on 25 May 2021).
  41. Hartmut, S.; Peter, D. A Device for Colorimetric Detection of Gaseous and/or Vapor Components of a Gas Mixture. Japanese Patent JP06-242008A, 10 February 1994. [Google Scholar]
  42. Wolfgang, B. Gas Measurement Chip, Transportable Chip Measurement System and Method for Operating a Transportable Chip Measurement System. International Patent WO 2016/074788 AI, 19 May 2016. [Google Scholar]
  43. Douglas, V.; Moses, J.W.; Brumbaugh, C.W.V. Automatic Gas Analyzer. U.S. Patent 2,551,281, 29 November 1944. [Google Scholar]
  44. Keinash, G. Record Survey: 11 Chemical Recording. In Recording Surface and Marking Methods; United States Department of Commerce National Bureau of Standards: Washington, DC, USA, 1959; pp. 33–34. [Google Scholar]
  45. Nakano, N.; Yamamoto, A.; Kawabe, T.; Nagashima, K. An Automatic Measurement of Formaldehyde in Air by a Monitoring Tape Method. Nippon Kagaku Kaishi 1998, 7, 506–510. [Google Scholar] [CrossRef] [Green Version]
  46. Nakano, N.; Ishikawa, M.; Kobayashi, Y.; Nagashima, K. Development of a Monitoring Tape for Formaldehyde Using Hydroxylamine Sulfate and Methyl Yellow. Anal. Sci. 1994, 10, 641–645. [Google Scholar] [CrossRef] [Green Version]
  47. Nagashima, K.; Tamura, M.; Ishiguro, G.; Nakano, N. Development of a Monitoring Tape for Hydrogen Cyanide in Air Using Cu (II)-DPD and Eliminating Oxidizing Gases. J. Jpn. Soc. Atmos. Environ. 2005, 40, 165–171. [Google Scholar]
  48. Nakano, N.; Kawabe, T.; Isaka, M.; Nozima, Y. An automatic monitor of ammonia in air using ammonia-sensitive tape. Bunseki Kagaku 1998, 47, 423–428. [Google Scholar] [CrossRef] [Green Version]
  49. Nakano, N.; Yabe, H.; Nagashima, K.; Kamaya, M. Development of a monitoring tape for fluorescence detection of hydrogen chloride gas using 6, 9-dichloro-2-methoxyacridine. Bunseki Kagaku 1995, 44, 151–155. [Google Scholar] [CrossRef] [Green Version]
  50. Nakano, N.; Yamamoto, A.; Kobayashi, Y.; Nagashima, K. Development of a monitoring tape for determination of hydrogen sulfide using silver perchlorate. Bunseki Kagaku 1994, 43, 645–648. [Google Scholar] [CrossRef] [Green Version]
  51. Nakano, N.; Kobayashi, Y.; Nagashima, K. Development of a tape for the determination of silane using ethyleneglycol. Bunseki Kagaku 1993, 42, 89–92. [Google Scholar] [CrossRef] [Green Version]
  52. Nakano, N.; Kobayashi, Y.; Nagashima, K. An improvement of light resistance of the tape for the determination of phosphin and arsine. Bunseki Kagaku 1992, 41, 659–661. [Google Scholar] [CrossRef]
  53. Terauchi, Y.; Kawabe, T.; Nakano, N.; Suzuki, Y.; Suzuki, K. Development of a Portable Monitor for a Formaldehyde in the Workplace Environment. Bunseki Kagaku 2005, 54, 65–70. [Google Scholar] [CrossRef] [Green Version]
  54. Suzuki, Y.; Fujikawa, T.; Nakano, N.; Terauchi, Y.; Suzuki, K. Development of Colorimetric Reagents and Easy Monitoring Devices for the Selective Detection of Formaldehyde and Their Practical Uses. Bunseki Kagaku 2010, 59, 885–894. [Google Scholar] [CrossRef] [Green Version]
  55. Suzuki, Y.; Nakano, N.; Suzuki, K. Portable Sick House Syndrome Gas Monitoring System Based on Novel Colorimetric Reagents for the Highly Selective and Sensitive Detection of Formaldehyde. Environ. Sci. Technol. 2003, 37, 5695–5700. [Google Scholar] [CrossRef]
  56. Ishiguro, G.; Kawabe, T.; Nakano, N.; Nagashima, K. Development of a Detection Tablet for a Portable NO2 Monitoring System. Anal. Sci. 2006, 22, 789–791. [Google Scholar] [CrossRef] [Green Version]
  57. Kawamura, K.; Kerman, K.; Fujihara, M.; Nagatani, N.; Hashiba, T.; Tamiya, E. Development of a novel hand-held formaldehyde gas sensor for the rapid detection of sick building syndrome. Sens. Actuators B Chem. 2005, 105, 495–501. [Google Scholar] [CrossRef]
  58. Kawamura, K.; Vestergaard, M.; Ishiyama, M.; Nagatani, N.; Hashiba, T.; Tamiya, E. Development of a novel hand-held toluene gas sensor: Possible use in the prevention and control of sick building syndrome. Measurement 2006, 39, 490–496. [Google Scholar] [CrossRef]
  59. Cook, D.A.; Syracuse, Y.N. Test Strips for Detecting Low Concentrations of Chlorine in Air. U.S. Patent 2,606,102, 3 December 1946. [Google Scholar]
  60. Website of American Chemistry Council. 4.0 Industrial Hygiene and Personal Protective Equipment. Available online: https://www.americanchemistry.com/Industrial-Hygiene-and-Protective-Equipment/ (accessed on 20 May 2021).
  61. Diller, W.; Reichold, E. Plaque for Measuring the Dose of Reactive Gases. U.S. Patent 4,271,121, 13 September 1979. [Google Scholar]
  62. American Conference of Governmental Industrial Hygienists. 2021 Threshold Limit Values (TLVs) and Biological Exposure Indices (BEIs); Signature Publication; American Conference of Governmental Industrial Hygienists: Cincinnati, OH, USA, 2021; p. 34.
  63. Maruo, Y.Y.; Nakamura, J. Indoor air monitoring using newly developed portable formaldehyde monitoring device. Indoor Environ. 2010, 13, 163–172. [Google Scholar] [CrossRef] [Green Version]
  64. Askim, J.R.; Li, Z.; LaGasse, M.K.; Rankina, J.M.; Suslick, K.S. An optoelectronic nose for identification of explosives. Chem. Sci. 2016, 7, 199–206. [Google Scholar] [CrossRef] [Green Version]
  65. Li, Z.; Askim, J.R.; Suslick, K.S. The Optoelectronic Nose: Colorimetric and Fluorometric Sensor Arrays. Chem. Rev. 2019, 119, 231–292. [Google Scholar] [CrossRef]
  66. Lim, S.H.; Feng, L.; Kemling, J.W.; Musto, C.J.; Suslick, K.S. An optoelectronic nose for the detection of toxic gases. Nat. Chem. 2009, 1, 562–567. [Google Scholar] [CrossRef] [Green Version]
  67. Kangas, M.J.; Burks, R.M.; Atwater, J.; Lukowicz, R.M.; Williams, P.; Holmes, A.E. Colorimetric Sensor Arrays for the Detection and Identification of Chemical Weapons and Explosives. Crit. Rev. Anal. Chem. 2017, 47, 138–153. [Google Scholar] [CrossRef] [PubMed] [Green Version]
  68. Mitsubayashi, K.; Hashimoto, Y.; Nakayama, Y.; Montesinos, T.; Nouger, T.; Marty, J.L. Gas-sensors with high selectivity using a biological catalytic system. J. Adv. Sci. 2000, 12, 211–216. [Google Scholar] [CrossRef]
  69. Seto, Y. On-site Detection Method for Biological and Chemical Warfare Agents. Bunseki Kagaku. 2006, 55, 891–906. [Google Scholar] [CrossRef]
  70. Kawamura, K.; Hashiba, T.; Tamiya, E. Phosphate Ester Detection Method, Detection Device and Detection Kit. Japanese Patent JP2003-322619, 2 March 2002. [Google Scholar]
  71. Owyeung, R.E.; Panzer, M.J.; Sonkusale, S.R. A colorimetric gas sensing washable threads for smart textiles. Sci. Rep. 2019, 9, 5607. [Google Scholar] [CrossRef] [Green Version]
  72. Wodjenski, M.J.; Arno, J.I. Gas Cabinet Including Integrated Effluent Scrubber. U.S. Patent 7,018,448 B2, 28 October 2003. [Google Scholar]
  73. Website of Komyo Rikagaku Kogyo. Available online: https://www.komyokk.co.jp/product/001/001/0136.html (accessed on 25 May 2021).
  74. Cho, S.H.; Suh, J.M.; Eom, T.H.; Kim, T.; Jang, H.W. Colorimetric Sensors for Toxic and Hazardous Gas Detection: A Review. Electron. Mater. Lett. 2021, 17, 1–17. [Google Scholar] [CrossRef]
  75. Lin, C.; Du, Z.; Tao, N.; Wang, D. Gradient-Based Colorimetric Array Sensor for Continuous Monitoring of Multiple Gas Analytes. ACS Sens. 2021, 6, 439–442. [Google Scholar] [CrossRef]
  76. Nitta, T.; Takeda, Y.; Haradome, M. 1.3 Type and characteristic of gas sensor. In Gas Sensors and Their Application; Power: Tokyo, Japan, 1987; pp. 8–17. [Google Scholar]
  77. Oyabu, T.; Kimura, H. Development of a Monitoring System for Indoor Air-Pollution Using a Semiconductive Tin Oxide Gas Sensor. Trans. Soc. Instrum. Control. Eng. 1996, 32, 1121–1128. [Google Scholar] [CrossRef] [Green Version]
  78. Yamazoe, N. Semiconductor type gas sensor. In Chemical Sensor Practical Handbook; Seiyama, T., Ed.; NTS: Tokyo, Japan, 1986; pp. 13–18. [Google Scholar]
  79. Korotcenkov, G.; Cho, B.K. Metal oxide composites in conductometric gas sensors: Achievements and challenges. Sens. Actuators B 2017, 244, 182–210. [Google Scholar] [CrossRef]
  80. Mirzaei, A.; Lee, J.H.; Majhi, S.M.; Weber, M.; Bechelany, M.; Kim, H.W.; Kim, S.S. Resistive gas sensors based on metal-oxide nanowires. J. Appl. Phys. 2019, 126, 241102. [Google Scholar] [CrossRef] [Green Version]
  81. Feng, S.; Farha, F.; Li, Q.; Wan, Y.; Xu, Y.; Zhang, T.; Ning, H. Review on Smart Gas Sensing Technology. Sensors 2019, 19, 3760. [Google Scholar] [CrossRef] [Green Version]
  82. Egashira, M. Catalytic Combustion type gas sensor. In Chemical Sensor Practical Handbook; Seiyama, T., Ed.; NTS: Tokyo, Japan, 1986; pp. 61–69. [Google Scholar]
  83. Ishiji, T. Elecrochemical Gas Sensors for Environmental Monitoring. IEEJ Trans. Sens. Micromach. 1998, 118, 76–79. [Google Scholar] [CrossRef] [Green Version]
  84. Shiokawa, J.; Yamakawa, K. Electrochemical sensor. In Chemical Sensor Practical Handbook; Seiyama, T., Ed.; NTS: Tokyo, Japan, 1986; pp. 61–71. [Google Scholar]
  85. Hori, H.; Ishimatsu, S.; Fueta, Y.; Hinoue, M.; Ishidao, T. Sensing Characteristics of a Real-time Monitor Using a Photoionization Detector on Organic Solvent Vapors. J. UOEH 2012, 34, 363–368. [Google Scholar] [CrossRef] [PubMed] [Green Version]
  86. Website of the Department of Homeland Security. Available online: https://www.dhs.gov/sites/default/files/publications/HH-PIDs-MSR_1113-508.pdf (accessed on 20 July 2021).
  87. RIKEN KEIKI Co., Ltd. 11-3. Kist of gases for reading VOC. In Portable Multi-Gas Monitor GX-6000 Operating Munual; RIKEN KEIKI Co., Ltd.: Tokyo, Japan, 2014; pp. 120–140. [Google Scholar]
  88. Website of Komyo Rikagaku Kogyo. Available online: https://www.komyokk.co.jp/en/product/001/index.html (accessed on 25 May 2021).
  89. Website of Gastec. Available online: https://www.gastec.co.jp/product/detector_tube/search/ (accessed on 19 July 2021).
  90. Drager Safety AG & Co KGaA. Drager-Tube/CMS Handbook: Handbook for Short Term Measurements in Soil, Water, and Air Investigations as Well as a Technical Gas Analysis; Drager Safety AG & Co KGa: Lubeck, Germany, 2004; pp. 59–263. [Google Scholar]
Figure 1. Picture of the first gas detector tube: (H) gas detector tube of CO; (K) stopper; (F) detector tube fixing tube (M) granular active charcoal; (N) porous plug; (L) spring; (O) rubber bulb [3].
Appliedchem 01 00003 g001
Figure 2. Picture of the gas detector tube and concentration chart: (a) picture of the gas detector tube for simultaneous detection of H2S and PH3 [14]; (b) first concentration chart for gas detector tube of H2S [4].
Appliedchem 01 00003 g002
Figure 3. Picture of the pump and gas detector tube: (a) aspirating pump for gas detector tube; (b) sampling method for gas detector tube. Adapted with permission from ref. [15]. Copyright 2021 Japan Society for Analytical Chemistry.
Appliedchem 01 00003 g003
Figure 4. Example of the printed scale on the detector tube and discolored layer. Adapted with permission from ref. [15]. Copyright 2021 Japan Society for Analytical Chemistry.
Appliedchem 01 00003 g004
Figure 5. Example of the electric sampling pump and detector tube: (a) picture of the electric sampling pump; (b) gas detector tube of acetic and formic acid for low concentration gas detection.
Appliedchem 01 00003 g005
Figure 6. Diagram of TD-GD method.
Appliedchem 01 00003 g006
Figure 7. (a) Diagram of the CC-GD method; (b) diagram and picture of the CC-GD method. Adapted with permission from ref. [31]. Copyright 2006 Kawamura and Honma.
Appliedchem 01 00003 g007
Figure 8. Picture of a PH3 detector tube that contains mercury chloride: (a) before gas sampling; (b) after gas sampling. Adapted with permission from ref. [36]. Copyright 2019 Kawamura, Saegusa and Miyazawa.
Appliedchem 01 00003 g008
Figure 9. Picture of an ethanol detector tube that contains Cr(VI): (a) before gas sampling; (b) after gas sampling.
Appliedchem 01 00003 g009
Figure 10. Picture of a PH3 detector tube without mercury (uses silver sulfate): (a) before gas sampling; (b) after gas sampling. Adapted with permission from ref. [36]. Copyright 2019 Kawamura, Saegusa and Miyazawa.
Appliedchem 01 00003 g010
Figure 11. Picture of the alcohol detector tube without Cr(VI) (KMnO4): (a) before gas sampling; (b) after gas sampling.
Appliedchem 01 00003 g011
Figure 12. Inorganic gas qualitative detector tube: (a) picture of the detector tube; (b) original color. Adapted with permission from ref. [40]. Copyright 2021 Komyo Rikagaku Kogyo K.K.
Appliedchem 01 00003 g012
Figure 13. Detection chart of the inorganic gas qualitative detector tube. Adapted with permission from ref. [40]. Copyright 2021 Komyo Rikagaku Kogyo K.K.
Appliedchem 01 00003 g013
Figure 14. Picture of the gas detector tube in the chip system: (a) gas detector (photometer and air pump); (b) gas detector tube in small chip (10 tubes in the chip).
Appliedchem 01 00003 g014
Figure 15. Schematic of the tape monitor method. Adapted with permission from ref. [8] (p. 16). Copyright 2004 Kawamura.
Appliedchem 01 00003 g015
Figure 16. Example of detection paper tablet. Adapted with permission from ref. [8] (p. 27). Copyright 2004 Kawamura.
Appliedchem 01 00003 g016
Figure 17. Schematic of photometer and detection paper tablet.
Appliedchem 01 00003 g017
Figure 18. The reaction of HCHO and KD-XA01.
Appliedchem 01 00003 g018
Figure 19. Photograph of sensor for HCHO gas detection: (a) photometer; Adapted with permission from ref. [57]. Copyright 2005 Elsevier. (b) glass paper with AHMT/KOH solution after HCHO gas exposure. Adapted with permission from ref. [8] (p. 40). Copyright 2004 Kawamura.
Appliedchem 01 00003 g019
Figure 20. Comparison of AHMT- and hydroxylamine-based methods (n = 5) with calibration graphs for AHMT-based method after (a) 5 min and (b) 3 min and (c) hydroxylamine-based method after 30 min. Hydroxylamine is a dry-based method. The corresponding coefficient variation value is shown over each position. Adapted with permission from ref. [57]. Copyright 2005 Elsevier.
Appliedchem 01 00003 g020
Figure 21. The reaction of HCHO and AHMT.
Appliedchem 01 00003 g021
Figure 22. Photograph of glass paper with I2O5 solution after exposing it to toluene gas. Adapted with permission from ref. [8] (p. 92). Copyright 2004 Kawamura.
Appliedchem 01 00003 g022
Figure 23. Photograph of test strips with KD-XA01 after exposure to 0.1 ppm HCHO gas for 8 h. Adapted with permission from ref. [8] (p. 126). Copyright 2004 Kawamura.
Appliedchem 01 00003 g023
Figure 24. Photograph of sensors for KD-XA01-based method and HCHO gas detector paper method: (a) detector paper containing KD-XA01 before and after reaction with HCHO gas; (b) absorption spectra of 124 mM of KD-XA01 before and after reaction with 1000 mg/L of HCHO at room temperature. Adapted with permission from ref. [8] (pp. 59–83). Copyright 2004 Kawamura.
Appliedchem 01 00003 g024
Figure 25. A passive sampling badge shown attached to a worker’s collar for personal sampling and clipped in an appropriate location for use in a workplace. Adapted with permission from ref. [8] (pp. 59–83). Copyright 2004 Kawamura.
Appliedchem 01 00003 g025
Figure 26. Color change response of the detection film: (a) the original black color of the unexposed film; (b) the yellow color of the film in presence of NH3 gas [7].
Appliedchem 01 00003 g026
Figure 27. The dependence of color change response time of the MAPI film on different gas concentrations [7].
Appliedchem 01 00003 g027
Figure 28. FESEM Images: (a) bare paper; (b) MAPI thin film grown on paper [7].
Appliedchem 01 00003 g028
Figure 29. The optoelectronic nose: (A) the linear array of colorimetric sensors and disposable cartridge, cartridge side view (7.9 × 2.8 × 1.0 cm3); (B) cartridge front view; (C) handheld reader/analyzer (12.8 × 9.5 × 4.0 cm3) based on a color contact line imager [64].
Appliedchem 01 00003 g029
Figure 30. Picture of apparatus for sensing phosphoric ester. Adapted with permission from ref. [70]. Copyright 2002 Kawamura.
Appliedchem 01 00003 g030
Figure 31. Enzymatic reaction of the apparatus for sensing phosphoric ester. Adapted with permission from ref. [70]. Copyright 2002 Kawamura. TMBZ: 3,3′,5,5′-Tetramethylbenzidine.
Appliedchem 01 00003 g031
Figure 32. Gas sensing demonstration—optical images. Optical images of BTB, MR, and MnTPP devices for different concentrations of (a) NH3 and (b) HCl; corresponding RGB color information extracted from the optical images for (c) NH3 and (d) HCl [71].
Appliedchem 01 00003 g032
Figure 33. Diagram of colorimetric indicator for scrubber.
Appliedchem 01 00003 g033
Figure 34. Color detection of PH3 indicator for scrubber by smartphone camera.
Appliedchem 01 00003 g034
Figure 35. Oxygen monitoring with smartphone, AWS and Zabbix through the internet: (a) oxygen monitor; (b) monitoring result of oxygen with AWS and ZABBIX. Adapted with permission from ref. [13]. Copyright 2002 Kawamura.
Appliedchem 01 00003 g035
Figure 36. Illustration of Internet of Things (IoT) verticals and market opportunities for multigas smart sensors: smart homes, agriculture, smart cities, industry, healthcare and smart grid [12].
Appliedchem 01 00003 g036
Table 1. Measurement results for CC-GD method and GC-FID method [31].
VOCCC-GD
(ppmC)
GC-FID
(ppmC)
Bias of CC-GD for GC-FID
(%) 1
Toluene296029450.5
Ethyl acetate24452618−1.4
Mixed VOC 1 2266024409.0
Mixed VOC 2 3420428−1.9
1 Bias % = measurement result of (CC-GD − GC-FID)/GC-FID × 100. 2 Toluene: 463 ppmC, methyl ethyl ketone: 542 ppmC, ethyl acetate: 755 ppmC, hexane: 680 ppmC. 3 Toluene: 419 ppmC, methyl ethyl ketone: 9 ppmC.
Table 2. Different ammonia sensors based on other materials and their response time to detect the ammonia gas concentration [7].
NH3SensorsResponse Time (in s)NH3 Gas Concentration (in ppm)
rGo 110810
PANI 280050
SnO2300010
CNT–TiO2600Not mentioned
1 Reduced graphene oxide. 2 Polyaniline.
Table 3. Comparison of various gas detector technologies.
Semiconductor
[76,77,78,79,80]
Catalytic
Combustible
[76,81,82]
Electrochemical
[76,83,84]
Photoionization
[85,86,87]
Colorimetric
[88,89,90]
SensitivityO
(sub-ppm)
×
(sub-%)

(ppm)

(ppb)

(ppb)
Selectivity××
Continuous monitoring/data transferOOOO1
Oxygen requirement during measurementRequiredRequiredRequiredNot requiredNot required
Number of measurable gases for commercial products×
For reducing gas/oxidizing gas
×
For combustible gas

(less than 100)

(more than 300)

(more than 300)
1 Continuous gas detector with a colorimetric method such as the tape monitor method. ◎: very good, O: good, △: not so good, ×: not good.
Publisher’s Note: MDPI stays neutral with regard to jurisdictional claims in published maps and institutional affiliations.

