
Article

Case Study on the Application of a Commercial Microbial Consortium to Reduce Off-Flavour in a Recirculating Aquaculture System for Nile tilapia (Oreochromis niloticus) Production

by
Pedro Martínez Noguera
1,
Raju Podduturi
1,2,
Mikael A. Petersen
1 and
Niels O. G. Jørgensen
2,*
1
Section of Design and Consumer Behaviour, Department of Food Science, University of Copenhagen, 1871 Frederiksberg, Denmark
2
Section of Microbial Ecology and Biotechnology, Department of Plant and Environmental Sciences, University of Copenhagen, 1858 Frederiksberg, Denmark
*
Author to whom correspondence should be addressed.
Aquac. J. 2026, 6(2), 20; https://doi.org/10.3390/aquacj6020020
Submission received: 10 March 2026 / Revised: 14 May 2026 / Accepted: 31 May 2026 / Published: 2 June 2026

Abstract

The impact of a commercial microbial population (product name “RAS Right”) on the off-flavours geosmin and 2-methylisoborneol (2-MIB) in water and fish of a recirculating aquaculture system (RAS) for Nile tilapia production was studied over five months. The “RAS Right” product contains a microbiome that is reported to reduce geosmin. In the system that received “RAS Right”, geosmin ranged from 1.6 to 171.2 ng/L, while 2.4 to 89.3 ng/L occurred in the control RAS. After fluctuations in the first two months, water in the control RAS had lower geosmin concentrations (mean of 8.8 ng/L) than the treated RAS (mean of 16.6 ng/L). 2-MIB was low (<4.3 ng/L) or undetectable in both the control and treated systems. In the fish, geosmin varied from 112 to 3683 ng/kg, with the highest levels measured in the treated RAS during three of eight samplings. 2-MIB in the fish ranged from 11.6 to 136 ng/kg and peaked in the treated RAS in one sampling. The results indicate that “RAS Right” did not produce a significant reduction of geosmin or 2-MIB in water or fish. However, optimisation of the treatment with respect to dose or addition frequency may improve its effect, though this remains to be examined.

1. Introduction

Off-flavours in recirculating aquaculture systems (RAS) continue to be a persistent issue in the aquaculture industry and may hinder the expansion of RAS technology [1,2]. Among the various potential off-flavours encountered in aquaculture systems, geosmin and 2-methylisoborneol (2-MIB) are recognised as common contributors to the “earthy” and “musty” characteristics in tainted fish from RAS farms [3,4]. These microbial compounds are produced by diverse bacterial groups, such as Actinobacteria, Myxococcota, and Cyanobacteria, and display medium-to-high lipophilicity, which facilitates rapid accumulation into the fish’s fatty tissues [5].
RAS generally consists of various modules, such as mechanical filtration, biofiltration and units for degassing and oxidative processes, designed to treat and filter the rearing water while regulating levels of suspended solids, dissolved organics, microorganisms, inorganic nutrients (phosphate, ammonia, nitrate, and nitrite) and CO2. However, water treatments typically used in RAS do not effectively remove off-flavours [2,6]. Several strategies to minimise these microbial metabolites have been investigated, focusing on both physical, chemical and biological methods [6]. Physical approaches include protein skimmers, adsorbents such as activated carbon filters, and depuration, in which fish are placed in off-flavour-free water to excrete accumulated compounds [6,7,8]. Depuration remains the most prevalent off-flavour removal method in the RAS industry, although it can impose considerable economic costs on farmers. Depuration may decrease the market value of fish due to weight loss caused by fasting during the process, potentially affecting product quality. Additionally, the labour and resources needed to set up and operate a depuration facility should not be overlooked [6]. Chemical methods for reducing off-flavours often involve oxidising agents, such as ozone, UV, or hydrogen peroxide, which help reduce the organic and microbial content in the water. Nevertheless, the effectiveness of these agents in removing off-flavours remains debated, despite their widespread adoption across most RAS farms. As a result, unresolved issues with off-flavours in fish produced by RAS persist [2].
An alternative biological approach for removing off-flavour compounds in fish farming is microbial degradation. For example, certain species of Gram-negative bacteria, isolated from a water treatment facility in South Australia, were able to degrade geosmin and 2-MIB in experimental bioreactors to levels close to the human sensory threshold [9,10]. In environments relevant to RAS, Guttman and van Rijn [11] documented the breakdown of geosmin and 2-MIB by bacteria in anaerobic sludge, and identified Gram-negative bacteria in a RAS digestion basin that could grow using geosmin and 2-MIB as their sole carbon source [11,12]. Species in the Gram-positive genus Bacillus have also shown potential for off-flavour degradation, as demonstrated by two strains within the Bacillus cereus group, isolated from lake water, which could reduce 2-MIB to around 10 ng/L [13]. In another study, Bacillus subtilis reduced geosmin and 2-MIB to approximately 2 ng/L when growing on organic matter from aquaculture production [14].
Although results from the experimental studies indicate the microbial potential for degrading geosmin and 2-MIB, these findings have not yet been verified in large-scale, commercial RAS facilities. Nonetheless, microorganisms in RAS environments may assist in reducing off-flavours. The company Nova Q has launched the product “RAS Right” as a microbial management agent for inoculation in RAS systems, primarily to enhance ammonium oxidation (nitrification), but the product was also found capable of lowering geosmin levels from above 60 ng/L to below 5 ng/L after four months of treatment in a salmon RAS farm in British Columbia, Canada (https://www.nova-q.ie). The microbial composition of “RAS Right” is not disclosed to clients, and the precise cause of geosmin reduction remains uncertain. It may be due to both the suppression of geosmin-producing bacteria and the breakdown of geosmin itself. However, the reduction could also be influenced by other, yet unreported factors.
In this study, we aimed to test whether the RAS Right product could also reduce geosmin and 2-MIB concentrations in a RAS farm for Nile tilapia (Oreochromis niloticus), produced in an indoor facility in southern Sweden (https://www.gf-hatchery.se, accessed on 15 March 2026). After applying the RAS Right product as recommended by the company, concentrations of geosmin and 2-MIB in water and fish were monitored for five months. We hypothesised that the recurrent addition of the bacterial product to the biofilter in the RAS for warm-water tilapia could reduce the levels of the microbial off-flavours geosmin and 2-MIB in both water and fish, as observed in a cold-water RAS for salmon production.

2. Materials and Methods

2.1. Chemicals

Certified chemical reference standards (Sigma Aldrich, Steinheim, Germany) of geosmin and 2-methylisoborneol in methanol were used for the quantification of these compounds in all water and fish samples. The RAS Right product was received from the producer Nova Q (www.nova-q.ie) and added weekly to the biofilter as recommended by Nova Q.

2.2. Sampling Strategy

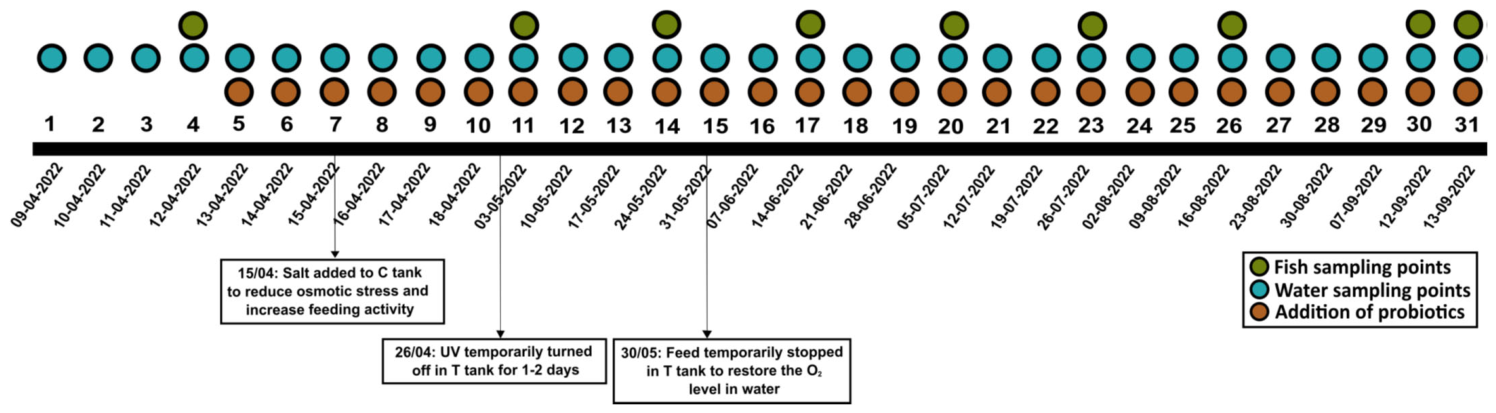
Two identical circular 15 m3 production tanks in two independent RAS were used as experimental modules. The biomass of the fish in each tank was 65 kg/m3, and the individual weight of the fish was 500–900 g. The daily freshwater supply was 5%, and the water temperature was maintained around 28 °C. One tank system served as the control RAS module (designated as “C tank”), where no treatment with RAS Right was applied. The second tank system was treated with RAS Right by adding 1.89 L/week into the moving bed biofilter (40 m3 volume) as recommended by the manufacturer, and this was designated as the “T tank” RAS. The RAS Right product was added for a total of 28 weeks, from 4 April to 13 September 2022 (Figure 1, represented by orange circles). Water samples were collected weekly, starting three weeks prior to the start of the treatment and continuing throughout the entire treatment period. This resulted in 31 sampling points (Figure 1, blue circles). Fish were collected in triplicate every third week, before and during treatment, resulting in nine sampling points (Figure 1, green circles). Water samples were stored at −20 °C until analysis. Fish were slaughtered by the producer (typical weight was about 800 g per fish) and delivered to the laboratory in a thermo-insulated box with ice. Fillets were deskinned, wrapped in aluminium foil, vacuum-sealed in plastic bags, and stored at −20 °C until analysis. Both RAS units were operating properly, with water pH between 6.8 and 7.4, oxygen concentrations averaging 3.5 mg/L, ammonium levels below 1 mg/L, and nitrate around 80 mg/L. Nitrite levels were below 10 mg/L. Additional water quality parameters such as TAN, nitrate, and CO2 were not measured.
During the trial period, a few unexpected events occurred in both tank systems as indicated in Figure 1. On 15 April, NaCl was introduced at 1 g/L into the C tank because the fish appeared apathetic and were reluctant to feed. Salt is typically used in freshwater fish farming to minimise the bacterial load, but salt may also improve the overall fish activity, e.g., due to reducing osmotic stress [15]. Later, on 16 April, the UV filter was found switched off in the T tank for one or two days. At the end of May (30 May), feeding was paused in the T tank because oxygen concentrations were considered too low and normal levels (about 3.5 mg/L) had to be reestablished.

2.3. Geosmin and 2-MIB Quantification in Water and Fish Samples

Geosmin and 2-MIB were extracted from the water samples using stir-bar sorptive extraction (SBSE) and GC–MS according to Podduturi et al. [16]. In summary, a commercial stir bar (Twister®; Gerstel GmbH & Co. KG, Mülheim an der Ruhr, Germany) coated with PDMS (2-cm long and 1-mm thick) was added to 20 mL of the water samples in 50 mL glass vials. Extraction was performed at room temperature by spinning the stir bar at 1000 rpm for 120 min. After extraction, each stir bar was carefully washed with cold distilled water, dried out with lint-free paper, and transferred to thermal desorption tubes. Extraction of volatile compounds (VOCs) in water samples was carried out in triplicate as technical replicates, meaning that they were repeated measurements of the same sample material to capture the variability generated by the measuring system.
For fish fillet samples, the dynamic headspace extraction method by Podduturi et al. [8] was used. In this protocol, 10 g of fish flesh (previously deskinned) was blended in 30 mL of water in a 250-mL glass flask using an electronic homogenizer (Ultra Turrax, Ika, Staufen, Germany). VOCs were purged from the headspace with N2 for 60 min at a flow rate of 100 mL/min at 37 °C and collected in Tenax TA traps. Next, the traps were dry-purged with N2 for 10 min at 100 mL/min to remove water. VOC extraction from fish was performed as triplicate biological replicates to measure the biological difference between the different samples, but no technical replicates were included.
VOCs adsorbed on the stir bars and Tenax TA traps were desorbed in a two-step procedure using an automatic thermal desorption unit (TurboMatrix 350, Perkin Elmer, Shelton, CT, USA). The GC-MS analysis followed the protocols of Podduturi et al. [8,17]. First, a primary desorption was carried out by heating the stir bar/Tenax TA trap to 240 °C for 15 min with a carrier gas flow of 50 mL H2/min. The volatiles desorbed were trapped in a second Tenax TA trap held at 1 °C and then rapidly heated up to 280 °C for 4 min to complete the secondary desorption (splitless). This second step resulted in a rapid transfer of volatiles from the thermal desorption unit to the GC-MS system (Agilent 7890 GC coupled to a 5977B MSD; Agilent Technologies, Palo Alto, CA, USA) via a temperature-controlled transfer line maintained at 225 °C. A ZB-Wax capillary column (30 m × 0.25 mm × 0.5 µm) was used for the separation of the volatiles, with H2 serving as the carrier gas at an initial flow rate of 1.4 mL/min. The GC oven program was as follows: isothermal for the first 10 min at 35 °C, then raised at 240 °C at a rate of 8 °C/min, followed by a holding period of 10 min. Mass spectra of the separated volatile compounds were generated after standard EI conditions (70 eV) and detected through a quadrupole mass spectrometer. MS acquisition settings employed a hybrid approach combining scan (SCAN) and selected ion monitoring (SIM) modes. The SCAN mode covered m/z values from 15 to 300, while SIM mode specifically targeted m/z 112 (for geosmin) and m/z 95 and 107 (for 2-MIB) to improve sensitivity.
For quantification of geosmin and 2-MIB in water, external calibration curves were prepared from a GC-grade mixture solution (1:1 v/v) of geosmin and 2-MIB in a dilution series of 10, 50, 100, 200 ng/L in deionised water. Calibration line points were obtained in duplicate. In fish, homogenates were spiked with a GC-grade mixture solution (1:1 v/v) of geosmin at concentrations of 100, 250, 500, and 1000 ng/L and analysed in triplicate for calibration line points. To cover the analytical time span of all the samples, four regression lines were run together with the samples. Linear relationships between known concentration and detected signal, R2 and limit of detection (LOD) are displayed in Table 1.

2.4. Data Analysis

Chromatograms were processed using the MSD ChemStation software (v.E.02.00, Agilent Technologies, Santa Clara, CA, USA). Retention times of geosmin and 2-MIB were determined using calibration curve points, and peak areas were calculated from the SIM chromatograms. Peak areas, calibration curves, and predicted concentrations in the different samples were processed using a standard Excel spreadsheet and further visualised using MATLAB R2023b (MathWorks, Natick, MA, USA). Pearson correlation analyses were also performed using MATLAB R2023b (MathWorks, Natick, MA, USA).

3. Results

3.1. Concentrations of Geosmin and 2-MIB in Water

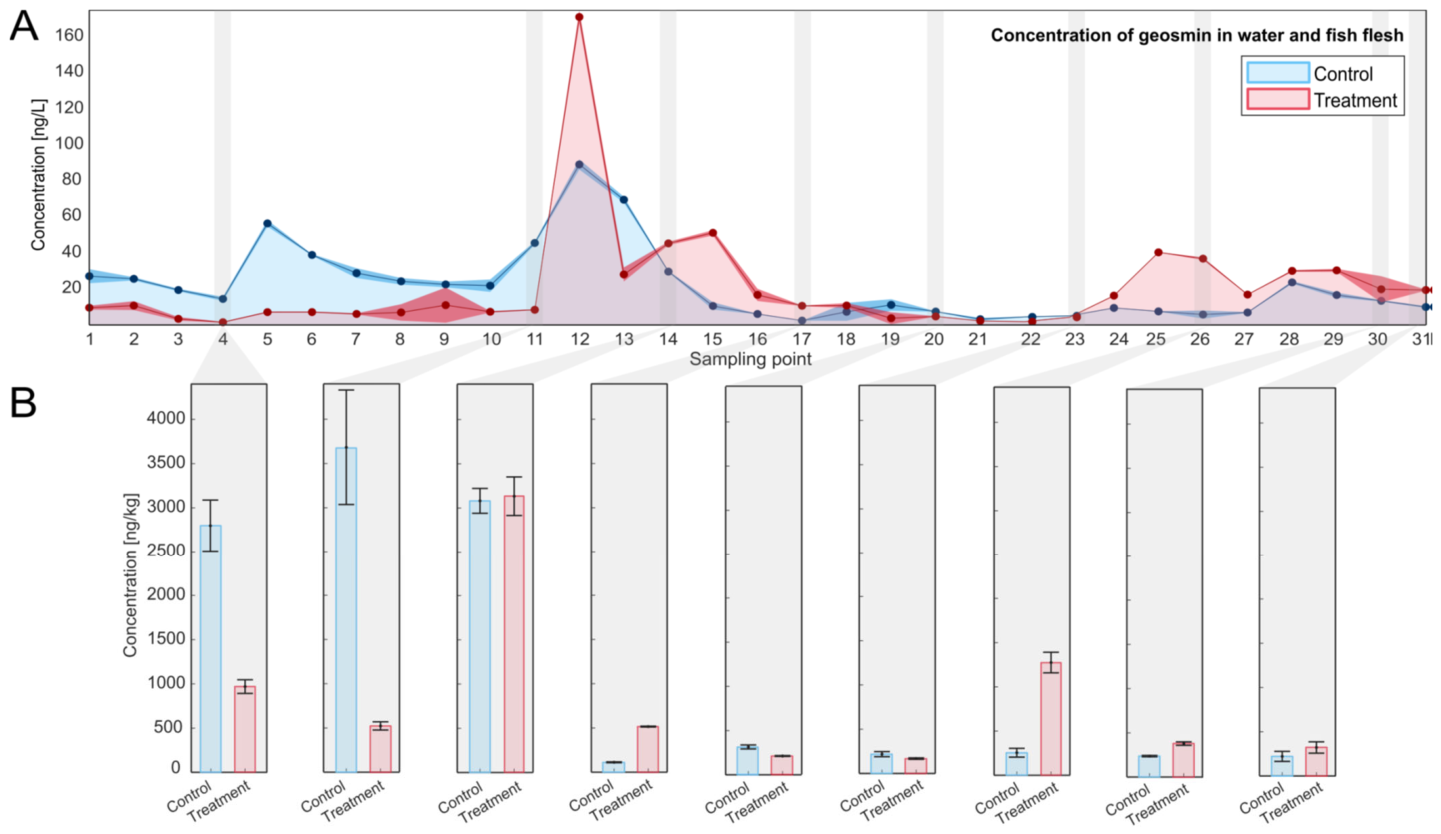
During the five-month trial period, geosmin fluctuated between 1.6 and 171.2 ng/L (mean of 20.7 ng/L) in the system amended with RAS Right (T tank) (Figure 2A). After the product was added on 13 April (when the geosmin concentration was 7.2 ng/L in the water), geosmin remained below 11 ng/L until 10 May, when the concentration reached 171 ng/L. A new peak occurred on 31 May (52.9 ng geosmin/L), followed by a relatively stable level with concentrations below 20 ng/L until the end of July. Later, in August and September, another spike in geosmin concentration occurred (up to 40.4 ng/L at the start of August and 30.6 ng/L in September).
In the control tank (C tank), geosmin ranged from 2.4 to 89.3 ng/L (mean of 21.5 ng/L). Until 17 May, geosmin levels in the C tank fluctuated and exceeded those in the T tank, reaching up to 56.5 ng/L. Afterwards, the C tank generally exhibited lower geosmin levels than the T tank. Changes in geosmin concentrations in the treated and control tanks from May to September did not show parallel trends, and only a weak correlation between their variations was observed (r2 = 0.313; Pearson correlation; Figure S1). Higher geosmin concentrations were found in the treated tanks than in the control tanks on 14 of the 31 sampling days.
Deviation from the general operation of the facility occurred on three occasions. On 14 April, salt was added to the C tank, but this appeared not to affect the geosmin concentration in the water. On 26 April, the UV irradiation was accidentally turned off for one or two days in both systems. Two weeks later, the highest geosmin concentrations were measured in the C tank (172 ng/L) and T tank (89.3 ng/L). Adjustment of the feeding in late May in the T tank (to alleviate declining oxygen content in the water) coincided with an increase in geosmin from 17 May (28 ng/L) to 31 May (51 ng/L). When the oxygen content and feeding again were normalised, the geosmin concentrations dropped to 16 ng/L on 7 June (Figure 2A).
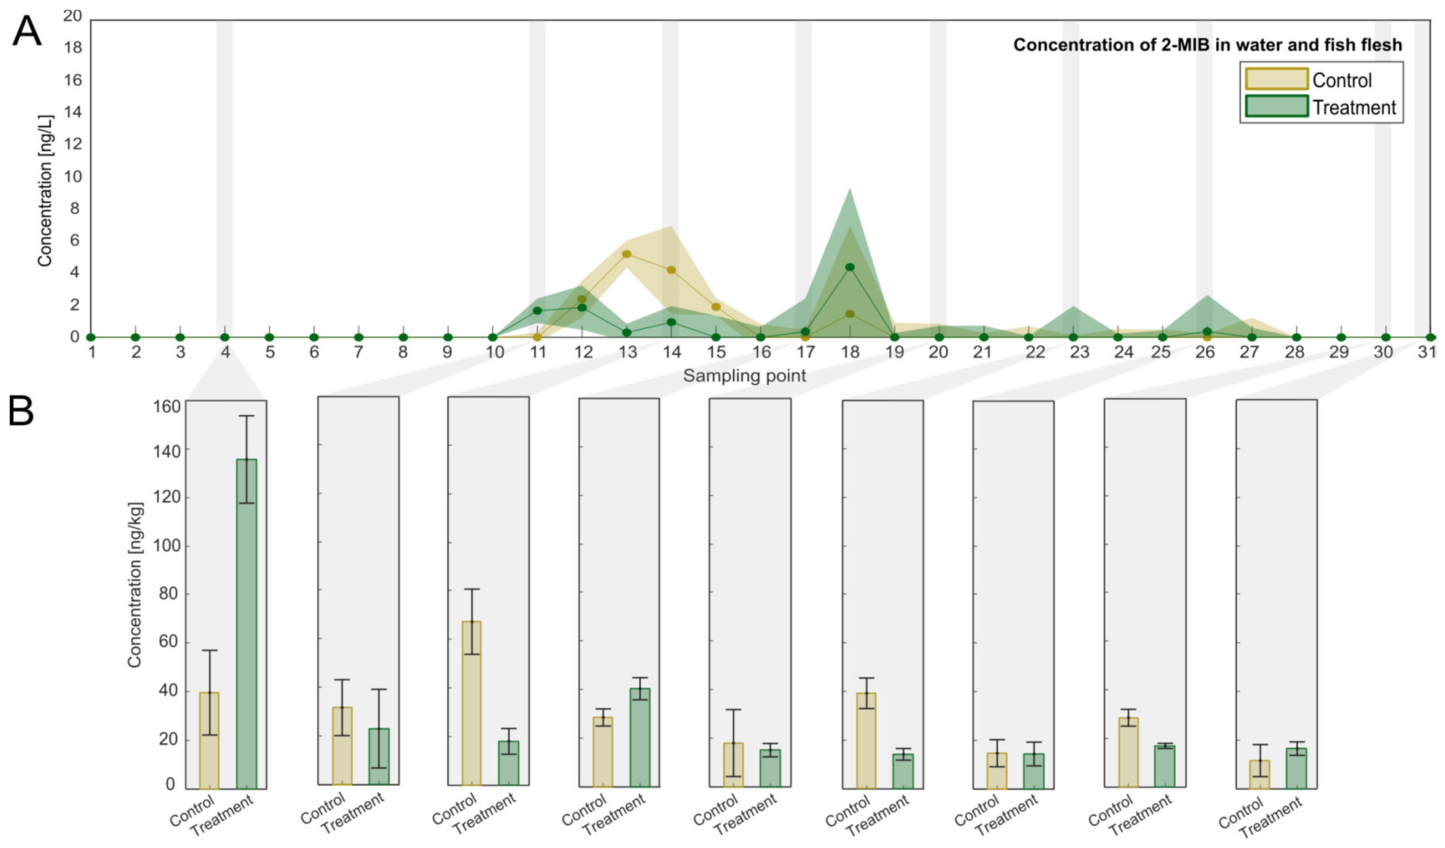
Concentrations of 2-MIB were significantly lower than concentrations of geosmin and were undetectable in most water samples (Figure 3A). In water from the T tank, 2-MIB was detected in only seven of the 31 sampling days, with concentrations ranging from 0.3 to 4.4 ng/L. In the C tank, 2-MIB was detectable at only five sampling times at concentrations of 0.5 to 5.2 ng/L. The highest concentrations in both tanks (4.4 and 5.2 ng/L) occurred two weeks after the UV shut-off as observed for geosmin.

3.2. Concentrations of Geosmin and 2-MIB in Fish

Geosmin concentrations in the fish varied significantly. The lowest and highest geosmin contents were measured in fish from the C tank, ranging from 112 ng/kg on 14 June to 3682 ng/kg on 15 April, with a mean content of 1213 ng/kg for all fish (Figure 2B). In fish from the T tank, geosmin ranged from 168 ng/kg on 27 July to 3133 ng/kg on 24 May, with a mean content of 832 ng/kg for all fish. Geosmin levels were higher in fish from the T tank than the C tank on 15 May, 19 July and 9 August, while similar or lower concentrations were observed on the remaining six sampling times.
The lower concentrations of 2-MIB than of geosmin in the water were reflected in the fish (Figure 3B). In all the analyzed fish, the 2-MIB content ranged from 11.6 ng/kg (fish from T tank on 19 September) to 136 ng/kg (fish from control tank on 12 April), with an average content of all fish of 31.9 ng/kg. Fish from the T tank had a higher 2-MIB content on 4 April (136 ng/kg vs. 40 ng/kg in fish from the C tank on this day), while similar or lower concentrations occurred in fish from the T tank on the remaining dates.
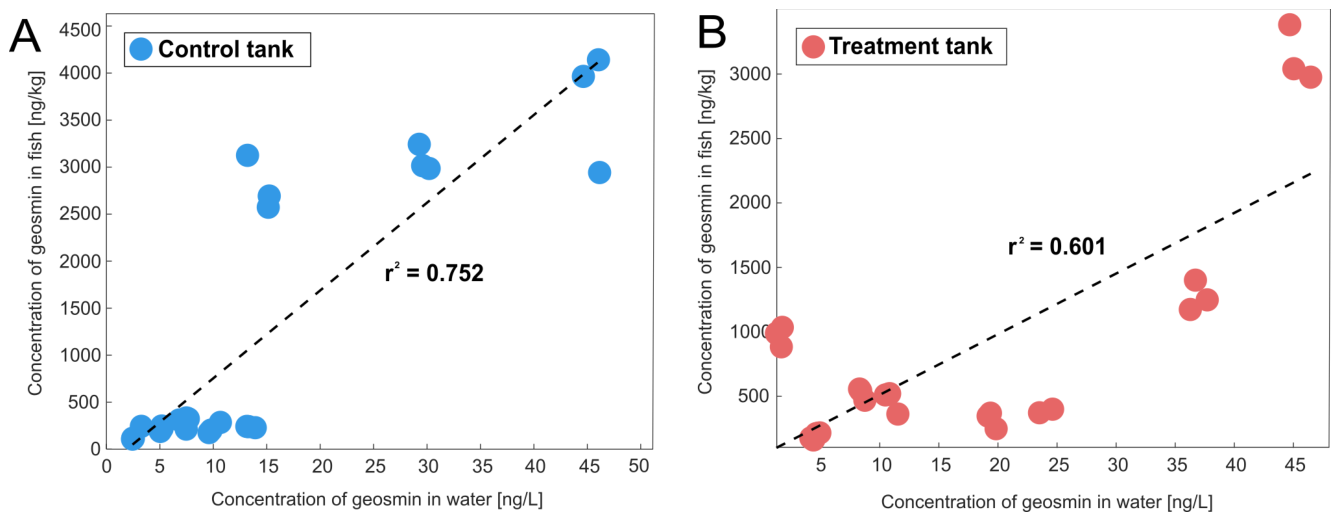
Geosmin in water and fish showed a positive covariation during the sampling period. Pearson correlations indicated correlation coefficients (r2) of 0.752 for the C tank (Figure 4A) and 0.601 for the T tank (Figure 4B). Due to the low or undetectable 2-MIB content in the water, no correlations for 2-MIB are presented.

4. Discussion

4.1. Effect of Microbial Management on Off-Flavours

The addition of the microbial management product RAS Right to the biofilter for 28 weeks was intended to reduce geosmin concentrations in the water, but no clear trends in geosmin levels were observed between the treated (T) and control (C) tanks. Although the average geosmin concentrations in the water of both RAS facilities were similar (21.5 vs. 20.7 ng/L) over the entire period, significant fluctuations occurred, as indicated by the geosmin peaks of 171 ng/L in the treated RAS and 83 ng/L in the control RAS (Figure 2).
In the company’s test of RAS Right, reduced geosmin concentrations were achieved after a four-month maturation period, during which geosmin decreased from >60 ng/L to under 5 ng/L in a RAS for cold-water salmon production in British Columbia, Canada (https://www.nova-q.ie). A similar effect was not observed in the current study. A key difference between the RAS production of salmon and tilapia is the higher water temperature in the tilapia RAS. For tilapia, a water temperature of approximately 28 °C appears to be optimal [18]. In a discussion with senior consultant Julian Beatty at Nova Q, we were informed that a more significant effect of the RAS Right product could have been achieved by adding another product, RAS Boost, at the same time, and that the company’s experience shows that off-flavours are less likely to occur when moving bed biofilters are used (as in the current tilapia RAS), rather than fixed bed biofilters (personal communication with J. Beatty, July 2025).
The absence of a clear impact on geosmin reduction in the tilapia RAS, compared to cold-water RAS for Atlantic salmon, may result from geosmin producers being more active or abundant at higher temperatures. It has been demonstrated that geosmin production increases with temperature in microbial species, such as cyanobacteria and Streptomyces, which are known to produce geosmin in aquaculture environments [19,20]. Unfortunately, the specific geosmin producers were not identified in the current tilapia RAS. Previously, relatively high geosmin concentrations of 50 to 200 ng/L were observed in the water of tropical tilapia farms in Brazil [21], but there is no scientific evidence supporting higher geosmin levels in warm-water RAS than in cold-water RAS. It is also noteworthy that tilapia and other warm-water species are seldom farmed in RAS facilities. Most RAS farms are located in colder climates, where energy-intensive heating will be required for warm-water species [22].
The periodically higher geosmin concentrations in the tilapia tank receiving the RAS Right product, compared to the control tank, may indicate that geosmin-removing processes were affected by the warm water temperature in the tilapia RAS, compared to the cold-water breeding of Atlantic salmon. Bacteria in the RAS Right product include, according to company information, species capable of nitrification, denitrification, off-flavour reduction, and organic matter degradation. Most of these processes are expected to be positively influenced by temperature, as demonstrated by temperature-stimulated nitrification in a RAS for shrimp production [23]. Microbial degradation of geosmin might have occurred in the tilapia RAS, although results from experimental studies of aquatic environments, e.g., sand filters or biofloc reactors enriched with geosmin and 2-MIB, show that the degradation rate is slow and not effective for a reduction of geosmin to levels considered acceptable in large-scale commercial RAS facilities [9,10,14]. Speculatively, the observed geosmin reduction in the salmon RAS after the RAS Right treatment might indicate that geosmin producers were outcompeted by other bacterial species, but further research is needed to confirm this. Since most geosmin production in RAS appears to originate from biofilter-attached bacteria [16], the target for inhibiting geosmin production should likely be the biofilters in RAS. However, the biological processes responsible for the observed decrease in geosmin after adding the RAS Right product to the Canadian salmon farm remain unclear. Likewise, it is uncertain how the type of biofilter (moving or fixed bed) in RAS might affect the geosmin levels.

4.2. Geosmin and 2-MIB in Water and Fish

Concentrations of geosmin in the water of the tilapia RAS (1.6–172 ng/L and 2.4–89.3 ng/L in the T and C tanks, respectively) were higher on most sampling days and more variable than geosmin concentrations measured previously in cold-water RAS for breeding rainbow trout in Finland and Denmark, where concentrations rarely exceeded 20 ng/L [24,25], and in RAS for Arctic charr in West Virginia, USA, where concentrations of 37 ± 17 ng/L were measured [26]. As in the tilapia RAS, 2-MIB concentrations were also lower than geosmin concentrations in these studies. No published data for geosmin or 2-MIB in water in commercial tilapia RAS are available. In outdoor facilities for tilapia cage production, high concentrations of geosmin and 2-MIB may occur, as documented by Lopes et al. [21], who detected 50–200 ng geosmin/L and 470–1180 ng 2-MIB/L in water with tilapia cages in tropical Brazil. Possibly, 2-MIB production may exceed geosmin production in light-exposed outdoor environments, such as lakes and rivers. This was observed in the Brisbane River, Australia, where the abundance of cyanobacteria correlated with 2-MIB concentrations, while the abundance of non-phototrophic bacteria (actinobacteria and myxobacteria) correlated with geosmin concentrations in the water [27]. In the present tilapia farm, the dim light inside the RAS facility may have favoured heterotrophic microorganisms, including geosmin producers, rather than phototrophic 2-MIB producers. However, more studies are needed to confirm this.
In the tilapia flesh, the geosmin content (ranging from 112 to 3682 ng/kg in the C tank and 168 to 3133 ng/kg in the T tank; Figure 2) was higher than the levels measured in tilapia grown in controlled RAS environments. For example, Schram et al. [28] detected 34–393 ng geosmin/kg flesh in tilapia at 1 to 11 ng geosmin/L in an experimental RAS. In natural waters, both lower levels (50 to 585 ng geosmin/kg in cage-produced tilapia in Brazil at geosmin below 10 ng/L [29]) and higher levels (660 to 2610 ng geosmin/kg for pond- and cage-produced tilapia in Thailand at geosmin of 920 to 24,560 ng/L [30]) have been recorded. For 2-MIB, the present content in tilapia flesh, ranging from 11.6 to 136 ng/kg, was significantly lower than the geosmin content in the flesh, reflecting lower concentrations in the water (Figure 3). In outdoor farms, the 2-MIB level may be comparable to the geosmin content, as observed in Brazilian cage-cultured tilapia, where 200 to 800 ng 2-MIB/kg was measured [29], and in Thai ponds and cages, where the fish had 2450 to 4550 ng 2-MIB/kg [30].
In the Swedish tilapia RAS, the amount of geosmin in the flesh positively correlated with geosmin in the water, supporting the hypothesis of an equilibrium between geosmin and 2-MIB in water and fish flesh, as proposed by Howgate [31]. For tilapia cultivated in cages in Brazilian reservoirs, a positive relationship between geosmin in water and flesh was also observed by Lukassen et al. [32] and for 2-MIB by Podduturi et al. [29].
In a study of odour-active components in tilapia from the current RAS facility, da Silva et al. [33] identified 115 aroma compounds in the fish flesh. After depuration in clean water for up to seven days prior to harvest, 78 of these compounds, including geosmin, were reduced to varying degrees. A sensory analysis confirmed earthy and moldy flavour notes in the flesh, likely indicating that both geosmin and 2-MIB might still be present after the depuration. The sensory threshold for detecting geosmin in the flesh was not determined by da Silva et al. [33], but for rainbow trout, a geosmin content of up to 250 ng/kg has been deemed acceptable for human consumption [25].

4.3. Effects of System Disturbances on the Off-Flavour Level

In the tilapia RAS, three deviations from the routine operation were observed during the sampling period: addition of NaCl to the water, UV interruption, and feed adjustment. The salting (to relieve osmotic stress [15]) appeared not to affect geosmin levels in the water. The temporary shut-off of the UV treatment might have influenced the geosmin concentration in the water, as the treatment is used to reduce the bacterial load. In an experimental RAS facility for tilapia in Canada, UV treatment of the water after biofilter treatment (dose of 60 mJ/cm2 at 254 nm) reduced the bacterial load (measured as colony-forming units on tryptic soy agar) by 99.64% [34]. If a similar reduction occurred in the present RAS, both native and added bacteria in the water would likely be affected, while bacteria attached to biofilter surfaces might remain unaffected. In the tilapia system treated with RAS Right bacteria, a change in geosmin (peak of 171 ng/L) was not observed until two weeks after the UV shut-off and coinciding with an increase in geosmin in the control tank, suggesting that other mechanisms caused the rise in geosmin.
The coincidence of low oxygen levels at the end of May in the T tank (which was corrected by adjusting the feeding rate) and the increase in geosmin to 52 ng/L suggest that oxygen availability or feeding interruptions affected either geosmin producers or the processes that remove geosmin, or both. In a survey of European RAS farms, geosmin was found to be negatively correlated with oxygen, but a possible biological reason for this relationship was not identified [35]. In contrast, a study of the geosmin-producing bacterium Streptomyces tendae showed that oxygen stimulated the geosmin production [36]. These mixed responses for geosmin levels emphasise that control and prediction of geosmin levels are complex and require further research to understand geosmin dynamics in RAS and other aquatic environments. Since disturbance of the biofilter in RAS, e.g., due to cleaning, has been shown to cause bursts of geosmin [16], research into geosmin dynamics in RAS should include biofilters and the physicochemical mechanisms that stimulate or reduce geosmin and other off-flavours in this RAS compartment.

5. Conclusions

Application of the microbial RAS Right product to the biofilter in the tilapia RAS did not reduce geosmin off-flavour in water or fish during the five-month trial. After fluctuations in the first two months, water in the treated RAS had a 2-fold higher geosmin concentration (16.6 ng/L) than in the control RAS (8.8 ng/L). In fish flesh, geosmin tended to covary with water concentration and reached up to 3683 ng/kg; the highest levels were measured in the treated RAS in three of eight samplings. The off-flavour compound 2-MIB was undetectable in most water samples but was present in all fish, reaching 136 ng/kg in the treated RAS.
Our results indicate that the RAS Right product is ineffective at controlling geosmin in tilapia production, as previously observed in RAS for cold-water production of Atlantic salmon. In our study, the RAS Right product was applied as recommended by the manufacturer, but it cannot be ruled out that optimising the treatment with respect to dose or addition frequency could improve its efficacy.
Microbial management, such as the application of RAS Right, may be a viable approach to controlling off-flavour in RAS, either by controlling the growth and activity of microorganisms that produce these compounds or by degrading the compounds. Although some microorganisms have shown the ability to degrade geosmin in RAS environments [11,12,13,14], more research is needed to elucidate the processes governing both production and degradation.

Supplementary Materials

The following supporting information can be downloaded at: https://www.mdpi.com/article/10.3390/aquacj6020020/s1, Figure S1: Concentrations of geosmin in the water of the control tank (C) and the treated tank (T). Pearson correlation shown.

Author Contributions

Conceptualization, P.M.N., M.A.P. and N.O.G.J.; methodology, P.M.N. and R.P.; software, P.M.N.; validation, P.M.N. and M.A.P.; formal analysis, P.M.N.; investigation, P.M.N. Data curation, P.M.N., R.P. and M.A.P.; writing—original draft, P.M.N.; writing—review and editing, P.M.N., R.P. and N.O.G.J.; supervision, M.A.P.; funding acquisition, M.A.P. and N.O.G.J. All authors have read and agreed to the published version of the manuscript.

Funding

This research was funded by the European Union’s Horizon 2020 Framework Program for Research and Innovation under the Marie Sklodowska-Curie Training Network, RASOPTA Grant Agreement No. 956481.

Institutional Review Board Statement

Since no experimental work was done, only analysis of fish produced for commercial markets, no certificate or similar documentation can or should be issued. Thus, the conclusion was that no approval is needed or can be issued, since no experiments on animals were conducted.

Informed Consent Statement

Not applicable.

Data Availability Statement

The data presented in this study are available on request from the corresponding author.

Acknowledgments

We appreciate assistance during sampling of water and fish and advice on application of RAS Right by RAS managers at Gårdsfisk, Cyril Barbier and Pauline Le Berre. We also wish to thank Ph.D. Julia Södergren for valuable discussions on geosmin dynamics in RAS.

Conflicts of Interest

The authors declare no conflicts of interest.

References

  1. Badiola, M.; Mendiola, D.; Bostock, J. Recirculating Aquaculture Systems (RAS) analysis: Main issues on management and future challenges. Aquac. Eng. 2012, 51, 26–35. [Google Scholar] [CrossRef]
  2. Gupta, S.; Makridis, P.; Henry, I.; Velle-George, M.; Ribicic, D.; Bhatnagar, A.; Skalska-Tuomi, K.; Daneshvar, E.; Ciani, E.; Persson, D.; et al. Recent Developments in Recirculating Aquaculture Systems: A Review. Aquac. Res. 2024, 2024, 6096671. [Google Scholar] [CrossRef]
  3. Jones, B.; Rocker, M.M.; Keast, R.S.J.; Callahan, D.L.; Redmond, H.J.; Smullen, R.P.; Francis, D.S. Systematic review of the odorous volatile compounds that contribute to flavour profiles of aquatic animals. Rev. Aquac. 2022, 14, 1418–1477. [Google Scholar] [CrossRef]
  4. Moretto, J.A.; Freitas, P.N.N.; Souza, J.P.; Oliveira, T.M.; Brites, I.; Pinto, E. Off-Flavors in Aquacultured Fish: Origins and Implications for Consumers. Fishes 2022, 7, 34. [Google Scholar] [CrossRef]
  5. Abd El-Hack, M.E.; El-Saadony, M.T.; Elbestawy, A.R.; Ellakany, H.G.; Abaza, S.S.; Geneedy, A.M.; Salem, H.M.; Taha, A.E.; Swelum, A.A.; Omer, F.A.; et al. Undesirable odour substances (geosmin and 2-methylisoborneol) in water environment: Sources, impacts and removal strategies. Mar. Pollut. Bull. 2022, 178, 113579. [Google Scholar] [CrossRef]
  6. Azaria, S.; van Rijn, J. Off-flavor compounds in recirculating aquaculture systems (RAS): Production and removal processes. Aquac. Eng. 2018, 83, 57–64. [Google Scholar] [CrossRef]
  7. Lindholm-Lehto, P.C.; Vielma, J.; Pakkanen, H.; Alen, R. Depuration of geosmin- and 2-methylisoborneol-induced off-flavors in recirculating aquaculture system (RAS) farmed European whitefish Coregonus lavaretus. J. Food Sci. Technol. 2019, 56, 4585–4594. [Google Scholar] [CrossRef] [PubMed]
  8. Stromberg, M.; Sibanda, E.; Hossen, A.; Stubblefield, J.; Ghosh, U.; Zohar, Y. Assessing enhanced geosmin depuration in Atlantic salmon (Salmo salar) using TiO2/UV + H2O2 advanced oxidation under variable recirculating aquaculture system conditions. Aquac. Eng. 2026, 113, 102694. [Google Scholar] [CrossRef]
  9. Ho, L.; Hoefel, D.; Bock, F.; Saint, C.P.; Newcombe, G. Biodegradation rates of 2-methylisoborneol (MIB) and geosmin through sand filters and in bioreactors. Chemosphere 2007, 66, 2210–2218. [Google Scholar] [CrossRef]
  10. Hoefel, D.; Ho, L.; Aunkofer, W.; Monis, P.T.; Keegan, A.; Newcombe, G.; Saint, C.P. Cooperative biodegradation of geosmin by a consortium comprising three gram-negative bacteria isolated from the biofilm of a sand filter column. Lett. Appl. Microbiol. 2006, 43, 417–423. [Google Scholar] [CrossRef] [PubMed]
  11. Guttman, L.; van Rijn, J. 2-Methylisoborneol and geosmin uptake by organic sludge derived from a recirculating aquaculture system. Water Res. 2009, 43, 474–480. [Google Scholar] [CrossRef]
  12. Guttman, L.; van Rijn, J. Isolation of bacteria capable of growth with 2-methylisoborneol and geosmin as the sole carbon and energy sources. Appl. Environ. Microbiol. 2012, 78, 363–370. [Google Scholar] [CrossRef]
  13. Lauderdale, C.V.; Aldrich, H.C.; Lindner, A.S. Isolation and characterization of a bacterium capable of removing taste- and odor-causing 2-methylisoborneol from water. Water Res. 2004, 38, 4135–4142. [Google Scholar] [CrossRef] [PubMed]
  14. Luo, G.; Wang, J.; Ma, N.; Liu, Z.; Tan, H. Effects of inoculated Bacillus subtilis on geosmin and 2-methylisoborneol removal in suspended growth reactors using aquacultural waste for biofloc production. J. Microbiol. Biotechnol. 2016, 26, 1420–1427. [Google Scholar] [CrossRef] [PubMed]
  15. Tavares-Dias, M. Toxicity, physiological, histopathological, handling, growth and antiparasitic effects of the sodium chloride (salt) in the freshwater fish aquaculture. Aquac. Res. 2022, 53, 715–734. [Google Scholar] [CrossRef]
  16. Podduturi, R.; Petersen, M.A.; Vestergaard, M.; Jørgensen, N.O.G. Geosmin fluctuations and potential hotspots for elevated levels in recirculated aquaculture system (RAS): A case study from pikeperch (Stizostedion lucioperca) production in Denmark. Aquaculture 2020, 514, 734501. [Google Scholar] [CrossRef]
  17. Podduturi, R.; Petersen, M.A.; Mahmud, S.; Rahman, M.M.; Jørgensen, N.O.G. Potential Contribution of Fish Feed and Phytoplankton to the Content of Volatile Terpenes in Cultured Pangasius (Pangasianodon hypophthalmus) and Tilapia (Oreochromis niloticus). J. Agric. Food Chem. 2017, 65, 3730–3736. [Google Scholar] [CrossRef] [PubMed]
  18. Nivelle, R.; Gennotte, V.; Kalala, E.J.K.; Ngoc, N.B.; Muller, M.; Mélard, C.; Rougeot, C. Temperature preference of Nile tilapia (Oreochromis niloticus) juveniles induces spontaneous sex reversal. PLoS ONE 2019, 14, e0212504. [Google Scholar] [CrossRef]
  19. Zhang, T.; Li, L.; Song, L.; Chen, W. Effects of temperature and light on the growth and geosmin production of Lyngbya kuetzingii (Cyanophyta). J. Appl. Phycol. 2009, 21, 279–285. [Google Scholar] [CrossRef]
  20. Schrader, K.K.; Harries, M.D.; Page, P.N. Temperature effects on biomass, geosmin, and 2-methylisoborneol production and cellular activity by Nocardia spp. and Streptomyces spp. isolated from rainbow trout recirculating aquaculture systems. J. Ind. Microbiol. Biotechnol. 2015, 42, 759–767. [Google Scholar] [CrossRef] [PubMed]
  21. Lopes, T.O.M.; Pinto, E.; Passos, L.S.; Dorr, F.; Vasconcelos, C.M.; Arpini, C.; Silva, M.O.; Pereira, T.M.; Coppo, G.C.; Merçon, J.; et al. Off-flavor detection in tilapia reared in cages in tropical lakes. Aquaculture 2022, 555, 738215. [Google Scholar] [CrossRef]
  22. Zhang, R.; Chen, T.; Wang, Y.; Short, M. An optimisation approach for the design and operation of recirculating aquaculture systems integrated with sustainable hybrid energy systems. J. Clean. Prod. 2024, 477, 143860. [Google Scholar] [CrossRef]
  23. Kir, M. Nitrification Performance of a Submerged Biofilter in a Laboratory Scale Size of the Recirculating Shrimp System. Turk. J. Fish. Aquat. Sci. 2009, 9, 209–214. [Google Scholar] [CrossRef]
  24. Lindholm-Lehto, P.C.; Kiuru, T.; Hannelin, P. Control of off-flavor compounds in a full-scale recirculating aquaculture system rearing rainbow trout Oncorhynchus mykiss. J. Appl. Aquac. 2022, 34, 469–488. [Google Scholar] [CrossRef]
  25. Petersen, M.A.; Hyldig, G.; Strobel, B.W.; Henriksen, N.H.; Jørgensen, N.O.G. Chemical and Sensory Quantification of Geosmin and 2-Methylisoborneol in Rainbow Trout (Oncorhynchus mykiss) from Recirculated Aquacultures in Relation to Concentrations in Basin Water. J. Agric. Food Chem. 2011, 59, 12561–12568. [Google Scholar] [CrossRef]
  26. Houle, S.; Schrader, K.K.; Le François, N.R.; Comeau, Y.; Kharoune, M.; Summerfelt, S.T.; Savoie, A.; Vandenberg, G.W. Geosmin causes off-flavour in arctic charr in recirculating aquaculture systems: Geosmin is the dominant off-flavour compound in RAS. Aquac. Res. 2011, 42, 360–365. [Google Scholar] [CrossRef]
  27. Franklin, H.M.; Podduturi, R.; Jørgensen, N.O.G.; Roberts, D.T.; Schlüter, L.; Burford, M.A. Potential sources and producers of 2-methylisoborneol and geosmin in a river supplying a drinking water treatment plant. Chem. Eng. J. Adv. 2023, 14, 100455. [Google Scholar] [CrossRef]
  28. Schram, E.; Kwadijk, C.; Hofman, A.; Blanco, A.; Murk, A.; Verreth, J.; Schrama, J. Effect of feeding during off-flavour depuration on geosmin excretion by Nile tilapia (Oreochromis niloticus). Aquaculture 2021, 531, 735883. [Google Scholar] [CrossRef]
  29. Podduturi, R.; David, G.D.; da Silva, R.J.; Hyldig, G.; Jørgensen, N.O.G.; Petersen, M.A. Characterization and finding the origin of off-flavor compounds in Nile tilapia cultured in net cages in hydroelectric reservoirs, Sao Paulo State, Brazil. Food Res. Int. 2023, 173, 113375. [Google Scholar] [CrossRef] [PubMed]
  30. Whangchai, N.; Wigraiboon, S.; Shimizu, K.; Iwami, N.; Itayama, T. Off-flavor in Tilapia (Oreochromis niloticus) Reared in Cages and Earthen Ponds in Northern Thailand. Thai J. Agric. Sci. 2011, 44, 270–276. [Google Scholar]
  31. Howgate, P. Tainting of farmed fish by geosmin and 2-methyl-iso-borneol: A review of sensory aspects and of uptake/depuration. Aquaculture 2004, 234, 155–181. [Google Scholar] [CrossRef]
  32. Lukassen, M.B.; De Jonge, N.; Bjerregaard, S.M.; Podduturi, R.; Jørgensen, N.O.G.; Petersen, M.A.; David, G.S.; Da Silva, R.J.; Nielsen, J.L. Microbial Production of the Off-Flavor Geosmin in Tilapia Production in Brazilian Water Reservoirs: Importance of Bacteria in the Intestine and Other Fish-Associated Environments. Front. Microbiol. 2019, 10, 2447. [Google Scholar] [CrossRef] [PubMed]
  33. da Silva, M.R.; Loos, H.M.; Buettner, A. Identification of odor-active compounds in Nile tilapia (Oreochromis niloticus) from recirculated aquaculture systems: A case study with different depuration procedures. Food Res. Int. 2024, 192, 114755. [Google Scholar] [CrossRef] [PubMed]
  34. Huyben, D.; Bevan, D.; Stevenson, R.; Zhou, H.; Moccia, R. Evaluation of membrane filtration and UV irradiation to control bacterial loads in recirculation aquaculture systems. Aquac. Int. 2018, 26, 1531–1540. [Google Scholar] [CrossRef]
  35. Dionigi, C.P.; Ingram, D.A. Effects of temperature and oxygen concentration on geosmin production by Streptomyces tendae and Penicillium expansum. J. Agric. Food Chem. 1994, 42, 143–145. [Google Scholar] [CrossRef]
  36. Lukassen, M.B.; Menanteau-Ledouble, S.; de Jonge, N.; Schram, E.; Nielsen, J.L. Impact of water quality parameters on geosmin levels and geosmin producers in European recirculating aquaculture systems. J. Appl. Microbiol. 2022, 132, 2475–2487. [Google Scholar] [CrossRef] [PubMed]
Figure 1. Sampling strategy. Sampling points for both fish and water are displayed as green and blue circles, respectively. The addition of the probiotic cocktail is represented with brown circles. Unforeseen incidents during the trial period on 15 and 26 April and 30 May are shown.
Aquacj 06 00020 g001
Figure 2. Geosmin concentrations in water (A) and fish flesh (B) in the control and treated tanks. C tank data is shown in blue colour and T tank data shown in red color. Means ± 1 standard deviation are displayed per sampling point for both water and fish.
Aquacj 06 00020 g002
Figure 3. 2-MIB concentrations in the water (A) and fish (B) in the control and treated tanks. C tank data is shown in yellow colour and T tank data shown in green color. Means ± 1 standard deviation are displayed per sampling point for both water and fish. In (A) the coloured areas show standard deviations measured for 2-MIB in the tanks.
Aquacj 06 00020 g003
Figure 4. The dashed lines show the linear correlation relationship between geosmin concentrations in water and fish in the C tank (A) and the T tank (B). The linear correlation values (r2; Pearson correlations) of 0.75 in C and 0.60 in T, indicate a positive, rather strong correlation between the concentrations of geosmin in water and fish.
Aquacj 06 00020 g004
Table 1. Regression lines and method sensitivity values (limit of detection, LOD) obtained for the quantification of geosmin and 2-MIB in the water and fish samples. N refers to the number of regression lines.
Water
Geosmin2-MIB
NLinear regressionR2LODLinear regressionR2LOD
1y = 1096.8x + 3149.20.9994≈1 ng/Ly = 898.13x + 5068.70.9890≈4 ng/L
2y = 623.65x − 504.580.9998y = 613.05x + 470.180.9849
3y = 607.45x + 349.170.9999y = 547.44x + 1810.60.9976
4y = 288.65x − 105.310.9998y = 287.67x + 2565.60.9796
Fish
Geosmin2-MIB
NLinear regressionR2LODLinear regressionR2LOD
1y = 6.4679x + 2161.20.9262≈10 ng/kgy = 53.983x + 5901.10.9773≈40 ng/kg
2y = 15.786x − 2670.50.9803y = 85.704x − 7403.50.9876
3y = 7.8688x + 738.740.9730y = 49.318x − 24910.9818
4y = 19.368x + 429.620.8556y = 75.329x + 1456.50.9836
Disclaimer/Publisher’s Note: The statements, opinions and data contained in all publications are solely those of the individual author(s) and contributor(s) and not of MDPI and/or the editor(s). MDPI and/or the editor(s) disclaim responsibility for any injury to people or property resulting from any ideas, methods, instructions or products referred to in the content.