1. Introduction
Aquaculture is “the farming of aquatic organisms including fish, molluscs, crustaceans and aquatic plants” [
1]. Water quality refers to the chemical, physical, biological and radiological characteristics of water [
2]. Water is a critical factor in the life of all aquatic species. Maintaining water quality plays a substantial role in maximizing fishery productivity [
3]. It is essential that different water quality parameters are monitored and kept within their optimum range in order to sustain the growth and survival of fish [
4]. In aquaculture, any characteristic of water that affects the survival, reproduction, growth, or management of fish or other aquatic creatures in any way is considered a water quality variable [
5]. In all aquaculture systems fish perform physiological activities such as breathing, excretion, feeding, maintaining salt balance, and reproduction within the water medium. Accordingly, the overall performance of any aquaculture system is partly determined by its water quality [
6].
Globally, aquaculture has been in existence for millennia; however, it has only recently begun to significantly contribute to the global food supply and rural livelihoods [
7]. Whereas aquaculture provided just 7% of fish for human consumption in 1974, this share increased to 26% in 1994 and 39% in 2004 [
8]. By 2014, global seafood production had increased to 167 million tones, almost entirely due to the growth of aquaculture, increasing at a rate of 7.7% per annum from 1985–2013 [
8]. Total global aquaculture production increased by 4.5 percent from 105.46 million tons (live weight equivalent) in 2015 to a new high of 110.21 million tons in 2016, with total production valued at USD 243.26 billion [
3].
Though there has been a tremendous increase in aquaculture production, poor water quality has been reported to adversely affect global aquaculture production, mainly by affecting fish growth, production, quality, and profitability [
9]. Aquaculture production has been reduced by contaminated waters that impair development, growth, and reproduction or even cause mortality to the cultured fish species [
10]. As a result, global fish farmers have been obliged to manage water quality so as to provide a relatively stress-free environment that meets the physical, chemical, and biological standards for normal fish health and growth [
11].
In Africa, aquaculture production stands at around 1.74 million tons, less than 2% of global production. This is mostly produced in Egypt (c. 1.1 million tons), with other major producers being Nigeria (313,000 tons) and Uganda (111,000 tons). Almost half (43.6%) of African production consists of Nile tilapia [
12]. Other freshwater fish species such as African catfish (11.9%) and common carp (10.5%) are important aquaculture products. Much of tilapia and catfish production is semi-intensive, thus requiring additional feeding. There is considerable impetus to develop aquaculture in Sub-Saharan Africa [
13]. Lack of information on the basic requirements of an effective aquaculture system on the part of small-scale fish farmers has handicapped the orderly and rapid development of the aquaculture industry in developing countries, as well as its yields [
14].
While the Sub-Saharan Africa region has numerous favorable attributes, such as underutilized land and water resources, cheap labor, high demand for fish, and a favorable climate all year round, aquaculture production is not at its maximum [
15]. Optimal production of fish in aquaculture systems has frequently been curtailed by several factors, among them limited information on aquaculture set-up and poor information on pond water quality requirements for optimal fish production [
16].
In Uganda, aquaculture is considered one of the most important sources of animal protein production for meeting the increasing nutritional demand for protein. Uganda produces up to 15,000 tons of fish from aquaculture, including production from small-scale fish farmers, emerging commercial fish farmers, and stocked community water reservoirs and minor lakes [
17]. There are an estimated 20,000 ponds throughout the country, with an average surface area of 500 m
2 per fishpond.
According to the Department of Fisheries [
4], there are two key species cultured in Uganda, North African catfish and Nile tilapia, which contribute over 90 percent of the total aquaculture production in the country. Because of the shortage of water resources, different sources of water including springs, rain water, drainage, and tapped water are used in fish farming. These water sources have different physical, chemical, and biological characteristics, which can have an effect on the quality of both water and cultured fish [
4]. Given that the life and growth of fish in aquaculture systems depend on water quality and feed consumption, successful management of fish ponds therefore requires an understanding of water quality, which is determined by abiotic factors such as temperature, Dissolved Oxygen (DO), transparency, turbidity, water color, Carbon dioxide, pH, alkalinity, hardness, unionized Ammonia, nitrite, nitrate, primary productivity, and plankton population, among others [
5].
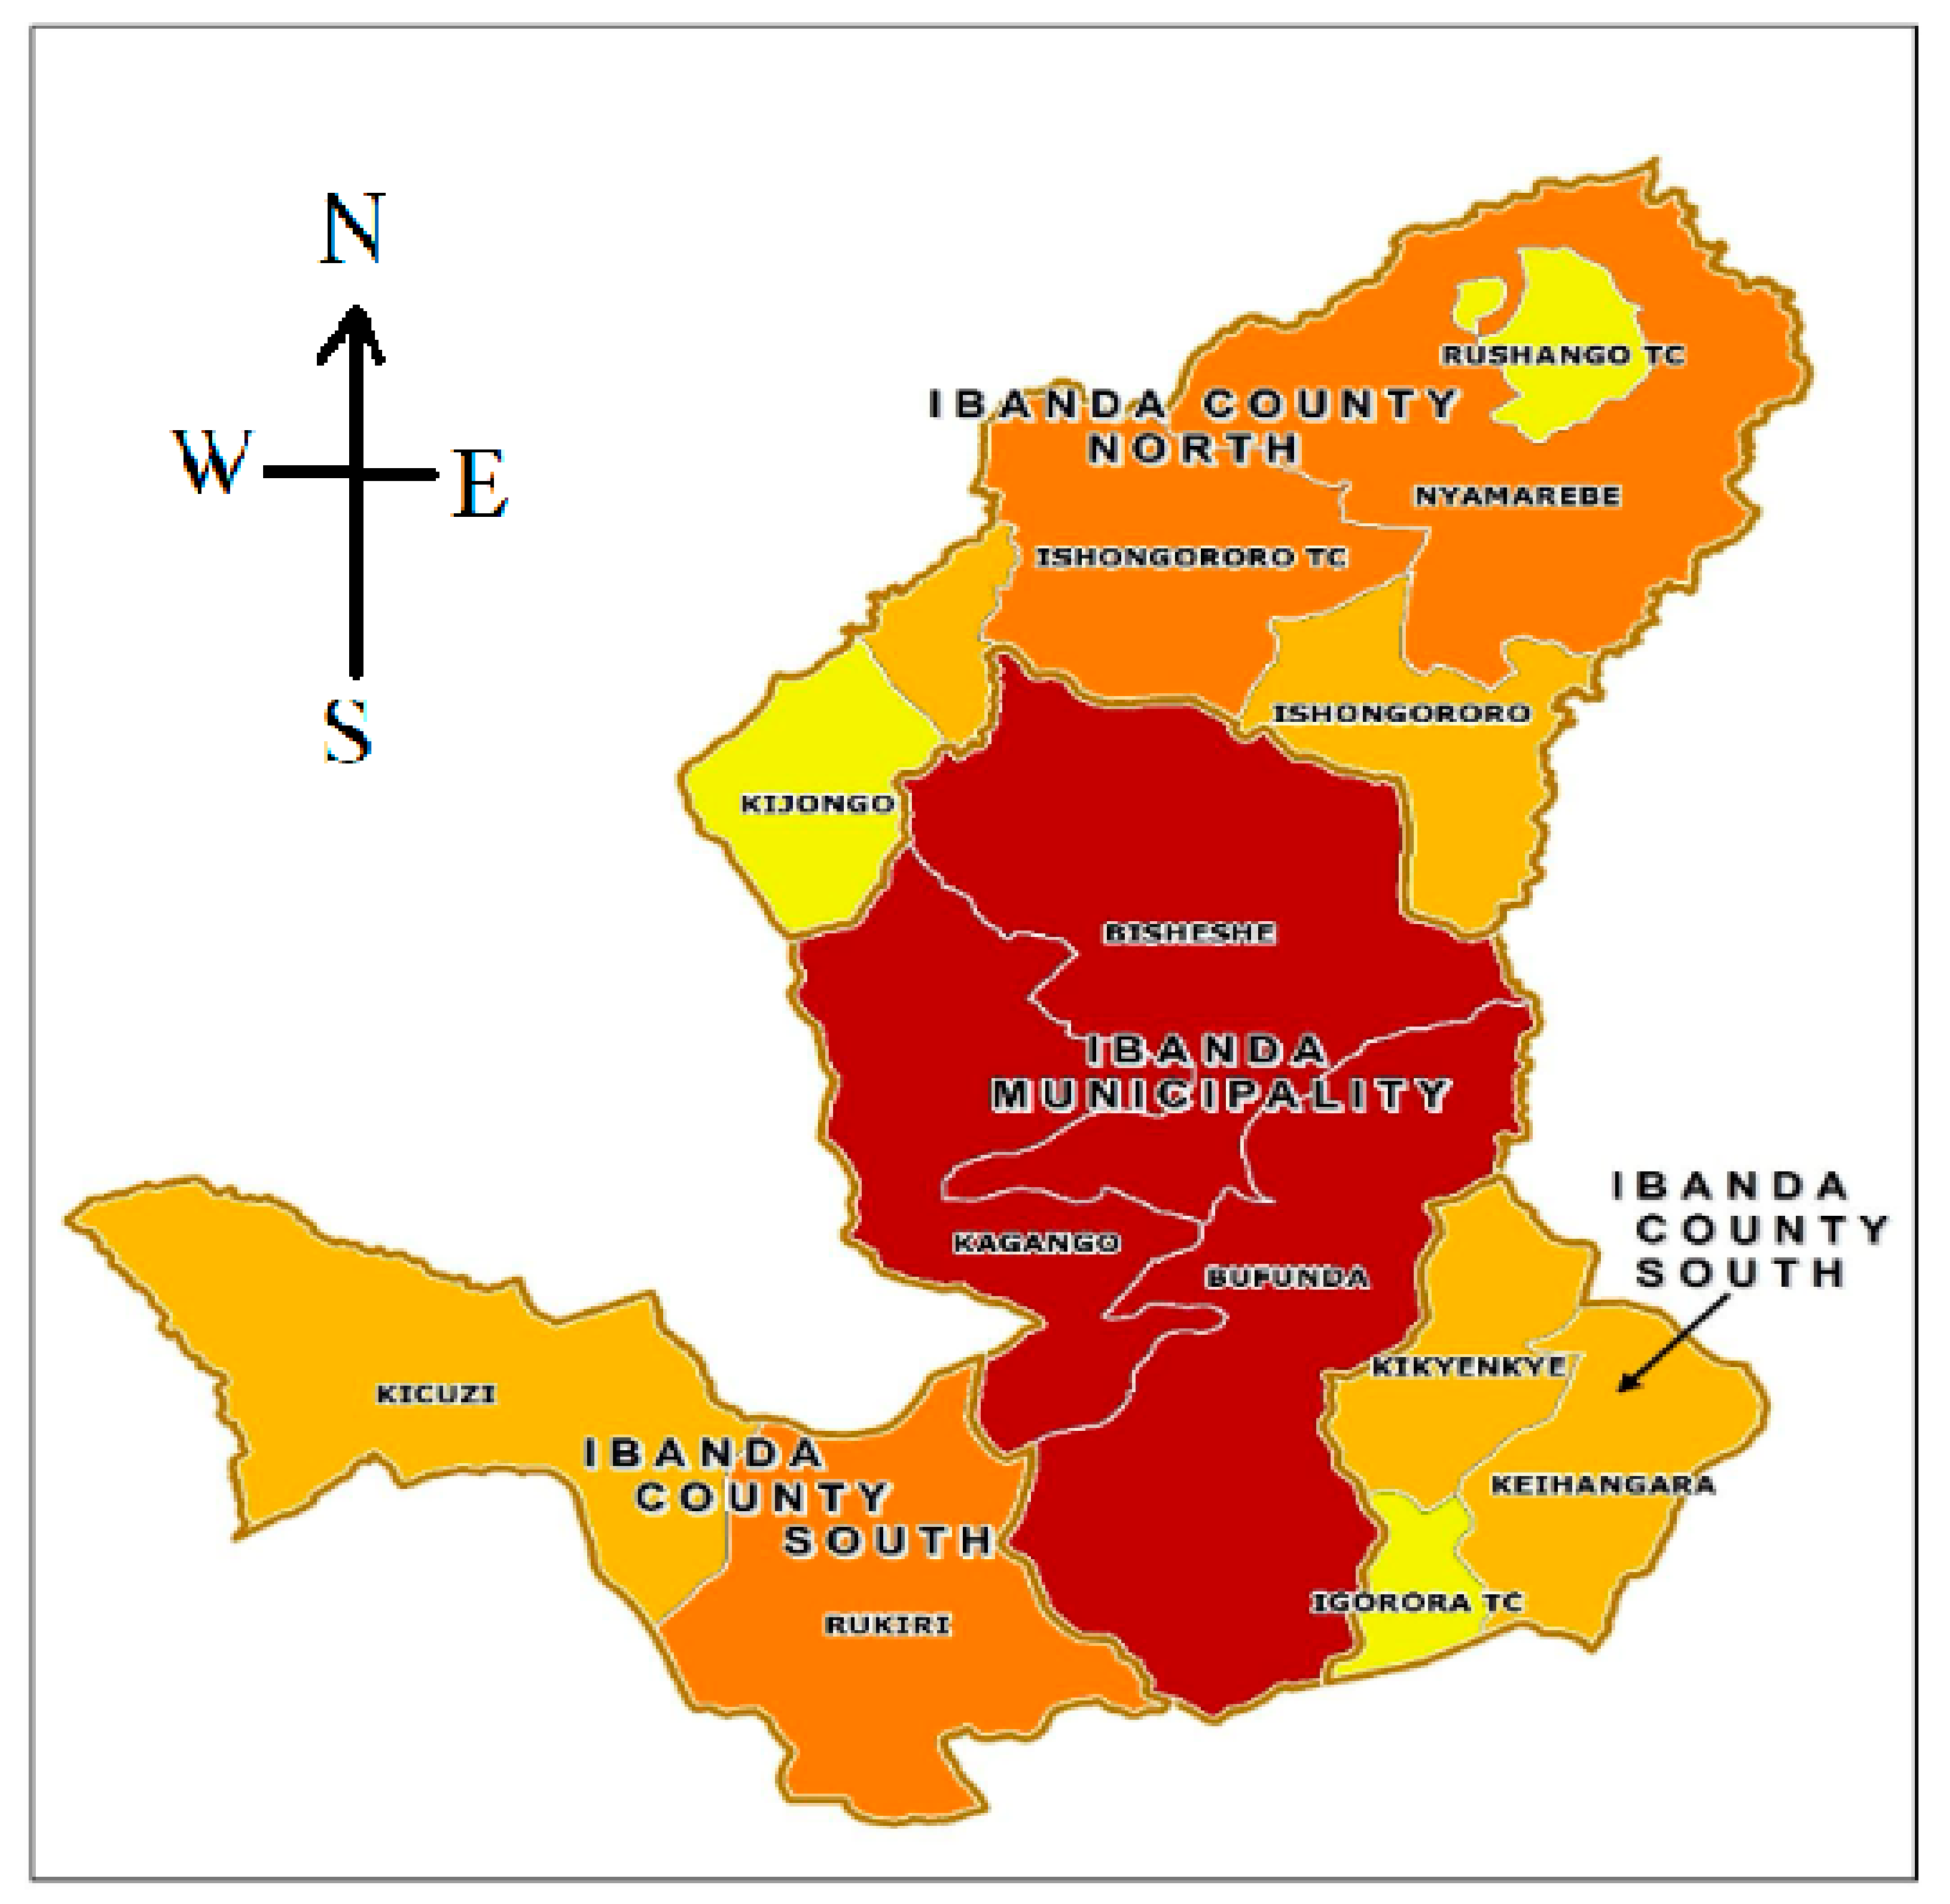
Ibanda District is endowed with numerous permanent streams and swamps and experiences a favorable climate, which gives it a high potential for aquaculture development. Currently there are about 36 fish farms in Ibanda District, with an estimated 86 total fish ponds [
4]. However, the small size of farmed fish produced in Ibanda District has been a major challenge for aquaculture development in the area, demoralizing fish farmers and other potential commercial entrepreneurs [
11]. The government of Uganda, through agencies such as Operation Wealth Creation (OWC) and National Agricultural Advisory Services (NAADs), has made an effort to support fish farming by providing fish fingerlings. However, fish farmers continue to report slow growth and small size of stocked fish [
4].
Studies carried out in other parts of Uganda have linked fish stuntedness and slow growth to changes in the biophysical and chemical properties of water, including temperature, dissolved oxygen, transparency, and turbidity [
18]. However, there is limited information on the cause of slow growth and small size of fish stocked under National Agricultural Advisory Services (NAADS), as no study has been performed to assess the phenomenon in the specific context of Ibanda District.
Given the dearth in supporting literature, it remains unknown whether there is a significant difference in the status of water quality parameters (temperature, turbidity, pH, alkalinity, Ammonia content, hardness, Carbon dioxide and Iron levels) from optimal ranges in fish ponds across Ibanda District. Likewise, it remains unknown whether the status of water quality parameters (temperature, turbidity, pH, alkalinity, Ammonia content, hardness, Carbon dioxide and Iron levels) has a significant effect on aquaculture productivity (fish weight and size) in Ibanda District.
It is against this background that this study set out to examine the status and effect of water quality parameters (temperature, turbidity, pH, alkalinity, Ammonia content, hardness, Carbon dioxide and Iron levels) on aquaculture productivity in 25 selected aquaculture systems in Ibanda District. Aquaculture productivity was assessed in terms of fish size.
3. Results
This section categorizes results in different sub-sections: demographic characteristics of fish farmers, pond characteristics, type of fish, status of water quality parameters, and effect of water quality parameters on fish productivity.
3.1. Demographic Characteristics of Pond Owners
The results in
Table 2 below presents the respondents’ general characteristics such as; gender, age and educational level.
A total of 25 pond owners responded to the questionnaires indicating their gender. The majority (88%) were male and 12% female. The mean age of the respondents was 45 years, with a minimum of 25 and maximum of 70 years. The average schooling in years was ten, with a minimum of five and a maximum of thirteen.
3.2. Pond Characteristics
As shown in
Table 3, the majority (88%) of the respondents had earthen ponds, while 8% had tank ponds and 4% had another type of pond. The average number of ponds owned was two, with a minimum of one pond and a maximum of six. On average, ponds measured 450.2 m
2, with the smallest pond measuring 80 m
2 and the largest 1200 m
2. Average pond depth was 1.756 m, with the shallowest pond measuring 0.914 m and the deepest 2.13 m.
3.3. Type of Fish Cultured
As shown in
Table 4, 60% of the respondents cultured Catfish and 40% cultured Tilapia. The average weight of fish at stocking was 5 g for catfish and 3 g for tilapia. The average weight at harvest after growing for six months was 397.740 g for catfish and 136.550 g for tilapia.
3.4. Status of Water Quality Parameters
The results of the analysis of the mean physical–chemical parameters across the 25 fish ponds are presented in
Table 5. Average turbidity (Secchi disc depth in cm) across all ponds was (52.652 ± 19.4436), alkalinity in mg/L (81.64 ± 32.569), hardness in mg/L (66.40 ± 19.765), Iron in mg/L (0.21516 ± 0.109258), Carbon dioxide in mg/L (5.5116 ± 2.39041), NH
3 in mg/L (0.7916 ± 0.55085), temperature in °C (22.96 ± 4.809), and water pH (6.148 ± 0.7304).
3.5. Effect of the Status of Water Quality Parameters on Fish Productivity
The results in
Table 6 present a correlation matrix between water quality parameters and fish productivity.
The results presented in
Table 6 show that turbidity had a moderate positive significant correlation with catfish weight (r = 0.579 **
p = 0.028) and tilapia size (r = 0.553 *
p = 0.036). A change in turbidity led to a change in catfish weight and tilapia size.
Total alkalinity presented a moderate positive correlation with tilapia size (r = 0.524 * p = 0.040) and weight (r = 0.515 ** p = 0.046). A change in alkalinity was found to affect tilapia size and weight but had no effect on catfish size and weight.
Water hardness presented a moderate positive significant correlation with tilapia size (r = 0.449 * p = 0.046) and presented no correlation with the weight of tilapia or size and weight of catfish.
Iron (Fe) had a negative imperfect significant correlation with catfish weight (r = −0.389 p = 0.049). A unit change in Iron (Fe) negatively reduced catfish weight. Iron had no correlation with catfish size or tilapia weight and size.
Carbon dioxide presented a negative moderate significant relationship with catfish size (r = −0.393 p = 0.047) and tilapia weight (r = −0.487 p = 0.041). A unit change in Carbon dioxide in the water negatively affected catfish size and tilapia weight. Carbon dioxide had no correlation with catfish weight or tilapia size.
NH3 level had a negative correlation with catfish weight (r = −0.449 * p = 0.047) and size (r = −0.493 * p = 0.031). A change in NH3 levels was found to negatively affect catfish weight and size.
Temperature had a positive moderate correlation with catfish weight (r = 0.428 * p = 0.056). A unit increment in temperature increased catfish weight but had no effect on size (total length).
Water pH had a positive strong correlation with tilapia weight (r = 0.637 * p = 0.024). A change in water PH caused a change in tilapia weight but had no effect on tilapia size.
3.5.1. Effect of Water Quality Parameters on Weight
The F values of 4.781 and 3.247 for tilapia and catfish, respectively, were significant at 5% for both models, indicating that there was a significant linear relationship between weight and all the independent variables (water quality parameters) for tilapia and catfish in the study ponds. Variables such as Iron, Carbon dioxide, Ammonia, temperature, and water pH were significant at various levels. The estimated coefficients for Iron, Carbon dioxide, temperature, and water pH were negative, showing a negative effect on the weight of both tilapia and catfish. The study revealed that a unit change in the levels of any of these parameters in a pond led to a negative change in the dependent variables.
Iron levels and Carbon dioxide levels had a negative and a significant effect on catfish weight at a 5% level of significance, indicating that an increase in water Iron in a pond reduced catfish weight at harvest by 285 g.
Similarly, Carbon dioxide levels and Ammonia levels had a negative but significant effect on the weight of both tilapia and catfish at a 5% significance level. The model predicted that a unit increase in Carbon dioxide in mg/L decreased fish weight at harvest by 4.4 g and 7.7 g for tilapia and catfish, respectively. A unit increase in Ammonia levels (in mg/L) reduced catfish weight at harvest by 91 g.
Temperature and water pH had a positive effect on catfish weight at harvest at a 5% level of significance. A unit increase in water temperature increased catfish weight by 16.5 g at harvest. Likewise, a unit increase in water pH was found to increase tilapia weight at harvest by 34.6 g.
3.5.2. Effect of Water Quality Parameters on Size
The regression output for fish size as a result of different water quality parameters is presented in
Table 7. Of the eight water quality parameters hypothesized, only five were significant; these were Iron, CO
2, NH
3, Temperature, and Water pH.
The respective R2 values of 0.885 and 0.816 for tilapia and catfish revealed that all the parameters included in the model explained 88% of the variation in the size for the former and 81% for the latter. The F values of 4.959 and 3.317, respectively, for tilapia and catfish were significant at 5% for each.
Iron levels, Carbon dioxide levels and Ammonia levels (mg/L) had a negative effect on catfish size at a 5% level of significance. A unit increase in Iron levels in mg/L reduced catfish size by 11.1 cm while a unit increase in Carbon dioxide levels in mg/L reduced catfish size at harvest by 0.923 cm. Likewise, a unit increment in Ammonia levels in water reduced catfish size at harvest by 5 cm.
Water temperature and water pH had a positive significant effect on catfish size at a 5% level of significance. A unit increase in temperature 1 °C increased catfish size at harvest by 0.746 cm. Likewise, a unit increase in water pH reduced tilapia size at harvest by 0.969 cm.
4. Discussion of Findings
The mean pond water turbidity observed in this study was slightly above the optimal range for fish farming of 30–40 cm recommended by the World Fish Center [
7]. However, the turbidity was within the acceptable ranges of 30–60 cm and 30–80 cm recommended by MAAIF Department Fisheries Resources [
4] and Emokaro et al. [
23], respectively. The researcher observed that there was high plankton growth and suspended clay particles in the fish ponds, evidenced by the greenish and milky color of the pond water, which might have contributed to the pond water turbidity.
The mean alkalinity observed in this study was in agreement with the findings of Kirya [
9], who reported that an alkalinity of 75–200 mg/L was suitable for production of tilapia and catfish in earthen ponds (
Table 1). The alkalinity values in the study area were above the 20 mg/L reported to support pond productivity by Mbugua [
30] and Mwesigwa [
11]. The slightly higher alkalinity values are attributed to the calcium carbonate-rich underlying rocks from which spring water is the main source of water for fish ponds in Ibanda District. This alkalinity implies an adequate water pH buffering capacity, thus minimizing pH fluctuations.
The average water hardness observed across all the ponds studied was under the normal range of 30–180 mg/L (
Table 1). The findings are in line with Kirya [
9], who recommended a total hardness of at least 20 mg/L with a range of above 20 mg/L and 30–180 mg/L as optimal for culturing fish.
The mean pond water CO
2 concentration in this study was within the acceptable range of 5–8 mg/L recommended by Mbugua [
30], and is in agreement with the observations of Swann [
31], who reported that tropical fish can tolerate CO
2 concentrations of 10 mg/L provided DO concentrations are above 5 mg/L. A Carbon dioxide (C0
2) concentration of 5–8 mg/L was recommended as essential for plankton photosynthesis, while 12–15 mg/L and above 50 mg/L were sublethal and lethal to fish, respectively.
At the same time, the mean un-ionized Ammonia in fish ponds in this study was above the optimal range of 0.02–0.05 mg/L recommended for fish growth [
12,
28,
30]. The concentration of Ammonia was higher than the 0.6 mg/L reported to kill fish at short exposure and cause damage to gills and kidney cells on chronic exposure [
10]. According to Kausar and Salim, 2017, 0.1 to 0.3 mg/L is sublethal while 0.6–2.0 mg/L is lethal. According to MAAIF [
28], the maximum limit of Ammonia concentration for aquatic organisms was reported to be 0.1 mg/L. However, 0.2 mg/L total unionized Ammonia was reported to be acceptable and un-ionized Ammonia of less than 0.05 mg/L as safe for many tropical fish species [
28]. The high concentration of Ammonia in this study could be associated with over-feeding of the fish, irregular de-silting of ponds, and nutrient enrichment from agricultural fields (runoff)
The average water temperature observed in this study was below the acceptable range of 28–32 °C (
Table 1) favorable for tropical fishes such as tilapia and African catfish, which are the most commonly cultured fish species in Uganda [
22]. The average water temperature recorded in this study was below the normal range of 30–35 °C considered to be tolerable for fish [
32]. The low temperature observed in this study was attributed to the cool climate in Ibanda District due to its high altitude (1800 m above sea level); the district is characterized by mountainous terrain and numerous swamps.
The average water pH observed across the ponds in the study area was slightly below the recommended acceptable range of 6.5 to 8.5 (
Table 1) as suggested by Riche and Garling [
16]. However, the results were in line with Boyd [
33], who reported the acceptable range for most fish to be pH 6–9. Based on the observed alkalinity (81.64 ± 32.569), the fluctuations in water pH can expected to be minimal, and thus supportive of fish growth. Water pH could be raised further using agricultural limestone, although this represents an additional economic cost on the fish farmer.
The status of the water quality parameters examined here could have been influenced by general agricultural practices in the watershed as well as by specific pond management practices such as the type and amount of feed used, type of fertilizer applied, and pond water replenishment frequency.
Regression results using a multiple regression model revealed that all of the water quality parameters examined had different effects on fish weight and size across the fish pond system in the study area. For example, Iron levels had a negative but significant effect on catfish weight and size at a 5% level of significance. This implies that an increase in water Iron reduces catfish weight and size by 285 g and 11.1 cm, respectively. It should be noted that fish may suffer from Iron compounds in poorly oxygenated water with low pH, where Iron is present mostly in the form of soluble compounds. Because the surface of fish gills tends to be alkaline, soluble bivalent Iron can be oxidized to insoluble ferric compounds which cover the gills’ lamellar surface and hinder respiration. Hindering respiration may affect growth, especially for tilapia. This finding is comparable to findings by Riche and Garling [
16], who found that at a low water temperature and in the presence of Iron, Iron-depositing bacteria multiply rapidly at the gills and further oxidize Iron compounds. These filamentous colonies covering gills are generally colorless, although the residue of Iron can give them a brown color.
Carbon dioxide levels presented a negative but significant effect on the weight of both tilapia and catfish at a 5% significance level. A unit change in Carbon dioxide was predicted to decrease weight at harvest by 4.3 g and 7.7 g for tilapia and catfish, respectively. Carbon dioxide further presented a negative but significant effect on catfish size whereby a unit increase in Carbon dioxide levels reduced catfish size by 0.923 cm. This finding is comparable to findings of Emokaro et al., [
23], who stated that Carbon dioxide rarely causes direct toxicity to fish. Fish may suffocate when CO
2 levels are high, and appear unaffected when CO
2 is low.
Ammonia presented a negative significant effect on catfish weight and size at a 5% level of significance. This implies that a unit increase in Ammonia levels of the pond would lead to a reduction in catfish weight and size by 91 g and 5 cm, respectively. Too much Ammonia causes serious problems in pond management. Ammonia in the range of >0.1 mg/L tends to cause gill damage in fish, destroy mucous-producing membranes, and cause sublethal effects such as reduced growth, poor feed conversion, and reduced disease resistance. Fish suffering from Ammonia toxicity typically stop eating and become lethargic. One cause found to increase total Ammonia levels in ponds is overfeeding fish; uneaten food sinks to the bottom, decays, and releases Ammonia, increasing the load on the nitrifying bacteria in the pond and filter. The study findings are in agreement with Mbugua [
30], who indicated that Ammonia is the primary excretory product of fishes, and that if it is present in high concentrations it will slow fish growth rate.
Water temperature was found to have a positive significant effect on catfish weight and size at a 5% level of significance. This implies that a unit increase in temperature (1 °C) would increase catfish weight by 16.5 g and size by 0.746 cm. The average temperature across the study ponds was 22.96 °C, which is below the temperature of most ponds found in tropical environments. The low temperature in Ibanda District ponds is due to the numerous swamps and the mountainous nature of most parts of the study area. The metabolic rate of fish is closely related to water temperature. The study findings contradict the findings of Mbugua [
30], who asserted that the higher the water temperature, the greater the metabolic rate. In a natural habitat fish can easily tolerate seasonal changes in temperature that decrease in winter towards 0 °C and increase in summer to 20–30 °C. In a pond, the bottom water temperature remains slightly lower than the surface water temperature, which affects feeding and growth.
Lastly, water pH presented a positive significant effect on tilapia weight and size at a 5% significance level. A unit increase in water pH affected tilapia weight by 34.6 g and size by 0.969 cm respectively. Fish have an average blood pH of 7.4, and pond water has a pH close to this optimum. An acceptable range would be 6.5 to 9.0. Fish can become stressed in water with a pH ranging from 4.0 to 6.5 or 9.0 to 11.0. Fish growth is limited in water with a pH of less than 6.5, and reproduction ceases and fry can die at pH less than 5.0. Pond water pH fluctuates throughout the day due to photosynthesis and respiration by plants and vertebrates. Typically, pH is highest at dusk and lowest at dawn. This is because night-time respiration increases Carbon dioxide concentrations that interact with water, producing carbonic acid and lowering pH. This can limit the ability of fish blood to carry oxygen. The study findings are in line with Gan et al. [
24], who revealed that drastic fluctuations in pH can cause stress to aquaculture organisms. Normally, pH daily fluctuation should be maintained within a range of 0.4 differences. Control of pH is essential for minimizing Ammonia and H
2O toxicity in culture systems. Extremely high or low pH values cause damage to fish tissues, especially the gills.
5. Conclusions
Based on our findings, this study draws the following conclusions.
The mean values for several water quality parameters (turbidity 52.652 ± 19.4436, alkalinity 81.64 ± 32.569, Carbon dioxide 5.5116 ± 2.39041, water pH 6.148 ± 0.7304, and hardness 66.40 ± 19.765) across fish ponds in Ibanda District were within the acceptable range for fish growth. However, the concentration of Iron (0.21516 ± 0.109258) and NH3 (0.7916 ± 0.55085) were higher and water temperature (22.96 °C) was lower than the recommended ranges.
The status of Iron, Ammonia, and Carbon dioxide significantly suppressed catfish weight, while turbidity and temperature significantly increased catfish weight. The status of Iron, Carbon dioxide, and Ammonia significantly reduced the total length of catfish, while temperature significantly increased the total length of catfish.
The status of Carbon dioxide significantly suppressed tilapia weight. On the other hand, the status of alkalinity and pH significantly increased tilapia weight; turbidity, alkalinity, hardness and pH increased tilapia total length.
Incremental water Iron reduced catfish weight and size and had no harmful effect on tilapia. High Carbon dioxide levels reduced catfish body weight and size as well as the body weight of tilapia, although it had no effect on tilapia body size. Increased ammonia levels reduced catfish body weight and size and had no effect on tilapia. A rise in water pH increased tilapia body weight and size and had no effect on catfish. An increase in water temperature increased in catfish body weight and size and had no significant effect on tilapia.
6. Recommendations
This study recommends that the unsuitable water quality parameter results, especially for Iron, Ammonia, Carbon dioxide, and pH, may require modification.
In order to improve the productivity of catfish aquaculture systems in Ibanda District, there is a need to reduce Iron, Ammonia and Carbon dioxide levels in water.
To remove Iron, simply aerate or spray water into the air using water pump pressure. Hold water in a settling basin, followed by a slow rate sand filter of about two gallons per square foot per minute. Aerated water may be passed over coarse-contact media, such as stones in a multilevel tray.
These media soon become coated with Iron hydroxide, which promotes catalytic precipitation of Iron from water. Alternatively, Iron can be removed from water using oxidation by Potassium Permanganate (KMO4) followed by filtration. This method can remove 100% of Iron from water, and all Iron residues will settle at the bottom of the tank.
Practices such as regular water change-out, de-silting, stocking at reasonable density, optimal fertilization, and using good feeding practices that maximize the proportion of the feed consumed by fish can reduce Ammonia. Adding a source of organic matter such as chopped hay or dry grass to intensive fish ponds can reduce NH3 concentration. Adding organic matter with a high concentration of carbon relative to nitrogen promotes the fixation or immobilization of the Ammonia dissolved in water. Incorporating Ammonia with bacterial cells packages the nitrogen into a particulate form that is not toxic to fish.
To improve the performance of tilapia there is a need to reduce the Carbon dioxide concentration in water and raise the pH through application of agricultural lime. Lime can be applied to ponds during crises with low dissolved oxygen in order to remove Carbon dioxide and allow fish to use the existing dissolved oxygen more efficiently
Acidic pond water can be treated with a pH adjuster to raise the pH level. Water change-out is recommended if pH is particularly low. For ponds with fish, support them with a treatment of Stress Away and Pond Guardian Salt to alleviate the stress factors brought on by poor water quality.
With a low mean temperature of 22.9 °C in Ibanda District, this paper recommends the introduction of Carp, an aquaculture fish species that performs well in areas with lower temperatures.
Extension staff should conduct regular surveillance and monitoring of changes in water parameters in order to recommend appropriate actions to be taken and advise when water modifications may be highly required.
The Fisheries Department should set up demonstrations to support hands-on training of fish farmers in practices that improve water quality in aquaculture systems.


 ,
, 
