Brief Report

Leg Surface Temperature and Heart Rate Variability Before and After Short-Term Wearing of Black-Silica-Containing Clothing: An Uncontrolled Pilot Study

Department of System Pathology for Neurological Disorders, Brain Research Institute, Niigata University, 1-757 Asahimachi-dori, Chuo-ku, Niigata 951-8585, Japan
Physiologia 2026, 6(3), 52; https://doi.org/10.3390/physiologia6030052
Submission received: 6 July 2026 / Revised: 18 August 2026 / Accepted: 24 August 2026 / Published: 25 August 2026

Abstract

Background/Objectives: Human physiological evidence for functional clothing is limited, and garment changes may reflect ordinary material or measurement effects. We described surface-temperature and heart rate variability (HRV) observations before and after wearing black-silica-containing clothing and quantified paired changes and between-participant dispersion. Methods: Ten adults enrolled as healthy volunteers completed this single-center, non-randomized, unblinded, uncontrolled, fixed-order, single-group before–after pilot protocol. No physically matched control textile was used. No directional hypothesis or single primary outcome was prospectively specified. Exploratory domains comprised abdominal and leg surface temperature and eight RR interval (RRI)-derived HRV indices. All participants were analyzed; a post hoc n = 9 quality-control sensitivity analysis excluded one participant with a short post-wearing RRI segment. Effect estimates, 95% confidence intervals (CIs), and Holm-adjusted p values were reported. Between-participant dispersion was secondary and exploratory. Results: Leg surface temperature showed a modest increase of 0.668 °C (95% CI −0.001 to 1.336; raw p = 0.050; Holm p = 0.100); abdominal temperature changed by 0.007 °C (95% CI −0.447 to 0.462). No paired HRV outcome retained support after correction (all Holm p ≥ 0.797). In the secondary dispersion analysis, total power had an after/before log-scale SD ratio of 0.612 (bootstrap 95% CI 0.347 to 0.861; Holm p = 0.031); no dispersion outcome retained support in the n = 9 sensitivity analysis. Conclusions: This small uncontrolled pilot provides hypothesis-generating observations but cannot isolate an effect attributable specifically to black silica or demonstrate autonomic benefit, therapeutic action, or product efficacy. Confirmation requires an adequately powered, randomized, participant-blinded crossover study using physically matched garments and standardized measurement conditions.


1. Introduction

Clothing defines the immediate thermal microenvironment through insulation, layer structure, fabric mass, fit, moisture transport, and convective and radiative exchange [1,2]. Functional and far-infrared-emitting textiles have been examined in human wear studies, but the evidence remains heterogeneous and specific to the material and protocol [3]. Direct human evidence for black-silica-containing clothing remains limited.
Controlled human studies of related far-infrared interventions provide useful methodological context, although they are not directly equivalent to the present garment condition. In a randomized, double-blind, placebo-controlled crossover study, Nishida et al. compared far-infrared-emitting sleepwear with visually matched control garments under standardized overnight conditions and assessed thermoregulation, sleep, and HRV using wearable sensors [4]. Peng et al. reported increased foot skin surface temperature and changes in selected HRV indices after direct far-infrared irradiation in a randomized study of adults older than 50 years [5]. Direct irradiation and far-infrared-emitting sleepwear differ from black-silica-containing clothing in material, exposure, and measurement context; these studies therefore do not establish a black-silica-specific effect. Rather, they illustrate the importance of physically matched comparators, standardized exposure conditions, and separate interpretation of thermal and HRV outcomes.
Surface temperature provides local information relevant to thermoregulation, whereas HRV summarizes variation in beat-to-beat cardiac intervals and is affected by posture, breathing, activity, psychological state, recording duration, and preprocessing [6,7]. HRV is an indirect and context-dependent marker; it does not identify a specific neural pathway. A paired change in central tendency and a change in between-participant dispersion are also different concepts. A lower group SD after exposure does not show that each participant became more physiologically consistent.
In the non-BS comparator condition, participants wore commercially available garments that were not standardized to one product or fiber blend, and the BS Fine shirt and tights also differed in composition. The garment conditions were neither compositionally nor physically matched and may have differed in insulation, moisture handling, stretch, construction, thickness, mass, fit, and other fabric characteristics. The present design therefore cannot separate a constituent-specific contribution from ordinary garment effects or temporal and behavioral factors.
No directional hypothesis or single primary outcome was prospectively specified. The abdomen and leg were the two surface-temperature sites recorded in the completed protocol, and the eight HRV indices were standard time- and frequency-domain measures that could be recalculated consistently from the retained RRI exports. This exploratory study therefore estimated paired changes in abdominal and leg surface temperature and in eight standard HRV indices. Between-participant dispersion was evaluated as a secondary distributional analysis. Baseline–change correlations and additional nonstandard measures were not included in the reporting hierarchy.

2. Results

2.1. Participant Flow and Characteristics

All 10 participants contributed paired surface-temperature and RRI records and were included in the main analysis. They were adults enrolled as healthy volunteers under the approved protocol. The participants ranged in age from their 20s to their 50s, and the sample included 3 men and 7 women (Table 1).

2.2. Data Completeness and RRI Quality Control

The 20 RRI exports contained 31,894 numeric intervals. Three exports also contained 2687 trailing blank or nonnumeric export rows. These were non-data rows, not excluded physiological RRI observations, and were ignored during import. One interval (251 ms; 0.003% of numeric intervals) fell outside the post hoc 300–2000-ms range and was excluded; 31,893 intervals remained. Usable RRI durations across the 20 condition-level exports ranged from 7.83 to 59.69 min. One post-wearing export was shorter than the 10-min post hoc target used for the QC sensitivity analysis. No beats were manually corrected, replaced, or interpolated as part of artifact treatment (Supplementary Table S1; Supplementary Figure S1).

2.3. Surface-Temperature Paired Changes

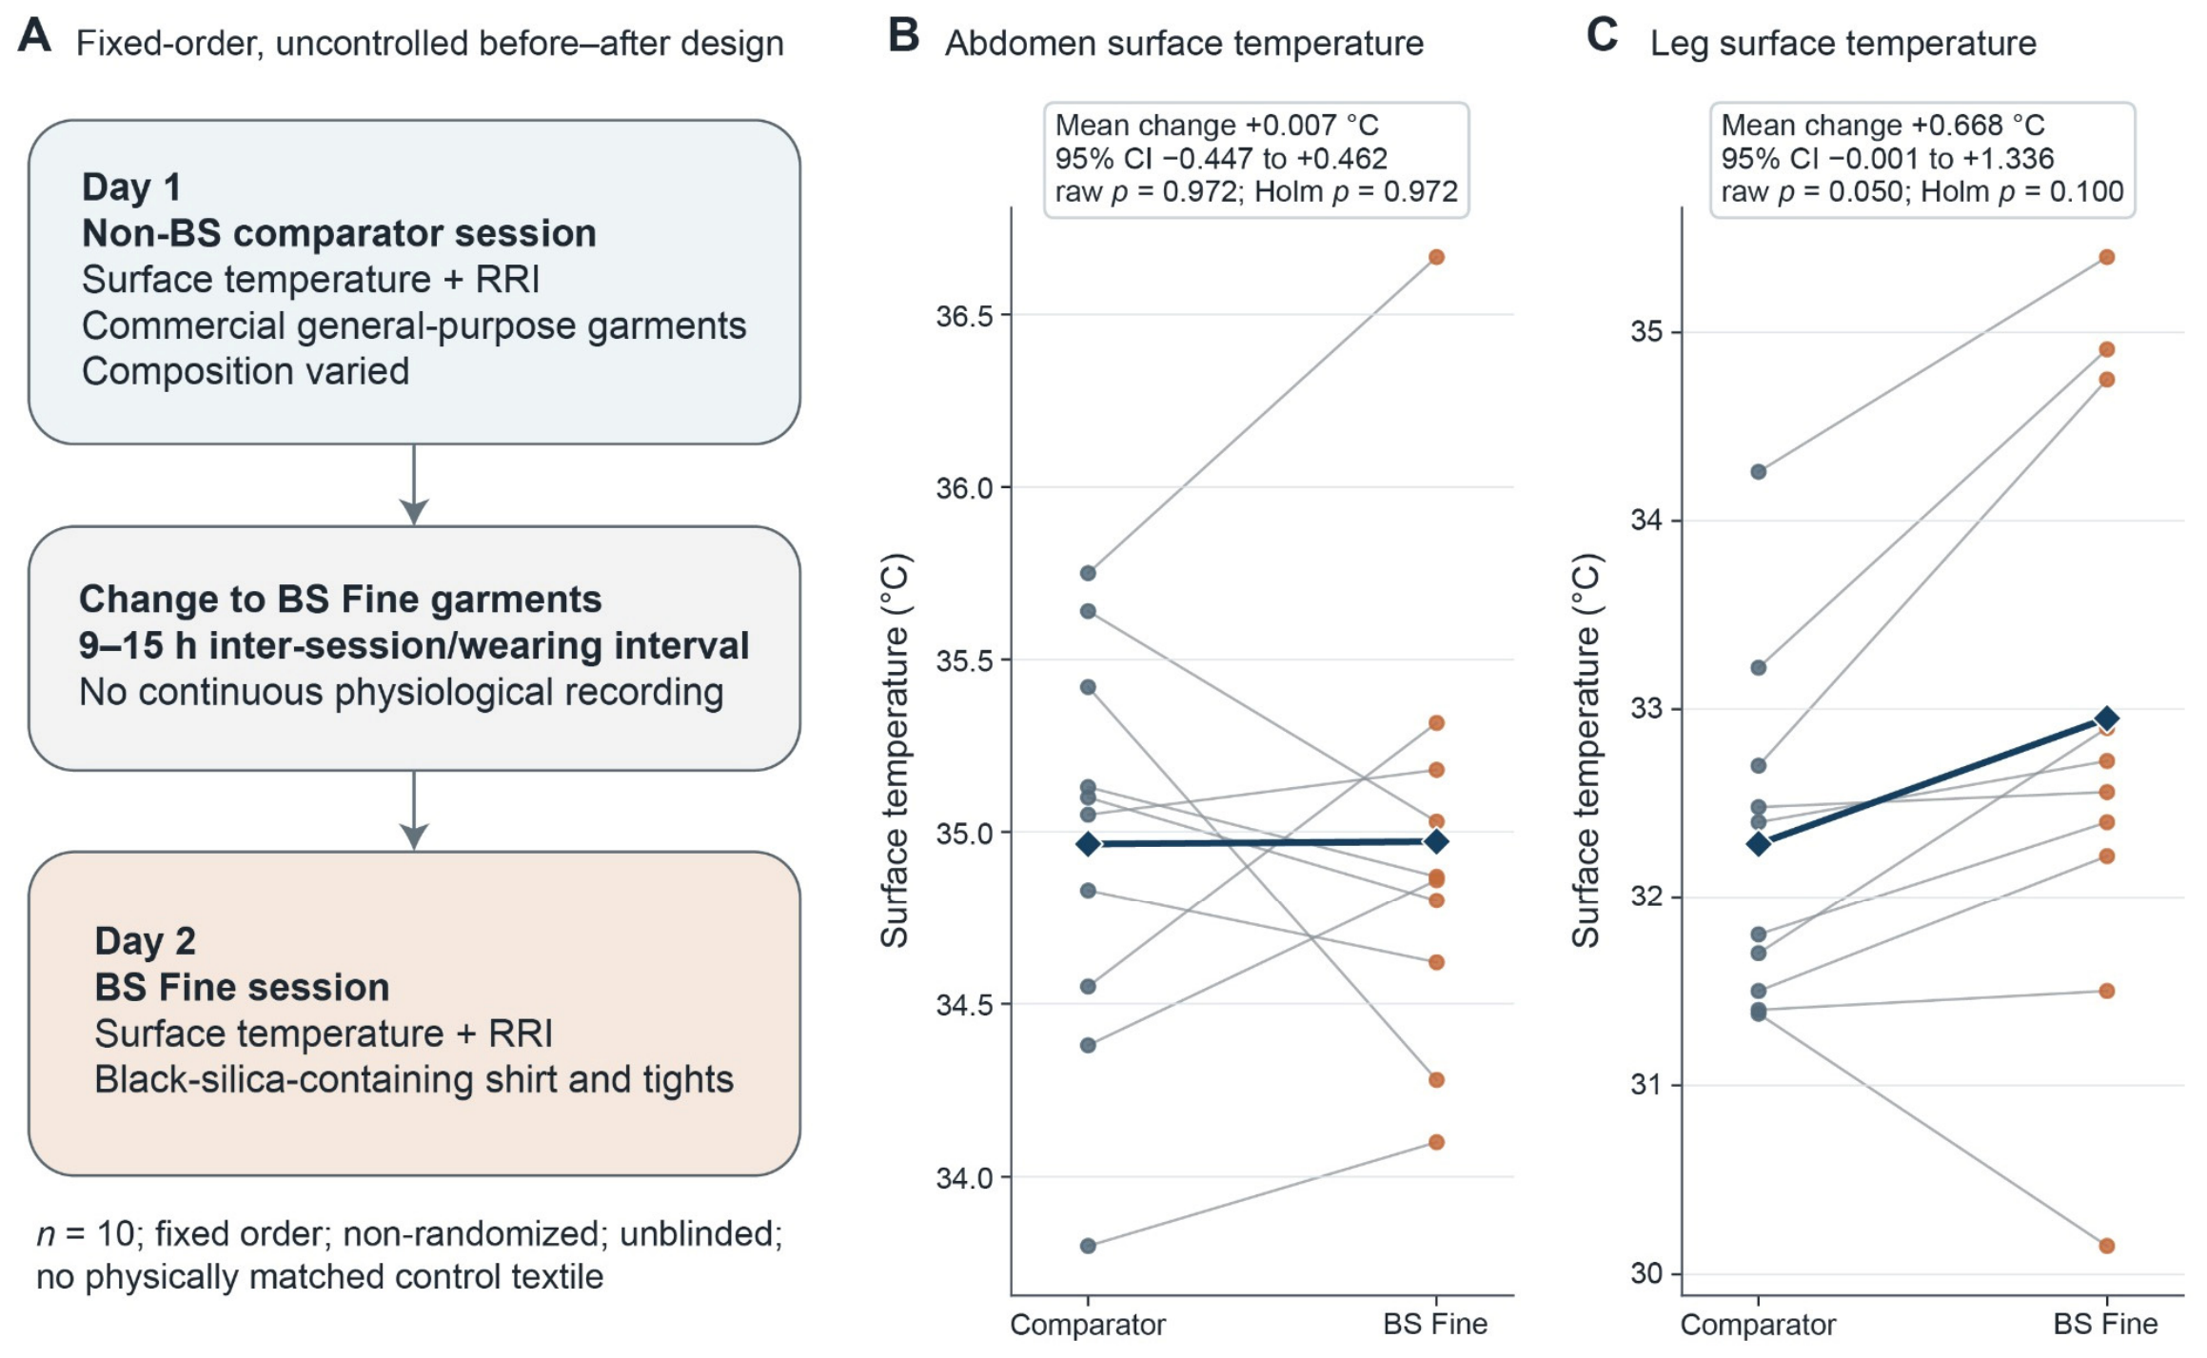
Abdominal surface temperature changed by 0.007 °C (before 34.965 ± 0.598 °C; after 34.972 ± 0.703 °C; 95% CI −0.447 to 0.462; dz = 0.01; raw p = 0.972; Holm p = 0.972). Leg surface temperature showed a modest increase of 0.668 °C (before 32.284 ± 0.931 °C; after 32.952 ± 1.635 °C; 95% CI −0.001 to 1.336; dz = 0.71). Statistical evidence was borderline before correction (raw p = 0.050) and was not retained after correction across the two temperature outcomes (Holm p = 0.100). The leg Wilcoxon sensitivity p values were 0.049 raw and 0.098 after Holm correction (Table 2; Figure 1).

2.4. HRV Paired Changes

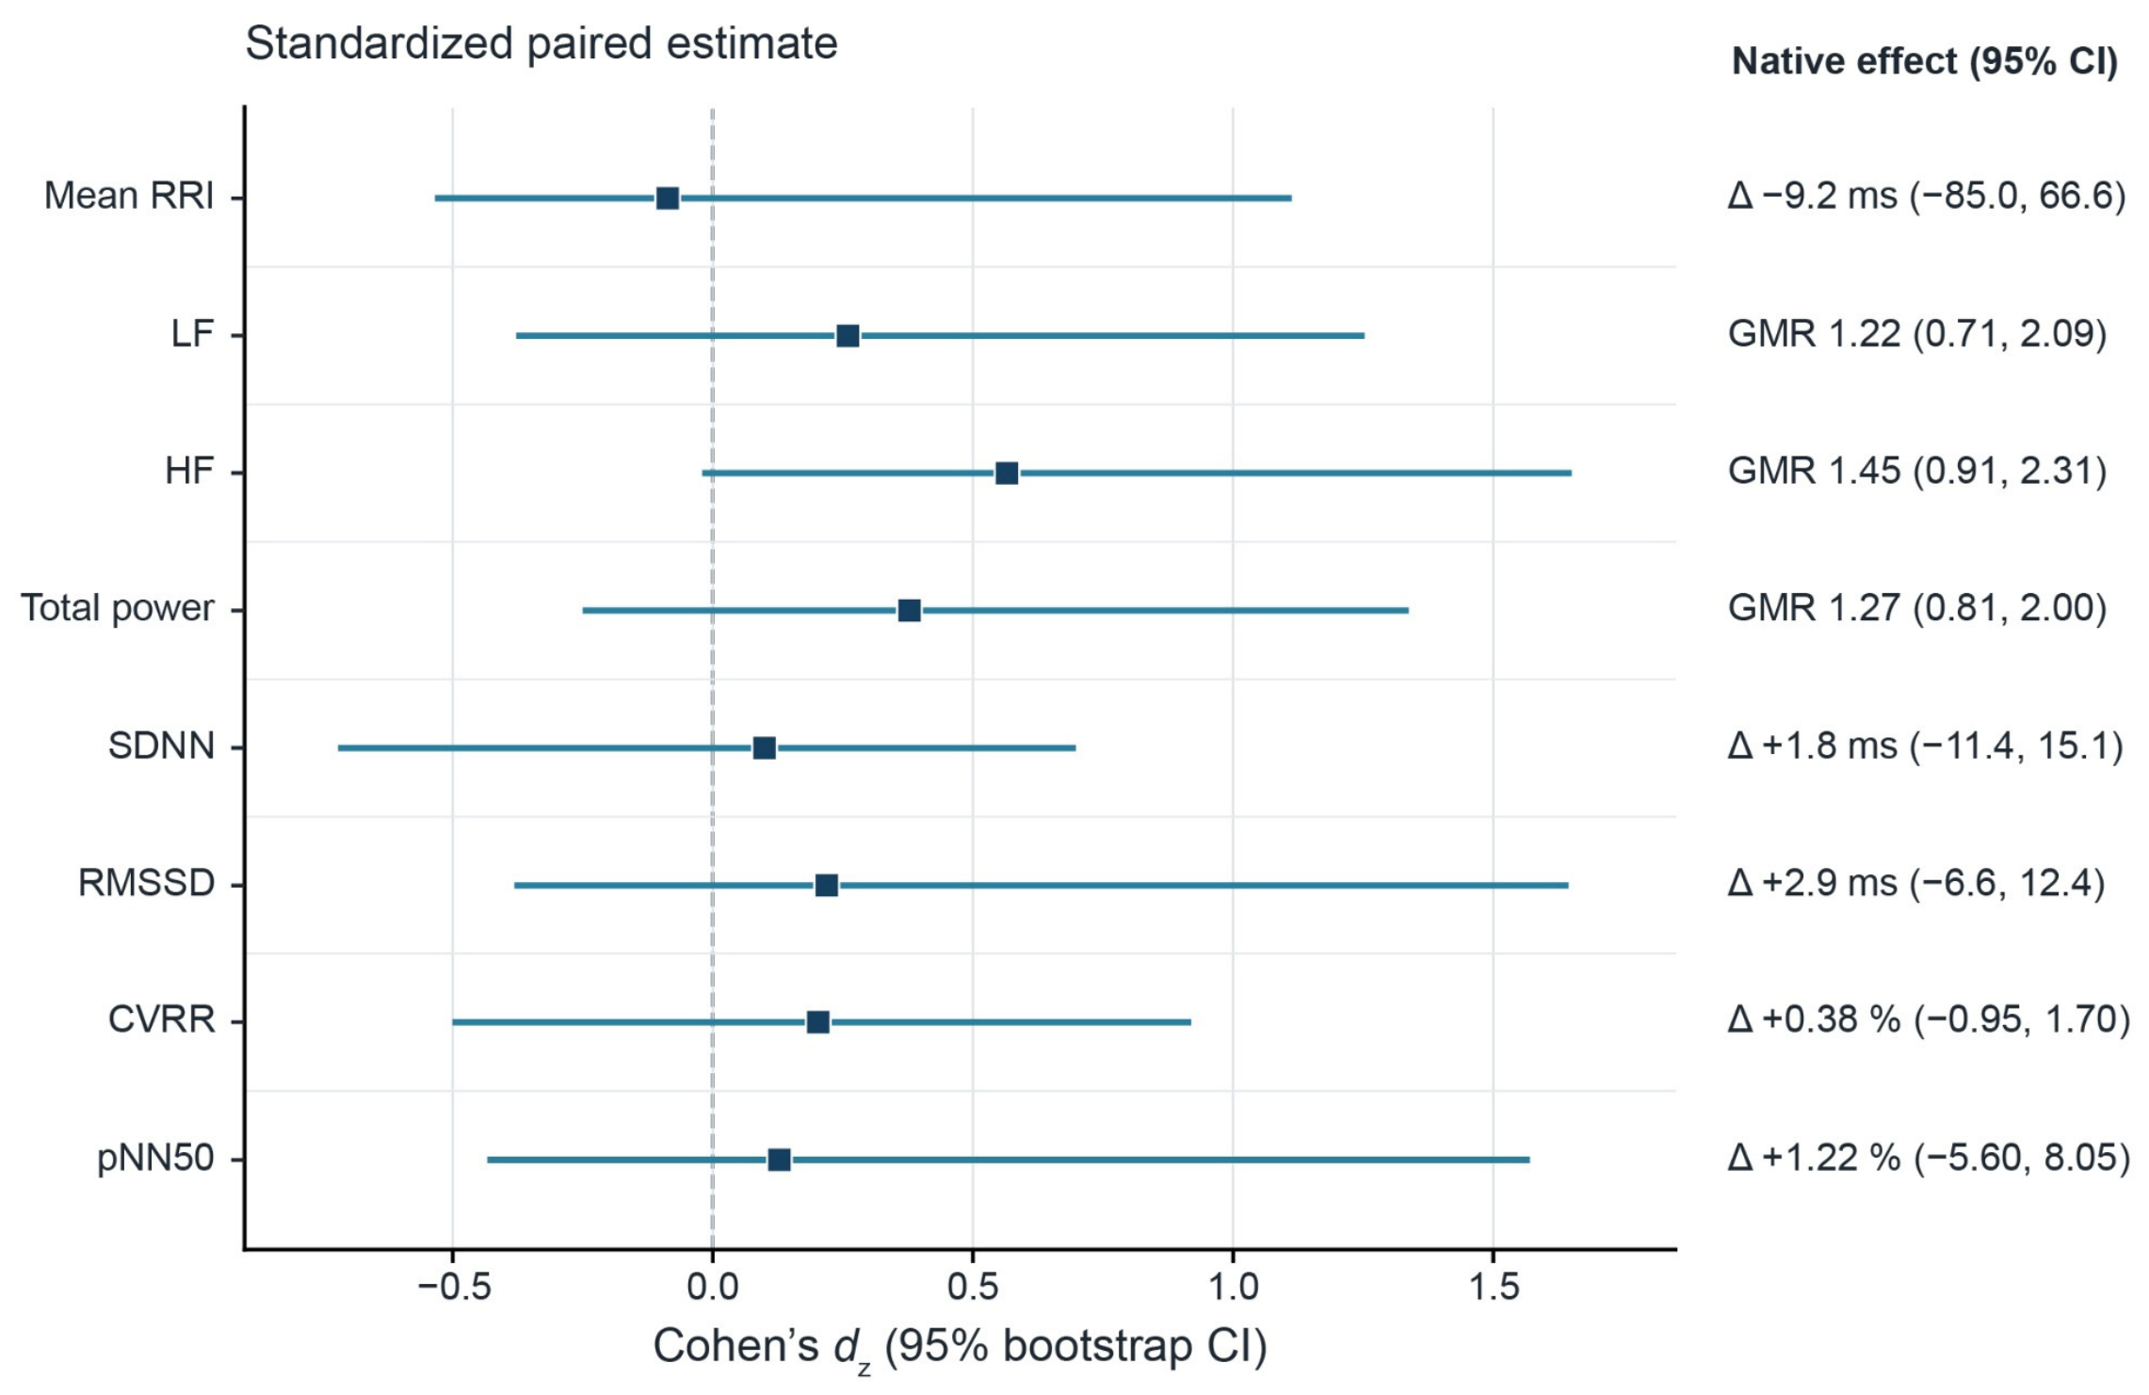
None of the eight paired HRV changes retained support after Holm correction in the n = 10 analysis (all Holm p ≥ 0.797; Table 2; Figure 2). The largest standardized estimate was for HF (geometric mean ratio 1.448; 95% CI 0.907 to 2.311; dz = 0.566; raw p = 0.100; Holm p = 0.797). All eight CIs were compatible with no paired difference; detailed results are provided in Supplementary Table S2 and individual observations in Supplementary Figure S2.

2.5. Exploratory Between-Participant Dispersion

On the descriptive original scale, the after/before SD ratio was below 1 for all eight HRV indices (median 0.722). This describes the observed group distribution and does not show a within-participant improvement. In the scale-appropriate analysis, total power retained adjusted evidence of lower between-participant dispersion (SD ratio 0.612; bootstrap 95% CI 0.347 to 0.861; raw p = 0.004; Holm p = 0.031). HF and RMSSD did not retain support after correction (Holm p = 0.055 and 0.070, respectively; Supplementary Table S3).

2.6. Post Hoc QC and Duration Sensitivity Analyses

In the n = 9 post hoc QC sensitivity analysis, no paired HRV outcome retained support after Holm correction (minimum Holm p = 0.344). Original-scale SD ratios were below 1 for seven of eight indices (median 0.712); CVRR was 1.026. No dispersion outcome retained adjusted support (minimum Holm p = 0.062). The first-10-min n = 9 robustness analysis also yielded no Holm-adjusted p values < 0.05 for paired changes (minimum 0.188) or dispersion (minimum 0.062; Supplementary Tables S2 and S3).

3. Discussion

3.1. Principal Observations

The present findings support a cautious, hypothesis-generating interpretation. Leg surface temperature showed a modest, imprecisely estimated increase that did not retain support after correction across the two sites. No standard HRV index retained evidence of a paired change after multiplicity correction. Although post-wearing SDs were descriptively lower for all eight HRV indices in the n = 10 analysis, only total-power dispersion retained adjusted evidence, and the corresponding n = 9 analysis did not retain support.

3.2. Temperature Finding: Magnitude and Uncertainty

The leg estimate of 0.668 °C should be interpreted with its 95% CI (−0.001 to 1.336 °C), which ranges from approximately no change to a larger increase. Local skin temperature varies with site, environment, cutaneous blood flow, and behavioral state [7,8]. Exact placement coordinates, session-level room values, and independent calibration records were unavailable. Accordingly, the estimate cannot be interpreted relative to session-specific measurement error or a physiological threshold. The observed difference is therefore exploratory rather than proof of warming performance.

3.3. Interpretation of HRV Paired Changes

The absence of multiplicity-supported paired changes is central to interpretation. HRV indices are intercorrelated summaries that depend on respiratory, behavioral, temporal, and preprocessing context. In the n = 9 QC sensitivity analysis, the unadjusted 95% CI for HF excluded a ratio of 1, but no HRV outcome retained support after Holm correction; this isolated result was not interpreted as evidence of an autonomic effect. These data do not show improved autonomic function, vagal activation, sympathetic suppression, or clinical benefit.

3.4. Limited Meaning of the Dispersion Findings

Between-participant dispersion is not the same as within-participant consistency. A lower group SD in one small sample can reflect sampling variation, scale, an influential observation, measurement error, or temporal change. Baseline–change correlations are particularly vulnerable to mathematical coupling and regression to the mean [9]. HRV remains an indirect marker and cannot identify a specific autonomic pathway [6,10]. Accordingly, the isolated total-power dispersion result is a hypothesis-generating distributional observation, not evidence of a general physiological benefit.

3.5. Alternative Explanations

Potential explanations include ordinary insulation, composition differences, fit and cut, moisture handling, fabric thickness and mass, stretch, time of day, variation in wearing duration, prior activity, meals, caffeine, alcohol, stress, medication, sleep or fatigue, menstrual-cycle effects, sensor placement, measurement error, random sampling variation, and regression to the mean. The fixed order also allows for habituation, expectancy, secular time effects, and carryover from the day’s activities. None of these explanations can be separated from the clothing condition in the present design.

3.6. Inability to Isolate a Black-Silica Contribution

The non-BS comparator garments were not standardized to a single product or fiber composition, and the BS Fine shirt and tights also differed in composition. Unmeasured differences in fiber blend, insulation, moisture handling, stretch, construction, thickness, mass, and fit may therefore have contributed to the observations. Consequently, the present data cannot isolate or establish an effect specific to black silica. A constituent-level mechanism would require garments that are indistinguishable except for the component under study and independent textile-property verification.

3.7. Manufacturer Funding and Independent Replication

This study was funded solely by Kamo Textile Co., Ltd. (Tsuyama, Okayama, Japan), which also provided the BS Fine garments. The company had no role in study design, participant recruitment, data collection, data analysis, interpretation of the results, manuscript preparation, or the decision to submit. Manufacturer funding nevertheless increases the importance of conservative interpretation and replication by investigators who are independent of the company; no independent replication is currently available.

3.8. Strengths

Strengths of the study and reanalysis include recalculation from raw RRI exports, inclusion of all 10 participants in the main analysis, an explicit condition-level QC audit, a separate post hoc sensitivity population, duration-standardized robustness analysis, effect estimates with 95% CIs, family-wise multiplicity control, data-derived figure annotations, and direct separation of paired changes from group dispersion.

3.9. Limitations

Limitations include n = 10, no a priori power calculation, the uncontrolled single-group design, fixed-order before–after measurements, non-randomized allocation, no blinding, no crossover or washout, and no physically matched control textile. The inter-session interval and intervening wear period varied from 9 to 15 h, matched clock times were not retained, and the fixed order allowed circadian and intervening daily-activity effects to confound the comparison.
The detailed health-screening method, posture, breathing, meals, caffeine, alcohol, exercise or prior activity, stress, medication use, sleep or fatigue, and menstrual-cycle phase were incompletely recorded or not systematically recorded. Sensor coordinates, attachment, sampling, and calibration information were incomplete. Recording durations varied substantially, a common stable-window marker was absent, one participant had a short post-wearing RRI segment, and the QC sensitivity rule was post hoc. Multiple exploratory outcomes were examined.
The non-BS comparator garments were not standardized to a single product or fiber composition, the BS Fine shirt and tights differed in composition, and the conditions were not independently characterized for insulation, emissivity, moisture transport, thickness, mass, stretch, construction, or fit. The study did not measure blood flow or skin perfusion. Raw beat-to-beat RRI data are not publicly shared because of consent, privacy, and ethical restrictions. Kamo Textile Co., Ltd. was the sole funder and provided the BS Fine garments but had no role in study design, participant recruitment, data collection, data analysis, interpretation of the results, manuscript preparation, or the decision to submit. The findings have not been independently replicated. These limitations preclude causal inference, and the observed differences cannot be attributed specifically to black silica.

3.10. Future Study Requirements

A confirmatory study should use an adequately powered, randomized, participant-blinded crossover design with physically matched, visually indistinguishable garments; counterbalanced order; an appropriate washout; standardized clock time, posture, breathing, activity, meals, and stimulant use; outcomes and RRI quality-control rules fixed before enrollment; validated sensor placement; and direct measurements of skin perfusion and textile physical properties. Independent replication and complete sponsor-role documentation are essential.

4. Materials and Methods

4.1. Study Design and Ethical Approval

This was a single-center, non-randomized, unblinded, uncontrolled, single-group before–after exploratory pilot study. The condition order was fixed: comparator-clothing measurement preceded the BS Fine condition for every participant. There was no concurrent control group, variation in condition order, crossover washout, or physically matched control textile.
The study was approved by the Niigata University Ethics Review Committee (approval No. 2023-0295). Institutional permission was dated 1 March 2024 under protocol Ver. 1.1 dated 29 February 2024, and the study was registered as jRCT1032230702. Written informed consent was obtained from all participants.

4.2. Participants and Recruitment

Ten adults enrolled as healthy volunteers under the approved protocol were analyzed. They ranged in age from their 20s to their 50s, and the sample included 3 men and 7 women. The approved protocol permitted recruitment through notices at the Brain Research Institute and Niigata University; the actual recruitment route for each analyzed participant was not retained. Eligible individuals were adults able to provide written consent and judged suitable for participation. Inability to consent, withdrawal, or investigator judgment of unsuitability were exclusion criteria.
The available records did not retain individual ages, body mass index, the detailed health-screening method, medication history, or participant-level inclusion/exclusion decisions. No a priori power calculation was performed for this clothing analysis. The analyzed set comprised all 10 participants with paired temperature and RRI records.

4.3. Clothing Conditions and Wearing Protocol

In the non-BS comparator condition, participants wore commercially available general-purpose garments of similar intended use. Identical comparator products were not available for all participants, and the comparator garments therefore varied in fiber composition. Label-listed fibers across the comparator garments included cotton, polyester, rayon, and polyurethane in differing proportions. In the BS Fine condition, participants wore a commercially available shirt and tights incorporating black-silica-containing fibers; garment labels indicated that the shirt and tights also differed in their cotton/polyester composition. Thus, the two garment conditions were neither compositionally nor physically matched. The study represents a pragmatic comparison between ordinary commercially available garments and garments incorporating black-silica-containing fibers, rather than an isolated test of black silica.
Participants completed two discrete measurement sessions. The Day 1 session was conducted in the non-BS comparator garment condition. After that session, participants changed to the BS Fine garments, and the Day 2 BS Fine-condition session occurred 9–15 h later. The 9–15 h value denotes the interval between the two measurement sessions and the intervening wear period; physiological signals were not recorded continuously during this interval. RRI and surface-temperature data were acquired only during the discrete measurement sessions. Exact clock times and whether paired sessions occurred at the same time of day were not retained.

4.4. Environmental and Measurement Conditions

Measurements were performed under room conditions of 22–25 °C and 30–50% relative humidity. Session-level temperature and humidity values were not retained. The available records did not systematically retain posture during measurement, breathing instructions, pre-recording rest or acclimatization, meals, caffeine, alcohol, exercise or prior activity, acute stress, sleep/fatigue, medication use, or menstrual-cycle phase. These variables were not retrospectively imputed or treated as controlled.
The exported RRI files did not contain a common marker identifying a standardized stable analysis window. Complete usable exports were therefore used in the main n = 10 analysis, and a duration-standardized analysis was performed separately.

4.5. Surface-Temperature Acquisition

Abdominal and leg surface temperatures were recorded using wearable body-temperature sensors (CORE; greenteg AG, Rümlang, Switzerland) attached at the respective sites. Although the device can estimate core body temperature, only exported surface-temperature values were analyzed. Skin temperature is site- and context-dependent [7]. Exact anatomical coordinates, attachment method, sampling interval, averaging window, device firmware, and independent calibration records were not retained; the sites are therefore reported only as abdomen and leg.

4.6. RRI Acquisition and Quality Control

RRI data were acquired with a wearable heart-rate sensor (myBeat WHS-1; Union Tool Co., Tokyo, Japan) and exported as 20 before/after CSV files. Electrode placement, attachment details, acquisition firmware, and the version/settings of the original analyzer software were not retained in the available records. For reanalysis, the import routine located the Time/RRI header, converted values to milliseconds if needed, and ignored blank or nonnumeric export rows.
A post hoc finite physiological-range screen retained RRI values from 300 to 2000 ms inclusive. One 251-ms interval (1 of 31,894 numeric intervals; 0.003%) was excluded. No validated ectopic-beat annotations were available, and no manual correction, beat replacement, or artifact interpolation was performed. Linear interpolation used for spectral resampling was not counted as beat correction. A condition-level QC table reports raw rows, numeric/missing rows, usable duration, range exclusions, final beats, and analysis inclusion.

4.7. HRV Calculation

The calculated indices were mean RRI, low-frequency power (LF), high-frequency power (HF), total power, standard deviation of RR intervals (SDNN), root mean square of successive differences (RMSSD), coefficient of variation of RR intervals (CVRR), and percentage of successive intervals differing by more than 50 ms (pNN50), following standard definitions [11,12]. For spectral analysis, each RRI was assigned to the start time of its interval, the series was linearly resampled at 4 Hz, and Welch power spectral density estimation used a Hann window, a maximum segment length of 256 samples, 50% overlap, constant detrending, and density scaling. LF was integrated over 0.04–0.15 Hz, HF over 0.15–0.40 Hz, and total power over 0.04–0.40 Hz [11]. Artifact handling and recording duration can materially affect HRV estimates [13,14,15,16].

4.8. Outcomes and Analysis Populations

No directional hypothesis or single primary outcome was prospectively specified. The exploratory temperature domain comprised abdominal and leg surface temperature, and the exploratory HRV domain comprised the eight indices listed above. Between-participant dispersion was secondary and exploratory. Baseline–change analyses and additional nonstandard measures were not included in the reporting hierarchy.
All 10 participants were included in the main temperature and HRV analyses. A post hoc QC sensitivity analysis excluded one participant’s complete before–after pair because the post-wearing RRI segment was 7.83 min, shorter than the 10-min target used for this sensitivity analysis. A separate n = 9 robustness analysis used the first 10 usable minutes from both conditions. The 10-min rule was not documented before data collection.

4.9. Statistical Analysis

For this post hoc reanalysis, the analysis specification was finalized before recalculation of the reported estimates and generation of the revised tables and figures. All tests were two-sided. Effect estimates and 95% CIs were emphasized, and Holm correction was applied separately within the two-outcome temperature family, the eight-outcome HRV paired-change family, and the eight-outcome dispersion family.
For temperature, before and after means and SDs, paired mean differences, t-based 95% CIs, Cohen’s dz, and paired t-test p values were calculated. Exact Wilcoxon signed-rank tests were sensitivity analyses. For HRV, LF, HF, and total power were analyzed after natural-log transformation because of anticipated right skew; effects are reported as back-transformed geometric mean ratios. Mean RRI, SDNN, RMSSD, CVRR, and pNN50 were analyzed on the original scale as paired mean differences. Exact sign-flip tests assessed paired differences, with Cohen’s dz and bootstrap CIs reported on the analysis scale.
For dispersion, the effect was the after/before SD ratio on the same scale used for the paired analysis. Paired-participant bootstrap resampling (50,000 replicates; base seed 20260804) generated 95% CIs. An exact within-participant label-swap test used the absolute log SD ratio; Holm correction covered eight outcomes. Original-scale SD ratios and interquartile range (IQR) ratios were descriptive robustness measures.
Baseline–change correlations were not included because the change score contains the baseline value and the correlation is vulnerable to mathematical coupling and regression to the mean in a small sample [9]. The analyses were performed in Python 3.13.3 (Python Software Foundation, Beaverton, OR, USA) using NumPy 2.3.4, pandas 2.3.3, SciPy 1.16.1, statsmodels 0.14.5, and Matplotlib 3.10.7.

5. Conclusions

In this uncontrolled pilot study of 10 adults enrolled as healthy volunteers, a modest increase in leg surface temperature was observed; no paired change in a standard HRV index retained support after multiplicity correction, and the single secondary total-power dispersion finding was not confirmed in the n = 9 sensitivity analysis.
These hypothesis-generating observations cannot be attributed specifically to black silica and do not demonstrate autonomic benefit, therapeutic action, or product efficacy.
Confirmation requires an adequately powered, randomized, participant-blinded crossover study using physically matched garments and standardized measurement conditions.

Supplementary Materials

The following supporting information can be downloaded at: https://www.mdpi.com/article/10.3390/physiologia6030052/s1, File S1. De-identified condition-level surface-temperature and HRV summary data. Raw beat-to-beat RRI time series and directly identifying information are not included. Table S1. Condition-level RRI quality-control audit. Rows correspond to the 20 condition-level RRI exports and report numeric and non-data rows, usable duration, physiological-range exclusions, final analyzed beats, QC flags, and inclusion in the n = 10 main and n = 9 QC sensitivity analyses. Table S2. HRV paired-change analyses for the main n = 10 complete-export analysis, the post hoc n = 9 QC sensitivity analysis, and the n = 9 first-10-min duration-standardized robustness analysis. Before/after summaries, native effects with 95% CIs, Cohen’s dz with bootstrap 95% CIs, exact sign-flip p values, Holm-adjusted p values, and paired-test sensitivities are reported. Table S3. Between-participant HRV dispersion analyses for the same three analysis populations. SD ratios are after/before on the stated analysis scale; bootstrap 95% CIs, exact within-participant label-swap p values, Holm-adjusted p values, and original-scale SD and IQR robustness measures are reported. These analyses are secondary and exploratory. Figure S1. Analysis populations, RRI quality control, and reporting hierarchy. Ten participants contributed paired surface-temperature and RRI data and were included in the main analyses. Twenty condition-level RRI CSV exports underwent import and quality control; trailing blank or non-data export rows were ignored, one interval outside the post hoc range of 300–2000 ms was excluded, and no manual beat correction, beat replacement, or artifact interpolation was performed. The main HRV analysis included all 10 participants. A post hoc QC sensitivity analysis excluded one participant with a 7.83-min post-wearing RRI segment, and a separate duration-standardized robustness analysis used the first 10 usable minutes from both conditions in the remaining nine participants. Surface-temperature, paired HRV, and HRV-dispersion outcomes were treated as separate families, with effect estimates and 95% confidence intervals reported and Holm adjustment applied within each family. Figure S2. Individual paired HRV observations in the main n = 10 analysis. Thin gray lines connect comparator and BS Fine observations from the same participant, and colored points show individual values. LF, HF, and total power are displayed on logarithmic y-axes; the remaining outcomes are displayed on their original linear scales. Diamonds and thick lines show geometric means for LF, HF, and total power and arithmetic means for the remaining outcomes. Inferential effect estimates, 95% confidence intervals, and multiplicity-adjusted p values are reported in Figure 2 and Table 2.

Funding

This study was funded solely by Kamo Textile Co., Ltd. (Tsuyama, Okayama, Japan); no grant number was assigned. The company also provided the BS Fine garments used in the study and had no role in study design, participant recruitment, data collection, data analysis, interpretation of the results, manuscript preparation, or the decision to submit the manuscript.

Institutional Review Board Statement

The study was approved by the Niigata University Ethics Review Committee (approval No. 2023-0295). Institutional permission was granted on 1 March 2024 under approved protocol Ver. 1.1 dated 29 February 2024. The study was registered as jRCT1032230702.

Informed Consent Statement

Written informed consent was obtained from all participants involved in the study.

Data Availability Statement

De-identified condition-level summary values for each participant supporting the surface-temperature and HRV analyses are provided as Supplementary File S1. Raw beat-to-beat RRI time-series data are not publicly available because they are individual-level physiological data subject to consent, privacy, and ethical restrictions. Analysis scripts and the post hoc reanalysis specification may be available from the corresponding author on reasonable request, subject to institutional and ethical restrictions.

Acknowledgments

The author acknowledges technical support during the experimental measurements. ChatGPT (GPT-5.6 Pro; OpenAI, San Francisco, CA, USA) was used under the author’s supervision to assist with drafting analysis code, statistical review, and preliminary English-language editing; the author is responsible for all scientific and submission decisions.

Conflicts of Interest

K.T. received research funding and BS Fine garments for this study from Kamo Textile Co., Ltd. (Tsuyama, Okayama, Japan). The funder had no role in study design, participant recruitment, data collection, data analysis, interpretation of the results, manuscript preparation, or the decision to submit the manuscript. K.T. declares no other conflicts of interest.

Abbreviations

CI, confidence interval; CVRR, coefficient of variation of RR intervals; GMR, geometric mean ratio; HF, high-frequency; HRV, heart rate variability; IQR, interquartile range; LF, low-frequency; pNN50, percentage of successive RR intervals differing by more than 50 ms; QC, quality control; RMSSD, root mean square of successive differences; RRI, RR interval; SD, standard deviation; SDNN, standard deviation of RR intervals.

References

  1. Kwon, J.; Choi, J. Clothing insulation and temperature, layer and mass of clothing under comfortable environmental conditions. J. Physiol. Anthropol. 2013, 32, 11. [Google Scholar] [CrossRef] [Scilit]
  2. Özkan, E.T.; Kaplangiray, B.; Şekir, U.; Şahin, Ş. Effect of different garments on thermophysiological and psychological comfort properties of athletes in a wear trial test. Sci. Rep. 2023, 13, 14883. [Google Scholar] [CrossRef] [Scilit]
  3. Bontemps, B.; Gruet, M.; Vercruyssen, F.; Louis, J. Utilisation of far infrared-emitting garments for optimising performance and recovery in sport: Real potential or new fad? A systematic review. PLoS ONE 2021, 16, e0251282. [Google Scholar] [CrossRef] [Scilit]
  4. Nishida, M.; Nishii, T.; Suyama, S.; Youn, S. Physiological Effects of Far-Infrared-Emitting Garments on Sleep, Thermoregulation, and Autonomic Function Assessed Using Wearable Sensors. Sensors 2026, 26, 550. [Google Scholar] [CrossRef] [Scilit]
  5. Peng, T.-C.; Chang, S.-P.; Chi, L.-M.; Lin, L.-M. The effectiveness of far-infrared irradiation on foot skin surface temperature and heart rate variability in healthy adults over 50 years of age: A randomized study. Medicine 2020, 99, e23366. [Google Scholar] [CrossRef] [Scilit]
  6. Draghici, A.E.; Taylor, J.A. The physiological basis and measurement of heart rate variability in humans. J. Physiol. Anthropol. 2016, 35, 22. [Google Scholar] [CrossRef] [Scilit]
  7. Romanovsky, A.A. Skin temperature: Its role in thermoregulation. Acta Physiol. 2014, 210, 498–507. [Google Scholar] [CrossRef] [Scilit] [PubMed]
  8. Charkoudian, N. Skin blood flow in adult human thermoregulation: How it works, when it does not, and why. Mayo Clin. Proc. 2003, 78, 603–612. [Google Scholar] [CrossRef] [Scilit]
  9. Chiolero, A.; Paradis, G.; Rich, B.; Hanley, J.A. Assessing the Relationship between the Baseline Value of a Continuous Variable and Subsequent Change Over Time. Front. Public Health 2013, 1, 29. [Google Scholar] [CrossRef] [Scilit]
  10. Billman, G.E. The LF/HF ratio does not accurately measure cardiac sympatho-vagal balance. Front. Physiol. 2013, 4, 26. [Google Scholar] [CrossRef] [Scilit] [PubMed]
  11. Task Force of the European Society of Cardiology the North American Society of Pacing Electrophysiology. Heart rate variability: Standards of measurement, physiological interpretation, and clinical use. Circulation 1996, 93, 1043–1065. [Google Scholar] [CrossRef] [Scilit]
  12. Shaffer, F.; Ginsberg, J.P. An Overview of Heart Rate Variability Metrics and Norms. Front. Public Health 2017, 5, 258. [Google Scholar] [CrossRef] [Scilit] [PubMed]
  13. Laborde, S.; Mosley, E.; Thayer, J.F. Heart Rate Variability and Cardiac Vagal Tone in Psychophysiological Research-Recommendations for Experiment Planning, Data Analysis, and Data Reporting. Front. Psychol. 2017, 8, 213. [Google Scholar] [CrossRef] [Scilit] [PubMed]
  14. Peltola, M.A. Role of editing of R-R intervals in the analysis of heart rate variability. Front. Physiol. 2012, 3, 148. [Google Scholar] [CrossRef] [Scilit]
  15. McNames, J.; Aboy, M. Reliability and accuracy of heart rate variability metrics versus ECG segment duration. Med. Biol. Eng. Comput. 2006, 44, 747–756. [Google Scholar] [CrossRef] [Scilit]
  16. Muñoz, M.L.; van Roon, A.; Riese, H.; Thio, C.; Oostenbroek, E.; Westrik, I.; de Geus, E.J.C.; Gansevoort, R.; Lefrandt, J.; Nolte, I.M.; et al. Validity of (Ultra-)Short Recordings for Heart Rate Variability Measurements. PLoS ONE 2015, 10, e0138921. [Google Scholar] [CrossRef] [Scilit]
Figure 1. Study design and paired surface-temperature observations. Panel (A) shows the fixed-order Day 1 non-BS comparator session and Day 2 BS Fine session, separated by a 9–15 h inter-session/wearing interval. Physiological signals were recorded only during the two discrete measurement sessions, not continuously during the intervening interval. The garment conditions were neither compositionally nor physically matched. Panels (B,C) show paired abdominal and leg surface temperatures, respectively, for all 10 participants. Thin gray lines connect individual observations; thick dark-blue lines and diamonds show group means. Annotations report paired mean changes, 95% CIs, raw p values, and Holm-adjusted p values.
Physiologia 06 00052 g001
Figure 2. Paired changes in eight standard HRV indices in the n = 10 analysis. Squares show Cohen’s dz, and horizontal lines show paired-participant bootstrap 95% CIs on the analysis scale. LF, HF, and total power were analyzed after natural-log transformation, with native effects reported as geometric mean ratios. The remaining outcomes were analyzed on the original scale, with native effects reported as paired mean differences. Exact two-sided sign-flip p values and Holm-adjusted p values are reported in Table 2; no HRV outcome retained support after Holm correction.
Physiologia 06 00052 g002
Table 1. Participant and study characteristics.
CharacteristicValue
Participants analyzed10
Participant descriptionAdults enrolled as healthy volunteers under the approved protocol
Age20s–50s
Sex3 men; 7 women
RecruitmentProtocol-permitted university/research-institute notices; participant-specific route not retained
Study designSingle-center, non-randomized, unblinded, uncontrolled, fixed-order, single-group before–after exploratory pilot
Prospectively specified primary outcomeNone; temperature and HRV were treated as exploratory outcome domains
Condition orderDay 1 non-BS comparator; Day 2 BS Fine for all participants
Garment conditionsCommercial general-purpose non-BS garments versus black-silica-containing BS Fine shirt and tights; not compositionally or physically matched
Inter-session/wearing interval9–15 h between the two discrete measurement sessions; not continuous recording
EnvironmentRoom temperature 22–25 °C; relative humidity 30–50%
Main analysisn = 10
Post hoc QC sensitivityn = 9, excluding one participant with a short post-wearing RRI segment
Note. Information described as not retained was not reconstructed or imputed. Garment-fiber descriptions were based on retained garment labels.
Table 2. Paired surface-temperature and HRV results in the n = 10 analysis.
OutcomenBeforeAfterPaired Effect Estimate (95% CI)Cohen’s dzRaw pHolm-Adjusted p
Abdomen surface temperature (°C)1034.965 ± 0.59834.972 ± 0.703+0.007 °C (−0.447 to 0.462)0.010.9720.972
Leg surface temperature (°C)1032.284 ± 0.93132.952 ± 1.635+0.668 °C (−0.001 to 1.336)0.710.0500.100
Mean RRI (ms)10937.0 ± 122.8927.8 ± 86.9−9.2 ms (−85.0 to 66.6)−0.090.9571.000
LF power (ms2)10278.2 [207.0, 1262.6]557.9 [279.1, 708.8]GMR 1.22 (0.71 to 2.09)0.260.4201.000
HF power (ms2)10150.1 [96.2, 489.7]282.3 [199.8, 396.3]GMR 1.45 (0.91 to 2.31)0.570.1000.797
Total power (ms2)10377.4 [322.7, 1675.2]899.3 [538.3, 1156.3]GMR 1.27 (0.81 to 2.00)0.380.2601.000
SDNN (ms)1056.4 ± 28.358.3 ± 21.1+1.8 ms (−11.4 to 15.1)0.100.7681.000
RMSSD (ms)1040.0 ± 36.142.9 ± 27.1+2.9 ms (−6.6 to 12.4)0.220.5001.000
CVRR (%)105.89 ± 2.616.26 ± 2.21+0.38% (−0.95 to 1.70)0.200.5471.000
pNN50 (%)1014.02 ± 19.1715.24 ± 14.10+1.22% (−5.60 to 8.05)0.130.7071.000
Note. Values are mean ± SD for approximately symmetric original-scale outcomes and median [Q1, Q3] for LF, HF, and total power. GMR denotes the geometric mean ratio (after/before) estimated on the natural-log scale. Temperature p values are from paired t tests; HRV p values are from exact paired sign-flip tests. Holm correction was applied separately within the temperature and HRV paired-change families. CI, confidence interval; dz, standardized paired effect.
Disclaimer/Publisher’s Note: The statements, opinions and data contained in all publications are solely those of the individual author(s) and contributor(s) and not of MDPI and/or the editor(s). MDPI and/or the editor(s) disclaim responsibility for any injury to people or property resulting from any ideas, methods, instructions or products referred to in the content.