Article

The Multifunctional Exchangers SLC26A7 and SLC26A9 Are Also Sodium-Dependent Transporters of Inorganic Phosphate


Laboratory of Molecular Toxicology, Department of Biochemistry and Cell and Molecular Biology, University of Zaragoza, E50013 Zaragoza, Spain
*
Authors to whom correspondence should be addressed.
Physiologia 2026, 6(2), 39; https://doi.org/10.3390/physiologia6020039
Submission received: 8 March 2026 / Revised: 24 May 2026 / Accepted: 26 May 2026 / Published: 29 May 2026

Abstract

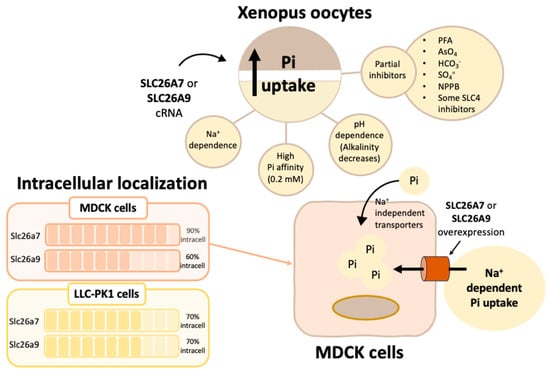
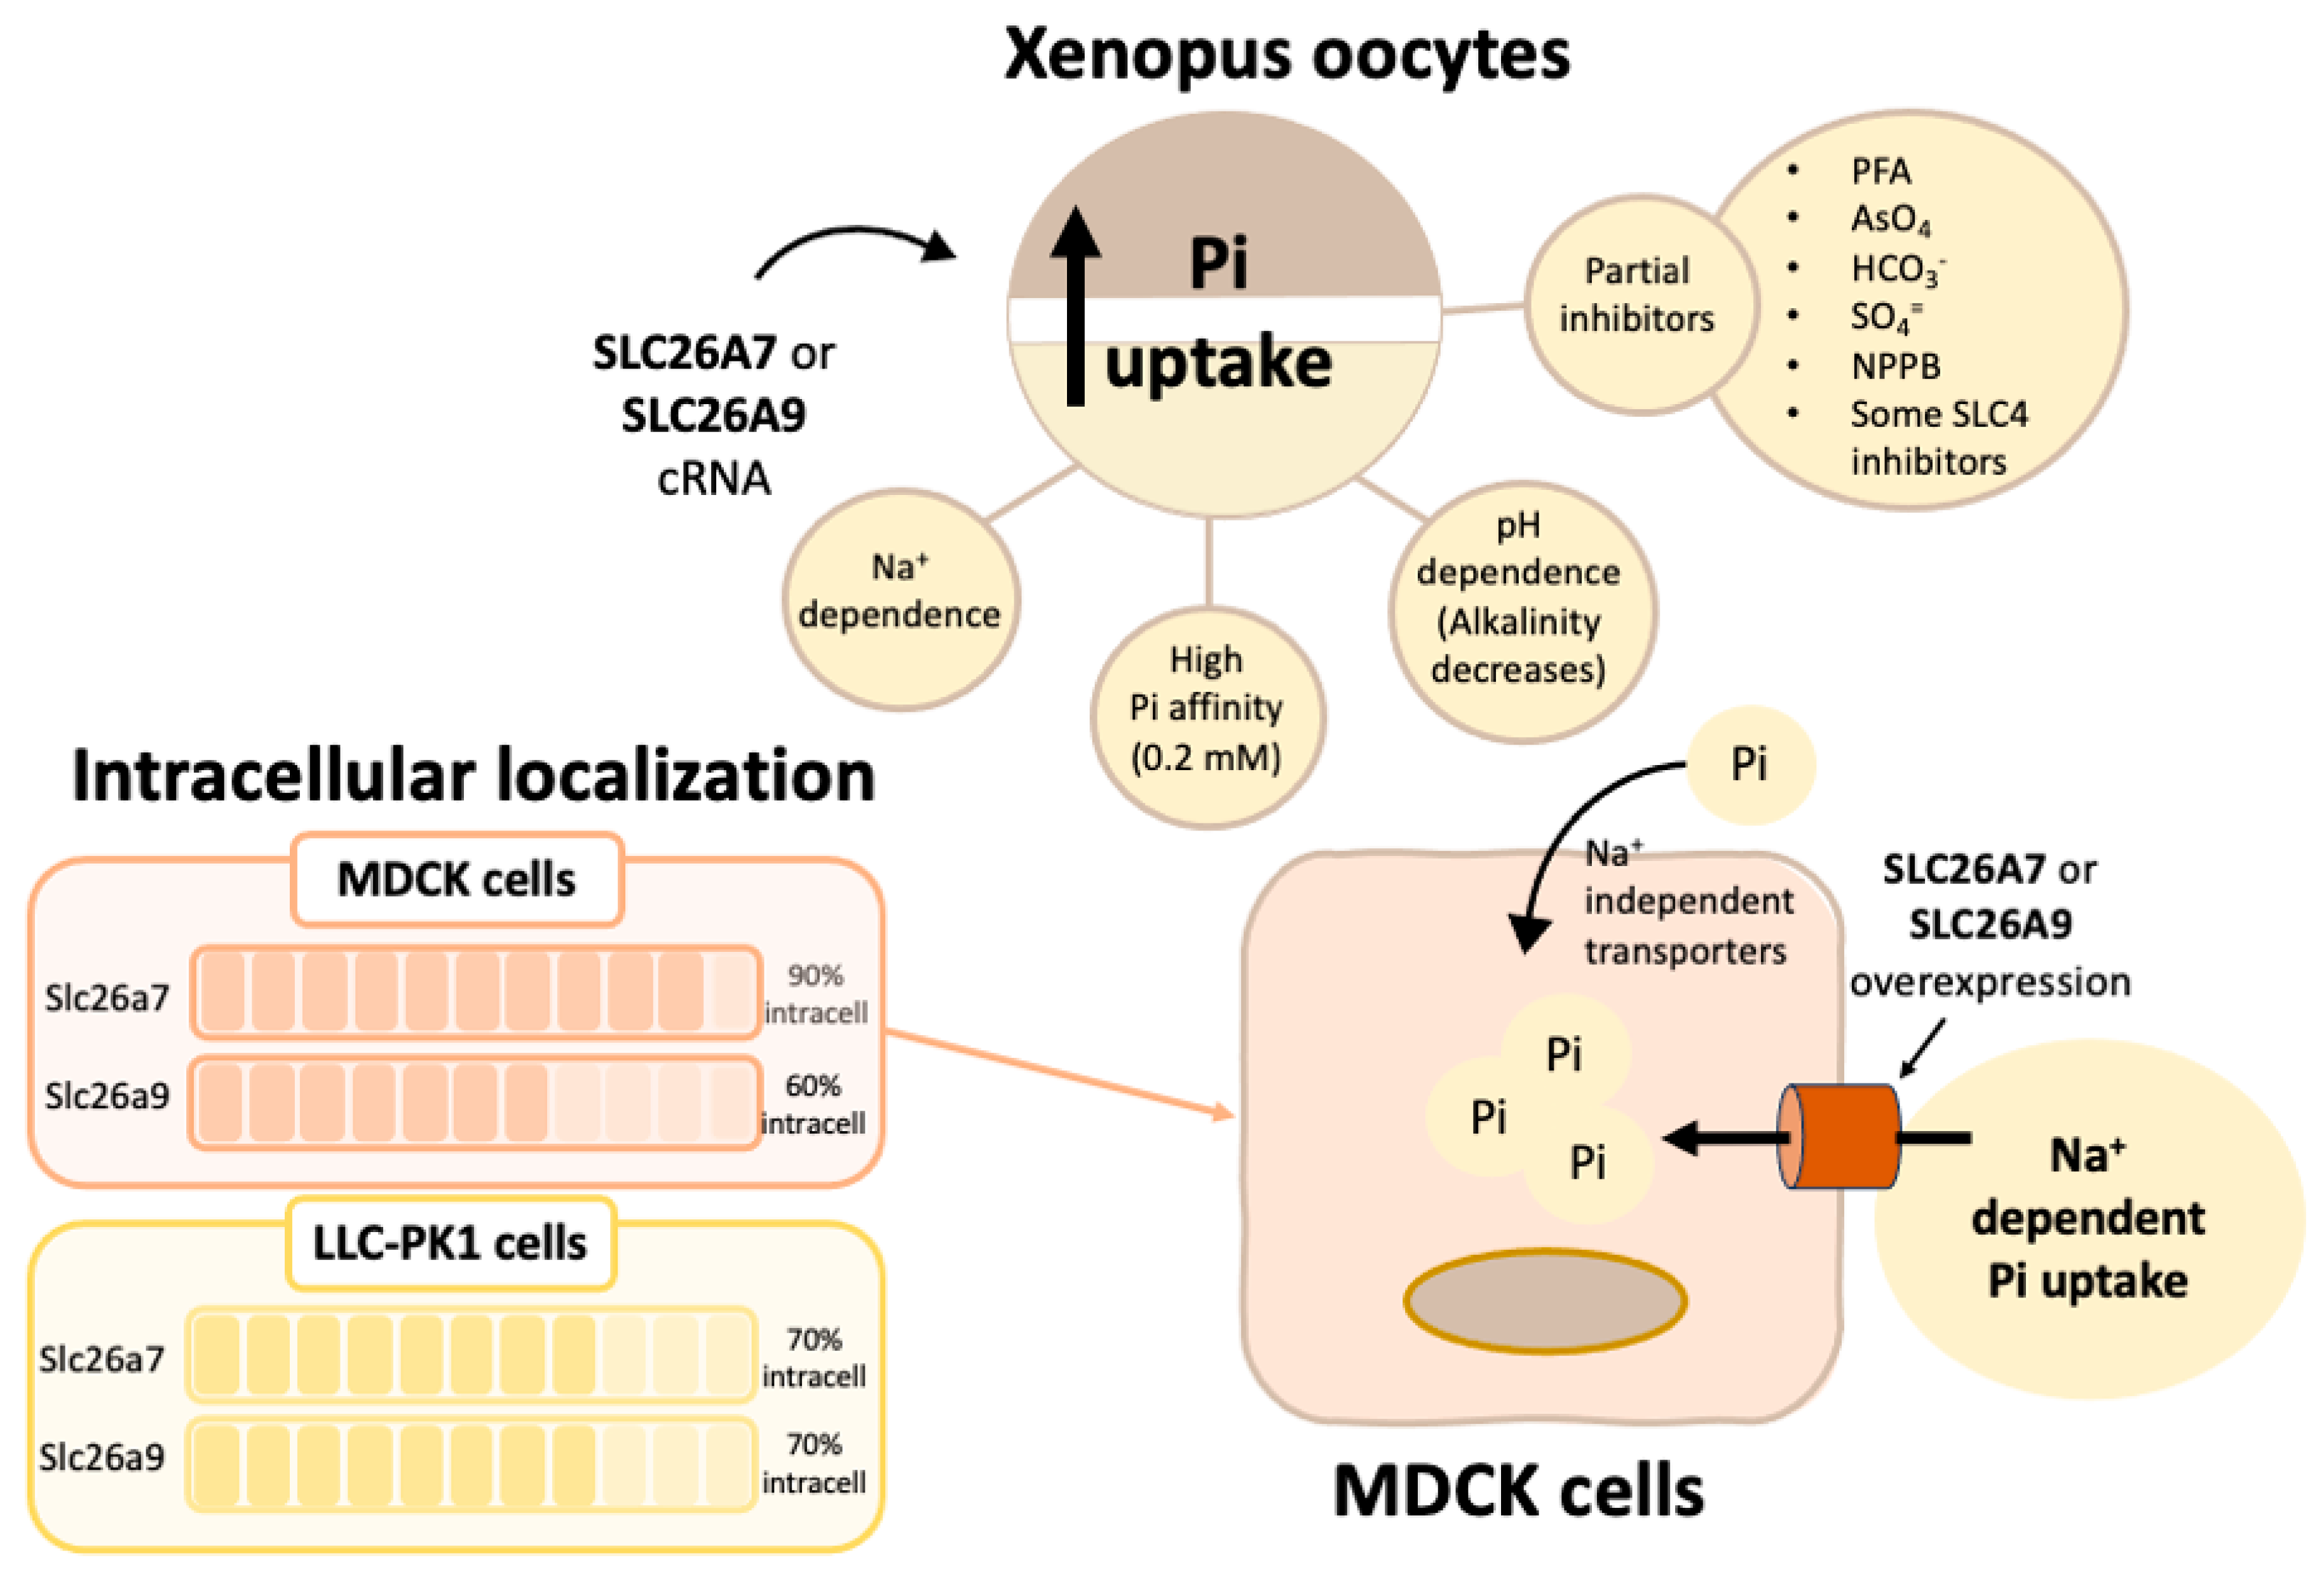
Background: The regulation of inorganic phosphate (Pi) homeostasis is predominantly mediated by the Pi transporters belonging to the SLC34 and SLC20 families of solute carriers. However, not all Pi handling can be explained by these transporters. In this study, we sought to identify novel Pi transporters in accordance with prior findings on inhibition patterns. Methods: We have performed a functional screening of new Pi carriers using the Xenopus laevis oocyte expression system, focusing on the SLC26 family, and corroboration in cell culture. Results: Both SLC26A7 and SLC26A9 have been shown to express sodium-activated Pi uptakes with approximately 200 µmol/L Pi affinity. In both cases, Pi transport is inhibited by increasing pH and by phosphonoformate, arsenate, bicarbonate, sulfate, the chloride channel inhibitor 5-nitro-2-[(3-phenylpropyl)amino]-benzoate, and several transport site and translocation inhibitors of bicarbonate exchangers. In addition, the CFTR inhibitor GlyH-101 and the SLC4 inhibitors DIDS, SITS, and phloretin exhibited partial inhibition of SLC26A9-mediated Pi uptake. The endogenous expressions of both SLC26A7 and SLC26A9 in the renal cell lines LLC-PK1 and MDCK were primarily intracellular, colocalizing with endosomes, lysosomes, and the trans-Golgi network markers. Conversely, plasma membrane expression was found to be minimal. Pi transport in MDCK cells was sodium-independent, but when either SLC26A7 or SLC26A9 was overexpressed, sodium-activated Pi uptake was observed, along with increased expressions of SLC26A7 or SLC26A9 in the plasma membrane. Conclusions: Sodium-activated Pi transport is a novel function of the SLC26A7 and SLC26A9 multifunctional anion transporters. Further research is necessary to ascertain the relevance to Pi homeostasis in vivo.

Graphical Abstract

1. Introduction

The anionic properties of inorganic phosphate (Pi) hinder the free flux of the Pi molecules through the cell membranes. To overcome this limitation, all cells utilize plasma membrane Pi transporters, which, in turn, are the targets of Pi homeostasis regulators. For more information on this field, please refer to references [1,2]. The predominant and most thoroughly characterized influx transporters are members of the SLC34 and SLC20 families. To date, XPR1 is the sole carrier that has demonstrated Pi efflux activity [3], in addition to an electroneutral 2 H 2 P O 4 / H P O 4 = exchange mechanism that was elegantly postulated in the basolateral membrane of the nephron [4].
The functional characteristics of the SLC34 and SLC20 families exhibit significant disparities in terms of substrate specificity, pH dependence, and sodium:Pi stoichiometries. Additionally, there are differences in the mechanisms that regulate them and Pi homeostasis [2]. However, even though the SLC34 and SLC20 families account for the majority of the Pi transport changes during homeostatic regulations, certain transport responses do not correspond to the changes in the abundance of both family members e.g., [5,6].
Pi transport systems that do not involve SLC34 or SLC20 transporters include the following: pH gradient-stimulated Pi transport in the kidney [7]; Pi/anion exchangers such as the blood-brain barrier and vascular smooth muscle cells [8,9] or the anion-exchanger-1 (AE1), also known as SLC4A1 or Band III, in erythrocytes [10]; the SLC37 family of sugar-phosphate/Pi exchangers [11]; the SLC17 family of glutamate/organic anion transporters [12]; and a sodium-dependent Pi transport that is sensitive to the stilbene derivatives [9]. The present study, in conjunction with our previous publication on Caco2BBE cells [5], suggests the potential involvement of anion exchangers in Pi transport. We focused on the SLC26 family of multifunctional anion exchangers to identify additional Pi transporters, using heterologous expression in Xenopus laevis oocytes. We were therefore seeking sodium-independent, anion exchangers that could handle Pi. In this study, we present the identification of SLC26A7 and SLC26A9 as sodium-activated Pi transporters (for reviews on these two members see references [13,14]). These transporters are part of a family of multifunctional transporters that show exchange activity of chloride, bicarbonate, hydroxyl, and sulfate ions, as well as chloride, bicarbonate, and iodide channel/transport activities. They show critical roles in various aspects of renal physiology and pathology, as well as in gastric parietal cells [15], iodide transport in thyrocytes [16], association with the cystic fibrosis transmembrane conductance regulator (CFTR) and functional similarity [17], etc. SLC26A9 is more widely expressed, with higher levels observed in the lung and stomach [18]. Furthermore, C l / H C O 3 exchangers, such as SLC26A7 and SLC26A9, have been shown to play a broader role in physiological processes than initially expected. These exchangers are modulated by nitric oxide synthase activity and nitric oxide, impacting not only inflammatory processes but also epithelial transport and pH regulation [19]. Our work represents a preliminary step in incorporating a new role (Pi transport) into these proteins. Further research is needed to determine their relevance in vivo and their specific roles in Pi homeostasis control.

2. Results

2.1. SLC26A7 and SLC26A9 Express Sodium-Dependent Pi Transport in Xenopus Oocytes

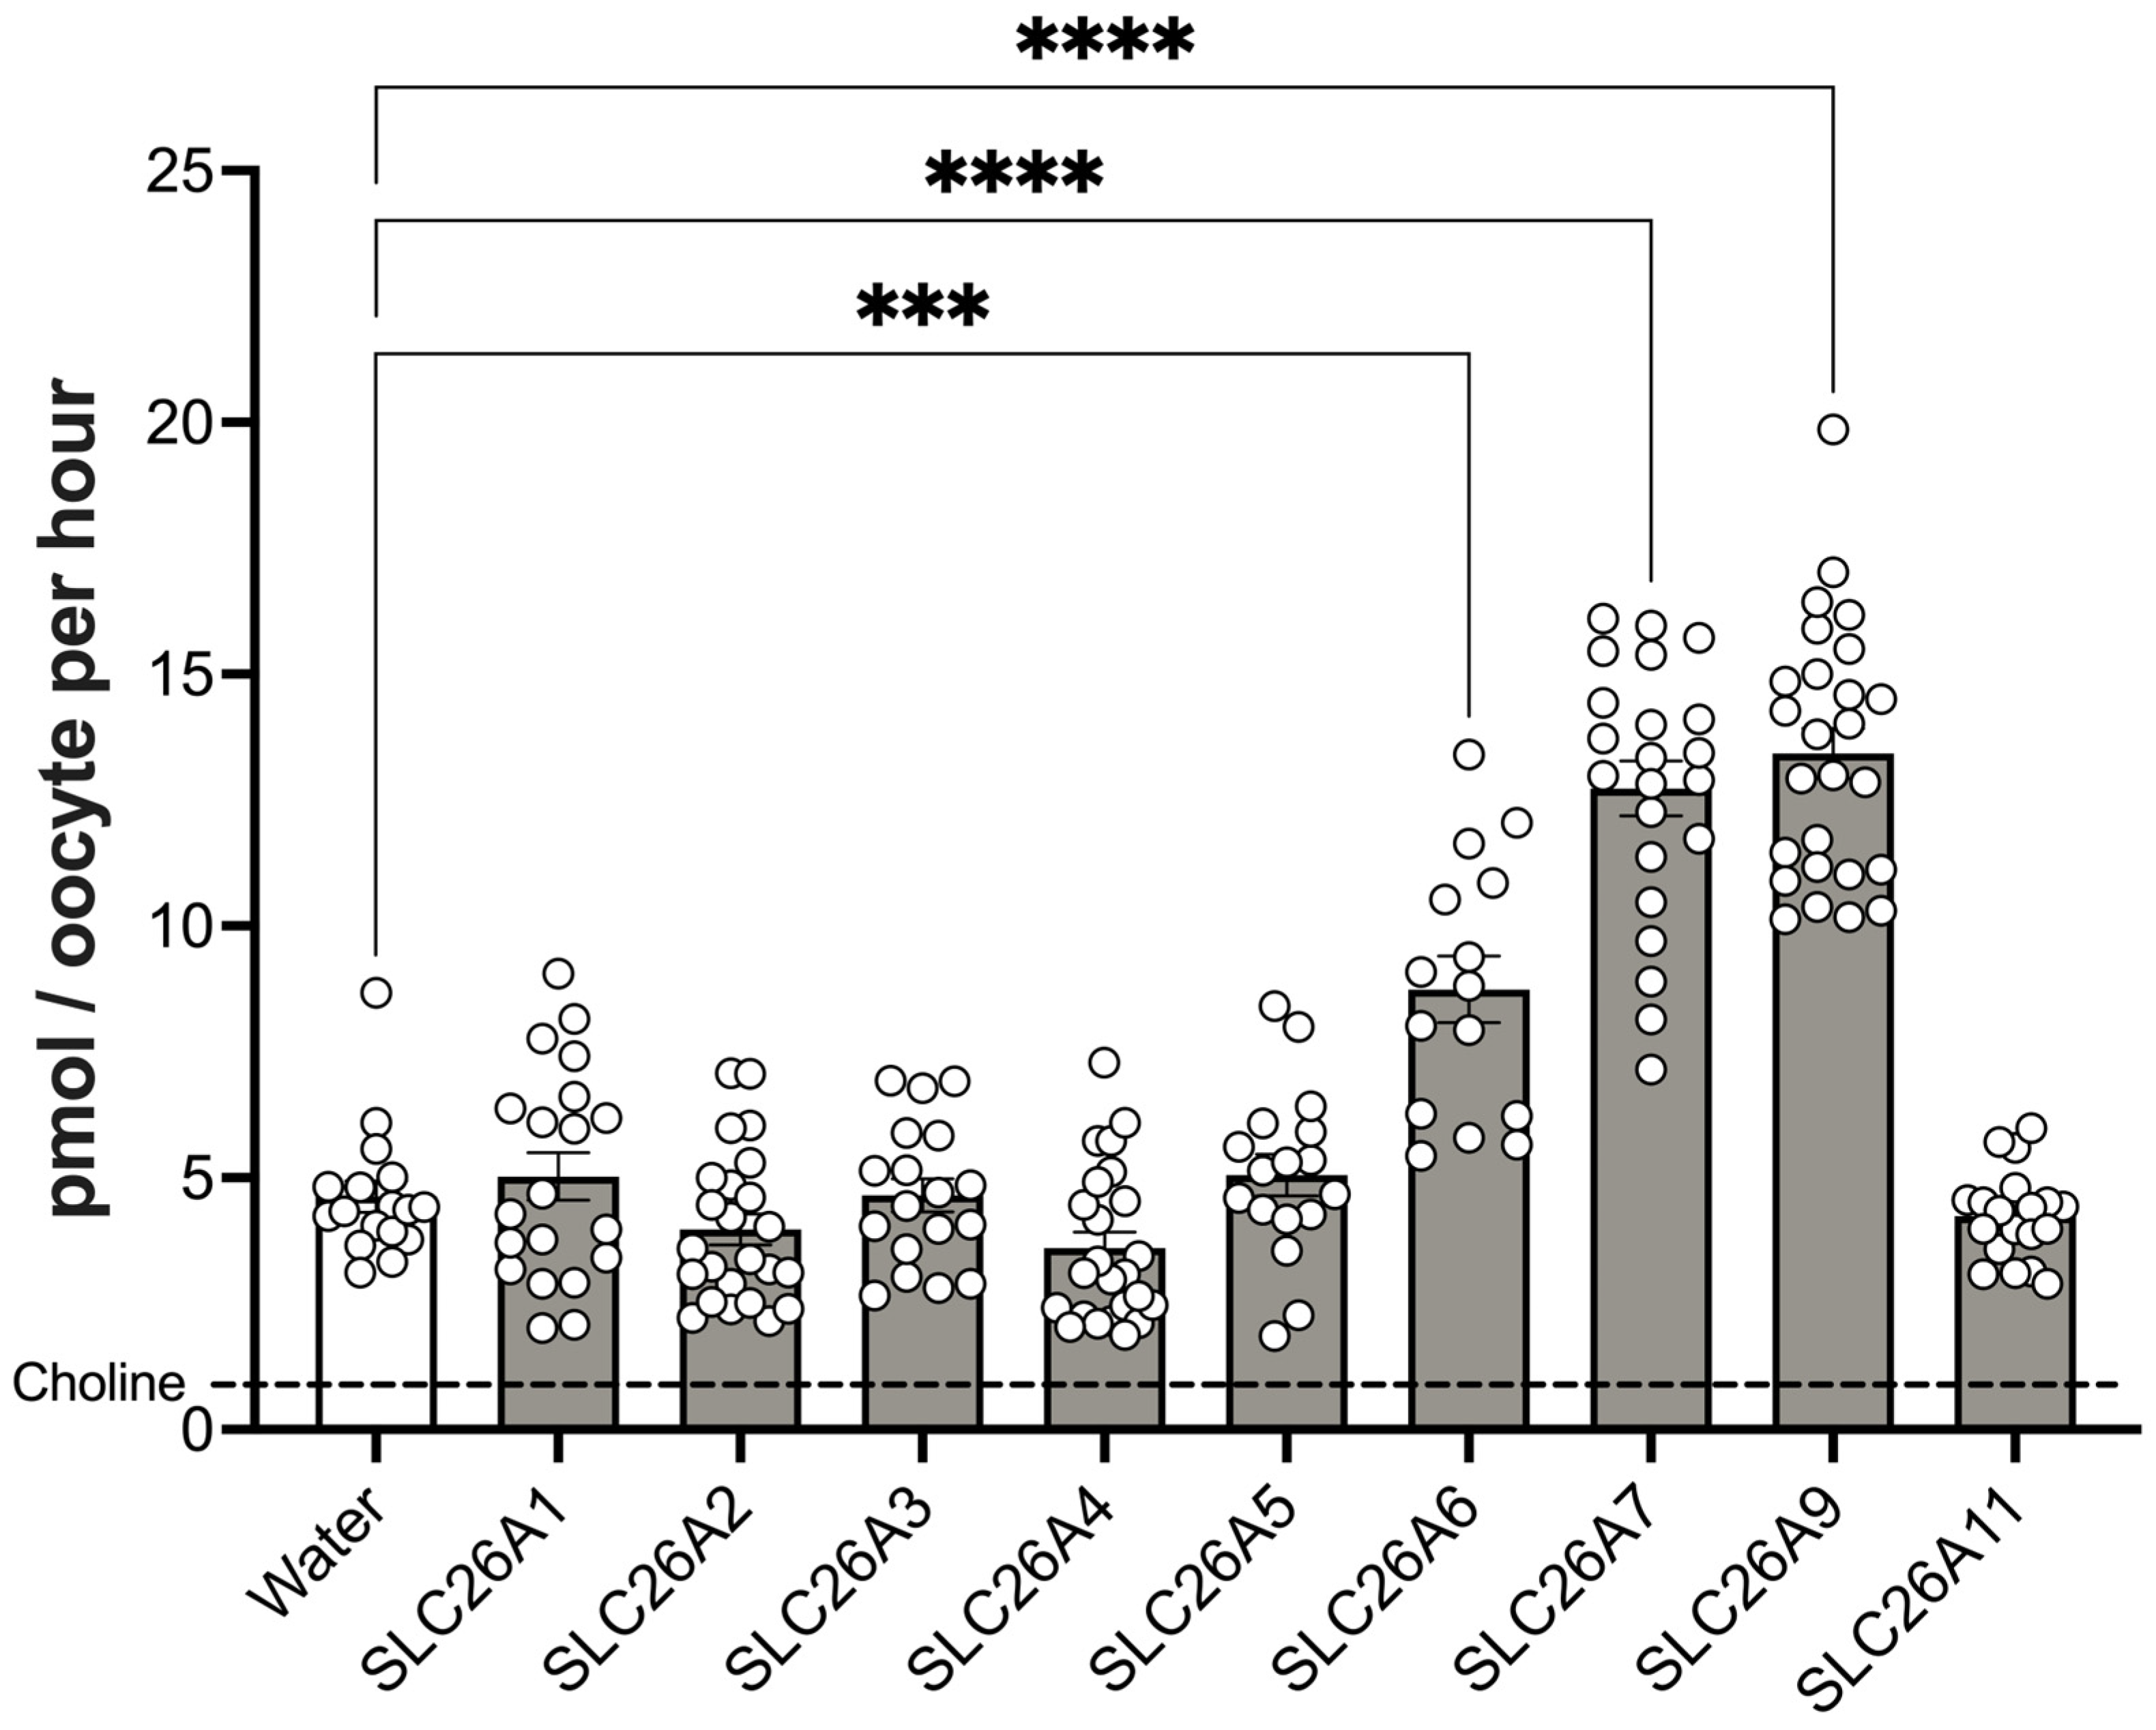
The SLC26 family members were assayed for Pi transport expression in Xenopus laevis oocytes. As illustrated in Figure 1, SLC26A6, SLC26A7 and SLC26A9 were the only transporters that significantly increased uptake above the water injected level (2–2.5 times), and this only occurred in the presence of sodium chloride. The dashed line in the graph represents the sodium-independent Pi uptake level, which was comparable to the water-injected oocytes in all cases. The present work will focus on the findings related to SLC26A7 and SLC26A9. A separate study will be devoted to an in-depth examination of SLC26A6 and its distinctive characteristics, including sodium activation.
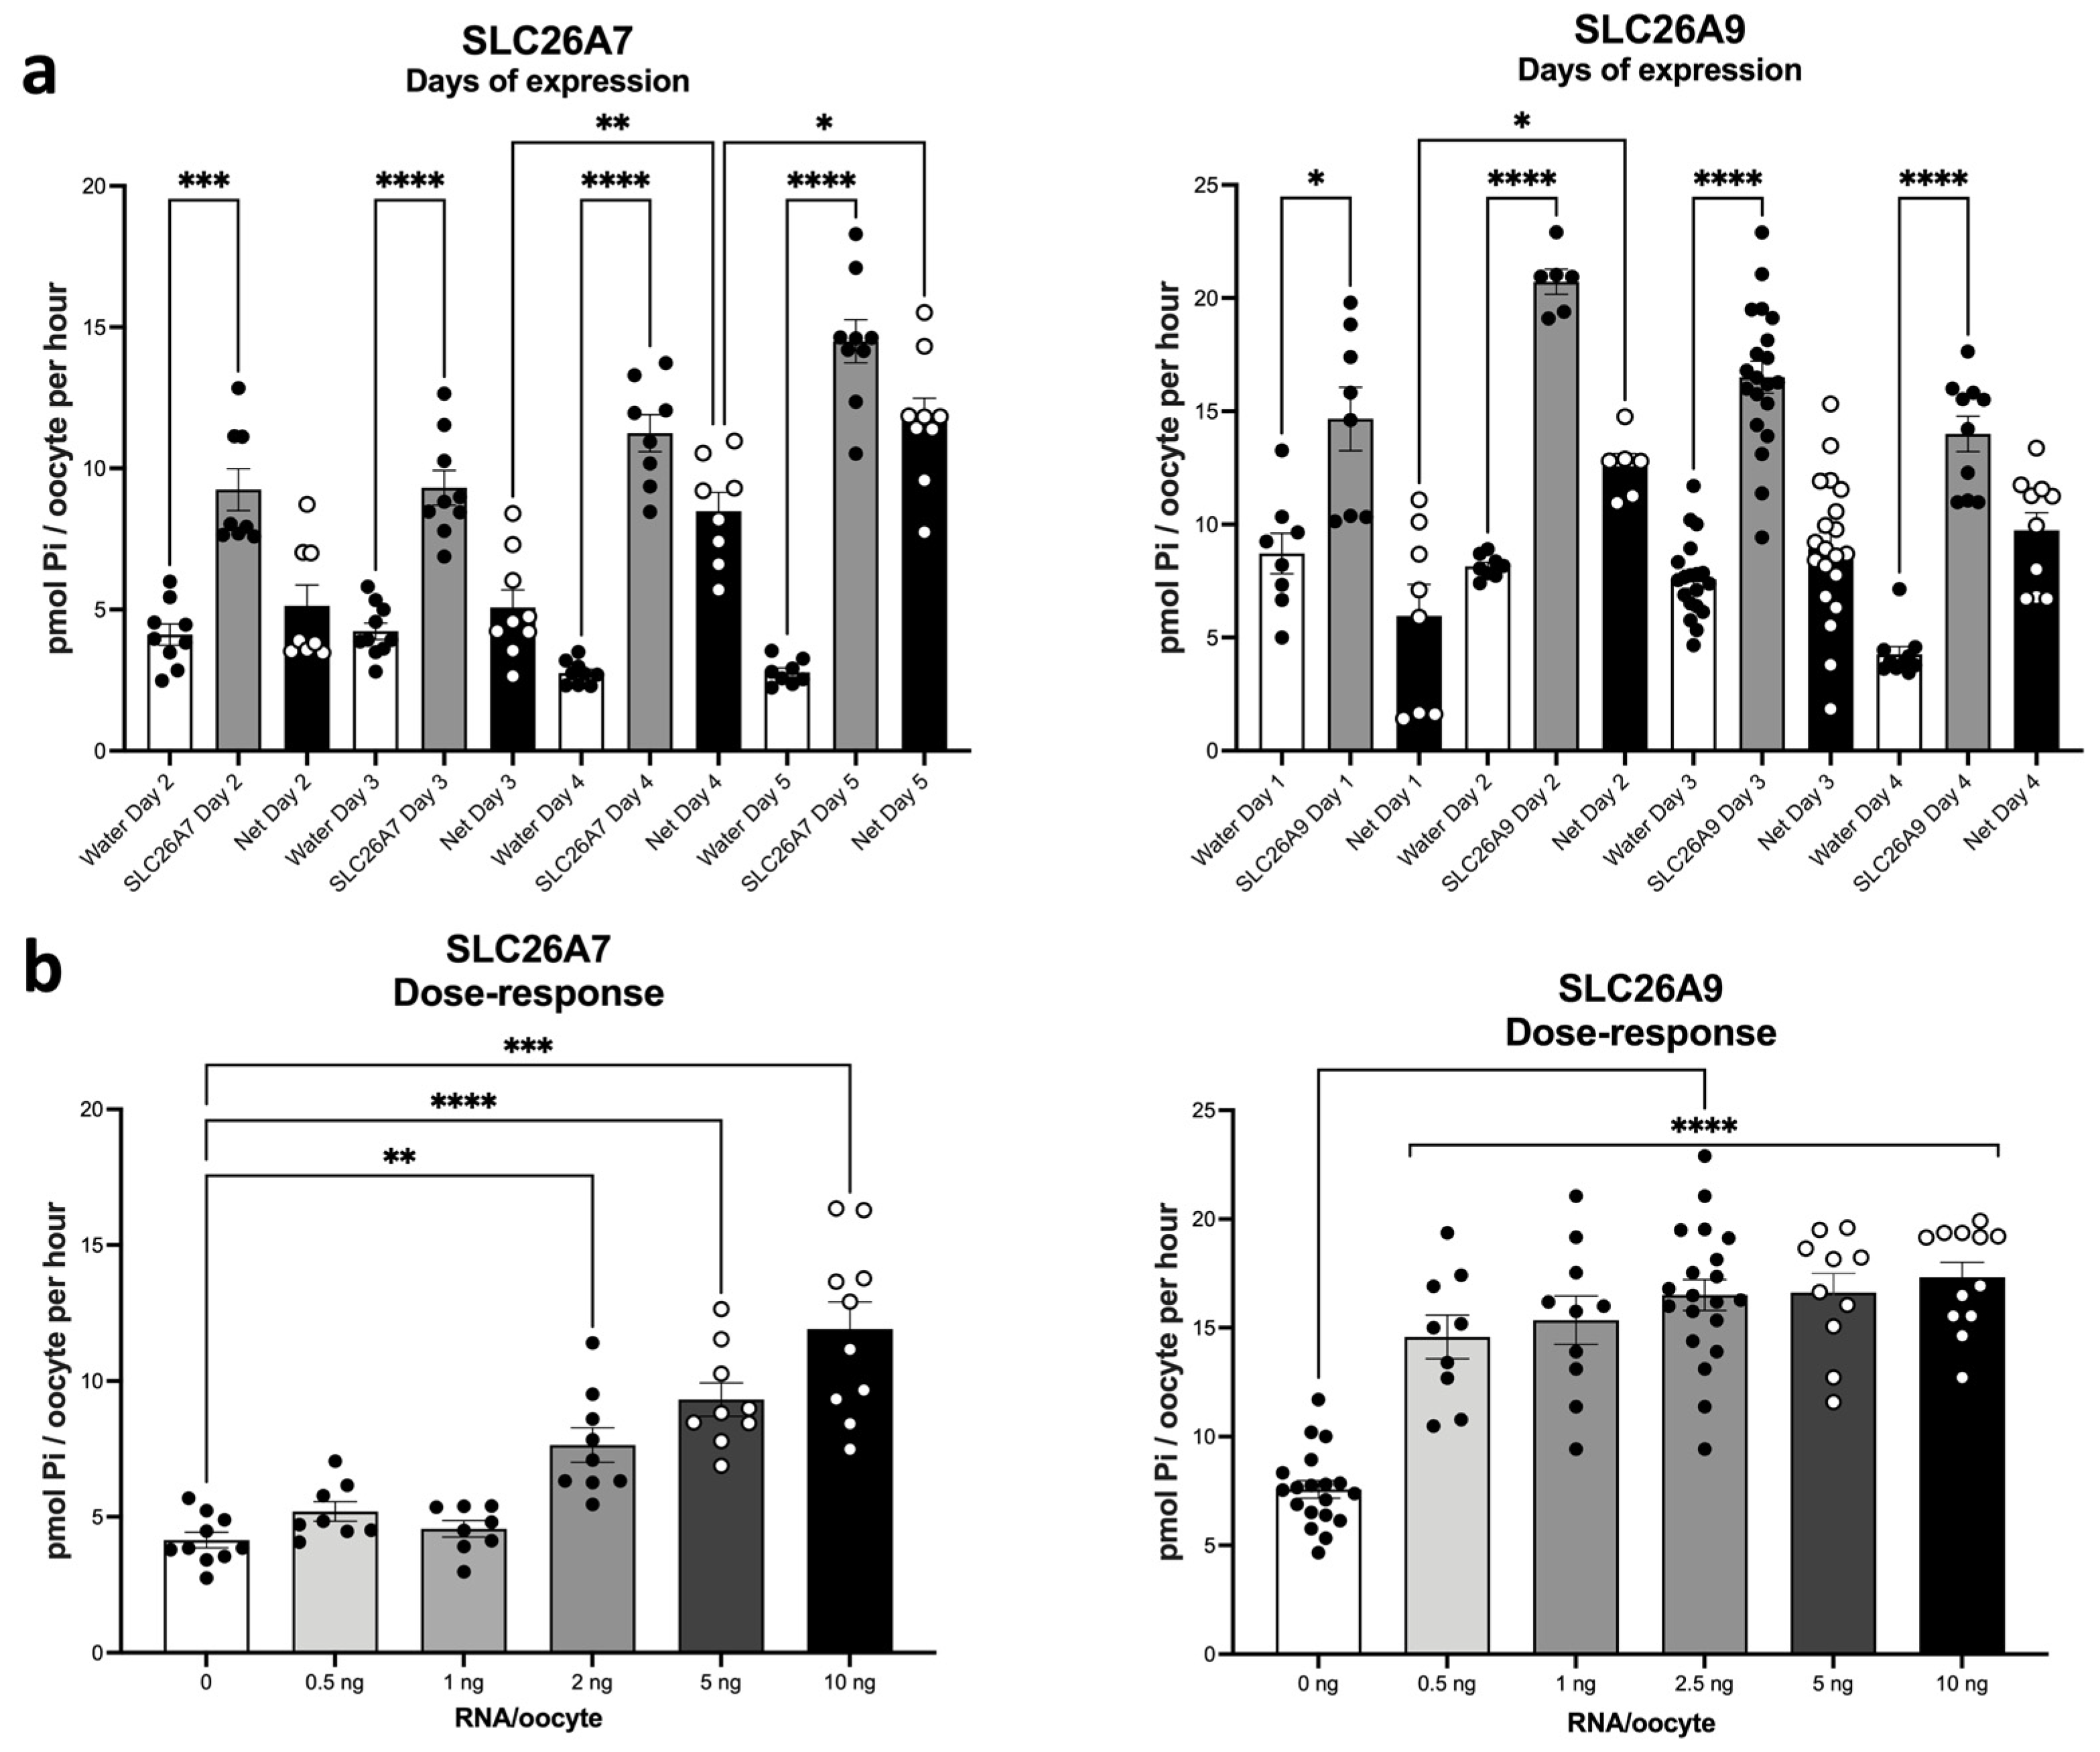
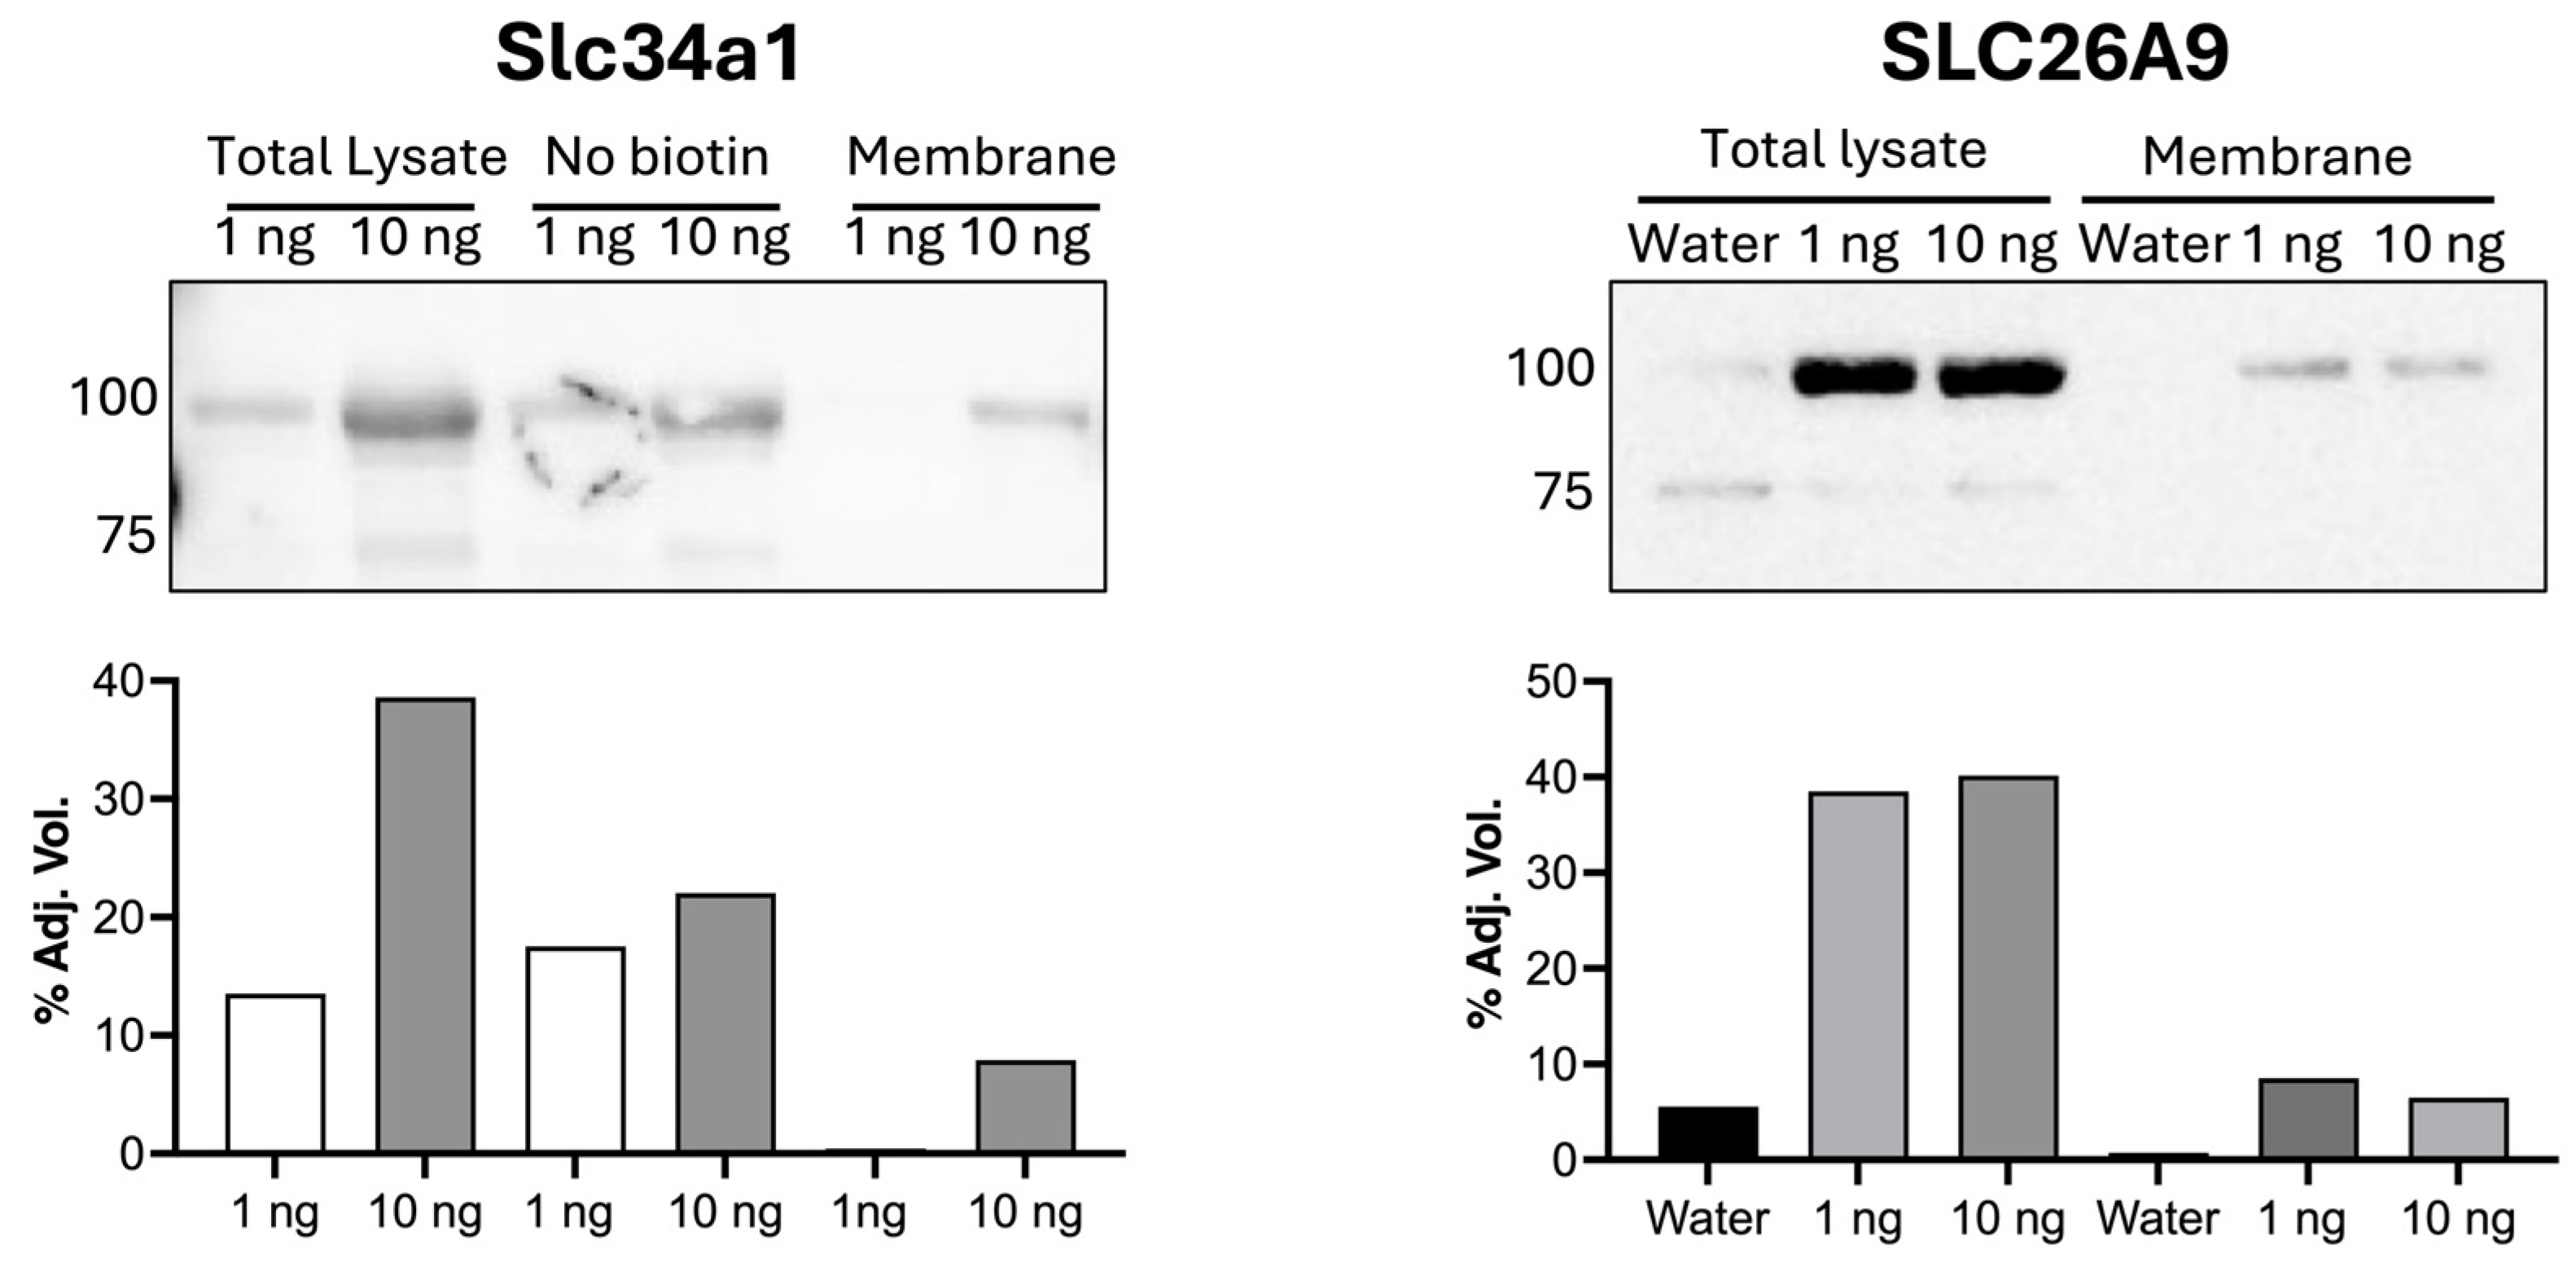
The injection of 5 ng of cRNA from each of the two anion carriers resulted in a higher level of Pi transport compared to the water injection control group. For SLC26A9, a significant increase was observed at 24 h post-injection, reaching a maximum at 48 h. In contrast, SLC26A7 exhibited a gradual yet steady increase, with no indication of saturation over the five-day assay period (Figure 2a). The increase in Pi uptake was found to be 2–3 times above the endogenous level, depending on the experiment, with saturation occurring at low amounts of cRNA injected. This phenomenon was more evident in SLC26A9 (Figure 2b). To further clarify the mechanism of low and early expression saturation in comparison to classical (SLC34 and SLC20) Pi transporters, immunoblots of SLC26A9 were conducted using total versus biotinylated membrane proteins of oocytes injected with either 1 or 10 ng cRNA (Figure 3). As a positive control, some oocytes were similarly injected with the Pi transporter NaPi2a. The NaPi2a expression levels were found to be more pronounced in the 10-ng-injected oocytes compared to the 1-ng-injected oocytes, both in terms of total lysate and biotinylated plasma membrane extracts. However, no such differences were observed in the SLC26A9 expression levels, which exhibited comparable band intensities between the two injection groups.

2.2. Kinetic Analysis of Expressed Transport

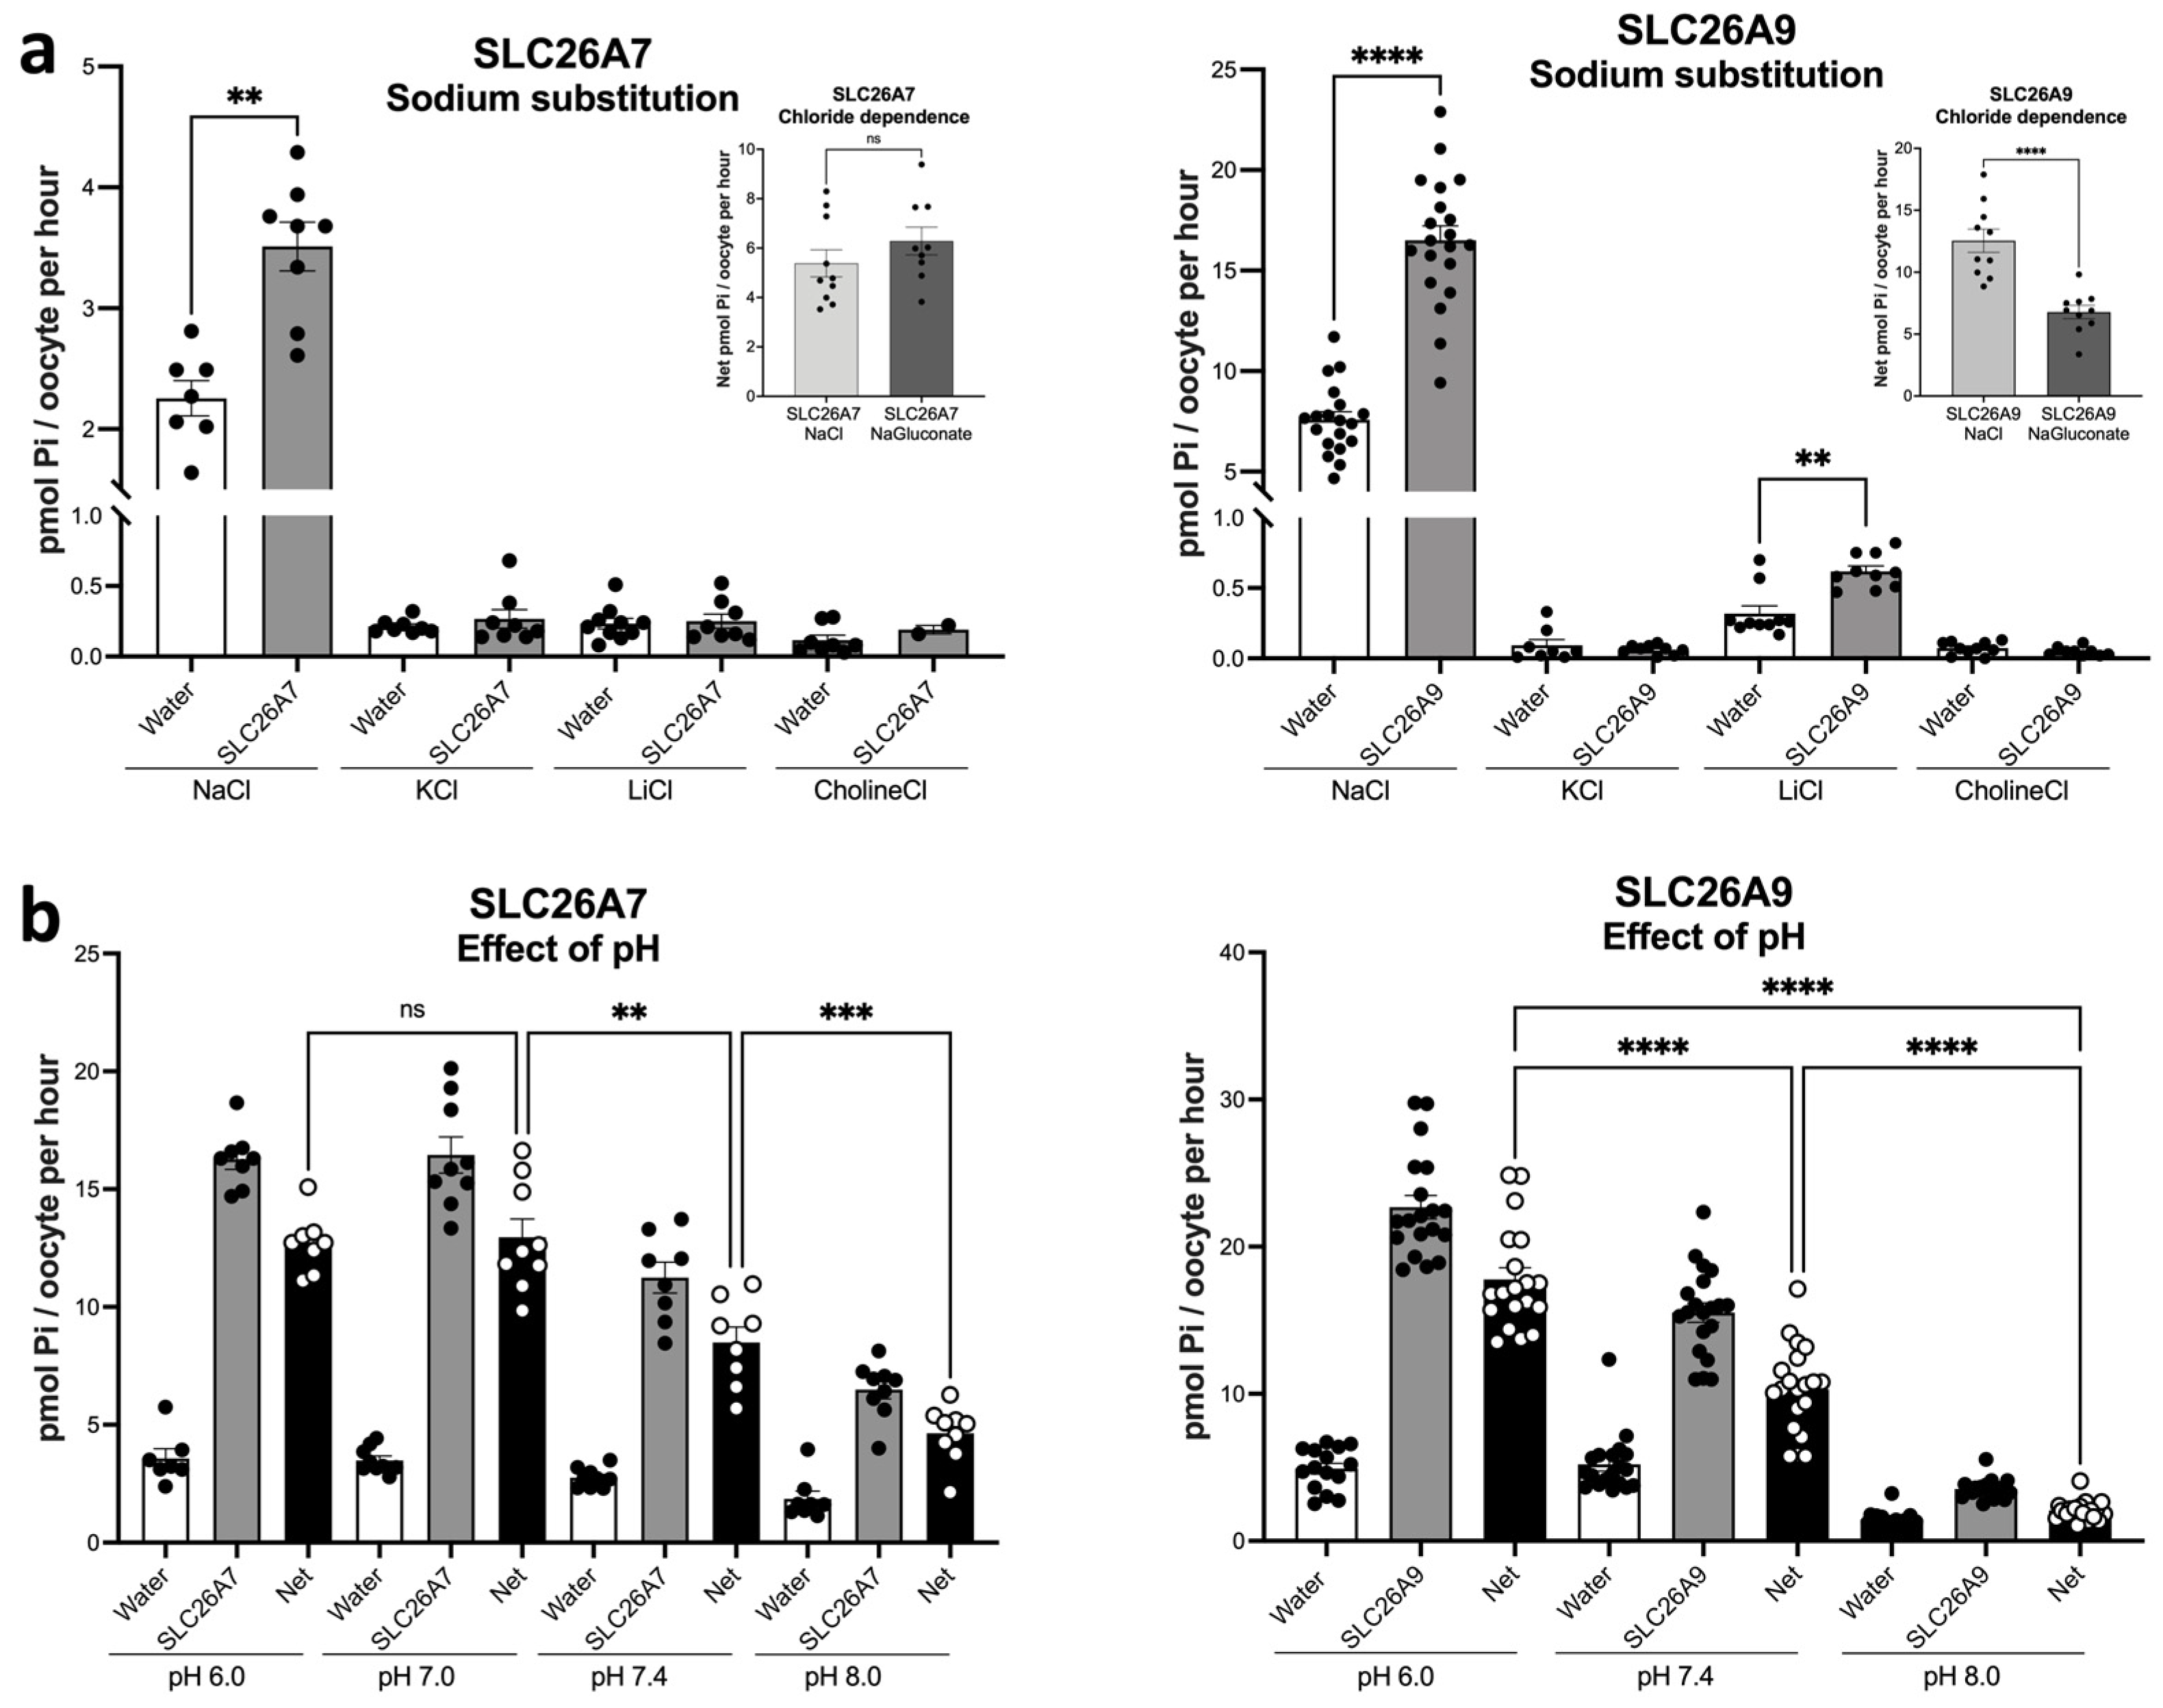
The modest increases in Pi uptake expressed by SLC26A7 and SLC26A9 (see Figure 2a,b) were found to be strictly sodium-dependent (see Figure 4a). Regarding the role of chloride, only SLC26A9 exhibited partial dependence, as evidenced by the substitution of chloride with gluconate, resulting in a partial decrease in Pi uptake (Figure 4a, inset). Furthermore, the expression of Pi transport by either SLC26A7 or SLC26A9 was found to be dependent on external pH. As with the SLC20 family of Pi transporters, the uptake of Pi was maximal at pH 6.0 and exhibited a decline with increasing alkalinity, thereby suggesting a preference for monovalent Pi (Figure 4b).
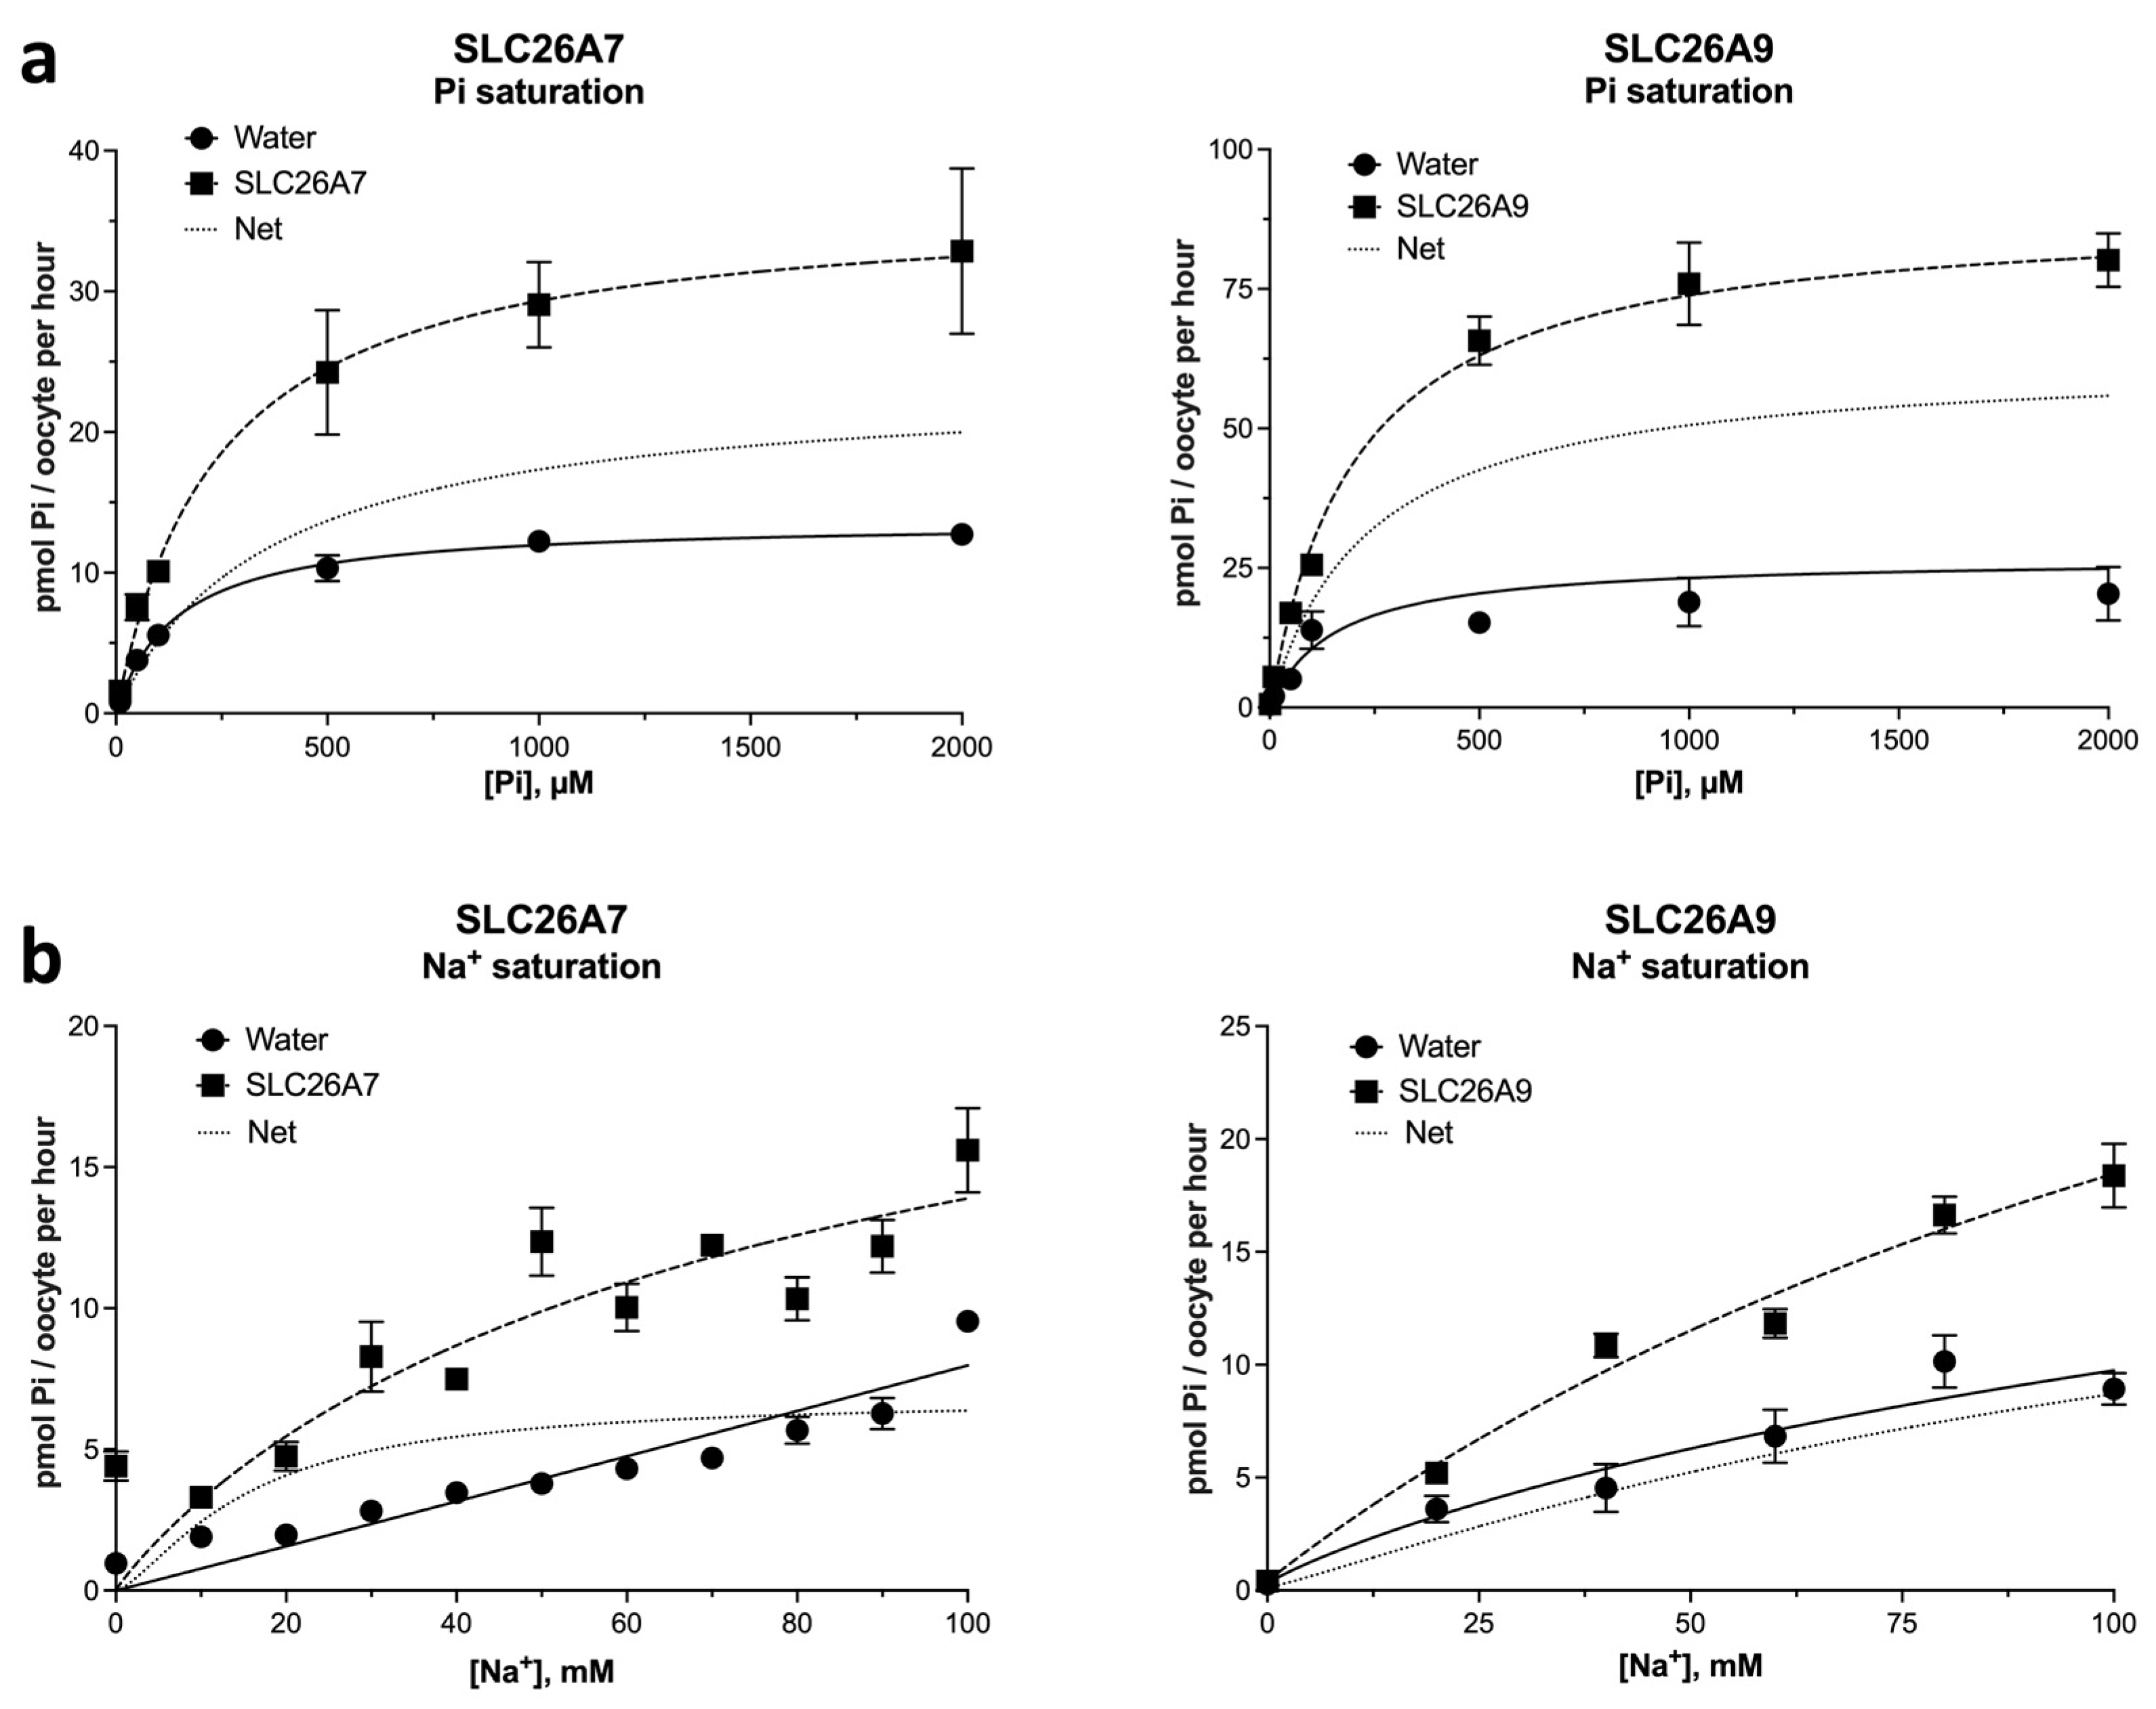
To understand the characteristics of the Pi uptake mediated by SLC26A7 and SLC26A9, we performed Pi saturation uptake experiments. The data obtained revealed Michaelis-Menten saturation curves in both transporters (Figure 5a). Curve fitting to data to a Michaelis equation with non-linear regression analyses found slightly lower affinities for Pi than those of SLC34 and SLC20 Pi transporters in the net expressed transport: The levels of Pi were found to be 300 and 220 µM for SLC26A7 and SLC26A9, respectively.
The kinetics of sodium activation was also analyzed in similar experiments (Figure 5b). The low expression level and the necessity of three parameter determinations resulted in a limited degree of accuracy in the results of the net expressed transport. The Hill coefficients of SLC26A7 and SLC26A9, measuring 1.4 and 1.1, respectively, suggest Na:Pi stoichiometries of 1:1. However, the affinities for sodium appeared to be higher in SLC26A7 (16 mM sodium Km) than in SLC26A9 (128 mM sodium Km).

2.3. Inhibition Pattern of Pi Transport in Xenopus Oocytes

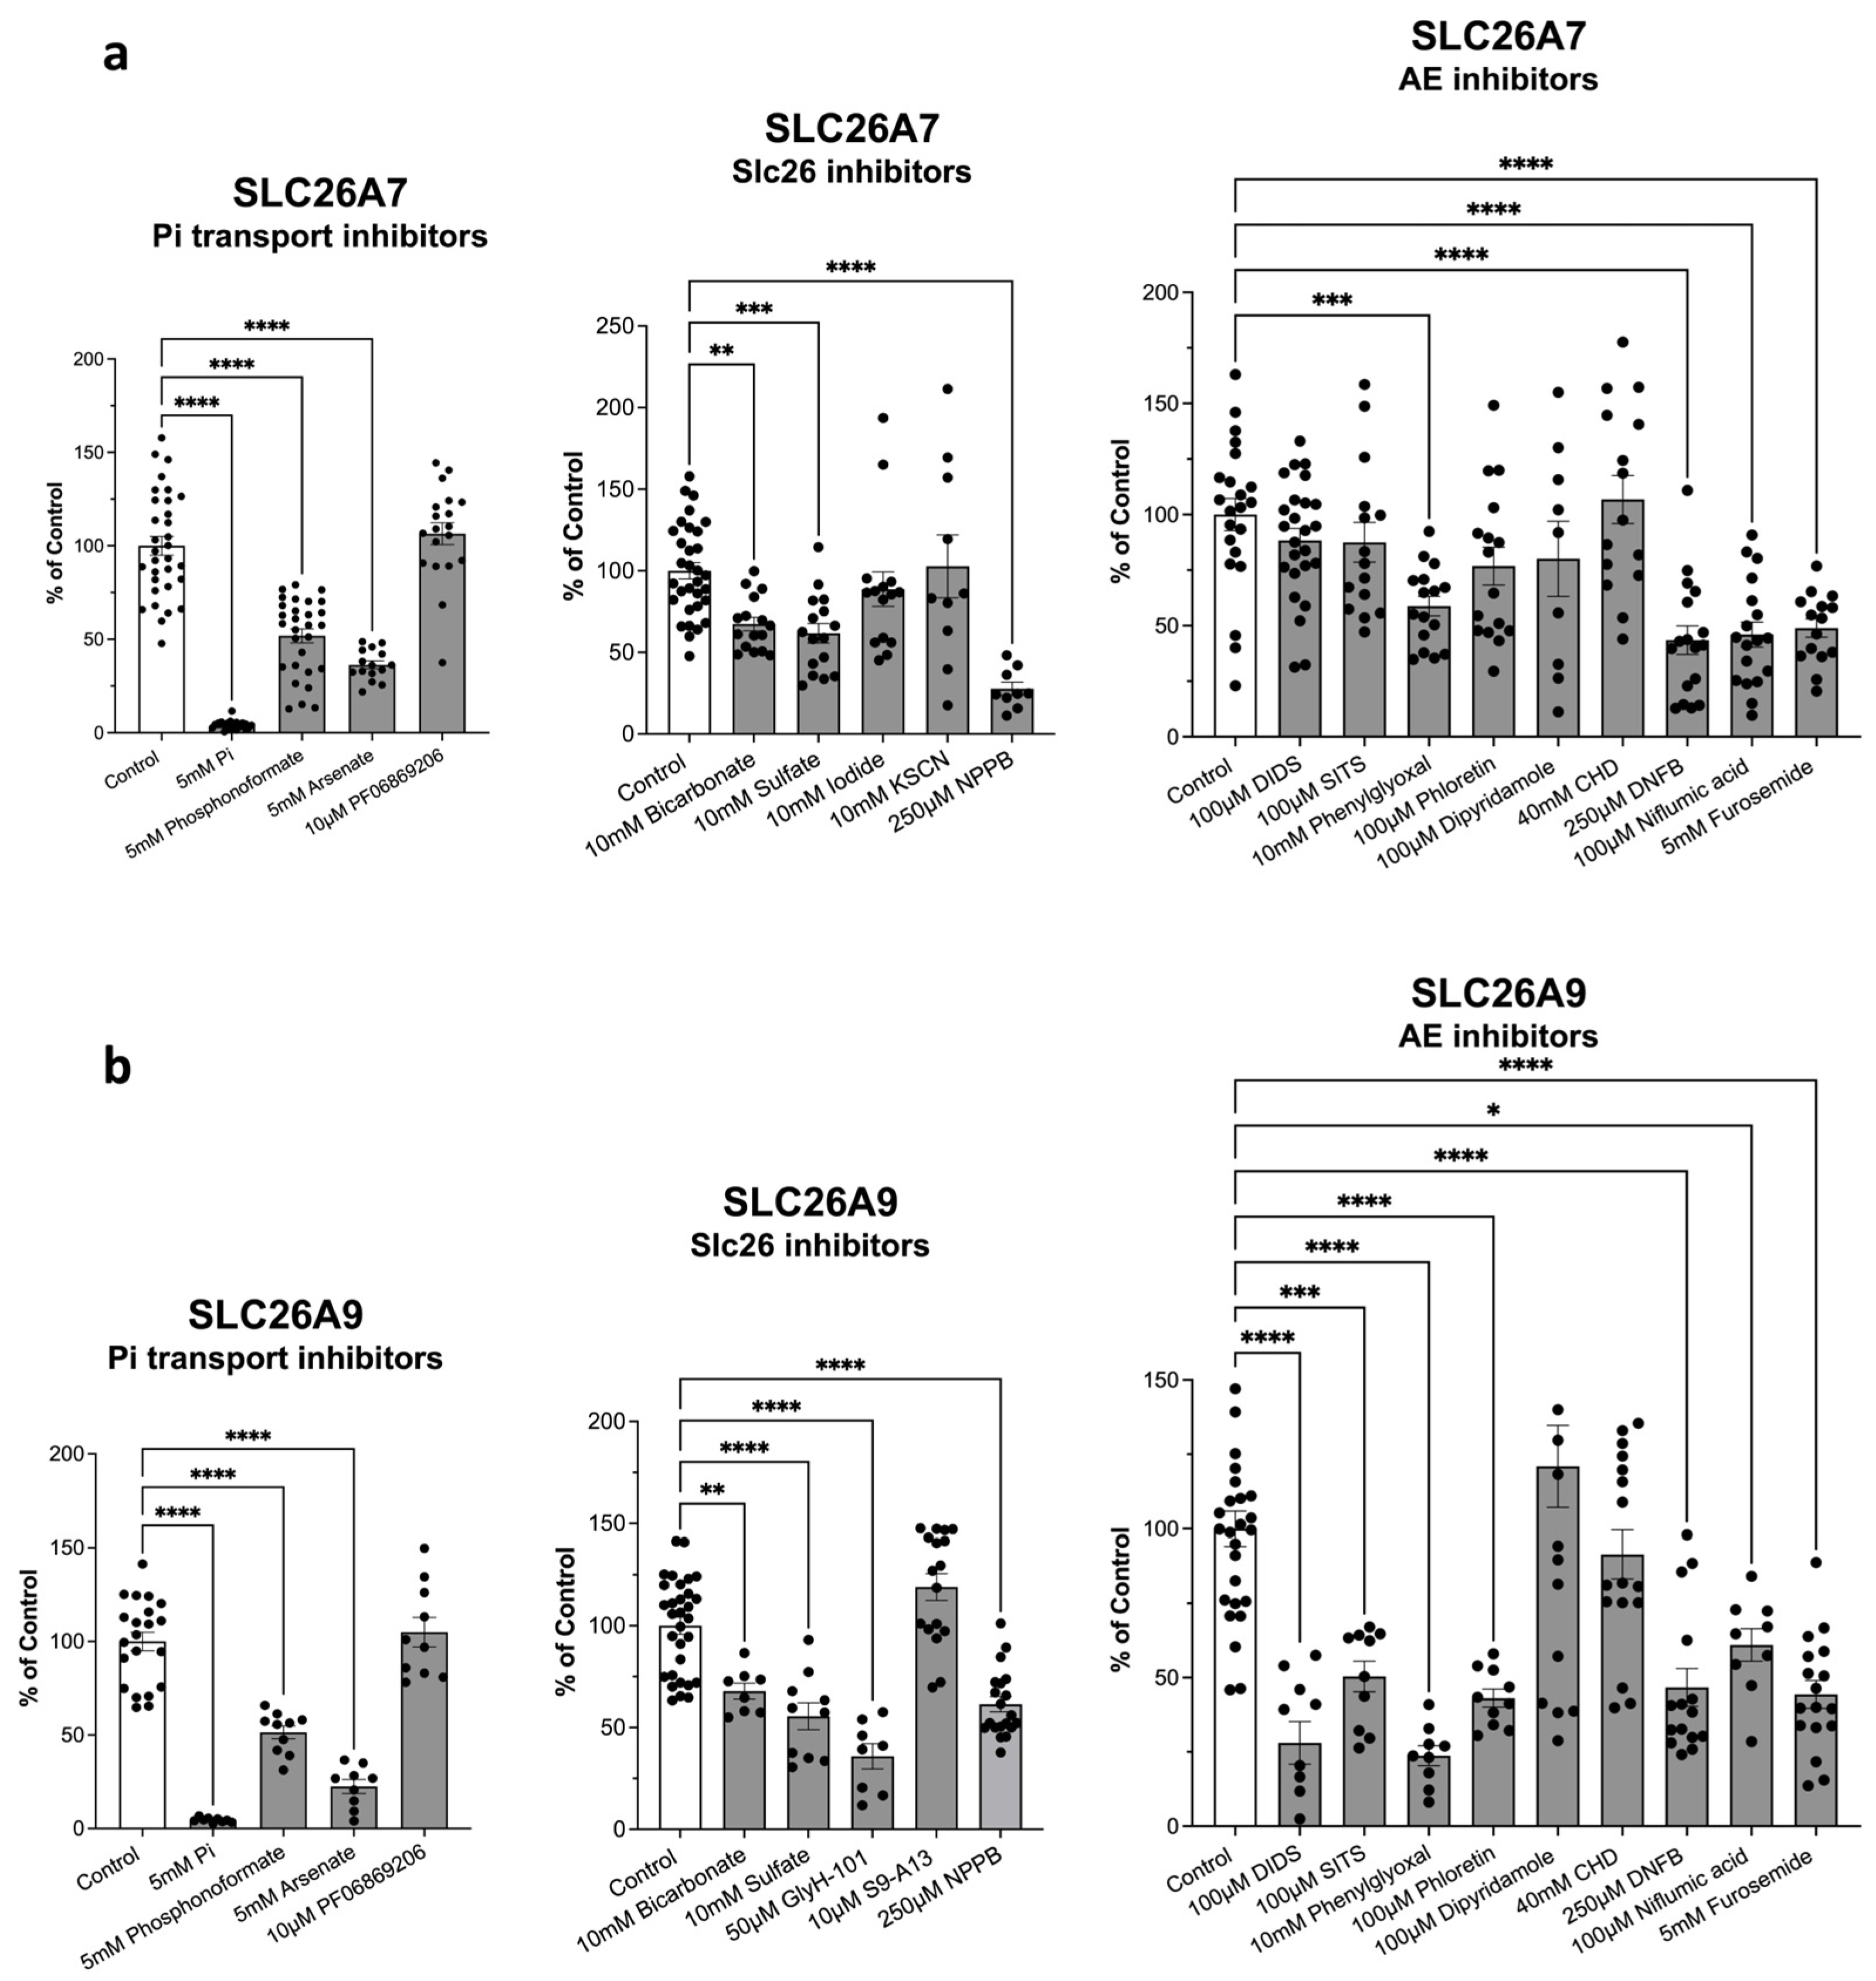
The inhibition pattern on SLC26A7- and SLC26A9-expressed Pi transport is shown in Figure 6a and Figure 6b, respectively. A series of classical phosphate transporter inhibitors were assayed (see left panels of Figure 6), including phosphonoformate and arsenate sodium salts [20]. These salts partially inhibited the expressed Pi transport by either SLC26A7 or SLC26A9. However, the presence of 10 µM PF-06869206, a selective NaPi2a inhibitor, did not yield any observable effects [21]. The positive control, Pi itself, exhibited a complete and competitive inhibition of Pi uptake. The use of a mere six minutes of incubation time guarantees initial velocity of uptake and precludes molecular events such as hormone-independent endocytosis of Pi transporters [22] or unconventional mechanisms of endocytosis such as massive endocytosis (MEND) [23].
The present study encompassed the use of various inhibitors and substrates of the SLC26 family of transporters (middle panels). Bicarbonate and sulfate, which are also substrates of different families, exhibited partial inhibition of both SLC26A7 and SLC26A9-expressed Pi transport. The CFTR blocker GlyH-101, which also inhibits SLC26A9-mediated chloride current [17], as well as the specific SLC26A9 inhibitor S9-A13 [24], were also tested. Only GlyH-101 showed significant but incomplete inhibition of SLC26A9 Pi transport activity. The 5-nitro-2-[3-(phenylpropyl)amino]-benzoic acid (NPPB) is a chloride channel blocker and inhibitor of SLC26A7-mediated chloride uptake stimulated by histamine [15]. It exhibited significant inhibitory effects on SLC26A7-mediated Pi uptake, with weaker effects on SLC26A9-mediated uptake. SLC26A7 has also been identified as a transporter for iodide in the thyroid gland [25] and a thiocyanate channel in the retinal pigment epithelium [26]. However, neither 10 mM sodium iodide nor potassium thiocyanate affected SLC26A7-mediated Pi transport.
Given the observed inhibitory effect of bicarbonate and the established dependence of SLC26A9 on chloride, a series of anion exchange (AE) inhibitors were evaluated. These inhibitors were selected based on their molecular mechanism of the AE1 inhibition [27,28,29]. As illustrated in the central panels of Figure 6 for transport site inhibitors [27], phenylglyoxal exhibited a partial inhibition effect on both SLC26A7- and SLC26A9-mediated Pi transport. In contrast, 4,4′-diisothiocyanostilbene-2,2′-disulfonate (DIDS), 4-acetamido-4′-isothiocyanato-stilben-2,2′-disulfonate (SITS), and phloretin did not affect SLC26A7, but only SLC26A9-expressed Pi transport.
Furthermore, we employed a variety of channel blockers and translocation inhibitors of anion-exchangers (see Figure 6, panels on the right). The channel blockers dipiridamole and 1,2-cyclohexanedione (CHD) [28] did not affect either SLC26A7 or SLC26A9-mediated Pi uptake. In contrast, the translocation inhibitors 2,4-dinitrofluorobenzene (DNFB), niflumic acid, and furosemide [29] all exhibited a partial inhibition of SLC26A7 and SLC26A9-mediated Pi transport.
As indicated in the legend of Figure 6, only net values are shown to reduce the complexity of the panels. However, it is important to note that only a few drugs have been found to affect the endogenous Pi transport of the oocytes and the transport expressed by SLC26A7 and A9: Arsenate, bicarbonate, NPPB, GlyH-101, phenylglyoxal, DNFB and niflumic acid. In contrast, phosphonoformate, sulfate, DIDS, SITS, phloretin and furosemide did not inhibit the endogenous Pi transport.

2.4. Expression of SLC26A7 and SLC26A9 in Cell Lines

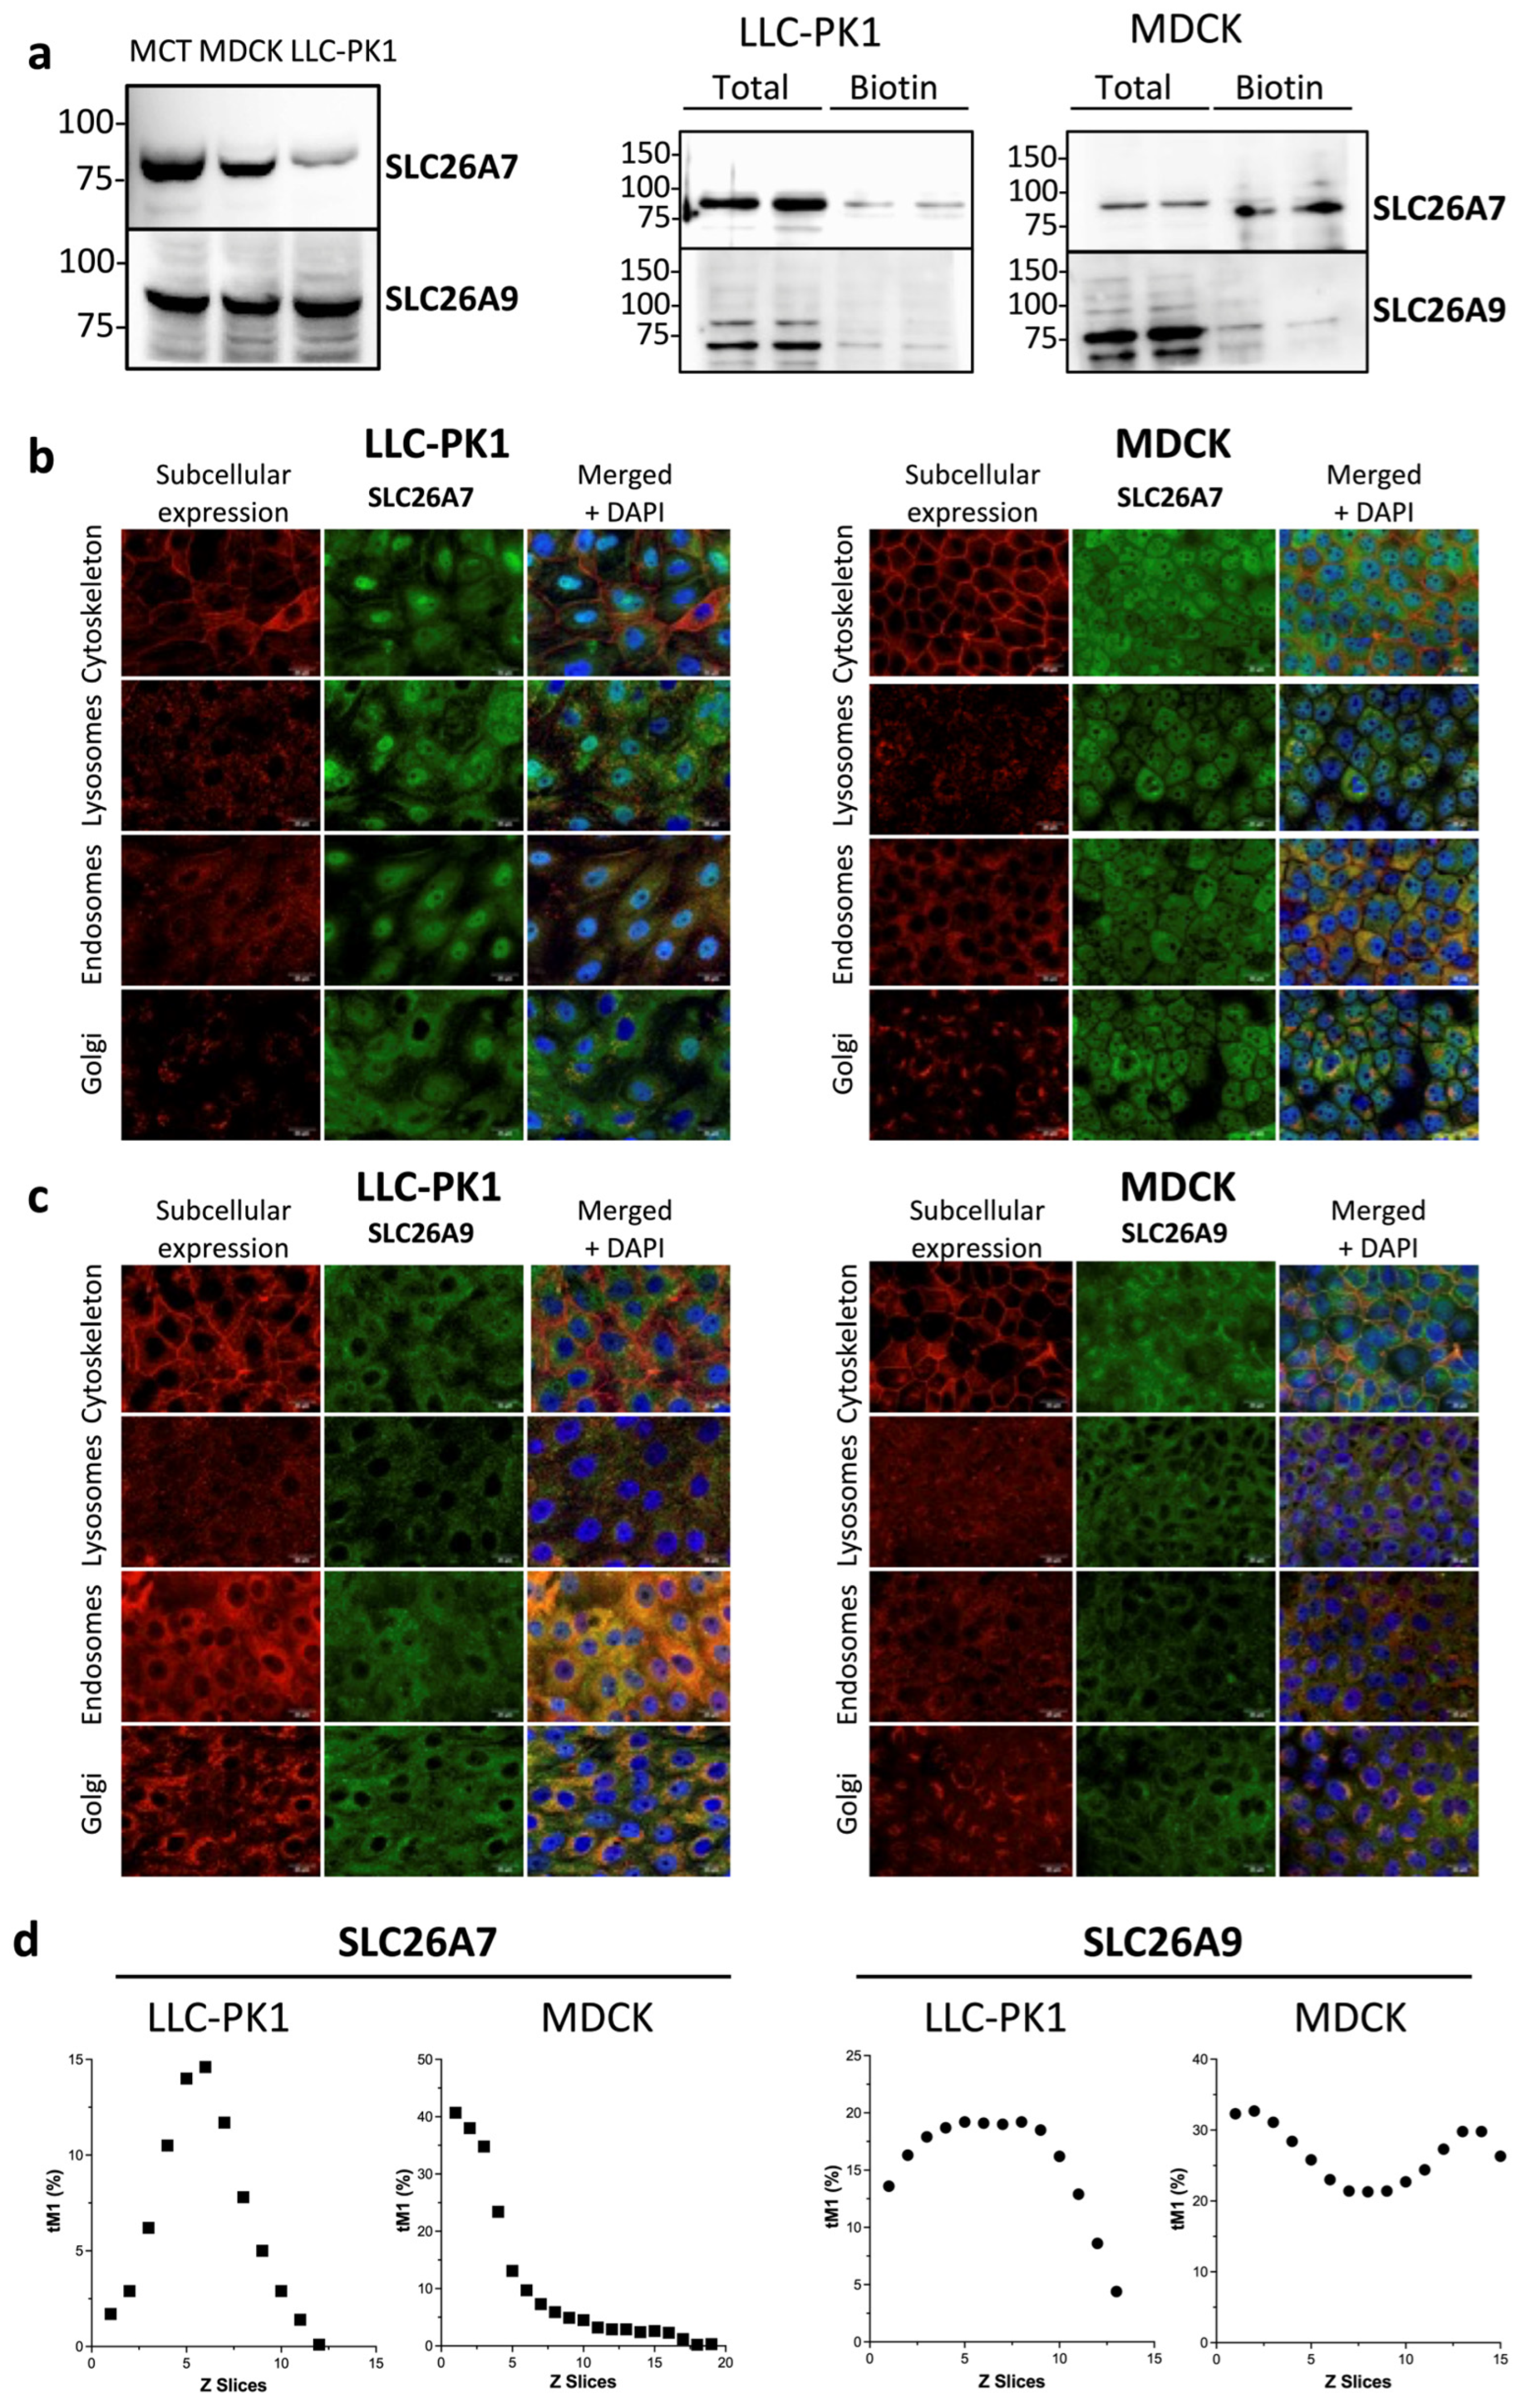
A qPCR screening for expression of RNA transcripts in several cell lines grown on plastic support showed that both SLC26A7 and SLC26A9 RNAs were mainly expressed in LLC-PK1 (pig kidney), MCT (mouse cortical tubular cells), with lower expression in MDCK (Madin-Darby canine kidney), OK (opossum kidney), MMC (mouse renal mesangial cells), VSMC (rat vascular smooth muscle cells) and Caco2BBE cells. Confirming immunoblots were performed with commercial antibodies, using total lysate of confluent cells (Figure 7a, left). The electrophoresis size of clear bands between 75 and 100 MW ladder is shown, contrasting with the slightly higher size in Xenopus oocytes (Figure 3). These size differences are likely a result of different glycosylations. To assess the contrast in total versus plasma membrane expression, membrane protein biotinylation was performed in LLC-PK1 and MDCK cells. As illustrated in Figure 7a, right, specific immunoblots of SLC26A7 and SLC26A9 reveal that the plasma membrane expression is comparatively low, in contrast to the total expression in the cells.
Subsequent to this, the subcellular distribution of both transporters was studied by immunofluorescence microscopy in confluent, quiescent LLC-PK1 and MDCK cells. In LLC-PK1 cells, SLC26A7 was expressed at the plasma membrane, as confirmed with actin (phalloidin) colocalization (Figure 7b). A Z-axis expression analysis revealed that maximal expression was centrally located, with a decrease toward both ends, the apex and the bottom (Figure 7d). SLC26A7 was also diffusely distributed intracellularly, with positive colocalizations in early endosomes (EEA1, Early Endosomal Antigen 1), lysosomes (LAMP1, Lysosome-Associated Membrane Glycoprotein 1), and Golgi (FTCD, Golgi 58K Protein/Formiminotransferase Cyclodeaminase, mainly in the trans-Golgi network, TGN). The corresponding colocalizations had mean tM1s of 21%, 24%, and 22% (Figure 7b). In MDCK cells (see Figure 7b,d), SLC26A7 was found to be expressed at low levels in the plasma membrane (mean tM1 11%, approximately), with the highest levels observed in the base (41%), and decreasing towards the apex of the cell (1–2%). In the cytoplasm of MDCK cells, SLC26A7 exhibited strong colocalization in early endosomes (56%), lysosomes (49%), and the TGN (36%).
The expression pattern of SLC26A9 was comparable to that of SLC26A7 in both LLC-PK1 and MDCK cells. As illustrated in Figure 7c, in LLC-PK1, SLC26A9 was found in the plasma membrane and diffusely distributed throughout the cytoplasm, indicating its presence in multiple organelles. This finding was validated using the same markers for the cytoskeleton (tM1 33%), early endosomes (46%), lysosomes (17%), and TGN (30%). The expression in the plasma membrane was maximal from the base to the middle of the cell, and then diminished to the tip of the cell (Figure 7d). In MDCK, the expression of SLC26A9 in the plasma membrane was highly significant, with a mean 43% tM1 and similar along the height of the cell (Figure 7d). In early endosomes, lysosomes, and TGN, the mean colocalization tM1 were 32%, 26%, and 38%, respectively (Figure 7c).

2.5. Relevance to Pi Transport

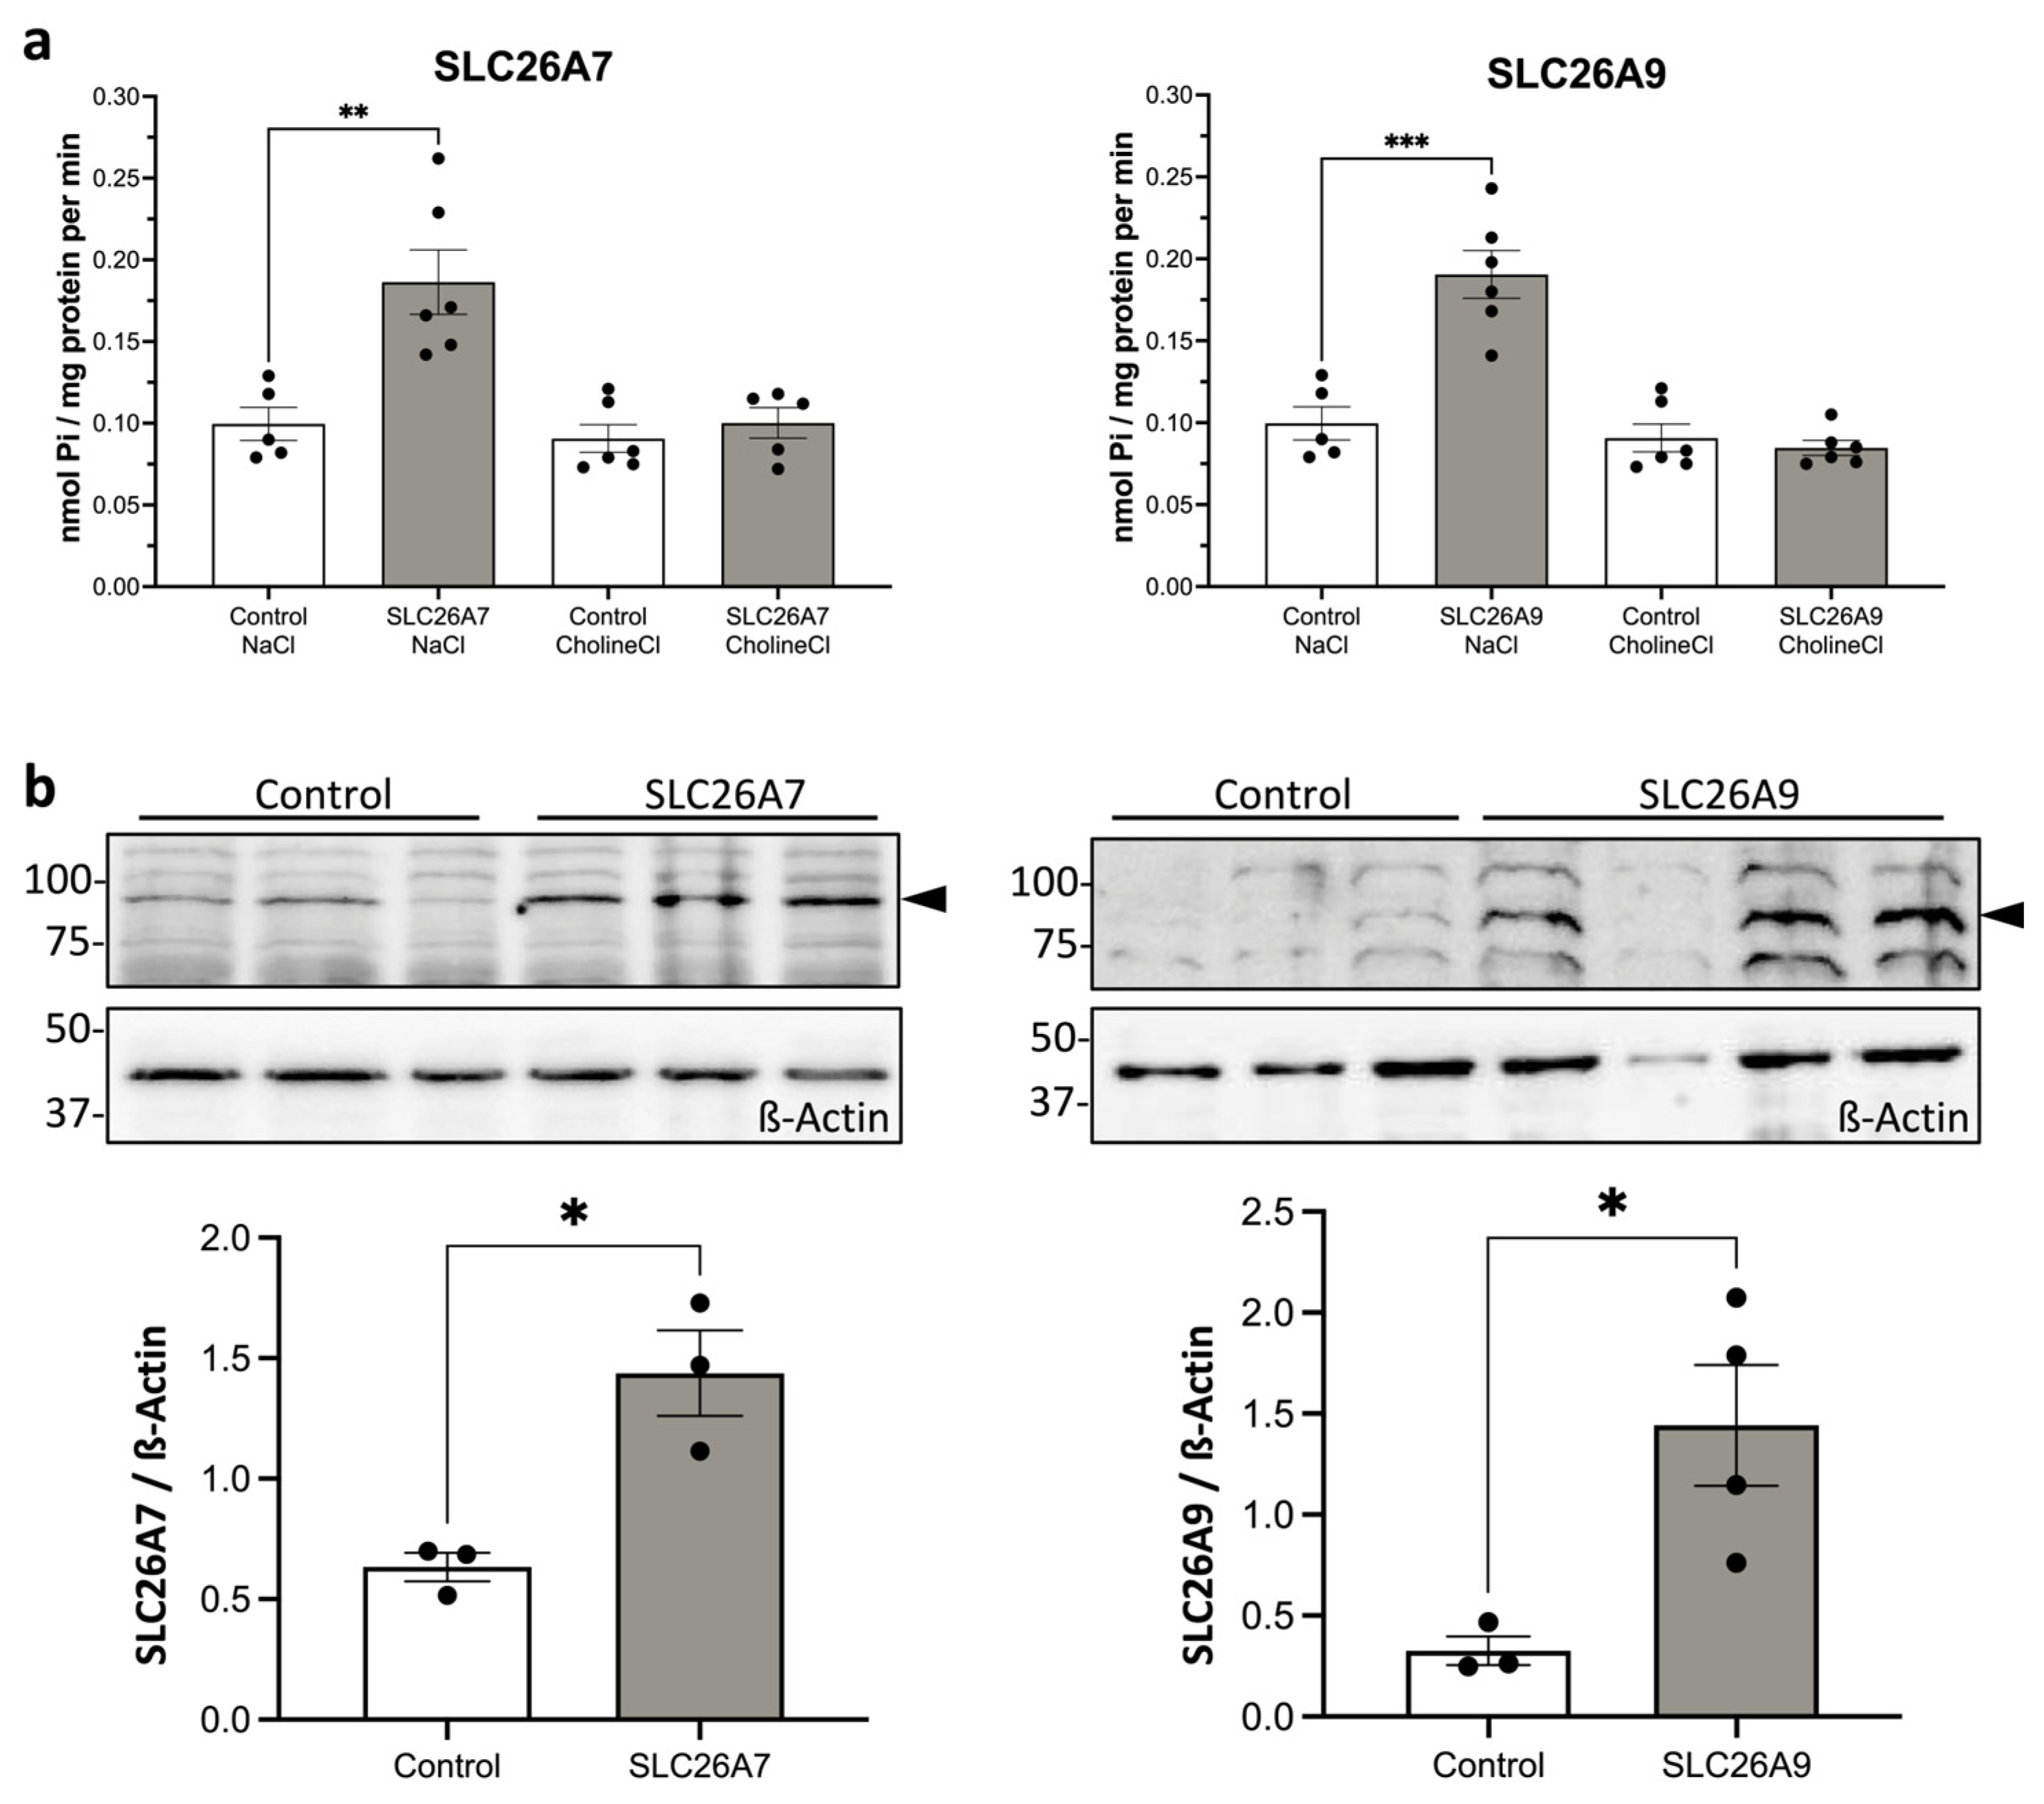
To clarify the relevance of SLC26A7 and -9 in Pi uptake in vitro, we overexpressed the transporters in MDCK cells by transfecting full-length cDNA-containing plasmids. We did not use LLC-PK1 because these cells show high expression of SLC34 and SLC20 Pi transporters. Consequently, the use of interference of RNA (siRNAs) was ruled out in the LLC-PK1 cells. As illustrated in Figure 8, the expression of either SLC26A7 or SLC26A9 in MDCK cells resulted in a moderate yet significant increase in sodium-dependent Pi uptake. This increase was accompanied by a corresponding rise in RNA and protein expressions.

3. Discussion

The main Pi transporters are classified as type II (family SLC34: NaPi2a, NaPi2b and NaPi2c) and type III (SLC20: PiT1 and PiT2). All of them are cotransporting sodium/Pi inwardly, with different functional characteristics, such as stoichiometries Na:Pi (3:1 or 2:1) and the preferred substrate ( H P O 4 = or H 2 P O 4 ). The members of the SLC34 family are also the main targets of most mechanisms of Pi homeostatic regulation, and they respond acutely or chronically [1,2,6]. Other transporters, which appear to play a very limited role in total Pi homeostasis, belong to the SLC17 and SLC37 families of solute carriers (see Section 1). Despite the new knowledge created by several groups, there are still some phenomena and mechanisms of Pi transport that cannot be explained by the activities and regulations of SLC34 and SLC20 family members [5,10]. For instance, we observed that the pattern of inhibition on two different sodium-independent Pi transports in Caco2BBE included oxalate, DIDS, SITS, sulfate, and bicarbonate as inhibitors [5]. VSMC express, among others, a sodium-dependent Pi transport distinct from PiT1 and PiT2, which is partially inhibited by DIDS and SITS, plus a sodium-independent transport that is also partially inhibited by sulfate and bicarbonate [9]. Given these precedents, we decided to analyze several solute carriers, including the SLC26 family of multifunctional anion transporters. These transporters can exchange various anions, such as chloride, bicarbonate, sulfate, oxalate, and formate, in either direction and even transport them unidirectionally [30].
Our functional screening revealed that SLC26A6, SLC26A7, and SLC26A9 express Pi transport in Xenopus oocytes (Figure 1). In this study, our focus has been on SLC26A7 and SLC26A9, and we have found that the characteristics of the expressed Pi transport differ significantly from the classical SLC34 and SLC20 parameters. For instance, the maximal percentages of expressed Pi transport in Xenopus oocytes are very modest (Figure 2a,b) compared to the fifty times or more above water-injected level of SLC34 and SLC20. In the case of SLC26A9, this limitation can be due to both the low insertion of the transporters in the plasma membrane and the saturation of the protein expression rate: We found a similar expression of SLC26A9 protein and Pi transport with the injection of either 1 or 10 ng of cRNA (see Figure 2b and Figure 3). Other factors to consider include the transport rate and the duration of the transport cycle, as well as the ordered interaction of sodium ions and Pi and stoichiometries, and the interference of other substrates. Both SLC26A7 and SLC26A9 expressed Pi transports are sodium-activated (Figure 4a), but further research is needed to determine whether sodium is only a catalytic activator or if it is co-transported with Pi. In both cases, the affinities for Pi are very similar and only slightly lower than the affinities of the SLC34 and SLC20 transporters. This affinity was unexpected because SLC26A7 and SLC26A9 exhibit a wide anion selectivity as substrates, and the plasma concentration of Pi is usually 1–1.5 mM. However, the preferred Pi appears to be the dihydrogen phosphate ion H 2 P O 4 (as observed for SLC20 members) because transport is reduced with alkalinity, when Pi turns deprotonated (HPO4=; Figure 4b). Therefore, the concentration of H 2 P O 4 in the blood plasma (about a fifth to total Pi at pH 7.4) is similar to the Km of SLC26A7 and SLC26A9 for Pi.
The observation that the majority of SLC26 members do not exhibit Pi uptake in oocytes indicates that the observed increase with SLC26A7 and A9 is not an indirect effect resulting from ionic changes within the cell. Furthermore, the distinct pattern of inhibition of SLC26A7 and SLC26A9-mediated Pi uptake, as compared to the inhibition of the endogenous transport in the oocyte, indicates that these two SLC26 members are not merely increasing the endogenous Pi uptake. However, it should be noted that the Pi affinity parameter cannot be used to differentiate, as all Pi transporters known to date show Pi affinities in the micromolar range. This has also been observed in SLC26A7 and SLC26A9.
This is the first description of a sodium-activated transport in SLC26A7, but the case of SLC26A9 as a sodium-dependent transporter of bicarbonate or chloride had been reported [18]. However, the transport constants (affinity and capacity-Vmax) remain to be determined, thereby leaving the precise role of sodium unclear. It is important to note that both SLC26A7 and SLC26A9 function as anion channels, and SLC26A7 is a very relevant iodide transporter [15,25,26,31]. The precise role of sodium in the anion (bicarbonate, chloride, iodide, and Pi) transport by these transporters is not yet fully understood, despite the in-depth study of iodide and chloride recognition in SLC26A7, as well as the presence of several sodium-binding sites in SLC26A9 [32,33]. In fact, these transporters exhibit very different modes of activity, as demonstrated by the wide patterns of Pi transport inhibition: classical Pi transporters (inhibition by phosphonoformate and arsenate), SLC26 family (inhibition by bicarbonate, sulfate), and even some assorted SLC4 anion exchanger inhibitors (Figure 6). Two chloride channel blockers have also been found to inhibit Pi transport: NPPB [15] acts on both SLC26A7 and SLC26A9, and GlyH-101 [17] inhibits, at least, SLC26A9-mediated Pi uptake. However, the relationship between channel activity and Pi transport is not supported by these findings. This is because S9-A13, another specific inhibitor of SLC26A9 chloride current [24], does not affect Pi transport (Figure 6b). Notably, the differential inhibition observed with DIDS and SITS, well-known inhibitors of anion exchangers, merits attention. In our work, these inhibitors selectively act on SLC26A9, resulting in approximately 70% inhibition of Pi transport. As indicated in the literature, DIDS has been shown to strongly inhibit (greater than 90%) the Cl/ H C O 3 exchanger activity of SLC26A9 [34] and to exhibit weak inhibition on the channel mode of Cl flux [35]. Regarding SLC26A7, DIDS did not affect Pi transport as shown in Figure 6a. However, previous studies have demonstrated that DIDS can inhibit SLC26A7-mediated chloride exchange and channel activities [15,36]. Therefore, it can be concluded that the alkylating site of DIDS (and SITS) is unrelated to the transport mechanism of Pi in SLC26A7, but it is directly or indirectly related to the Pi transport activity in SLC26A9. Inhibitions of both SLC26A7 and 9 were observed with the anion-exchanger translocation inhibitors DNFB, niflumic acid, and furosemide. However, these results must be interpreted with caution, as these chemicals have been shown to have varied secondary effects. DNFB reacts with the lysine amine group of band 3, which also binds DIDS. This reaction produces dinitrophenyl (DNP)-lysine (and other amino acids). However, this arylation is not exclusive to chloride transporters. Other channels can be open-activated, such as the calcium-permeable cation channel TRPA1 [37]. Niflumic acid is a band 3 inhibitor that prevents the inhibitory effect of SITS (but does not impede the binding of chloride). It also inhibits Ca2+-activated Cl channels and CFTR [38,39]. Furosemide is a loop diuretic that competitively inhibits the Na+-K+-2Cl symporter, and noncompetitively the GABA-A receptors and K+-Cl co-transporters 1–4 [40]. Therefore, it is important to note that several of the inhibitors used can have unspecific effects besides the indicated target. However, in this work, our objective was to conduct an initial inhibition screening using drugs known to affect Pi and chloride/bicarbonate transporters. Due to the need for brevity and concision, we have not yet conducted a thorough analysis of the inhibition effect using kinetic or molecular approaches. Despite these limitations, our results emphasize the impact of the drugs on the net expressed Pi transport, and therefore, indirect effects caused on the oocyte are still possible. Further experimentation and research are necessary to fully comprehend the role of these transporters in Pi homeostasis.
A key issue when doing in vitro studies is determining the relevance of in vivo situations. Two different reports on Slc26a7 and Slc26a9 null-mice provided no clues about changes in Pi homeostasis (e.g., concentrations of Pi in blood or urine) and consequences (e.g., rickets or ectopic calcifications) [41,42]. In rodent kidney, SLC26A7 is expressed in the proximal tubule and thick ascending limb of the loop of Henle [43], but in human kidney, the expression in the proximal tubule has not been described [44]. The deletion of Slc26a7 in mice has been shown to cause distal renal tubular acidosis (RTA), metabolic acidosis, and alkaline urine pH. This is due to a decrease in the exchange activity of the basolateral Cl/ H C O 3 in acid-secreting intercalated cells in the outer medullary collecting duct. RTA has also been observed during hypophosphatemia and Pi deprivation, including bicarbonaturia e.g., [45,46]. However, the underlying mechanism appears to differ from that of the Slc26a7 deletion because the absence of SLC26A7 in the apical/subapical membrane of proximal tubular cells would prevent Pi reabsorption. In the basolateral membrane of outer medullary collecting ducts, SLC26A7 would simply contribute to the intake of Pi by the cell.
The deletion of Slc26a7 in mice has also been shown to impair gastric acid secretion [41]. SLC26A7 is expressed in the basolateral membrane of gastric parietal cells, and therefore, the observed sodium-activated Pi transport of SLC26A7 would also serve to supply Pi to the cell. With regard to SLC26A9, in the kidney, it is found in the apical membrane of principal cells in the medullary collecting ducts. SLC26A9 plays a key role in chloride secretion, and studies have shown that mice with a genetic deletion of Slc26a9 exhibit a decrease in renal chloride excretion [42]. SLC26A9 might be involved in the 2–10% of Pi reabsorption that occurs in the distal parts of the nephron [47]. These two and other similar works on genetic deletions of Slc26a7 and Slc26a9 focused on specific effects on several tissues. However, no information was provided on phosphatemia, phosphaturia, or Pi transport rate in different tissues. Furthermore, the presence of multiple exclusive Pi transporters (SLC34, SLC20) can result in alterations to Pi homeostasis mechanisms that offset the effects of Slc26a7 and Slc26a9 deletion. This phenomenon was exemplified by the intestinal NaPi2b (Slc34a2) Pi transporter, where the absence of hypophosphatemia in mice was due to the compensation of reduced intestinal absorption by increased Pi renal reabsorption [48].
Reports on human genetic diseases that affect SLC26A7 or SLC26A9 have been primarily limited to hypothyroidism [49] and increased cystic fibrosis with bronchiectasis [50], again with apparent relationship to Pi homeostasis. We therefore focused our study on the relevance of SLC26A7 and SLC26A9-mediated Pi transport in cell culture, specifically in MDCK cells. LLC-PK1 cells were utilized exclusively for protein expression and localization studies due to their high expression of the primary and specific Pi transporters from the families SLC34 and SLC20. Consequently, it would be challenging to observe effects on Pi transport by overexpressing (through transfection) or inhibiting (with siRNA) the expression of SLC26A7 or SLC26A9 in these cells. Additionally, the expression of SLC26A7 or SLC26A9 is predominantly intracellular (Figure 7b,c), which suggests that alterations in Pi transport might be more challenging to discern in the presence of other Pi transporters. In contrast, MDCK cells exclusively display sodium-independent Pi transport, and the endogenous expression of SLC26A7 and SLC26A9 in the plasma membrane of both transporters is minimal (Figure 7a). The intracellular expression of SLC26A7 and SLC26A9 has also been previously described in overexpressing experiments in other cell lines [51,52]. It is critical to note that the independent overexpression of both transporters in MDCK cells resulted in the corresponding increase of the transporter in the plasma membrane and the appearance of a sodium-dependent Pi uptake (Figure 8). This finding lends further support to the hypothesis that the previous findings in oocytes were likely not artifacts of the heterologous expression system. However, the predominant intracellular expression of SLC26A7 and SLC26A9 in endosomes, lysosomes, and Golgi apparatus cannot be ignored (Figure 7). We have observed that the activity of Pi transporters depends on the presence of a sodium electrochemical gradient, and gradient only exists in the plasma membrane. However, it should be noted that Pi is also stored intracellularly as either free orthophosphate (i.e., Pi) or polyphosphates containing hundreds of Pi [1,53]. Mitochondria store polyphosphates and cotransport H+/ H 2 P O 4 through the mitochondrial Pi carrier (PiC) SLC25A3, as well as in exchange with hydroxyl ions [54]. The endoplasmic reticulum also expresses SLC20 Pi transporters [55] that are recycled to the plasma membrane from endosomes, and sugar-Pi/Pi exchangers of the SLC37 family [11]. Therefore, the role of SLC26A7 and SLC26A9 as intracellular Pi transporters is still unclear. In addition to the sodium gradient necessary for Pi transport activity, Figure 4 shows that these transporters exhibit higher activity at low pH (comparable to the SLC20 family members). We have interpreted the results as indicating a preference for the monovalent ( H 2 P O 4 ) Pi substrate. However, the possibility of cotransport of Pi with protons cannot be ruled out.
Further studies are necessary to fully understand the role of SLC26A7 and SLC26A9 in Pi homeostasis. It appears that the movement of Pi through both of these channels is only inward, and it is sodium-activated. However, this requires further confirmation. These pathways may simply represent additional redundant Pi entry modes to the cells, as is the case with the expression of several different Pi transporters (from either SLC20 and SLC34 families) in the same cells, and the likely control of the Pi exit (efflux) from the cells, as with XPR1. Alternatively, the transporters could play new regulatory functions, such as PiT2, which is also significantly expressed in intracellular stores and seems to have important roles in physiology and pathology, such as ectopic calcification [1,2]. The relevance of SLC26A7 and SLC26A9 to Pi homeostasis in vivo is a challenge due to the following factors: these are transporters with multiple substrates, multiple tissue expression, and even multiple subcellular expression sites. Based on the findings from this preliminary study, it can be concluded that the process of Pi transport by SLC26A7 and SLC26A9 is just one of several transport functions of these proteins. Further investigation is required to determine the significance of each individual function.

4. Materials and Methods

4.1. Chemicals

The majority of the chemicals utilized in this study were obtained from Merck Life Science S.L.U. (Madrid, Spain). The SLC26A9 inhibitor S9-A13 [16] was synthesized and obtained from ChemDiv (San Diego, CA, USA). NPPB and GlyH-101 were obtained from Cayman Chemical (Ann Arbor, MI, USA). 32P-orthophosphoric acid was purchased from PerkinElmer (Waltham, MA, USA).

4.2. cDNA Construction and Expression in Xenopus Oocytes

All SLC26 members that were utilized were the human orthologs, with the exception of Slc26a4, which was obtained as the murine member. Studies conducted previously demonstrated comparable kinetic behavior and substrate specificity in the murine [56] and human [57] models. Both species are electroneutral iodide, chloride, and bicarbonate exchangers. Furthermore, both transporters share 87.56% identity and 94.5% similarity. Full-length and sequence-confirmed Slc26a4 (mouse, clone BC140995-TCM1004-GVO-TRI in pCR4 TOPO) and human SLC26A7 cDNA (clone BC114474-TCH1003-GVO-TRI in pCR-BluntII-TOPO) were obtained from Transomics-BioCat GmbH (Heidelberg, Germany). cRNA transcription, capping, and polyadenylation were performed using SpeI-linearized plasmids, mMESSAGE mMACHINE, and Poly(A) Tailing kits, all from Thermo Fisher Scientific-Ambion (Austin, TX, USA).
For SLC26A1, SLC26A2, SLC26A3, SLC26A5, SLC26A6, SLC26A9 and SLC26A11 cloning, human cDNA was first prepared from a Caco2BBE RNA using a SuperScript III First Strand Synthesis kit (Thermo Fisher Scientific-Invitrogen, Carlsbad, CA, USA). The cDNAs were then PCR-cloned in our laboratory using the primers indicated in Table 1 for amplification with Platinum Taq DNA Polymerase High Fidelity (Thermo Fisher Scientific-Invitrogen). The product was subsequently cloned into pCR4 TOPO TA, subjected to sequencing to check for mutations and misinsertions, and then in vitro transcribed, as for Slc26a4 and SLC26A7, following similar procedures. For the purpose of cell transfection, the human SLC26A7 was PCR-cloned from pCR-BluntII-TOPO, using the primers CGCGCGGCCGCGCATTGAAAGGAGGTGTTCTGC and CGCGTCGACAAAGGTGGATTCAAGTCCCCAG. Similarly, the human SLC26A9 was PCR-cloned from pCR4 TOPO TA, using the primers CGCGCGGCCGCGCTTTGCTCACCCACTG and CGGGAATTCCACCAGACTCTCACTCCTGTAA. The SLC26A7 and SLC26A9 amplicons were subsequently inserted into the pCMV-Script vector.
Xenopus females were purchased from the European Xenopus Resource Center at the University of Portsmouth (Portsmouth, UK). These animals were maintained in accordance with the standard conditions established for this species, in a large dark water tank maintained at 18 °C. Oocytes were obtained by abdominal incision after anesthesia with MS222, and buprenorphine for analgesia. The preparation, injection, and incubation of oocytes have been thoroughly detailed in our previous works [58]. In order to determine Pi uptake, 3000 Ci/mmol 32Pi was used at 20 µCi per mL of Tris-buffered uptake medium containing 50 µM of Pi (a combination of K2HPO4 and KH2PO4, pH 7.4) for 60 min. This incubation time corresponds to initial velocity in oocytes, meaning that net 32Pi uptake is only inward. These parameters were adapted to the conditions of Pi-saturating kinetics and time-course experiments. At the end of the incubation period, oocytes were washed several times in ice-cold stop solution, then individually placed in scintillation tubes, dissolved in 10% sodium dodecyl sulfate, and analyzed in a TRI-CARB 4810TR Liquid Scintillation Counter (PerkinElmer).

4.3. Cell Culture, Plasmid and siRNA Transfections and Uptake Assays

The reagents for cell culture were obtained from Thermo Fisher Scientific-Gibco (Paisley, UK). The LLC-PK1 cells were provided by Professor J.A. McAteer (Indiana University, Indianapolis, IN USA) and cultivated in DMEM-F12 and fetal calf serum. The MDCK cells were provided by Professor H. Murer (University of Zürich, Zürich, Switzerland) and cultivated in DMEM containing 22 mM bicarbonate. MCT cells and MMC were provided by Professor M. Levi (Georgetown University Medical Center, Washington, DC, USA). Both MCT and MMC were cultivated in DMEM. Our research group has previously reported on the utilization of OK [59], the intestinal Caco2BBE [5], and rat vascular smooth muscle cells (VSMC) from the aorta [9]. Full-length SLC26A7 and SLC26A9 cDNAs were cloned into the pCMV-Script vector and then expressed in cells using Lipofectamine 3000 in accordance to the manufacturer’s guidelines. 32Pi uptake was assayed as reported in the same references. In summary, cells were incubated for six minutes (initial velocity time is up to 10 min) in a Tris-buffered uptake medium containing 50 µM Pi (a mixture of K2HPO4 and KH2PO4, pH 7.4) and 2 µCi/mL of 32Pi. Uptake was terminated with stop solution, and cells were washed and then lysed with 0.05% Triton X-100. Aliquots were analyzed in a scintillation counter.
siRNA transfections were performed using Lipofectamine RNAiMAX (Invitrogen, catalog no. 13778) in combination with Silencer Select siRNAs (Ambion). The sequences of siRNAs are listed in Table 2. Initially, transfection conditions were established in accordance with the manufacturer’s recommendations (transfection with lipofectamine 0.03% and 10 nM siRNA for 4 h, followed by incubation in quiescence medium for 48 h). However, while significant decreases were observed in both SLC26A7 and SLC26A9 RNAs, no changes in target proteins were detected after 48 h of incubation. Consequently, modified conditions were evaluated, leading to the knockdown results shown in the Supplemental Figures S2 and S3, as assessed by western blot and immunofluorescence analyses, respectively. The optimized conditions consisted of transfecting with 40 nM siRNA and 0.3% Lipofectamine RNAiMAX in Opti-MEM medium. The cells were then incubated with the transfection mixture for a period of six hours. The medium was then replaced with quiescence medium, and the cells were maintained for five additional days prior to analysis. The results indicate that the signals were significatively decreased in western blots and immunofluorescence microscopy. This supports the specificity of the antibody signals.

4.4. Immunoblotting, Membrane Protein Biotinylation and Immunofluorescence Microscopy

Antibodies against SLC26A7 and SLC26A9 were obtained from Proteintech (cat. 17654-1-AP, Planegg-Martinsried, Germany) and Biorbyt (cat. orb317933, Cambridge, UK), respectively, and used at 1:500 and 1:1000 dilutions for immunoblots, with the same procedure as described [9,58]. For NaPi2a, the polyclonal antibody utilized has been described in several manuscripts [6]. The analyses of immunoblots and densitometries were carried out using a VersaDoc MP and the software Quantity One (v. 4.6.9, both from Bio-Rad, Hercules, CA, USA). The densitometric results (i.e., the total signal intensity inside a defined band boundary or volume) are displayed as adjusted volume in percentage (Adj vol. %), which corresponds to the volume of the band minus the background volume, expressed as a percentage of all the volumes in the image. The following horseradish peroxidase-labeled polyclonal antibodies were utilized as secondary antibodies: anti-rabbit (Invitrogen, cat. 31460) at 1:20,000 dilution, and anti-mouse (Sigma-Aldrich, cat. GENA931; St. Louis, MO, USA) at 1:20,000 dilution.
To quantify the abundance of the transporters present in the plasma membranes, we performed protein biotinylation with sulfo-NHS-SS-biotin and ImmunoPure Immobilized Streptavidin, both from Thermo Fisher Scientific-Pierce (Rockford, IL, USA). The procedures have been previously outlined in the literature for both, cells in culture [60] and Xenopus oocytes [61]. A total lysate, as indicated in Figure 3 was obtained by pipetting up and down oocytes with 0.15 M NaCl, 1% Triton X-100, 20 mM Tris-HCl (pH 7.4), and protease inhibitors. The samples were centrifuged at 10,000× g, after which the resulting supernatant was utilized for Western blotting. To check for background, some oocyte samples underwent the biotinylation procedure without the addition of sulfo-NHS-SS-biotin.
The same antibodies were used in paraformaldehyde-fixed cells for fluorescence microscopy. However, the imaging was confirmed and improved using alternative antibodies to those used for western blots. For SLC26A7, a polyclonal antibody from Antibodies Online (cat. ABIN7075670; Limerick, PA, USA) was used, whereas for SLC26A9, a polyclonal antibody from Atlas Antibodies (cat. HPA051485; Stockholm, Sweden) provided clear and intense signals. In this case, peptide blocking for specificity (cat. APrEST83594) was also included, as it was the only immunizing antigen commercially available. All images shown in Figure 7, Figures S1 and S3 were done using these two antibodies. We performed the classical blocking protocol, following the instructions described on atlasantibodies.com, with 100× molar excess of peptide over antibody, for 30 min at room temperature. Additionally, the specificity of antibodies was assayed with interference of RNA, as outlined in Section 4.3. Both MDCK and LLC-PK1 cell cultures were transfected with specific siRNAs designed for SLC26A7 and SLC26A9. The signals in the western blots and immunofluorescence microscopy showed a clear decrease using either methodology, as depicted in Figures S2 and S3.
For the purpose of imaging, colocalization, and Z-stack views, a Carl Zeiss Axiovert 200M equipped with an ApoTome for structured illumination (Carl Zeiss Microscopy GmbH, Jena, Germany) was utilized. The acquisition and subsequent image analysis were conducted using Axiovision software v. 4.8.2 (Carl Zeiss Microscopy GmbH). Subcellular analysis of distribution, fluorescence colocalization, and analyses of merge areas were performed with Axiovision, and confirmed with ImageJ software v. 2.17.0 (https://imagej.net/software/fiji/, 7 March 2026) using the plug-in BIOP-JACOP. The following antibodies were utilized in the study: Early Endosomal Antigen 1 (EEA1, cat. sc-137130), the Lysosome-Associated Membrane Glycoprotein 1 (LAMP1, cat. sc-20011), and the Golgi 58K Protein/Formiminotransferase Cyclodeaminase (FTCD, cat. sc-53128) were obtained from Santa Cruz Biotechnology (Dallas, TX, USA) and were used at 1:50 dilution. Atto-565-conjugated phalloidin, used to decorate the cytoskeleton, was obtained from Sigma-Aldrich (cat. 94072; St. Louis, MO, USA). The secondary antibodies utilized in this study included Alexa Fluor 488 Goat Anti-Rabbit (Invitrogen cat. A11008), which was used at a 1:200 dilution, and Alexa Fluor 568 Goat Anti-Mouse (Invitrogen cat. A11004), which was used at a 1:200 dilution.

4.5. Quantitative PCR

For quantitative PCR, total RNA was purified from cells using the Quick-RNA MiniPrep kit (Zymo Research, Irvine, CA, USA). DNase I-treated RNA was retrotranscribed using a PrimeScript RT Reagent Kit (Takara Bio Inc., Kusatsu, Japan) and amplified in a LightCycler (Roche Applied Science, Mannheim, Germany) using a SYBR Premix Ex Taq II (Takara, Shiga, Japan). Expression data were normalized to an endogenous reference, either glyceraldehyde 3-phosphate dehydrogenase or cyclophilin B (peptidylprolyl isomerase B, PPIB). The primers utilized are enumerated in Table 3.

4.6. Statistics and Curve Fitting

These procedures were performed using Prism version 10 (GraphPad Software, Boston, MA, USA), and the specific methods and conditions have been described in detail previously [6]. In summary, the data are expressed as the mean ± SEM. The comparison of normally distributed data was conducted using either a t-test or an ANOVA, followed by a post hoc test for multicomparison. When variances were found to be homogeneous, the statistical method of Fisher’s Least Significant Difference was employed. Conversely, when variances were determined to be non-homogeneous, the alternative ANOVA of Welch and Brown-Forsythe was utilized. Subsequently, an unpaired t-test with Welch’s correction was performed for selected means. Statistical significance was defined as p < 0.05.
The procedure for curve fitting to data with Prism has been explained in detail in previous works [5,9,20]. Non-linear (least squares) regression to a Michaelis-Menten equation was performed in the experiments of substrate (Pi) saturation. The fits were calculated directly, without weighting the data (1/y), according to homoscedasticity. The kinetic constants (Vmax and Km) were obtained from the water, SLC26A7 and -A9 injected oocytes. The resulting curves of the water-injected oocytes were then subtracted from the curves of the SLC26A7 or -A9 injected oocytes to obtain the net expressed Pi uptake. This was subsequently fitted to the same equation. Three experiments were conducted in each instance. In the case of sodium activation curves, the procedure was similar, but the Michaelian equation included the Hill component.
This work has been done exclusively using natural intelligence.

5. Conclusions

The multifunctional SLC26A7 and SLC26A9 transporters exhibit high affinity sodium-dependent Pi transport. The rate of Pi uptake decreases with increasing pH, thereby indicating a predilection for H 2 P O 4 . Several well-known substrates and inhibitors of SLC34, SLC26, and SLC4 also inhibit SLC26A7 and SLC26A9-Pi uptake. The expressions of SLC26A7 and SLC26A9 in cell lines are predominantly intracellular, and the over-expression of SLC26A7 or SLC26A9 in MDCK cells results in increased plasma membrane abundance and Pi uptake. Nevertheless, further research is needed to gain a deeper understanding of the relevance of these transporters in Pi homeostasis in vivo.

Supplementary Materials

The following supporting information can be downloaded at: https://www.mdpi.com/article/10.3390/physiologia6020039/s1, Figure S1. Effect of blocking peptide on SLC26A9 antibody; Figure S2. Effect of RNAi on total expression of SLC26A7 and SLC26A9; Figure S3. Effect of RNAi on subcellular expression of SLC26A7 and SLC26A9.

Author Contributions

Conceptualization, N.G. and V.S.; methodology, all authors; software, all authors; validation, N.G., C.S. and V.S.; formal analysis, G.C.-E., N.G. and V.S.; investigation, G.C.-E. and J.A.Q.; resources, V.S.; data curation, G.C.-E., N.G. and V.S.; writing—original draft preparation, V.S.; writing—review and editing, G.C.-E., N.G. and V.S.; visualization, G.C.-E. and J.A.Q.; supervision, N.G., C.S. and V.S.; project administration, N.G., C.S. and V.S.; funding acquisition, V.S. All authors have read and agreed to the published version of the manuscript.

Funding

This research was funded by the Spanish Ministry of Science and Innovation (grant number PID2021-127818OB-I00) and the Government or Aragon (Grant B39_23R-Toximol), both to V.S. G.C.-E. was the recipient of a predoctoral fellowship from the Government of Aragon. J.A.Q. was under contract with the Investigo program, code 0011-57, from the Spanish Ministry of Labor.

Institutional Review Board Statement

The care of animals and the procedures were in accordance with European and Spanish legislation. They were approved by the Ethical Committee for Animal Experimentation of the University of Zaragoza, with authorizations number PI39/15 and PI22/21.

Informed Consent Statement

Not applicable.

Data Availability Statement

The data that support the findings of this study are available from the corresponding authors upon request.

Conflicts of Interest

The authors declare no conflicts of interest. The funders had no role in the design of the study; in the collection, analyses, or interpretation of data; in the writing of the manuscript; or in the decision to publish the results.

Abbreviations

The following abbreviations are used in this manuscript:
PiInorganic phosphate
AE1Anion-exchanger-1
CFTRCystic fibrosis transmembrane conductance regulator
MENDMassive endocytosis
NPPB5-nitro-2-[3-(phenylpropyl)amino]-benzoic acid
AEAnion-exchanger
DIDS4,4′-diisothiocyanostilbene-2,2′-disulfonate
SITS4-acetamido-4′-isothiocyanato-stilben-2,2′-disulfonate
CHD1,2-cyclohexanedione
DNFB2,4-dinitrofluorobenzene
LLC-PK1Pig Kidney cells
MCTMouse cortical tubular cells
MDCKMadin-Darby canine kidney cells
OKOpossum kidney cells
MMCMouse renal mesangial cells
VSMCVascular smooth muscle cells
Caco2BBEHuman colon carcinoma cells
EEA1Early endosomal antigen 1
LAMP1Lysosome-Associated Membrane Glycoprotein 1
FTCDGolgi 58K Protein/Formiminotransferase Cyclodeaminase
TGNTrans-Golgi network
siRNASmall interfering RNAs
DNPDinitrophenyl
RTARenal tubular acidosis
PiCMitochondrial Pi carrier
GADPHGlyceraldehyde 3-phosphate dehydrogenase
PPIBPeptidylpropyl isomerase B
RNAiRNA interference

References

  1. Jennings, M.L. Role of transporters in regulating mammalian intracellular inorganic phosphate. Front. Pharmacol. 2023, 14, 1163442. [Google Scholar] [CrossRef]
  2. Hernando, N.; Gagnon, K.; Lederer, E. Phosphate Transport in Epithelial and Nonepithelial Tissue. Physiol. Rev. 2021, 101, 1–35. [Google Scholar] [CrossRef]
  3. Chen, L.; He, J.; Wang, M.; She, J. Structure and function of human XPR1 in phosphate export. Nat. Commun. 2025, 16, 2983. [Google Scholar] [CrossRef] [PubMed]
  4. Barac-Nieto, M.; Alfred, M.; Spitzer, A. Basolateral phosphate transport in renal proximal-tubule-like OK cells. Exp. Biol. Med. 2002, 227, 626–631. [Google Scholar] [CrossRef] [PubMed]
  5. Candeal, E.; Caldas, Y.A.; Guillén, N.; Levi, M.; Sorribas, V. Na+-independent phosphate transport in Caco2BBE cells. Am. J. Physiol. Cell Physiol. 2014, 307, C1113–C1122. [Google Scholar] [CrossRef]
  6. Lucea, S.; Chopo-Escuin, G.; Guillén, N.; Sosa, C.; Sorribas, V. Intestinal and renal adaptations to changes of dietary phosphate concentrations in rat. Function 2023, 5, zqad063. [Google Scholar] [CrossRef] [PubMed]
  7. Quamme, G.A.; Walker, J.J.; Yan, T.S. pH gradient-stimulated phosphate transport in outer medullary brush-border membranes. Am. J. Physiol. 1989, 257, F639–F648. [Google Scholar] [CrossRef]
  8. Dallaire, L.; Béliveau, R. Phosphate transport by capillaries of the blood-brain barrier. J. Biol. Chem. 1992, 267, 22323–22327. [Google Scholar] [CrossRef]
  9. Hortells, L.; Guillén, N.; Sosa, C.; Sorribas, V. Several phosphate transport processes are present in vascular smooth muscle cells. Am. J. Physiol. Heart Circ. Physiol. 2020, 318, H448–H460. [Google Scholar] [CrossRef]
  10. Craik, J.D.; Reithmeier, R.A. Inhibition of phosphate transport in human erythrocytes by water-soluble carbodiimides. Biochim. Biophys. Acta 1984, 778, 429–434. [Google Scholar] [CrossRef]
  11. Chou, J.Y.; Mansfield, B.C. The SLC37 family of sugar-phosphate/phosphate exchangers. Curr. Top. Membr. 2014, 73, 357–382. [Google Scholar] [CrossRef] [PubMed]
  12. Werner, A.; Moore, M.L.; Mantei, N.; Biber, J.; Semenza, G.; Murer, H. Cloning and expression of cDNA for a Na/Pi cotransport system of kidney cortex. Proc. Natl. Acad. Sci. USA 1991, 88, 9608–96012. [Google Scholar] [CrossRef]
  13. Soleimani, M. SLC26 Cl/HCO3 exchangers in the kidney: Roles in health and disease. Kidney Int. 2013, 84, 657–666. [Google Scholar] [CrossRef] [PubMed]
  14. Geertsma, E.R.; Oliver, D. SLC26 Anion Transporters. Handb. Exp. Pharmacol. 2024, 283, 319–360. [Google Scholar] [CrossRef]
  15. Kosiek, O.; Busque, S.M.; Föller, M.; Shcheynikov, N.; Kirchhoff, P.; Bleich, M.; Muallem, S.; Geibel, J.P. SLC26A7 can function as a chloride-loading mechanism in parietal cells. Pflug. Arch. 2007, 454, 989–998. [Google Scholar] [CrossRef]
  16. Narita, K.; Muramatsu, H.; Narumi, S.; Nakamura, Y.; Okuno, Y.; Suzuki, K.; Hamada, M.; Yamaguchi, N.; Suzuki, A.; Nishio, Y.; et al. Whole-exome analysis of 177 pediatric patients with undiagnosed diseases. Sci. Rep. 2022, 12, 14589. [Google Scholar] [CrossRef]
  17. Bertrand, C.A.; Zhang, R.; Pilewski, J.M.; Frizzell, R.A. SLC26A9 is a constitutively active, CFTR-regulated anion conductance in human bronchial epithelia. J. Gen. Physiol. 2009, 133, 421–438. [Google Scholar] [CrossRef]
  18. Chang, M.H.; Plata, C.; Zandi-Nejad, K.; Sindić, A.; Sussman, C.R.; Mercado, A.; Broumand, V.; Raghuram, V.; Mount, D.B.; Romero, M.F. Slc26a9—Anion exchanger, channel and Na+ transporter. J. Membr. Biol. 2009, 228, 125–140. [Google Scholar] [CrossRef]
  19. Kumar, S.; Sadaf, S.; Dikshit, M. Role of nitric oxide synthase and nitric oxide signaling in the neutrophil ontogeny and functions. In Nitric Oxide: From Research to Therapeutics. Advances in Biochemistry in Health and Disease; Ray, A., Gulati, K., Eds.; Springer: Cham, Switzerland, 2023; Volume 22, pp. 147–175. [Google Scholar] [CrossRef]
  20. Sorribas, V.; Guillén, N.; Sosa, C. Substrates and inhibitors of phosphate transporters: From experimental tools to pathophysiological relevance. Pflug. Arch. 2019, 471, 53–65. [Google Scholar] [CrossRef]
  21. Filipski, K.J.; Sammons, M.F.; Bhattacharya, S.K.; Panteleev, J.; Brown, J.A.; Loria, P.M.; Boehm, M.; Smith, A.C.; Shavnya, A.; Conn, E.L.; et al. Discovery of Orally Bioavailable Selective Inhibitors of the Sodium-Phosphate Cotransporter NaPi2a (SLC34A1). ACS Med. Chem. Lett. 2018, 9, 440–445. [Google Scholar] [CrossRef] [PubMed]
  22. Levi, M.; Gratton, E.; Forster, I.C.; Hernando, N.; Wagner, C.A.; Biber, J.; Sorribas, V.; Murer, H. Mechanisms of phosphate transport. Nat. Rev. Nephrol. 2019, 15, 482–500. [Google Scholar] [CrossRef]
  23. Renard, H.F.; Boucrot, E. Unconventional endocytic mechanisms. Curr. Opin. Cell Biol. 2021, 71, 120–129. [Google Scholar] [CrossRef]
  24. Jo, S.; Centeio, R.; Park, J.; Ousingsawat, J.; Jeon, D.K.; Talbi, K.; Schreiber, R.; Ryu, K.; Kahlenberg, K.; Somoza, V.; et al. The SLC26A9 inhibitor S9-A13 provides no evidence for a role of SLC26A9 in airway chloride secretion but suggests a contribution to regulation of ASL pH and gastric proton secretion. FASEB J. 2022, 36, e22534. [Google Scholar] [CrossRef]
  25. Ishii, J.; Suzuki, A.; Kimura, T.; Tateyama, M.; Tanaka, T.; Yazawa, T.; Arimasu, Y.; Chen, I.S.; Aoyama, K.; Kubo, Y.; et al. Congenital goitrous hypothyroidism is caused by dysfunction of the iodide transporter SLC26A7. Commun. Biol. 2019, 2, 270. [Google Scholar] [CrossRef]
  26. Cao, X.; Soleimani, M.; Hughes, B.A. SLC26A7 constitutes the thiocyanate-selective anion conductance of the basolateral membrane of the retinal pigment epithelium. Am. J. Physiol. Cell Physiol. 2020, 319, C641–C656. [Google Scholar] [CrossRef] [PubMed]
  27. Falke, J.J.; Chan, S.I. Molecular mechanisms of band 3 inhibitors. 1. Transport site inhibitors. Biochemistry 1986, 25, 7888–7894. [Google Scholar] [CrossRef] [PubMed]
  28. Falke, J.J.; Chan, S.I. Molecular mechanisms of band 3 inhibitors. 2. Channel blockers. Biochemistry 1986, 25, 7895–7898. [Google Scholar] [CrossRef] [PubMed]
  29. Falke, J.J.; Chan, S.I. Molecular mechanisms of band 3 inhibitors. 3. Translocation inhibitors. Biochemistry 1986, 25, 7899–7906. [Google Scholar] [CrossRef]
  30. Alper, S.L.; Sharma, A.K. The SLC26 gene family of anion transporters and channels. Mol. Asp. Med. 2013, 34, 494–515. [Google Scholar] [CrossRef]
  31. Dorwart, M.R.; Shcheynikov, N.; Wang, Y.; Stippec, S.; Muallem, S. SLC26A9 is a Cl channel regulated by the WNK kinases. J. Physiol. 2007, 584, 333–345. [Google Scholar] [CrossRef]
  32. Li, X.; Yang, X.; Lu, X.; Lin, B.; Zhang, Y.; Huang, B.; Zhou, Y.; Huang, J.; Wu, K.; Zhou, Q.; et al. Structural basis for substrate recognition mechanism of human SLC26A7. Nat. Commun. 2025, 16, 7600. [Google Scholar] [CrossRef]
  33. Chi, X.; Jin, X.; Chen, Y.; Lu, X.; Tu, X.; Li, X.; Zhang, Y.; Lei, J.; Huang, J.; Huang, Z.; et al. Structural insights into the gating mechanism of human SLC26A9 mediated by its C-terminal sequence. Cell Discov. 2020, 6, 55. [Google Scholar] [CrossRef] [PubMed]
  34. Xu, J.; Henriksnäs, J.; Barone, S.; Witte, D.; Shull, G.E.; Forte, J.G.; Holm, L.; Soleimani, M. SLC26A9 is expressed in gastric surface epithelial cells, mediates Cl/HCO3 exchange, and is inhibited by NH4+. Am. J. Physiol. Cell Physiol. 2005, 289, C493–C505. [Google Scholar] [CrossRef]
  35. Loriol, C.; Dulong, S.; Avella, M.; Gabillat, N.; Boulukos, K.; Borgese, F.; Ehrenfeld, J. Characterization of SLC26A9, facilitation of Cl(−) transport by bicarbonate. Cell Physiol. Biochem. 2008, 22, 15–30. [Google Scholar] [CrossRef]
  36. Petrovic, S.; Ju, X.; Barone, S.; Seidler, U.; Alper, S.L.; Lohi, H.; Kere, J.; Soleimani, M. Identification of a basolateral Cl/HCO3 exchanger specific to gastric parietal cells. Am. J. Physiol. Gastrointest. Liver Physiol. 2003, 284, G1093–G1103. [Google Scholar] [CrossRef]
  37. Wu, H.; Niu, C.; Qu, Y.; Sun, X.; Wang, K. Selective activation of TRPA1 ion channels by nitrobenzene skin sensitizers DNFB and DNCB. J. Biol. Chem. 2022, 298, 101555. [Google Scholar] [CrossRef]
  38. Scott-Ward, T.S.; Li, H.; Schmidt, A.; Cai, Z.; Sheppard, D.N. Direct block of the cystic fibrosis transmembrane conductance regulator Cl channel by niflumic acid. Mol. Membr. Biol. 2004, 21, 27–38. [Google Scholar] [CrossRef]
  39. Shi, C.; Ryan, J.S.; French, A.S.; Coca-Prados, M.; Kelly, M.E. Hyposmotically activated chloride channels in cultured rabbit non-pigmented ciliary epithelial cells. J. Physiol. 1999, 521, 57–67. [Google Scholar] [CrossRef]
  40. Delpire, E. Advances in the development of novel compounds targeting cation-chloride cotransporter physiology. Am. J. Physiol. Cell Physiol. 2021, 320, C324–C340. [Google Scholar] [CrossRef] [PubMed]
  41. Xu, J.; Song, P.; Nakamura, S.; Miller, M.; Barone, S.; Alper, S.L.; Riederer, B.; Bonhagen, J.; Arend, L.J.; Amlal, H.; et al. Deletion of the chloride transporter slc26a7 causes distal renal tubular acidosis and impairs gastric acid secretion. J. Biol. Chem. 2009, 284, 29470–29479. [Google Scholar] [CrossRef]
  42. Amlal, H.; Xu, J.; Barone, S.; Zahedi, K.; Soleimani, M. The chloride channel/transporter Slc26a9 regulates the systemic arterial pressure and renal chloride excretion. J. Mol. Med. 2013, 91, 561–572. [Google Scholar] [CrossRef]
  43. Dudas, P.L.; Mentone, S.; Greineder, C.F.; Biemesderfer, D.; Aronson, P.S. Immunolocalization of anion transporter Slc26a7 in mouse kidney. Am. J. Physiol. Ren. Physiol. 2006, 290, F937–F945. [Google Scholar] [CrossRef]
  44. Kujala, M.; Tienari, J.; Lohi, H.; Elomaa, O.; Sariola, H.; Lehtonen, E.; Kere, J. SLC26A6 and SLC26A7 anion exchangers have a distinct distribution in human kidney. Nephron Exp. Nephrol. 2005, 101, e50–e58. [Google Scholar] [CrossRef] [PubMed]
  45. Kurtz, T.W.; Hsu, C.H. Impaired distal nephron acidification in chronically phosphate depleted rats. Pflug. Arch. 1978, 377, 229–234. [Google Scholar] [CrossRef]
  46. Emmett, M.; Goldfarb, S.; Agus, Z.S.; Narins, R.G. The pathophysiology of acid-base changes in chronically phosphate-depleted rats: Bone-kidney interactions. J. Clin. Investig. 1977, 59, 291–298. [Google Scholar] [CrossRef] [PubMed]
  47. Pastoriza-Muñoz, E.; Colindres, R.E.; Lassiter, W.E.; Lechene, C. Effect of parathyroid hormone on phosphate reabsorption in rat distal convolution. Am. J. Physiol. 1978, 235, F321–F330. [Google Scholar] [CrossRef]
  48. Sabbagh, Y.; O’Brien, S.P.; Song, W.; Boulanger, J.H.; Stockmann, A.; Arbeeny, C.; Schiavi, S.C. Intestinal npt2b plays a major role in phosphate absorption and homeostasis. J. Am. Soc. Nephrol. 2009, 20, 2348–2358. [Google Scholar] [CrossRef]
  49. Zou, M.; Alzahrani, A.S.; Al-Odaib, A.; Alqahtani, M.A.; Babiker, O.; Al-Rijjal, R.A.; BinEssa, H.A.; Kattan, W.E.; Al-Enezi, A.F.; Al Qarni, A.; et al. Molecular Analysis of Congenital Hypothyroidism in Saudi Arabia: SLC26A7 Mutation Is a Novel Defect in Thyroid Dyshormonogenesis. J. Clin. Endocrinol. Metab. 2018, 103, 1889–1898. [Google Scholar] [CrossRef] [PubMed]
  50. Bakouh, N.; Bienvenu, T.; Thomas, A.; Ehrenfeld, J.; Liote, H.; Roussel, D.; Duquesnoy, P.; Farman, N.; Viel, M.; Cherif-Zahar, B.; et al. Characterization of SLC26A9 in patients with CF-like lung disease. Hum. Mutat. 2013, 34, 1404–1414. [Google Scholar] [CrossRef]
  51. Xu, J.; Worrell, R.T.; Li, H.C.; Barone, S.L.; Petrovic, S.; Amlal, H.; Soleimani, M. Chloride/bicarbonate exchanger SLC26A7 is localized in endosomes in medullary collecting duct cells and is targeted to the basolateral membrane in hypertonicity and potassium depletion. J. Am. Soc. Nephrol. 2006, 17, 956–967. [Google Scholar] [CrossRef]
  52. Salomon, J.J.; Spahn, S.; Wang, X.; Füllekrug, J.; Bertrand, C.A.; Mall, M.A. Generation and functional characterization of epithelial cells with stable expression of SLC26A9 Cl channels. Am. J. Physiol. Lung Cell Mol. Physiol. 2016, 310, L593–L602. [Google Scholar] [CrossRef]
  53. Kumble, K.D.; Kornberg, A. Inorganic polyphosphate in mammalian cells and tissues. J. Biol. Chem. 1995, 270, 5818–5822. [Google Scholar] [CrossRef]
  54. Palmieri, F. The mitochondrial transporter family (SLC25): Physiological and pathological implications. Pflug. Arch. 2004, 447, 689–709. [Google Scholar] [CrossRef]
  55. Villa-Bellosta, R.; Levi, M.; Sorribas, V. Vascular smooth muscle cell calcification and SLC20 inorganic phosphate transporters: Effects of PDGF, TNF-alpha, and Pi. Pflug. Arch. 2009, 458, 1151–1161. [Google Scholar] [CrossRef]
  56. Shcheynikov, N.; Yang, D.; Wang, Y.; Zeng, W.; Karniski, L.P.; So, I.; Wall, S.M.; Muallem, S. The Slc26a4 transporter functions as an electroneutral Cl/I/HCO3 exchanger: Role of Slc26a4 and Slc26a6 in I and HCO3 secretion and in regulation of CFTR in the parotid duct. J. Physiol. 2008, 586, 3813–3824. [Google Scholar] [CrossRef]
  57. Reimold, F.R.; Heneghan, J.F.; Stewart, A.K.; Zelikovic, I.; Vandorpe, D.H.; Shmukler, B.E.; Alper, S.L. Pendrin function and regulation in Xenopus oocytes. Cell Physiol. Biochem. 2011, 28, 435–450. [Google Scholar] [CrossRef]
  58. Lucea, S.; Guillén, N.; Sosa, C.; Sorribas, V. Inhibition of phosphate transport by NAD+/NADH brush border membrane vesicles. Am. J. Physiol. Cell Physiol. 2022, 322, C803–C813. [Google Scholar] [CrossRef]
  59. Guillén, N.; Caldas, Y.A.; Levi, M.; Sorribas, V. Identification and expression analysis of type II and type III Pi transporters in the opossum kidney cell line. Exp. Physiol. 2019, 104, 149–161. [Google Scholar] [CrossRef] [PubMed]
  60. Villa-Bellosta, R.; Sorribas, V. Different effects of arsenate and phosphonoformate on P(i) transport adaptation in opossum kidney cells. Am. J. Physiol. Cell Physiol. 2009, 297, C516–C625. [Google Scholar] [CrossRef] [PubMed]
  61. Wagner, C.A.; Friedrich, B.; Setiawan, I.; Lang, F.; Bröer, S. The use of Xenopus laevis oocytes for the functional characterization of heterologously expressed membrane proteins. Cell Physiol. Biochem. 2000, 10, 1–12. [Google Scholar] [CrossRef] [PubMed]
Figure 1. Total Pi uptake in the presence of sodium chloride in Xenopus oocytes expressing the SLC26 family members. Only SLC26A6, SLC26A7 and SLC26A9-mediated Pi transport show significant increase above the water-injected level of the oocytes. The dashed line in the graph indicates the level of sodium-independent Pi uptake when sodium is equimolarly substituted with choline chloride. Individual values are represented by circles. The statistical significance of the differences is indicated by asterisks after a comparison with a Brown-Forsythe and Welch ANOVA and a Dunnett T3 test for selected multiple comparisons. *** p = 0.0001; **** p < 0.0001.
Physiologia 06 00039 g001
Figure 2. Expression of SLC26A7 and SLC26A9 in Xenopus oocytes. (a) Pi uptake as a function of the days of incubation, and (b) as a function of the amount of RNA injected. White and black circles represent individual values. The relevant statistical significance of the differences is indicated by asterisks, following a comparison with a Brown-Forsythe and Welch ANOVA and a Dunnett T3 test for selected multiple comparisons. Asterisks: * p < 0.05, ** p < 0.005, *** p < 0.0005, **** p < 0.0001.
Physiologia 06 00039 g002
Figure 3. Immunoblot of plasma membranes after protein biotinylation of oocytes injected with human SLC26A9 or rat Slc34a1 (NaPi2a) cRNAs at either 1 or 10 ng per oocyte. The densitometries of the corresponding bands on top are displayed below. “Total lysate” refers to oocytes lysed and centrifuged, after which the resulting supernatant was utilized. “Membrane” refers to biotinylated membrane proteins. “No biotin” indicates that oocytes underwent the biotinylation procedure without the addition of sulfo-NHS-SS-biotin. See Section 4 for details.
Physiologia 06 00039 g003
Figure 4. Effect of cations, anions and pH on the expressed Pi uptake by SLC26A7 and SLC26A9 in Xenopus oocytes. (a) Sodium-dependence of Pi transport, and effect of chloride (insets). (b) The impact of pH on Pi uptake. White and black circles represent individual values. Asterisks show significant differences of compared groups using a Brown-Forsythe and Welch ANOVA and a Dunnett T3 test for selected multiple comparisons. Asterisks: ** p < 0.005, *** p < 0.0005, **** p < 0.0001; ns, non-significant.
Physiologia 06 00039 g004
Figure 5. Kinetic analysis of SLC26A7 and SLC26A9 expressed transport in oocytes. (a) Saturation kinetics of Pi for SLC26A7 and SLC26A9 expressed transport. The analysis yielded apparent affinity (Km) values of 300 and 220 µM Pi for SLC26A7 and SLC26A9 net Pi transport, respectively. The net (dotted) curves represent the difference between the water-injected values (circles) and the corresponding cRNA transporter-injected uptake. (b) Sodium saturating Kinetics of SLC26A7 and SLC26A9. The estimation of kinetic parameters indicated a net Hill coefficient of 1.4 and high affinity for sodium (16 mM) in the case of SLC26A7. In the SLC26A9 case, the Hill n was comparable (1.1 mM), but the affinity for sodium was notably weaker (128 mM).
Physiologia 06 00039 g005
Figure 6. Pattern of inhibition of SLC26A7 (a) and SLC26A9 (b) expressed Pi transport in Xenopus oocytes. To the sake of simplicity, only net values are shown after subtraction of the water injection values for each SLC26A7 or SLC26A9 treatment condition. Inhibitors were dissolved in water or dimethylsulfoxide, and water-injected oocytes received an equivalent amount of solvent. The final transport media were buffered to a pH of 7.4 in all conditions. Inhibitors and 32Pi were added simultaneously. Black circles represent individual values. Statistical comparisons were made using a one-way ANOVA followed by a Dunnett post-test for multiple comparisons of each column mean with the mean of the control column. The following significant differences are highlighted: * p < 0.05; ** p < 0.005; *** p < 0.0005; **** p < 0.0001.
Physiologia 06 00039 g006
Figure 7. Expression and distribution in cell lines. (a) Left: Immunoblots of total lysate from the indicated cell lines. Right: Comparison of total versus plasma membrane (biotinylated) SLC26A7 and SLC26A9 in LLC-PK1 and MDCK cells. (b) Immunodecoration of SLC26A7 in LLC-PK1 and MDCK cells with organelle markers. In LLC-PK1, colocalizations were significant with cytoskeleton (phalloidin), lysosomes (LAMP1), early endosomes (EEA1) and Golgi (FTCD). In MDCK cells, however, SLC26A7 was found to be highly expressed in cytoplasmic organelles and was found to be very limited in the plasma membrane. (c) Expression and colocalization of SLC26A9 in LLC-PK1 and MDCK cells will be carried out using the same markers as in (b). Bar, 20 µm. For (b,c), please see Section 4 for explanations on the fluorochromes used (d) Graphical representation of SLC26A7 and SLC26A9 colocalizations with phalloidin in the LLC-PK1 and MDCK cells, determined along the Z-stack of the cells. Slide 0 refers to the base of the cell.
Physiologia 06 00039 g007
Figure 8. Relevance of SLC26A7 and SLC26A9 on Pi transport in MDCK cells. (a) Increase of sodium-dependent Pi uptake in MDCK overexpressing either SLC26A7 (left) or SLC26A9 (right). (b) immunoblot of total lysate from cells transfected in the same assay as for Pi transport. Please find below the densitometries of the bands from the corresponding immunoblots. Black circles represent individual values. Statistical analyses were conducted in accordance with the methods outlined in Figure 1. Asterisks: For the sake of clarity and precision, the following p-values have been designated: Asterisks: * p < 0.05; ** p < 0.005; *** p < 0.0005.
Physiologia 06 00039 g008
Table 1. Primers used for amplification of human SLC26 family members cDNAs.
GeneAccession
No.
SenseAntisenseAmplification
bp
SLC26A1NM_022042.4CGGTCCTCGGTGGTCTTGGAGGCAGAGGTTCTTGATTTC37–2454
SLC26A2NM_000112.4CGAGAGGAAGCTGAACCATCTACTCTCTCCACTGAGCCACATAA217–2879
SLC26A3NM_000111.3CTTGCCACAGCCAACAGAAATGGCGCCACTATACTGCTAAA175–2813
SLC26A5NM_198999.3TGTCTCCGGCTGTTAAGGAATAGCGTCATTCACCCTCCAAATC258–2666
SLC26A6NM_022911.3TCGAGCAGCAGGAGCAGTCCCTGAGTTGTGTGTGTGTA28–2476
SLC26A9NM_052934.4GGCTTTGCTCACCCACTGCACCAGACTCTCACTCCTGTAA75–2714
SLC26A11NM_173626.4AGAACTCCAGGGCTGTGAAAAACAGCAGCGAGGTCATTTT76–2324
Table 2. siRNA used for transfection.
SpeciesGeneSenseAntisense
Canis
lupus
SLC26A7AGAUAAGUCUGGUUAAGUUttAACUUAACCAGACUUAUCUtt
SLC26A9GAAUUUCAAUGCUUUUGAAttUUCAAAAGCAUUGAAAUUCtg
Sus
scrofa
SLC26A7CAGCCGGAAUCUUACCACAttUGUGGUAAGAUUCCGGCUGct
SLC26A9GCAAGAUGCCCAAAAAGUAttUACUUUUUGGGCAUCUUGCag
Table 3. Primers used in quantitative PCR.
SpeciesGeneAccession
No.
SenseAntisenseAmplification bp
Monodelphis
domestica
GAPDHXM_056799251.1TCCTGCACTACCAACTGCTTAAGCAGGGATGATATTCTGGG580–757
SLC26A7XM_056823328.1ATCGTGGTGCTTGTTCTCGTTAGCAAGCAAATGACGCAGC1001–1110
SLC26A9XM_056815822.1ACTGTGGTATTTGGGCTTCTCCAACAGTGCAAAAGCCATGCC248–384
Rattus
norvegicus
GapdhNM_017008.4TCCAGTATGACTCTACCCACGCACGACATACTCAGCACCAG209–357
Slc26a7NM_001436655.1CCTCACCACACAGAGCAACTTACGCATAGATCTGAATCAC588–701
Slc26a9NM_001107172.1GTTCGGGACCATGTTTCACACCAGGCGCTCAGGAGAATGTAT2443–2523
Mus
musculus
GapdhNM_001411840.1TCCAGTATGACTCTACCCACGCACGACATACTCAGCACCAG164–312
Slc26a7NM_145947.2GACGCAGGTGGCTTGTCTAATACCCTTCAGGCCCACAACAATAAT1264–1386
Slc26a9NM_177243.4TGTCACTTACTGCTCCCCTCTGGGTCCATACCTGTCTTGGC1703–1783
Homo
sapiens
PPIBNM_000942.5ATGGCACAGGAGGAAAGAGCAAGAACTTTGCCAAACACCACAT368–554
SLC26A7NM_052832.4GTCCTGCCCTAATGAGAAGTGAGGAAGCTGTACAATGGGC1897–2045
SLC26A9NM_052934.4CACCCACTGCTTGTAAATGCTGTCCGGTCCTTCTTCTCAA84–200
Canis
lupus
GAPDHNM_001003142.2GAGATCCCGCCAACATCAAATGTCACGCCCATCACAAACATG295–465
SLC26A7XM_003640018.4AGAAACGGATGGCGAAACCTGCTTCCTCATTGCAGTTGCC1750–1956
SLC26A9XM_005640801.3GCAAGCTGGACTGTTGTGTCGGGCCAAAGCATAGCCATTT1482–1625
Sus
scrofa
GAPDHNM_001206359.1GAGATCCCGCCAACATCAAATGTCACGCCCATCACAAACATG333–500
SLC26A7XM_021089124.1TTGGAATGGGGCGTCATGTTGGTAAGATTCCGGCTGCTCA527–630
SLC26A9XM_021063285.1CACACCAACATCGCCTCACTTTGCCACCACCACCACAATC858–993
Disclaimer/Publisher’s Note: The statements, opinions and data contained in all publications are solely those of the individual author(s) and contributor(s) and not of MDPI and/or the editor(s). MDPI and/or the editor(s) disclaim responsibility for any injury to people or property resulting from any ideas, methods, instructions or products referred to in the content.