Article

Analysis of Physical Fitness and Body Composition in Colombian Female Soccer Players in the U-13, U-15, and U-17 Age Groups Using Principal Component Analysis


by
Boryi A. Becerra-Patiño
1,
Juan David Paucar-Uribe
1,
Carlos Felipe Martínez-Benítez
1,
Valeria Montilla-Valderrama
1,
Armando Monterrosa Quintero
2,
Mert Kurnaz
3,
Rodrigo Yáñez-Sepúlveda
4,5 and
José Francisco López-Gil
5,6,*
1
Faculty of Physical Education, National Pedagogical University, Bogotá 480100, Colombia
2
Altius Performance Laboratory, Physical Education and Sports Program, Universidad Surcolombiana, Neiva 410001, Colombia
3
Department of Physical Education and Sports Teaching, Faculty of Sport Sciences, Haliç University, Istanbul 34060, Türkiye
4
Faculty Education and Social Sciences, Universidad Andrés Bello, Viña del Mar 2520000, Chile
5
Department of Sport Sciences, Faculty of Sport and Health Sciences, Fit Generation Research Institute, AD500 Andorra la Vella, Andorra
6
School of Medicine, Universidad Espíritu Santo, Samborondón 092301, Ecuador
*
Author to whom correspondence should be addressed.
Physiologia 2026, 6(2), 30; https://doi.org/10.3390/physiologia6020030
Submission received: 6 February 2026 / Revised: 16 April 2026 / Accepted: 17 April 2026 / Published: 20 April 2026
(This article belongs to the Section Exercise Physiology)

Abstract

Objective: Analyze physical fitness variables and body composition to define patterns or similarities in performance using principal component analysis. Materials and Methods: Sixty-eight players participated in the study, divided into three groups according to their age: Under-13 (n = 23), Under-15 (n = 27) and Under-17 (n = 18). A comparative cross-sectional study was performed. The variables analyzed were squat jump, countermovement jump, countermovement jump with arms, hamstring strength, COD-Timer 5-0-5, COD-Timer 5 + 5, speed (5, 10, 15 m), and running anaerobic sprint test. Body composition variables were skinfold thickness, diameters, and circumferences. Results: For the squat jump, 10.4% of the variability in speed (η2 = 0.104) and 12.5% of the variability in jump height (η2 = 0.125) are explained by category, both with moderate effect sizes. For the countermovement jump, 10.8% of the variability in speed (η2 = 0.108) and 13.2% of the variability in jump height (η2 = 0.132) are explained by category, both with moderate effects. For the running anaerobic sprint test power test, a large effect size was determined for each of the six times, indicating that at least 57.4% of the variability in time is explained by category. Conclusions: Two control groups were identified according to category (Under-13, Under-15, Under-17), revealing that principal component 1 and principal component 2 were significant in the performance of anthropometric variables such as residual mass, bi-styloid diameter, arm span, and residual mass, and physical variables, specifically related to COD-Timer 5 + 5, COD-Timer 5-0-5, and speed.

1. Introduction

In recent years, the widespread adoption of women’s football at all competitive levels has led to a growing number of girls and young women wanting to participate in the sport. Predictions made by the International Federation of Association Football [1] estimate that by 2026, the number of women playing football will reach nearly 60 million [1,2]. Consequently, this constant evolution has allowed women’s football to become a field that promotes research in various areas of knowledge, as shown by several bibliometric studies [3,4]. Women’s football has sparked scientific interest, with approximately 53% of all existing publications on the sport appearing between 2019 and 2024. The main concepts investigated are related to the study of physical performance, athletic performance, anthropometry, and elite athletes [3]. Based on this, it is evident that there is a low level of scientific production on the study of children’s and youth women’s football, which is why the development of studies characterizing player performance at these ages is necessary. In turn, the study developed by Ventaja-Cruz et al. [4] indicates that the physical performance of female players is one of the main research topics. Although few studies compare these abilities across different age groups.
Based on this, studies suggest that physical variables can differentiate the competitive level exhibited by female soccer players at youth ages [5,6]. Therefore, it can be defined that the athletic performance of youth players may be mediated by the expression of their conditional abilities, which is why investigating the differences in physical fitness associated with the age of the players is relevant for researchers [7]. Various studies demonstrate how the evaluation of physical variables in women’s soccer is a key tool for the training process and monitoring of performance in competition [8,9]. Among the most important abilities are strength and power [10,11], speed and the ability to repeat sprints [12,13], and changes in direction [14]. These capabilities allow the player to adapt to the demands of the competition, mainly because there are studies that have analyzed that metrics of physical performance, such as acceleration and jumping, could be variables that can influence the improvement of the change in direction (COD) [15].
Meanwhile, other studies have analyzed anthropometric results in youth female players, demonstrating that variables such as body mass and fat-free mass appear to be key determinants of player performance [16]. On the other hand, the systematic review by Randell et al. [17] concludes that the physical fitness and anthropometric variables of the players are heterogeneous, which is why further studies are needed to understand the main characteristics in response to each geographical context. The investigation by Toselli et al. [18] shows that older players have better results in physical fitness tests and significant differences in body composition, especially in fat-free mass and skinfold thickness. However, it is necessary to conduct studies in different geographical contexts to understand body composition as an indicator related to the contextual needs of the players. A study that assessed body composition, somatotype, and phantom strategy in female players across three categories revealed that muscle mass is one of the main predictors of performance due to its impact on power and initial sprint speed. Adiposity is considered a key indicator of age-related performance, demonstrating that late-maturing athletes tend to have higher fat values compared to early-maturing athletes, leading to a change in body mass [19]. Therefore, it is essential to study physical fitness variables and anthropometric characteristics at different ages, competitive levels, and using distinct data analysis methodologies.
The relationship between physical fitness variables and anthropometric results is fundamental for providing multidimensional approaches that allow for training strategies adapted to contextual demands, the roles they play, and especially the age of the players [17,18,19]. In this context, the study of other research approaches, such as multivariate studies, allows a different perspective on the various variables that contribute information to understanding the performance of female soccer players [20,21]. In recent years, team sports like soccer have experienced scientific and technological advancements [22], leading to the development of software capable of collecting and processing large volumes of real-time data or post-processing [23]. Therefore, reducing the amount of data is one of the scientific challenges [24]. Currently, methods such as principal component analysis (PCA) have emerged in the sports context, extracting information through dimensionality reduction and variable grouping [25]. PCA has thus made it possible to explain and draw conclusions about information in team sports like soccer [26], which have new research challenges [27,28,29]. Furthermore, in a sport like soccer, success is closely linked to the comprehensive development of multiple skills, including physical, physiological, and anthropometric abilities, all relevant for optimal athletic performance [30,31]. Thus, PCA facilitates the interpretation of athletic performance within a single study.
In conclusion, women’s soccer currently has a wealth of data derived from physical assessments that allow a more precise understanding of the game demands. Consequently, multivariate analyses such as PCA are emerging, which reduce dimensionality and group variables, facilitating the identification of variables that can influence athletic performance. Therefore, this study aimed to characterize the PCA of female players according to physical fitness variables and anthropometric factors with respect to the category in which they compete.

2. Materials and Methods

2.1. Design and Procedures

This was a cross-sectional, comparative, and correlational exploratory study [32]. Field tests were conducted over three weeks, always at the same time under equivalent environmental conditions. All tests followed a protocol consisting of five different actions, each lasting 45 s of work and 15 s of active recovery. These were: (1) running in a straight line; (2) running with hip abduction–adduction movements; (3) alternating running with changes in direction; (4) running with jumps; and (5) 10 m sprint. Each exercise was performed in the above order and repeated twice for a total of 10 min of work.

2.2. Participants

Research was conducted with 68 players divided into three different age categories. The most representative data from the sample evaluated is shared in Table 1. Considering the study design, a power test was applied to define the sample size. Thus, with a nominal power of 80% and a type I error using Cohen’s d statistic, it was determined that the number of players for each category would be: Under-13 (23), Under-15 (27), and Under-17 (18). Likewise, to be part of the study, the players had to meet the following criteria: (1) have had menarche as an indicator of sexual maturation; (2) have no musculoskeletal injuries in the minimum of two months prior to the physical fitness assessments; (3) not report pain in the lower or upper extremities at the time of testing; (4) have at least two years of soccer experience and train at least three times a week with official competitions; (5) be a player on the Bogotá team in the respective U-13, U-15, and U-17 categories; (6) voluntarily participate in the study by signing the informed consent form on behalf of the player and the parent and/or legal guardian. Meanwhile, the exclusion criteria were: (1) being invited to the selection process but not being registered on the roster for the official tournament; (2) having health problems that prevent her from performing high-intensity work; (3) not completing all the evaluations.
To try to avoid bias in the results, the players were advised not to perform high-intensity work for at least two days before the evaluation. The evaluations were carried out on Wednesday, Thursday, and Friday, ensuring two days before and after the competitions with their clubs and seeking to ensure that fatigue did not interfere with the players’ performance.

2.3. Equipment

The equipment used is detailed below. An OMRON scale, model HBF-514C (OMRON Corporation, Kyoto, Japan), was used to measure the players’ body mass (accuracy 0.1 kg). A SECA stadiometer (SECA, Hamburg, Germany) was used to assess height (accuracy 0.1 cm). The instruments used to measure body weight and height were pre-calibrated according to the manufacturer’s instructions.
Physical fitness was assessed using several tests, which are detailed below. Explosive strength was assessed using a 90° squat jump, starting from a static position with hands on the waist. The protocol used required the player to remain in a flexed position (90°) for 5 s and then jump vertically. The countermovement jump(CMJ) assesses the force that the athlete is able to accumulate in a squat jump starting from an extended position with hands on the waist, and the countermovement jump with arms (CMJA) assesses the elastic–explosive strength of the lower limbs when performing a squat in coordination with the momentum of the arms to reach maximum vertical height. These jump tests were performed using the My Jump application, which has demonstrated acceptable validity (r = 0.995, p < 0.001) [33] and high reliability values (ICC > 0.80) [34]. For each of the three jumps, the application provided values for jump height in centimeters (cm), flight time in milliseconds (ms), speed in milliseconds (m/s), force in newtons (N), and power in watts (W). The electronic device used was an iPhone 14 with a dual camera system, featuring a 12 MP (f/1.5) main sensor and a 12 MP ultra-wide-angle sensor, offering improved performance in low-light conditions (model 2023, Cupertino, CA, USA).
Hamstring strength (HS) was assessed using the Nordic curl exercise, evaluating the angle produced from the knee, while the breaking point was established when the player lost voluntary control while slowly lowering herself, taking the torque and breaking angle values as a reference [35].
To assess anaerobic running speed (RAST), the test developed by Zagatto et al. [36] was used, which consists of six repeated maximum-intensity runs covering 35 m, with a 10 s rest between each run. This test yields values for time (s), power for each sprint (W), minimum, maximum, and average power, as well as the fatigue index. To do this, the test uses the following equation: (Body Mass × Distance2)/Time3. This test has shown high levels for assessing performance scores (p < 0.05). Agility was assessed using the COD-Timer 5-0-0 test, in which the player had to run 10 m, make a complete turn, and then sprint 5 m, while in the COD-Timer 5 + 5 test, the player ran 5 m, made a complete turn, and then ran the remaining 5 m. These tests sought to measure contact time and total time taken to complete the course. The instrument used was the iPhone application (version 2), which has high levels of reliability (r = 0.964; 95% confidence interval [CI] = 0.95–1.00; standard error of the estimate = 0.03 s; p < 0.001) [37,38]. Finally, speed was assessed in different fractions (5, 10, 15 m) over a total distance of 15 m using the Runmatic app from My Jump. This application assesses running time when covering each of the selected sections with high levels of reliability when compared to optoelectronic systems (ICC = 0.965–0.991) [39].

2.4. Physical Fitness Tests

Physical fitness tests were used to assess the players’ physical performance level in response to their age group. The assessment protocol was based on another study that evaluated the same physical variables [25]. On the first day, strength tests (SJ, CMJ, CMJA) were performed. On the second day, RAST and HS tests were conducted. The third day included the COD-Timer 5-0-5 and speed tests. Assessments for each day were spaced 48 h apart. For the jump tests, the recording device was positioned two meters from the athlete’s jump zone. The tests and variables obtained are described below, following the order in which they were performed during the study, with each test separated by two minutes of passive recovery [40]. Anthropometric measurements were taken after all physical tests were completed.

2.5. Evaluation of Anthropometric Variables

The players’ somatotype was assessed using the Heath-Carter anthropometric method, a widely used technique for evaluating body composition and physiognomy [41]. Anthropometric measurements, including height, body mass, skinfold thickness (triceps, subscapular, biceps, iliac crest, supraspinal, abdominal, thigh, calf), bone diameters (humerus, bi-styloid, femur), and muscle circumferences (biceps, contracted biceps, waist, hip, thigh, calf), were taken by personnel certified by The International Society for the Advancement of Kinanthropometry (ISAK) following standardized protocols [42]. Each measurement was taken in duplicate. Since there were differences of 5% in skinfold thickness and 1% in the other measurements, a third measurement was taken to ensure accuracy, using the mean value for analysis. The Heath-Carter somatotype components endomorphy, mesomorphy, and ectomorphy were calculated using appropriate regression equations, which provided a detailed profile of each player’s physiognomy [41].

2.6. Procedures

Each procedure was developed in accordance with the ethical principles for research involving human subjects outlined in the Declaration of Helsinki [43]. The guidelines of the Colombian Ministry of Health, specifically Resolution 8430 of 1993, which establishes standards and guidelines for research using non-invasive procedures, were also considered, and the study was declared low risk according to Colombian regulations. The study was approved by the Ethics Committee of the Faculty of Physical Education at the National Pedagogical University (340ETIC-014-2024). Before the tests began, the researchers were familiarized with the protocols, applications, and procedures for conducting the physical and anthropometric tests, aiming to minimize the possibility of error during the evaluation. To this end, informed consent forms were completed and shared with parents and guardians, coaches, and players, providing full information on the potential risks, objectives, and opportunities facing the athletes. All assessments were carried out in the presence of the entire coaching staff, mainly coaches, kinesiologists, and physiotherapists in charge of the Bogotá women’s soccer team.
The players were organized into groups of four and scheduled to arrive 30 min before the evaluation. Upon completion of the physical and/or anthropometric tests, the research team downloaded the data to a laptop and exported it to an Excel spreadsheet to create a database before entering it into the statistical package for subsequent analysis.

2.7. Statistical Analysis

The results of the various tests performed on the players based on their categories are presented as mean and standard deviation (SD). The normality and homoscedasticity of the data were initially assessed using the Shapiro–Wilk test and Levene’s test, which showed that the data did not follow a normal distribution or exhibit equal variance between the groups. Consequently, logarithmic transformations were applied to the data, and normality was subsequently re-evaluated. The differences between the groups were then analyzed using an analysis of variance (ANOVA), followed by a Bonferroni post hoc test to evaluate significant pairwise differences. The significance level was established at p < 0.05 (* p < 0.05; ** p < 0.01; *** p < 0.001). Effect sizes were calculated using the Eta-squared (η2) and Omega-squared (ω2) coefficients. The magnitude of the effect sizes was interpreted according to the criteria established by Hopkins: trivial (<0.01), small (0.01–0.09), moderate (0.09–0.25), large (0.25–0.49), very large (0.49–0.81), and nearly perfect (>0.81).
Then, to identify the profile of each variable in the three categories (U-13, U-15, U-17), the PCA [22] was used. The variables were scaled and centered (Z-score). To define the PCA statistical parameter, the determinant of Kendall’s correlation matrix was used. A value close to 0 was obtained, indicating high multicollinearity and suggesting that the variables exhibit significant linear relationships, with most of the data variability concentrated in the first two dimensions. Eigenvalues > 1 were considered for PCA extraction. A Varimax orthogonal rotation method was applied to identify the high correlation of the components and ensure that each PC provided different information. A threshold of 0.5 was maintained for each PCA load for interpretation. The values assigned to each observation for all players and the quantitative variables are included. The purpose of PCA is to generate uncorrelated (orthogonal) variables to eliminate redundancy (multicollinearity) that may exist in the original variables and, in this way, optimize the explained variance using fewer variables. This allows for the simplification of complex structures, a reduction in dimensionality, and the elimination of “noise” by concentrating essential information into new independent dimensions. For this reason, the 16 variables least correlated with one another were selected. All analyses were performed using RStudio® software version 4.5.0 (INC, Boston, MA, USA, 2025).

3. Results

3.1. Differences Related to Force Variables: Squat Jump, Countermovement Jump, Countermovement Jump with Arms and Hamstring Strength

Table 2 details the descriptive and inferential analysis of the vertical jump and hamstring strength (HS) variables. No statistically significant differences were observed among the U-13, U-15, and U-17 categories regarding the kinematic parameters of the squat jump (SJ), countermovement jump (CMJ), and countermovement jump with arm swing (CMJA), including both jump height and takeoff velocity (p > 0.05, ω2 ≤ 0.01). Conversely, the analysis revealed significant inter-group variations in hamstring strength. HS torque exhibited a significant difference (p = 0.042, ω2 = 0.07), with post hoc comparisons indicating a specific divergence between the U-13 and U-15 cohorts. Furthermore, the HS angle showed a statistically significant shift (p = 0.016, ω2 = 0.1), where the U-17 group demonstrated significant differences when compared to both the U-13 and U-15 categories.

3.2. Differences Related to COD-Timer and Speed

Table 3 illustrates the outcomes related to change-of-direction (COD) ability and linear speed. Significant differences were identified in total COD time (p < 0.001, ω2 = 0.26) and average COD speed (p < 0.001, ω2 = 0.24), where post hoc tests confirmed that the U-13 group was significantly slower than both the U-15 and U-17 cohorts. Additionally, contact time during the COD task significantly differentiated the U-13 and U-15 groups (p = 0.012, ω2 = 0.1), while the COD deficit showed no significant variations (p = 0.794). Regarding linear sprint acceleration (split times), the initial explosive phase (0–5 m) remained undifferentiated across categories (p = 0.931). However, as the sprint distance increased, significant maturational gaps emerged: U-13 players were systematically slower than the advanced U-17 cohort at the 10 m mark (p = 0.032, ω2 = 0.07) and particularly at the 15 m mark (p = 0.002, ω2 = 0.21).

3.3. Differences Related to Power Variables

The results from the running anaerobic sprint test (RAST) are presented in Table 4. This test yielded the most robust physiological differentiation across the age brackets. Highly significant overall inter-group differences (p = 0.001) were found for all primary variables, encompassing the six sprint times, their corresponding power outputs, as well as maximum, minimum, and average power. These variables exhibited very large effect sizes (η2 ranging from 0.533 to 0.744), underscoring a pronounced, maturation-driven enhancement in metabolic anaerobic capacity across all age groups. The only exception to this widespread differentiation pattern was the fatigue index; although it presented a significant overall variance (p = 0.001, η2 = 0.389), pairwise comparisons revealed that it only differed significantly between the U-13 and U-15 cohorts.

3.4. Differences Related to Anthropometric Factors

Table 5 presents the results for the anthropometric variables across the U-13, U-15, and U-17 categories. Significant differences were observed primarily in muscle mass and fat distribution. Absolute muscle mass (kg) showed a large effect size (p < 0.001), with the U-17 group presenting significantly higher values than the U-13 (letter E) and U-15 (letter F) categories. Similarly, relative muscle mass (%) was significantly greater in the U-17 cohort compared to the U-15 (letter B) and U-13 (letter C) groups (p = 0.002). Regarding fat distribution, the U-17 players exhibited significantly lower Faulkner and Carter fat mass percentages (p < 0.001 for both) when compared to the U-15 (letters H and K, respectively) and U-13 categories (letters J and L, respectively). Additionally, a significant difference was found in the residual mass percentage (p = 0.033), specifically between the U-15 and U-17 groups (letter G). No statistically significant differences were observed for the remaining variables, such as global fat percentage, bone mass, and absolute adipose mass (p > 0.05).

3.5. Analysis of Principal Component Analysis by Category and Variables Determining Player Performance

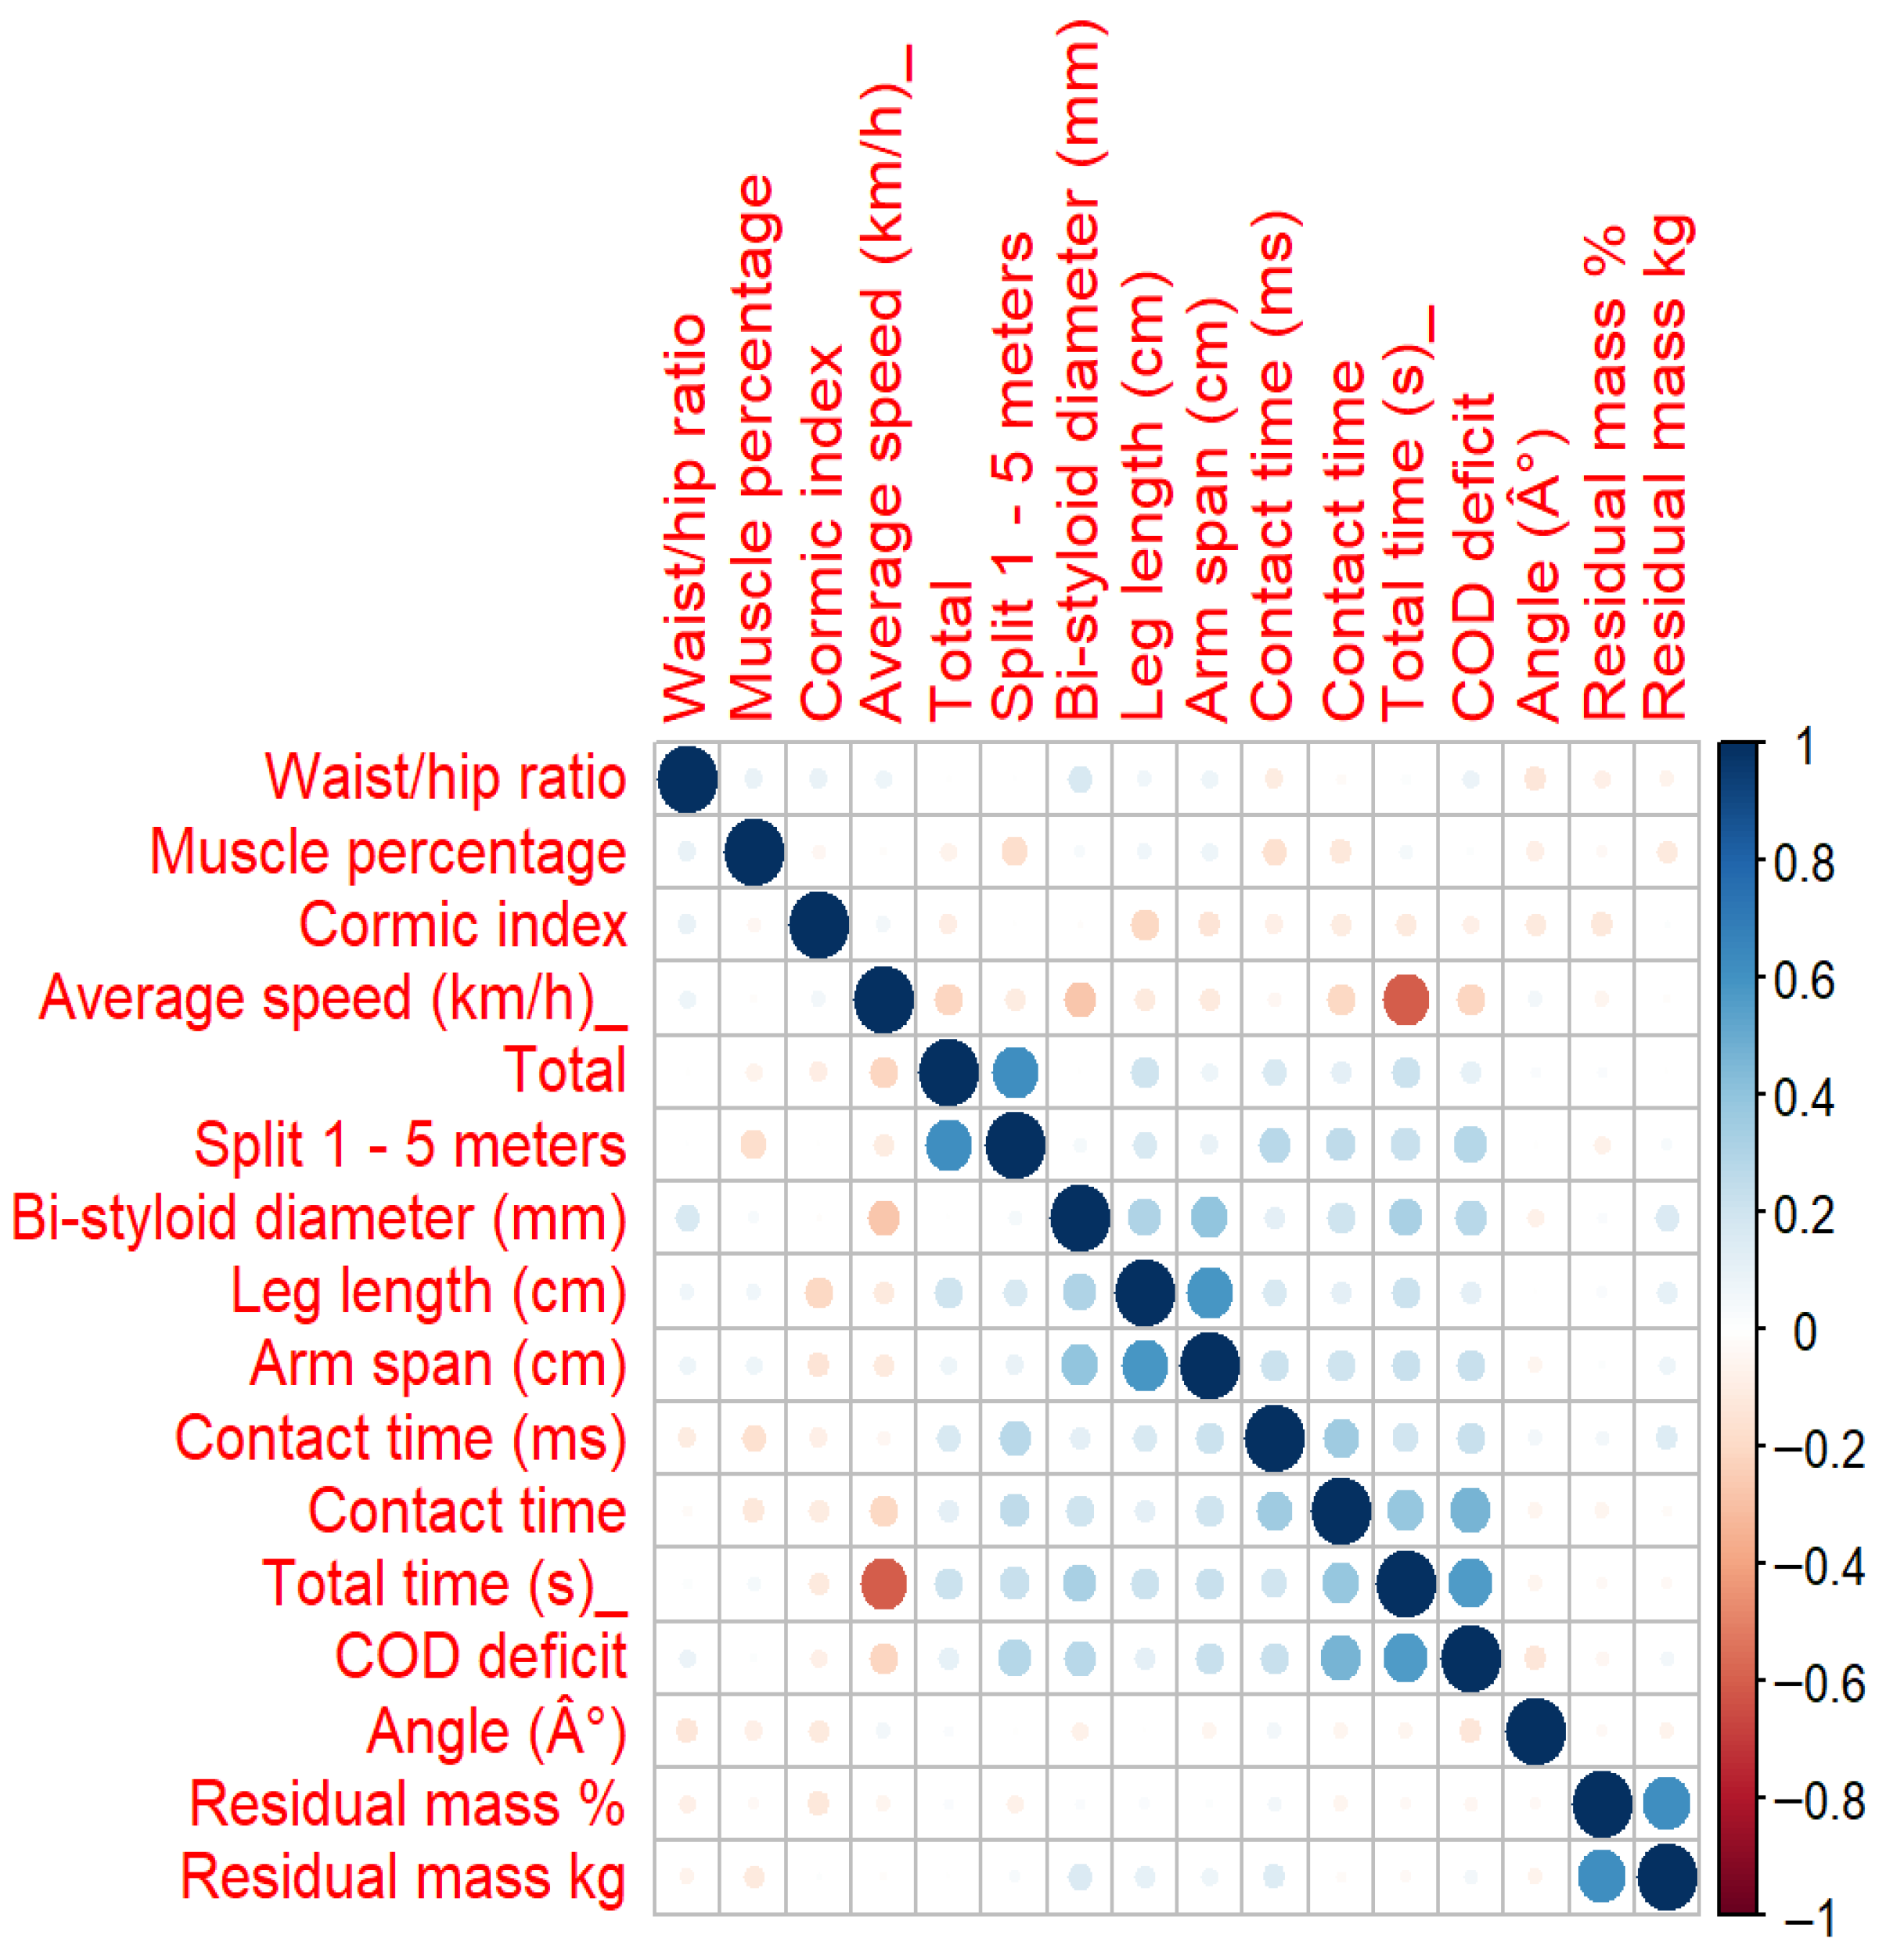
A chi-square test was performed to verify significant differences in category frequencies, with a p-value < 0.05, indicating that differences exist. To avoid overlapping in the final graphs, Kendall’s correlation and Shapiro–Wilk normality tests were performed to determine high correlation and normality, respectively. These tests were conducted by groups with three main categories, resulting in the 16 least correlated variables. PCA was used to establish the relationship between the category and the different variables. This determined the contribution of each original variable to each PC. The values (loadings) range from −1 to 1, where larger absolute values indicate a greater contribution of the variable to the section (Figure 1).
The PCA shows the analysis for each of the physical fitness tests and anthropometric measurements of the evaluated players. The two main PCs for the players were extracted according to their category, with PCA1 explaining 63% and PCA2 explaining 37% of the total variance. PCA1 and PCA2 considered anthropometric variables such as leg length, residual mass, bi-styloid diameter, arm span, and residual mass, as well as physical variables specifically related to speed and COD-Timer (Table 6).
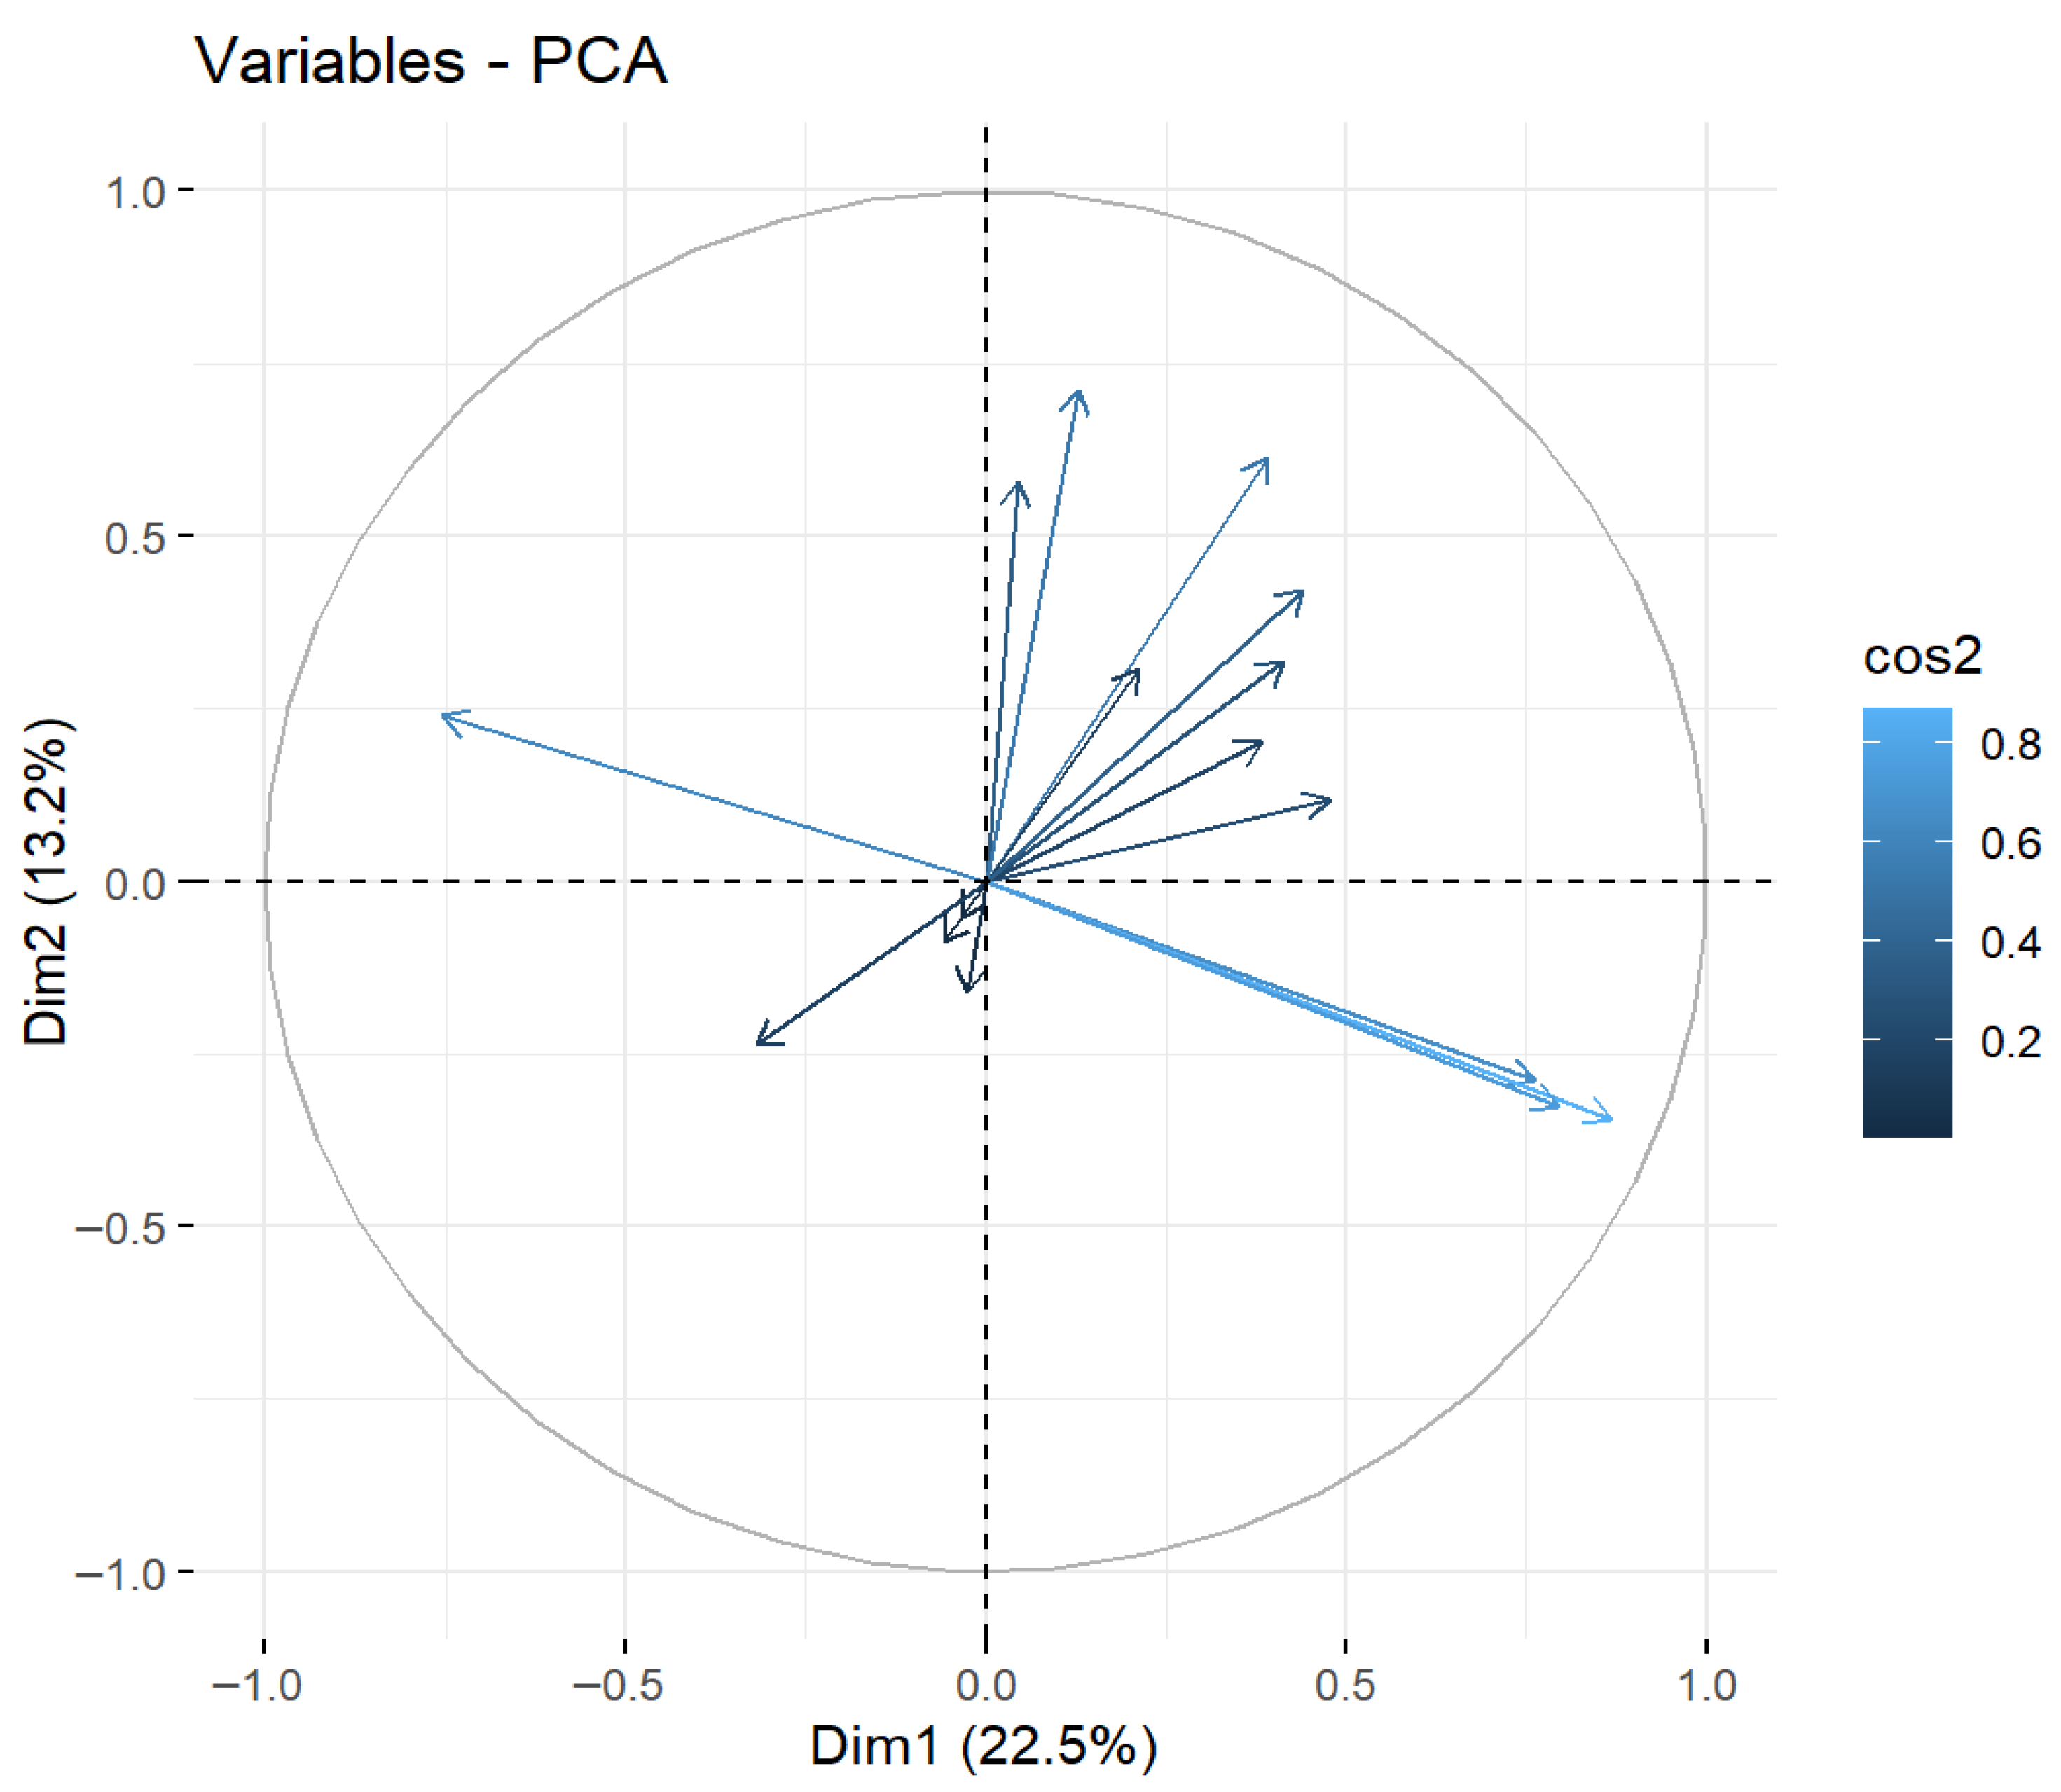
Figure 2 explains 22.5% of the variance in dimension 1 (Dim 1) (X-axis) and 13.2% in dimension 2 (Dim 2) (Y-axis), for a total of 35.7% of the total variance. Dim 1 and Dim 2 correspond to the first and second dimensions extracted from the multivariate analyses. The arrows/vectors (variables) indicate that each arrow represents an analysis variable, and their position and direction show that variables pointing in similar directions are positively correlated. On the other hand, variables with arrows pointing in opposite directions are negatively correlated. Longer arrows indicate that the variables are well represented in this 2D plane, while shorter arrows indicate variables that are poorly represented in these two dimensions. Thus, variables such as speed are related to residual mass (kg).
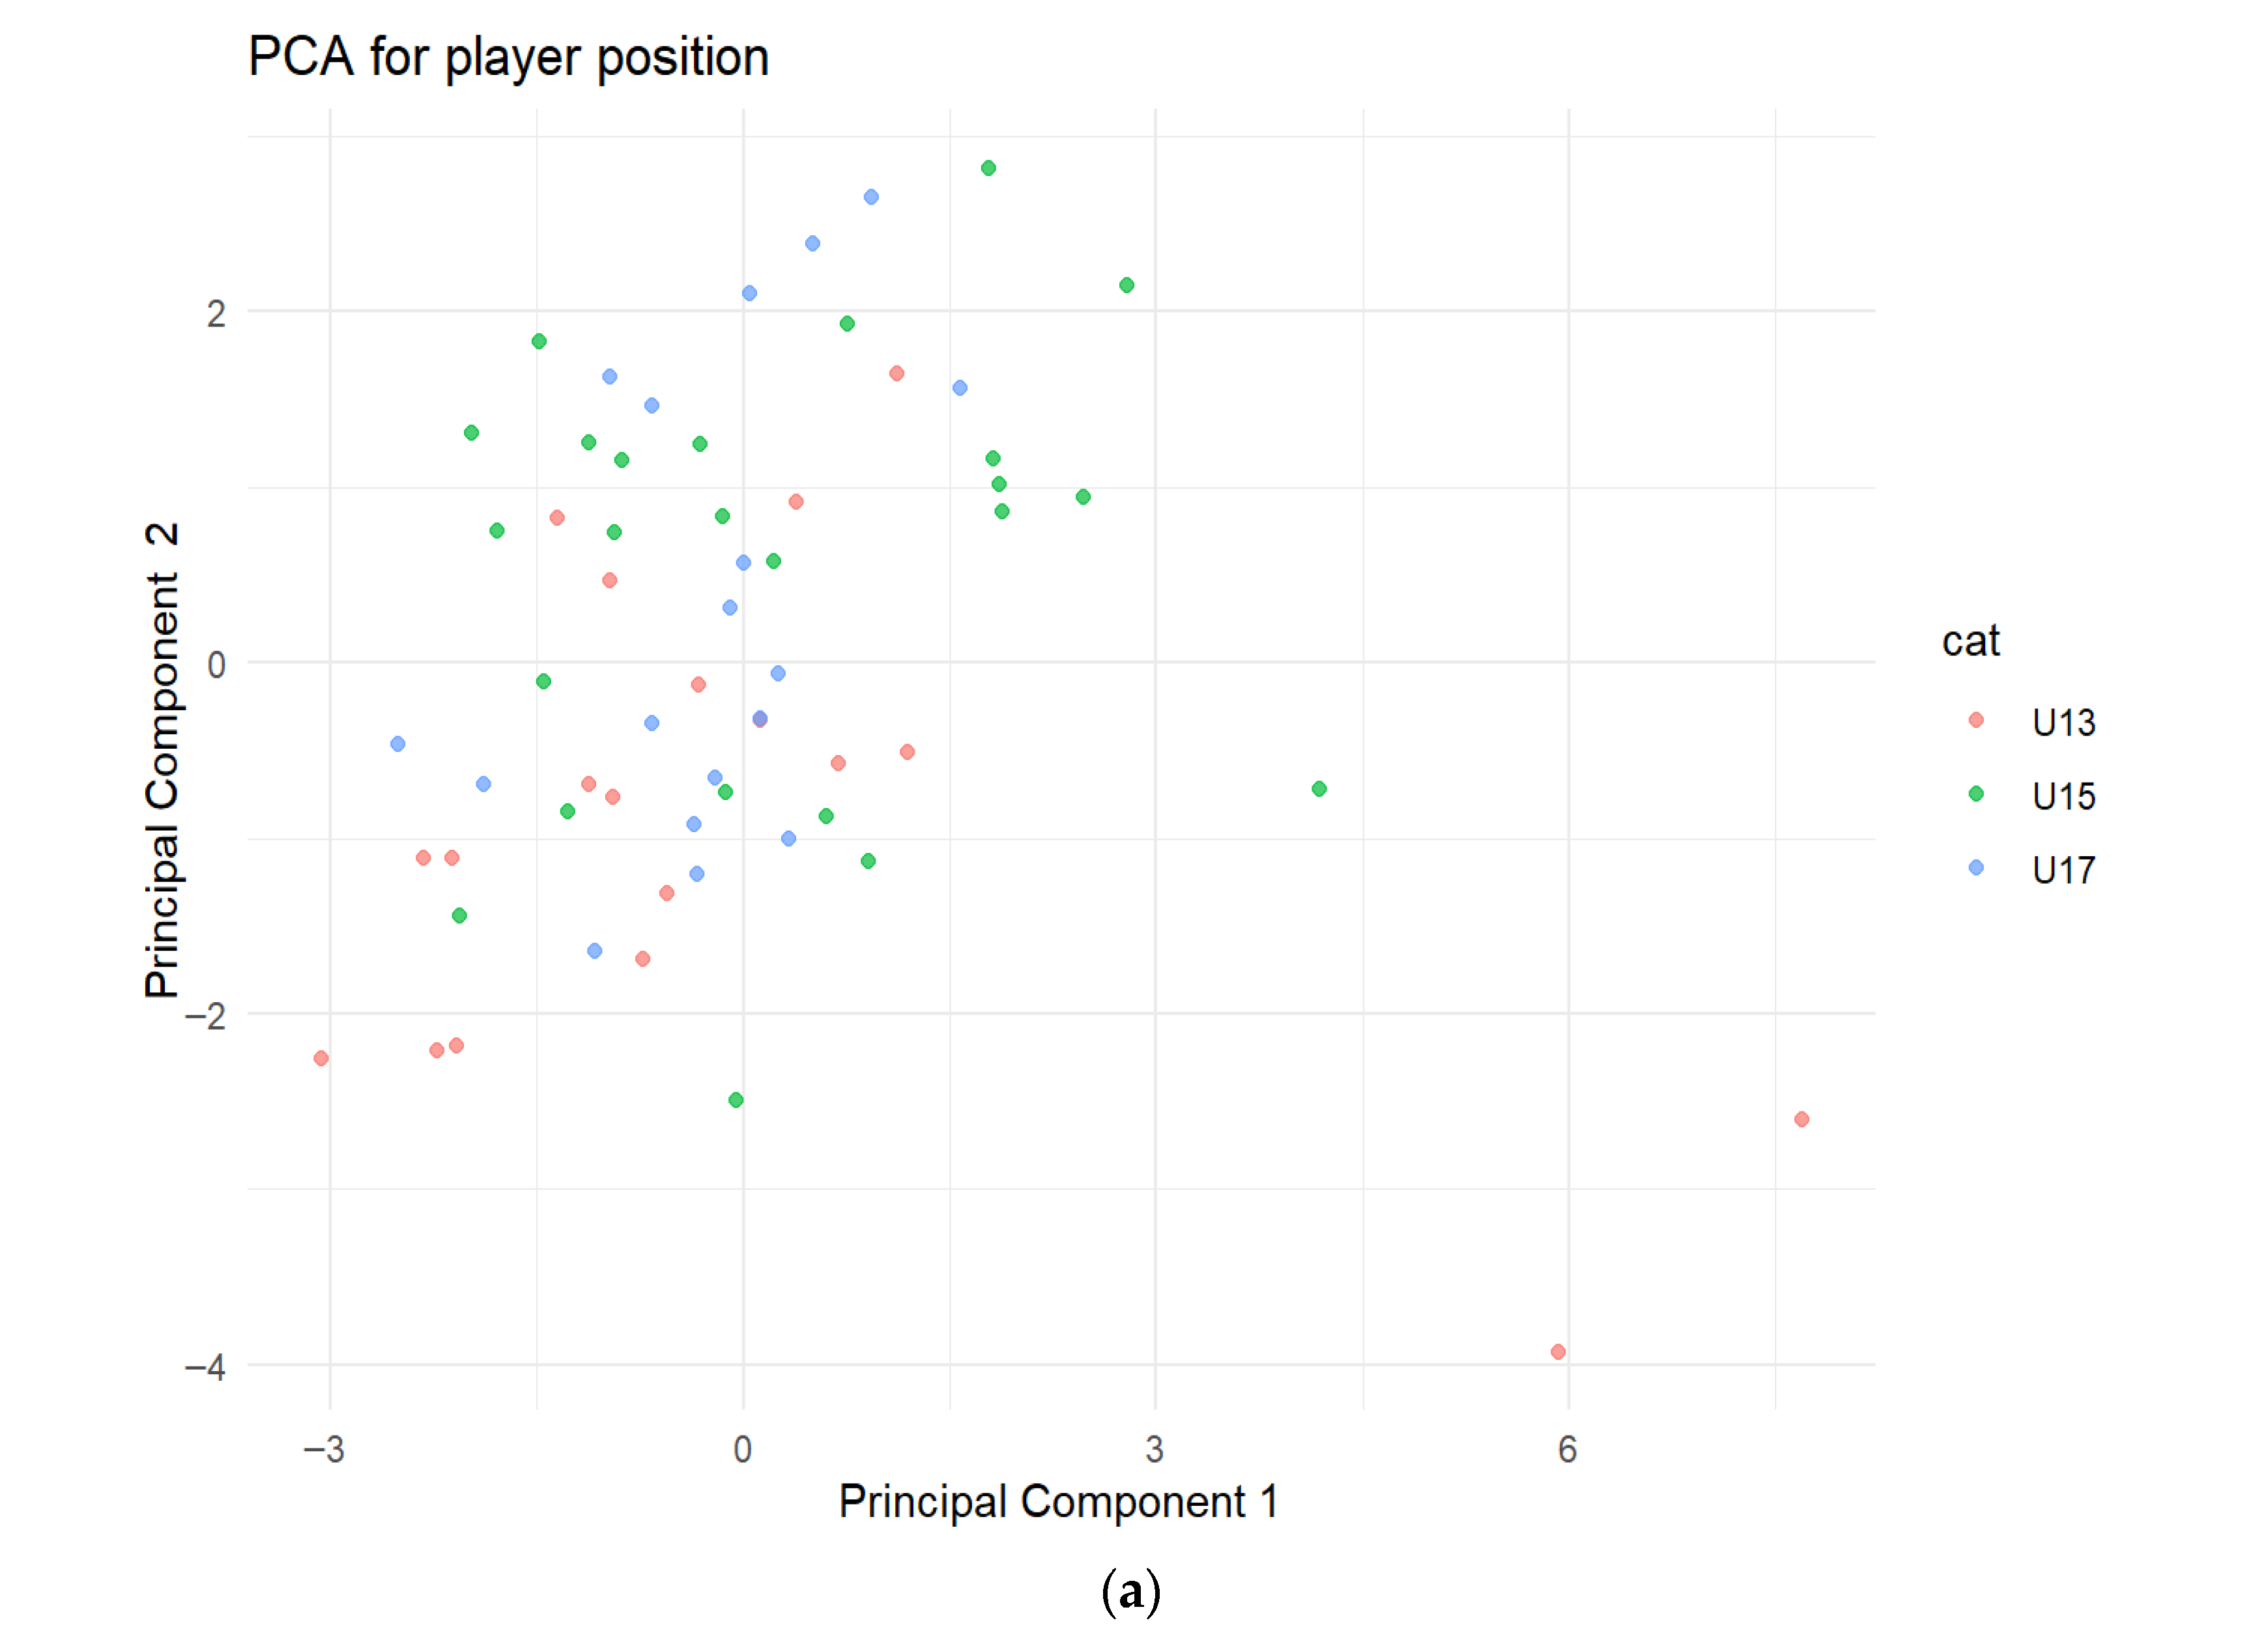
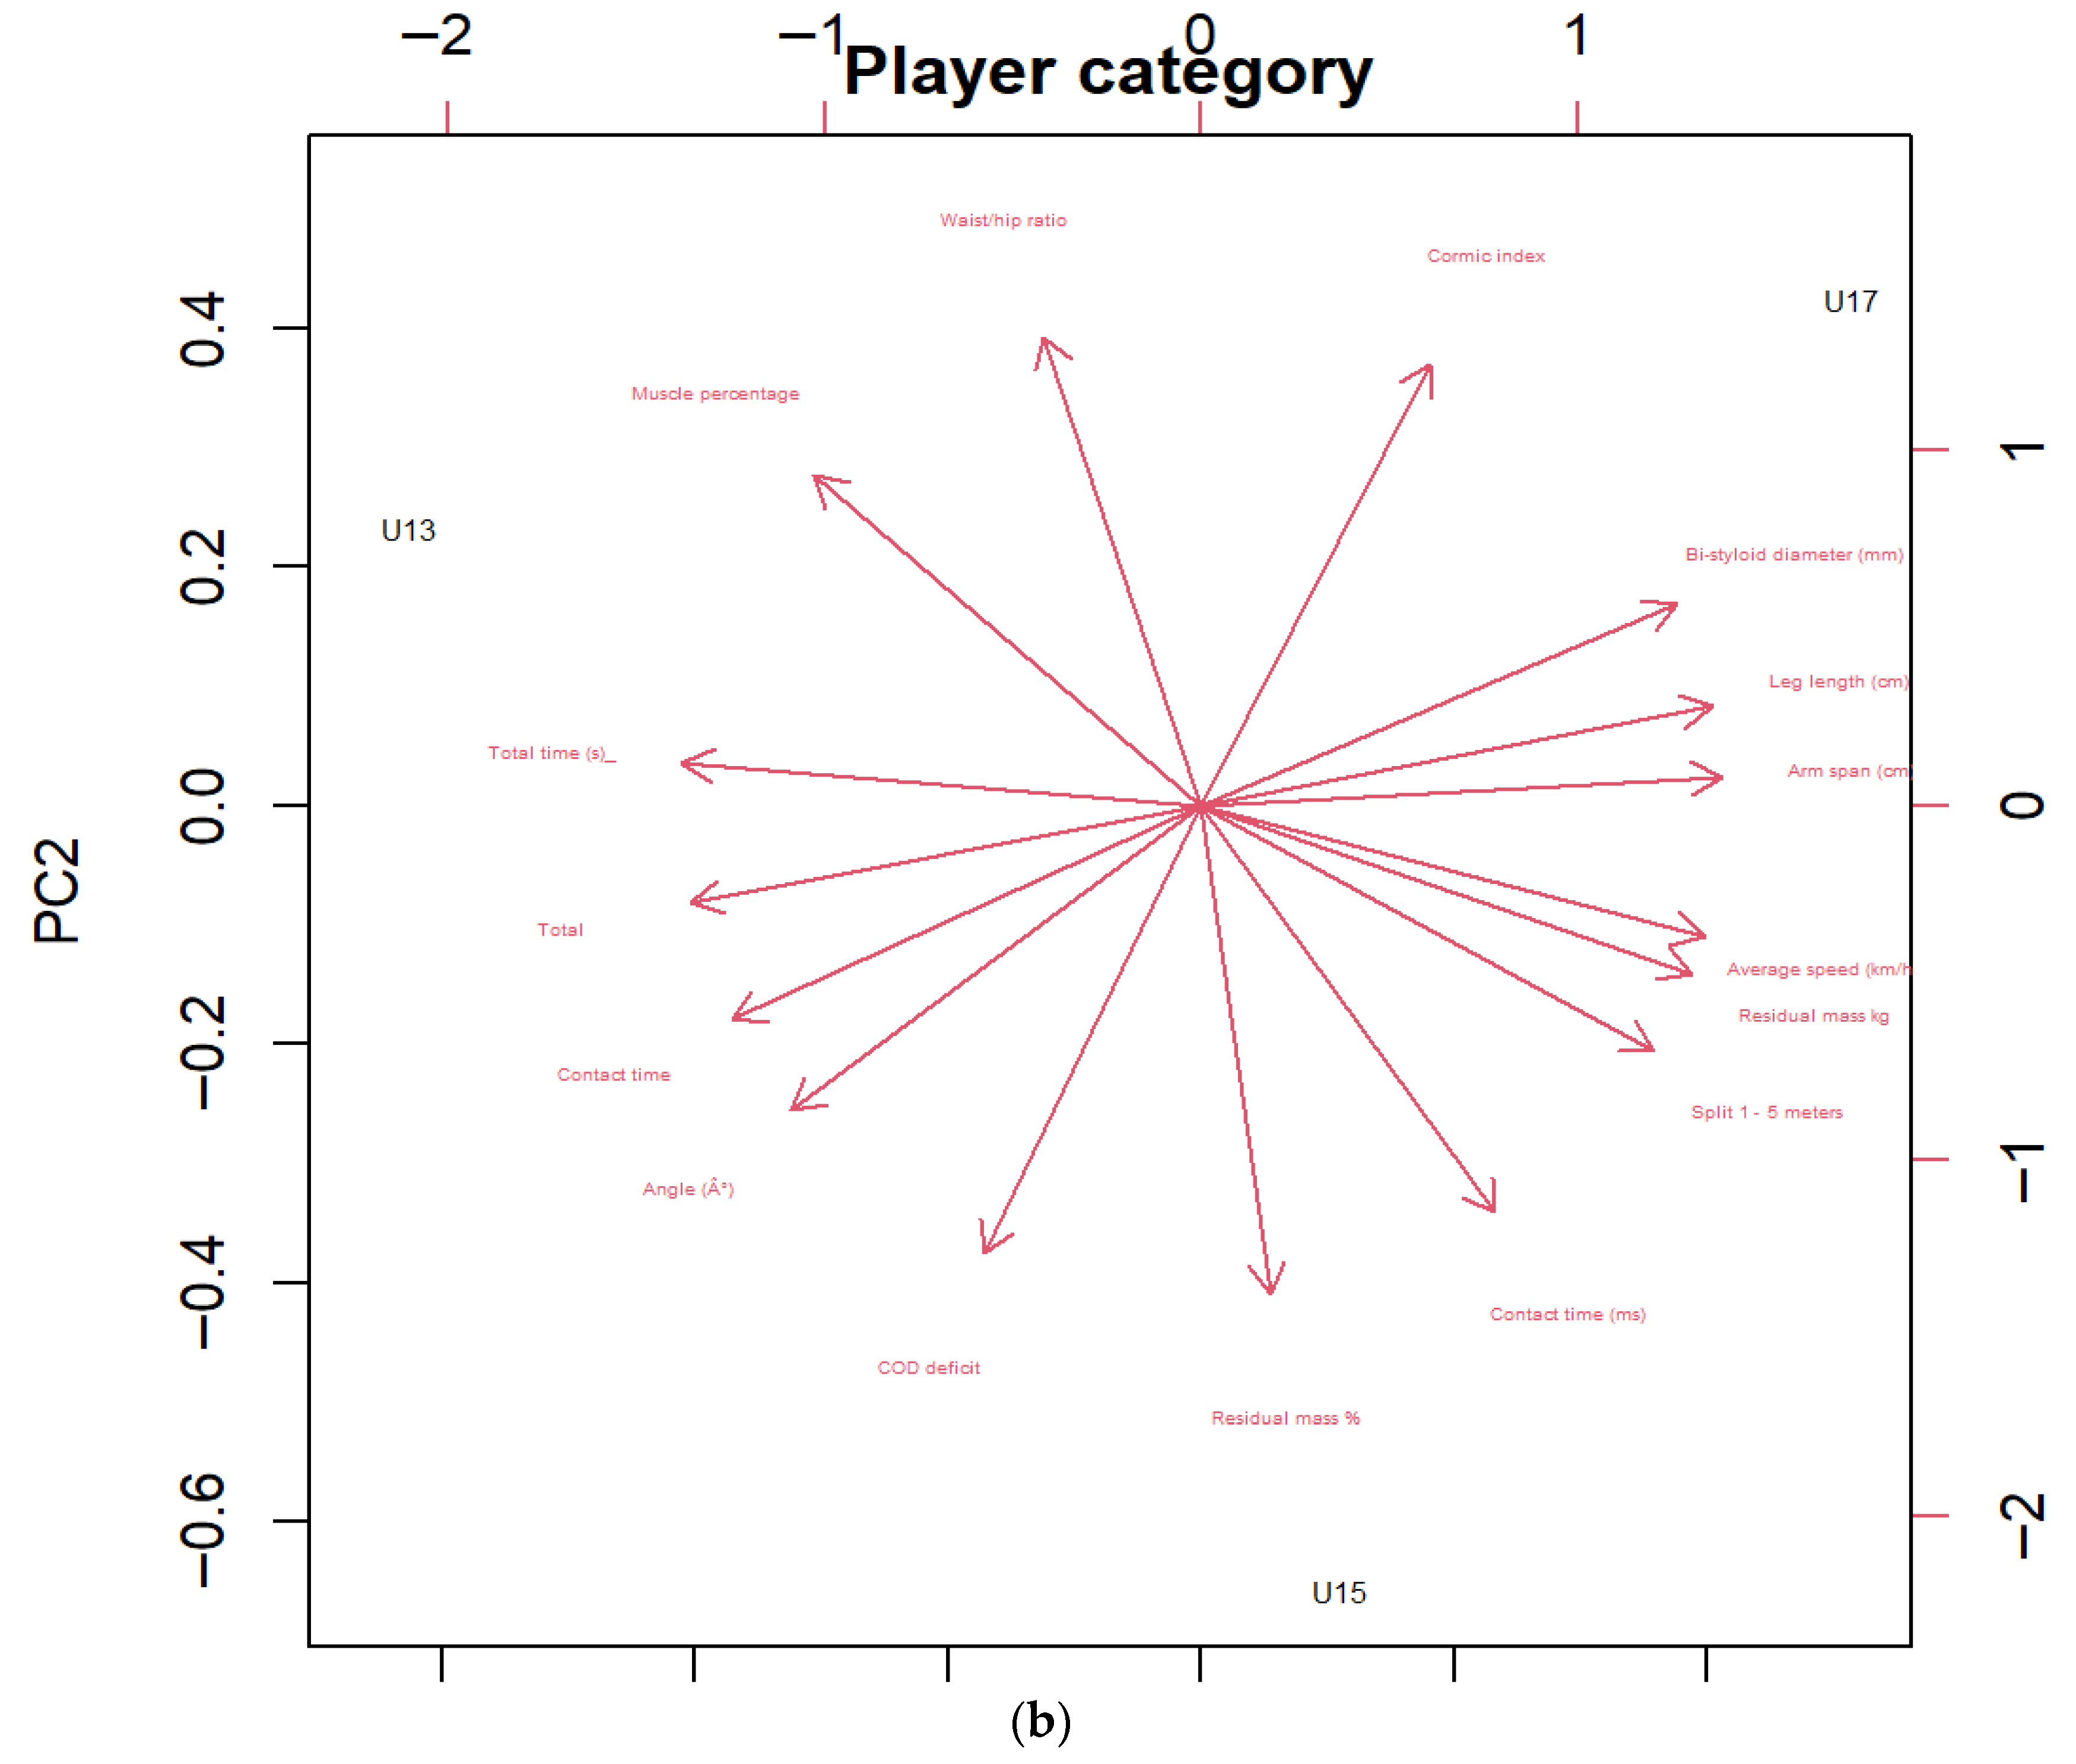
The PCA by category indicates that category U-13 shows lower point values on the anthropometric (Y-axis) and lower times on the performance (X-axis). In the U-17 category, these values are generally higher on the anthropometric axis and correspond to longer times (indicating lower speed). Finally, the U-15 category shows the highest anthropometric values, but also longer times and consequently, lower speed (Figure 3a). The biplot indicates that the Cormic index variable, when it presents higher anthropometric values, is associated with longer times. The U-17 category also shows this behavior. The best-performing category in this case is U-13, as its times are low, even though its anthropometric level is high. Meanwhile, the U-15 category has the lowest anthropometric levels, although it has better times than the U-17 category (Figure 3b).

4. Discussion

This study aimed to characterize the PCA of female players with respect to the category in which they compete. A total of 68 players were evaluated using various physical fitness and anthropometric tests. The study by Hernandez-Martinez et al. [44] reported physical performance variables such as jumping, running speed, and ball-kicking speed in relation to body composition analysis in female players, while other studies report changes in direction, intermittent tests, and endurance tests in response to game roles [25]. Despite this, few studies have reported the analysis of physical fitness and anthropometry in female players in the U-13, U-15, and U-17 categories using PCA. This is one of the first studies that attempts to understand the physical fitness responses to anthropometric factors in young Colombian players.

4.1. Physical Fitness and Anthropometric Variables

Regarding jumping abilities such as SJ, CMJ, and CMJA, previous findings have observed significant improvements in jump height by playing position, with defenders exhibiting greater power and jump height, without a direct association with body measurements such as height and body mass. Furthermore, the CMJ and CMJA showed the best results in the older age category [45]. Another study conducted by Loturco et al. [46] reported that the U-15 category shows lower values between SJ and CMJ compared to U-17, U-20, and senior, with large effect sizes (between 0.97 and 1.16 for SJ, and between 1.19 and 1.41 for CMJ). These results differ from those of the present study, in which no statistically significant differences were found among the age groups analyzed (13–17 years) regarding the kinematic parameters of the squat jump (SJ), the countermovement jump(CMJ), and the countermovement jump with arm swing (CMJA), both in terms of jump height and takeoff velocity (p > 0.05, ω2 ≤ 0.01).
It is important to clarify that the expression of physical variables does not manifest itself in the same way in all age categories, in the study carried out by Ramos et al. [47] 231 players from the Brazilian national team were evaluated, 46 Under-15 players (14.7 ± 0.5 years, 161.8 ± 7.4 cm, 57.3 ± 7.4 kg), 49 Under-17 players (16.5 ± 0.5 years, 164.9 ± 7.8 cm, 59.2 ± 8.7 kg), 98 Under-20 players (18.6 ± 0.6 years, 166.6 ± 7.3 cm, 61.1 ± 7.6 kg) and 38 senior players (26.0 ± 2.9 years, 168.0 ± 5.1 cm, 60.5 ± 6.1 kg), applying a battery of tests that included the evaluation of the vertical jump and linear sprint, showing that in the higher categories, Under-20 (31.6 ± 4.3 cm) and senior (33.0 ± 4.1 cm), there was better performance in the CMJ than in the Under-15 (27.2 ± 3.1 cm) and Under-17 (28.1 ± 3.8 cm) categories. Similarly, in the SJ, the Under-20 category (29.4 ± 4.2 cm) showed better jump performance than the Under-15 (25.8 ± 2.9 cm) and Under-17 (26.1 ± 3.9 cm) players, while the senior category (32.1 ± 3.9 cm) showed higher performance compared to all other categories.
With the HS reports, an increase is observed from the U-13 to U-19 categories, but with a decrease in the senior category (p = 0.048), reflected in the hamstring-to-quadriceps strength (H:Q) ratio, with values ranging from 18% to 26% lower in the senior category compared to the others (p < 0.026) [48]. In the present study, significant differences were observed between the groups regarding hamstring strength. The HS torque variable showed a significant difference (p = 0.042; ω2 = 0.07), and post hoc tests indicated a specific difference between the U-13 and U-15 groups. Likewise, the hamstring angle variable showed a statistically significant change (p = 0.016; ω2 = 0.1), with the U-17 players exhibiting significant differences when compared to the U-13 and U-15 players. These results should be interpreted with caution due to differences in the variables analyzed, since the H:Q ratio was not examined in this study. Likewise, these differences indicate an association between the two studies, where strength increases with the age of the players. However, since senior categories were not included, a decrease in strength at older ages was not evident in our study.
The results of our investigation on the COD align with reported evidence highlighting this ability in youth soccer performance. Krolo et al. [49] evaluated the validity and reliability of this variable, reporting an improvement with age and showing significant differences between the U-13 and U-15 categories, with the older category demonstrating superiority. Similarly, when analyzing the three categories in the present study (U-13, U-15, U-17) in variables related to COD, it was observed that ability does not progress linearly and that its development may be influenced by other factors such as training stimuli or the player’s maturational development. In the study by Loturco et al. [46], the lowest values for COD-related variables were reported in the youngest age categories, increasing progressively in the U-17, U-20, and senior categories, with levels of significance ranging from probably significant (p < 0.01 **) to highly significant (p < 0.001 ***). Although our population is only considered up to U-17, the results show similar trends between the COD relationship and the effect of the players’ age.
Another study with 54 Spanish players, 18 under-18 players (16.9 ± 0.5 years, 161.8 ± 9.2 cm, 57.7 ± 9.3 kg), 21 under-16 players (14.9 ± 0.5 years, 159.8 ± 5.3 cm; 53.6 ± 8.1 kg) and 15 under-14 players (13.7 ± 0.6 years, 154.1 ± 7.9 cm, 48.9 ± 7.9 kg), 5-0-5 change in direction (COD) tests were performed, and in the results, the under-16 category was significantly faster than the under-14 in 40 m and left COD [50]. In this study, significant differences were identified in the total COD time (p < 0.001, ω2 = 0.26) and in the average COD speed (p < 0.001, ω2 = 0.24), with U-13 players being significantly slower than U-15 and U-17 players, and contact time (ms) during the COD test showed differences between U-13 and U-15 players (p = 0.012, ω2 = 0.1). Finally, the COD deficit did not show significant variations among the categories analyzed (p = 0.794). These results highlight the differences among various population samples, making it difficult to generalize the findings due to the heterogeneity of the tests and variables analyzed. This underscores the need for further studies that analyze CODs in different age groups within women’s youth soccer.
On the other hand, other more recent research proposals correlate lower limb strength asymmetry, measured with an isokinetic dynamometer, and physical performance, measured through the RAST, in 22 professional female soccer players (22.04 ± 4.37 years; 62.24 ± 5.68 kg; 1.66 ± 0.05 cm; 22.64 ± 2.47 kg/m2 BMI). A 20 m sprint and anthropometric variables were also evaluated. The key finding of the present study was the lack of a significant correlation between lower limb strength asymmetry and 20 m sprint performance, RAST, and COD capacity in professional female soccer players [51]. This corroborates some previous research that also did not show a correlation between lower limb strength asymmetry and sprint [52,53] and COD capacity [54] in female soccer players.
Another related investigation sought to examine the relationship between performance variables obtained through the RAST and WAnT (Wingate Anaerobic Test) tests in under-12 female soccer players (11.6 ± 0.64 years, 152.7 ± 9.3 cm, 45.0 ± 8.5 kg, 19.1 ± 1.8 BMI). Furthermore, it aimed to evaluate the effectiveness of the RAST as a tool for measuring anaerobic performance in young players, verifying its efficacy in monitoring changes in anaerobic capacity levels in trained and untrained players. However, the sample size was small, which is a limitation as it reduces the generalizability of the results, highlighting the need for further studies with larger samples, especially in female players, as results in this area are still very scarce [55].
Furthermore, body composition analysis is one of the topics on which the most scientific studies have been published in the field of youth soccer. One of the main areas of interest is the study of morphological development as athletes mature, including relative age [56], or the differences that exist between different age groups [25,57] and in response to playing position in youth female players, particularly in variables such as weight (p = 0.03) and fat-free mass (p = 0.01) [58]. Our results demonstrated significant differences between the U-13, U-15, and U-17 categories. Among the variables showing the most statistically significant differences were the percentage of muscle mass (p < 0.001) and muscle mass in kilograms (p = 0.002), both of which showed a progressive increase and significantly higher values in the U-17 players, demonstrating that these variables increase with age, although no differences were observed in other variables such as total body fat percentage, bone mass, and absolute fat mass (p > 0.05).
These results are consistent with the study by Honório et al. [59], who compared the same category but at different time points, showing significant differences (p = 0.001) with moderate effect sizes (d = 0.34), thus agreeing that better values were observed as the players’ age increased. Our results showed differences in body fat percentage, particularly in fat distribution, with players in the U-17 category exhibiting significantly lower body fat percentages according to Faulkner and Carter (p < 0.001) compared to the U-13 and U-15 categories. Regarding this variable, the body fat percentages in the study by Nughes et al. [60] concluded that there is a minimal difference between categories, with values ranging from 6.8% to 8.7% between the U-15 and U-17 categories, with no significant differences among players within the same category (p > 0.19). This contrast shows that there is no association between the results. Our study presents significant values, while the other study maintains stable values in body fat percentages.

4.2. Principal Component Analysis and Determinants of Performance

Moving on to the multivariate analysis, in the study by Becerra Patiño et al. [25], where the objective was to extract PCA according to the playing role between defenders and attackers, it is evident that the three PCAs extracted explained 74.96% for attackers and 96.26% for defenders of the total variance. PCA for attackers reported variables such as strength, power, asymmetry, and, in this case, also change in direction, as a determinant of performance, results that agree with our study. However, in this case, change in direction (COD) was the variable with the greatest absolute contribution. This component is associated with acceleration, body length, and contact time, revealing that in female players, physical fitness is multifactorial and does not depend on a single domain.
To conclude the analysis, PC2 explained 37% of the total variance, showing a predominance of anthropometric characteristics, integrated to a lesser extent by indicators such as initial velocity, time in the 0–5 m split and contact time during the 5 + 5 test. In the study by Castro-Infantes et al. [61], PCA represented 73% of the total variance with two PCs, finding a clustering between psychological indicators, effort, and athlete learning. Becerra Patiño et al. [25] reported 57 variables grouped into three PCs; however, PC2 comprised variables such as strength and power. Overall, the first multivariate analyses in Colombian female players seem to indicate that performance is not linked exclusively to physical variables, but rather to the integration of the player’s morpho-functional structures.

4.3. Limitations and Future Perspectives

This research represents a first step towards identifying physical and anthropometric profiles in response to age category in female players using PCA. The first limitation of the study is related to the sample size and the specific context in which the players were evaluated, which hinders the generalizability of the results. A second limitation is related to the study design, since its cross-sectional nature does not allow for the establishment of causal relationships. A third limitation is related to the lack of consideration of sport-specific factors, that is, the players’ roles and positions. A fourth limitation stems from the failure to account for the influence of the menstrual cycle on the participants, given that this physiological process has a significant impact on women’s physical performance, particularly among young female athletes.
Based on this, considering physical fitness variables and anthropometric factors based on age category (U-13, U-15, U-17) can facilitate the processes of identifying and evaluating the performance of young female players in relation to age and competitive level [62]. This, in turn, opens the door to future research considering performance evaluation based on PCA studies over one or more seasons, monitoring micro cycles and mesocycles, and comparisons between training and competition through longitudinal studies, randomized controlled trials, and experimental studies.
It is necessary to consider that the PCA approach and the sensitivity of small sample sizes may not generalize the findings to other sporting contexts where this type of statistical technique is being replicated. Therefore, more studies are increasingly needed across different ages, contexts, and levels of sport to understand how physical fitness variables and anthropometric factors are related in women’s soccer.

5. Conclusions

Two groups were identified according to category, revealing that principal component analysis 1 and principal component analysis 2 were significant in the performance of anthropometric variables such as residual mass, bi-styloid diameter, arm span, and physical variables, specifically related to COD-Timer 5 + 5, COD-Timer 5-0-5, and speed.
Principal component analysis 1 was characterized by high levels in the variables total time, COD-Timer 5-0-5, COD-Timer deficit 5-0-5, COD-Timer contact time 5-0-5, total distance 15 m, leg length, COD-Timer contact time 5 + 5, arm span, and bi-styloid diameter. Principal component analysis 2 was characterized by high levels in the variables of residual mass, leg length, COD-Timer contact time 5 + 5, arm span, bi-styloid diameter, and split distance 0–5 m.
In women’s soccer, the existing differences related to age category and, consequently, age, highlight the need to develop training programs that answer contextual needs. Based on this, it is determined that there are differentiating variables according to the category, so soccer professionals, technical staff, and researchers should consider these results with caution, seeking to improve short-, medium-, and long-term preparation processes, as well as the identification and development of athletic talent based on physical and anthropometric variables.

Practical Applications

Based on the findings of this study, practical applications can be proposed for the various physical capacities and anthropometric factors of U-13, U-15, and U-17 players based on principal component analysis. These applications can be considered by coaches and physical trainers for the development of youth and children’s soccer. These are the following:
  • Since the representative variables were anthropometric factors associated with residual mass, this should be monitored to understand the players’ health status. Meanwhile, monitoring during the U-13-U-15-U-17 transitions could provide information on the players’ skeletal maturation.
  • The analysis of physical fitness demonstrates that the variables to consider in sports preparation processes could be associated with the development of actions that depend on the direction of movement and speed, especially in 0–5 m segments and over a total time of 15 m. This could help individualize workloads according to the category and playing position to make changes throughout one or more seasons.
  • Understanding the relationships between physical variables and anthropometric factors will allow coaches and physical trainers to design playing systems that align with the capabilities exhibited by the players, based on the characteristics identified during their transitions in the different U-13, U-15, and U-17 categories.

Author Contributions

Introduction: B.A.B.-P., J.D.P.-U., C.F.M.-B. and V.M.-V.; method: B.A.B.-P., J.D.P.-U., C.F.M.-B. and V.M.-V.; formal analysis: B.A.B.-P., J.D.P.-U., C.F.M.-B. and V.M.-V.; investigation: B.A.B.-P., J.D.P.-U., C.F.M.-B., V.M.-V., A.M.Q., M.K., R.Y.-S. and J.F.L.-G.; result: B.A.B.-P., J.D.P.-U., C.F.M.-B. and V.M.-V.; discussion and conclusions: B.A.B.-P., J.D.P.-U., C.F.M.-B., V.M.-V., A.M.Q., M.K., R.Y.-S. and J.F.L.-G.; writing—original draft preparation, B.A.B.-P., J.D.P.-U., A.M.Q., M.K., R.Y.-S. and J.F.L.-G.; writing—review and editing, B.A.B.-P., J.D.P.-U., A.M.Q., M.K., R.Y.-S. and J.F.L.-G.; visualization, B.A.B.-P., J.D.P.-U., A.M.Q., M.K., R.Y.-S. and J.F.L.-G.; supervision: B.A.B.-P. All authors have read and agreed to the published version of the manuscript.

Funding

This research received no external funding.

Institutional Review Board Statement

Technical staff and players were previously informed about the investigation details and signed informed consent. This study was performed based on the ethical guidelines of the Declaration of Helsinki (2025) and approved by the Bioethics Committee of the University (registration number 340ETIC-014-2024, date 2024-04-09).

Informed Consent Statement

Informed consent was obtained from all the subjects involved in this study.

Data Availability Statement

The data is not publicly available due to containing information that could compromise the privacy of research participants.

Acknowledgments

The authors would like to thank the study participants, as well as the team staff, for their availability and commitment to this study.

Conflicts of Interest

The authors declare no conflicts of interest.

References

  1. FIFA. Women’s Football Strategy; FIFA: Zurich, Switzerland, 2018. [Google Scholar]
  2. Griffin, J.; Horan, S.; Keogh, J.; Dodd, K.; Andreatta, M.; Minahan, C. Contextual factors influencing the characteristics of female football players. J. Sports Med. Phys. Fit. 2021, 61, 218–232. [Google Scholar] [CrossRef]
  3. Cherappurath, N.; Shamshadali, P.; Elayaraja, M.; Azeezul Kabeer, D. Mapping the field: A bibliometric analysis of women’s football research trends and future directions. Apunt. Sports Med. 2024, 59, 100448. [Google Scholar] [CrossRef]
  4. Ventaja-Cruz, J.; Cuevas Rincón, J.M.; Tejada-Medina, V.; Martín-Moya, R. A bibliometric study on the evolution of women’s football and determinants behind its growth over the last 30 years. Sports 2024, 12, 333. [Google Scholar] [CrossRef] [PubMed]
  5. Becerra-Patiño, B.; Paucar-Uribe, J.D.; Martínez-Benitez, C.F.; Ávila-Martínez, J.D.; Sarria-Lozano, J.C. Analysis of physical variables as an indicator of performance in a sample of Colombian women’s soccer players: Influence of being a starter and a non-starter. J. Phys. Educ. Sport 2023, 23, 1481–1487. [Google Scholar] [CrossRef]
  6. Milanović, Z.; Sporiš, G.; James, N.; Trajković, N.; Ignjatović, A.; Sarmento, H.; Trecroci, A.; Mendes, B.M.B. Physiological Demands, Morphological Characteristics, Physical Abilities and Injuries of Female Soccer Players. J. Hum. Kinet. 2017, 60, 77–83. [Google Scholar] [CrossRef]
  7. Emmonds, S.; Scantlebury, S.; Murray, E.; Turner, L.; Robsinon, C.; Jones, B. Physical Characteristics of Elite Youth Female Soccer Players Characterized by Maturity Status. J. Strength Cond. Res. 2020, 34, 2321–2328. [Google Scholar] [CrossRef]
  8. González-Fernández, F.T.; Castillo-Rodríguez, A.; Rodríguez-García, L.; Clemente, F.M.; Silva, A.F. A Data Analytics Approach to Assess the Functional and Physical Performance of Female Soccer Players: A Cohort Design. Int. J. Environ. Res. Public Health 2022, 19, 8941. [Google Scholar] [CrossRef]
  9. Montenegro Bonilla, A.D.; Rodríguez Pachón, S.D.; Hernández-Beltrán, V.; Gamonales, J.M.; Rico-González, M.; Pino-Ortega, J.; Olivares-Arancibia, J.; Yánez-Sepúlveda, R.; López-Gil, J.F.; Becerra Patiño, B.A. Comparative Analysis of the Physical, Tactical, Emotional, and Mood Characteristics of Under-13 Soccer Players by Performance Level. J. Funct. Morphol. Kinesiol. 2024, 9, 237. [Google Scholar] [CrossRef]
  10. Gonçalves, L.; Clemente, F.M.; Barrera, J.I.; Sarmento, H.; González-Fernández, F.T.; Rico-González, M.; Carral, J.M.C. Exploring the determinants of repeated-sprint ability in adult women soccer players. Int. J. Environ. Res. Public Health 2021, 18, 4595. [Google Scholar] [CrossRef]
  11. Suits, W.H.; Darmofal, M.A.; Bean, R.A. Normative data on horizontal power, acceleration, and change-of-direction ability in amateur youth female soccer players. J. Sports Med. Phys. Fit. 2024, 64, 222–228. [Google Scholar] [CrossRef]
  12. Armada-Cortés, E.; Benítez-Muñoz, J.A.; San Juan, A.F.; Sánchez-Sánchez, J. Evaluation of neuromuscular fatigue in a repeat sprint ability, countermovement jump and hamstring test in elite female soccer players. Int. J. Environ. Res. Public Health 2022, 19, 15069. [Google Scholar] [CrossRef] [PubMed]
  13. Oliveira, R.; Brito, J.P.; Fernandes, R.; Morgans, R.; Alves, S.; Santos, F.J.; Pinto, P.; Espada, M.C. The effects of pre-season and relationships with physical, physiological, body composition, and load markers: A case study comparing starters versus non-starters from an elite female professional soccer team. Medicina 2023, 59, 2156. [Google Scholar] [CrossRef] [PubMed]
  14. Svynos, G.; Michailidis, Y.; Kotsakis, P.; Mandroukas, A.; Metaxas, I.; Gissis, I.; Metaxas, T.I. Effects of vertical and horizontal jumping asymmetries on linear and change-of-direction speed performance of female soccer players. Appl. Sci. 2024, 14, 3901. [Google Scholar] [CrossRef]
  15. Roso-Moliner, A.; Gonzalo-Skok, O.; Villavicencio Álvarez, V.E.; Calero-Morales, S.; Mainer-Pardos, E. Analysing the Influence of Speed and Jumping Performance Metrics on the Percentage Change of Direction Deficit in Adolescent Female Soccer Players. Life 2024, 14, 466. [Google Scholar] [CrossRef]
  16. Villaseca-Vicuña, R.; Jesam-Sarquis, F.; Mardones, C.; Moreno, C.; Pérez-Contreras, J. Comparison of physical and anthropometric profiles among Chilean female nation football teams from U17 to senior categories. J. Phys. Educ. Sport 2021, 21, 3218–3226. [Google Scholar] [CrossRef]
  17. Randell, R.K.; Clifford, T.; Drust, B.; Moss, S.L.; Unnithan, V.B.; De Ste Croix, M.B.A.; Datson, N.; Martin, D.; Mayho, H.; Carter, J.M.; et al. Physiological Characteristics of Female Soccer Players and Health and Performance Considerations: A Narrative Review. Sports Med. 2021, 51, 1377–1399. [Google Scholar] [CrossRef]
  18. Toselli, S.; Moro, F.; Perugini, M.; Mauro, M. Age-related variation in the anthropometric profiles, body composition and functional capacities of female soccer players. PeerJ 2025, 13, e20096. [Google Scholar] [CrossRef]
  19. Becerra-Patiño, B.A.; Paucar-Uribe, J.D.; Martínez-Benítez, C.F.; Montilla-Valderrama, V.; Monterrosa-Quintero, A.; Guzmán Sánchez, A. Physical Fitness, Body Composition, Somatotype, and Phantom Strategy (Z-Score) in U13, U15, and U17 Female Soccer Players: A Comparative and Correlational Study. Biomechanics 2025, 5, 85. [Google Scholar] [CrossRef]
  20. Becerra-Patiño, B.A.; Sarria-Lozano, J.C.; Palomino, F.J. Characterization of variables associated with sports performance: Interdisciplinarity in women’s soccer in Colombia. J. Phys. Educ. Sport 2023, 23, 76–95. [Google Scholar] [CrossRef]
  21. Iván-Baragaño, I.; Maneiro, R.; Losada, J.L.; Ardá, A. Multivariate Analysis of the Offensive Phase in High-Performance Women’s Soccer: A Mixed Methods Study. Sustainability 2021, 13, 6379. [Google Scholar] [CrossRef]
  22. Pino-Ortega, J.; Rojas-Valverde, D.; Gómez-Carmona, C.D.; Rico-González, M. Training Design, Performance Analysis, and Talent Identification—A Systematic Review about the Most Relevant Variables through the Principal Component Analysis in Soccer, Basketball, and Rugby. Int. J. Environ. Res. Public Health 2021, 18, 2642. [Google Scholar] [CrossRef] [PubMed]
  23. Bonomi, A.G. Towards valid estimates of activity energy expenditure using an accelerometer: Searching for a proper analytical strategy and big data. J. Appl. Physiol. 2013, 115, 1227–1228. [Google Scholar] [CrossRef] [PubMed][Green Version]
  24. Rojas-Valverde, D.; Gómez-Carmona, C.D.; Gutiérrez-Vargas, R.; Pino-Ortega, J. From big data mining to technical sport reports: The case of inertial measurement units. BMJ Open Sport Exerc. Med. 2019, 5, e000565. [Google Scholar] [CrossRef] [PubMed]
  25. Becerra Patiño, B.A.; Montenegro Bonilla, A.D.; Paucar-Uribe, J.D.; Rada-Perdigón, D.A.; Olivares-Arancibia, J.; Yáñez-Sepúlveda, R.; López-Gil, J.F.; Pino-Ortega, J. Characterization of Fitness Profiles in Youth Soccer Players in Response to Playing Roles Through Principal Component Analysis. J. Funct. Morphol. Kinesiol. 2025, 10, 40. [Google Scholar] [CrossRef]
  26. Casamichana, D.; Castellano, J.; Gómez Díaz, A.; Martín-García, A. Looking for Complementary Intensity Variables in Different Training Games in Football. J. Strength Cond. Res. 2019, 5, 1–8. [Google Scholar] [CrossRef]
  27. Mainer-Pardos, E.; Gonzalo-Skok, O.; Nobari, H.; Roso-Moliner, A. Scientific trends and emerging topics in youth female soccer: A bibliometric perspective. Apunt. Sports Med. 2025, 100503. [Google Scholar] [CrossRef]
  28. Plakias, S. Review Articles on Soccer Performance Analysis: A Bibliometric Analysis of Current Trends and Emerging Themes. Sports 2025, 13, 131. [Google Scholar] [CrossRef]
  29. Kirkendall, D.T.; Krustrup, P. Studying professional and recreational female footballers: A bibliometric exercise. Scand. J. Med. Sci. Sports 2022, 32, 12–26. [Google Scholar] [CrossRef]
  30. Compton, H.R.; Lovell, R.; Scott, D.; Clubb, J.; Shushan, T. Benchmarking the Physical Performance Qualities in Women’s Football: A Systematic Review and Meta-analysis Across the Performance Scale. Sports Med 2025. [Google Scholar] [CrossRef]
  31. Martínez-Mireles, X.; Nava-González, E.J.; López-Cabanillas Lomelí, M.; Puente-Hernández, D.S.; Gutiérrez-López, M.; Lagunes-Carrasco, J.O.; López-García, R.; Ramírez, E. The Shape of Success: A Scoping Review of Somatotype in Modern Elite Athletes Across Various Sports. Sports 2025, 13, 38. [Google Scholar] [CrossRef]
  32. O’Donoghue, P. Research Methods for Sports Performance Analysis; Routledge: London, UK, 2010. [Google Scholar]
  33. Balsalobre-Fernández, F.C.; Glaister, M.; Lockey, R. The Validity and Reliability of an iPhone App for Measuring Vertical Jump Performance. J. Sports Sci. 2015, 33, 1574–1579. [Google Scholar] [CrossRef] [PubMed]
  34. Gençoğlu, C.; Ulupınar, S.; Özbay, S.; Turan, M.; Savaş, B.Ç.; Asan, S.; İnce, İ. Validity and reliability of "My Jump app" to assess vertical jump performance: A meta-analytic review. Sci. Rep. 2023, 13, 20137. [Google Scholar] [CrossRef] [PubMed]
  35. Sconce, E.; Jones, P.; Turner, E.; Comfort, P.; Graham-Smith, P. The validity of the nordic hamstring lower for a field-based assessment of eccentric hamstring strength. J. Sport Rehabil. 2015, 24, 13–20. [Google Scholar] [CrossRef] [PubMed]
  36. Zagatto, A.M.; Beck, W.R.; Gobatto, C.A. Validity of the Running Anaerobic Sprint Test for Assessing Anaerobic Power and Predicting Short-distance Performances. J. Strength Cond. Res. 2009, 23, 1820–1827. [Google Scholar] [CrossRef]
  37. Balsalobre-Fernández, C.; Bishop, C.; Beltrán-Garrido, J.V.; Cecilia-Gallego, P.; Cuenca-Amigó, A.; Romero-Rodríguez, D.; Madruga-Parera, M. The validity and reliability of a novel app for the measurement of change of direction performance. J. Sports Sci. 2019, 37, 2420–2424. [Google Scholar] [CrossRef]
  38. Bishop, C.; Rubio, M.P.-H.; Gullon, I.L.; Maloney, S.; Balsalobre-Fernández, C. Jump and Change of Direction Speed Asymmetry Using Smartphone Apps: Between-Session Consistency and Associations with Physical Performance. J. Strength Cond. Res. 2022, 36, 927–934. [Google Scholar] [CrossRef]
  39. Balsalobre-Fernández, C.; Agopyan, H.; Morin, J.B. The Validity and Reliability of an iPhone App for Measuring Running Mechanics. J. Appl. Biomech. 2017, 33, 222–226. [Google Scholar] [CrossRef]
  40. Heishman, A.D.; Daub, B.D.; Miller, R.M.; Freitas, E.D.S.; Frantz, B.A.; Bemben, M.G. Countermovement Jump Reliability Performed with and without an Arm Swing in NCAA Division 1 Intercollegiate Basketball Players. J. Strength Cond. Res. 2020, 34, 546–558. [Google Scholar] [CrossRef]
  41. Heath, B.H.; Carter, J.E.L. A modified somatotype method. Am. J. Phys. Anthropol. 1967, 27, 57–74. [Google Scholar] [CrossRef]
  42. Petri, C.; Campa, F.; Holway, F.; Pengue, L.; Arrones, L.S. ISAK-Based Anthropometric Standards for Elite Male and Female Soccer Players. Sports 2024, 12, 69. [Google Scholar] [CrossRef]
  43. World Medical Association. World Medical Association Declaration of Helsinki: Ethical principles for medical research involving human participants. JAMA 2025, 333, 71–74. [Google Scholar] [CrossRef] [PubMed]
  44. Hernandez-Martinez, J.; Perez-Carcamo, J.; Canales-Canales, S.; Coñapi-Union, B.; Cid-Calfucura, I.; Herrera-Valenzuela, T.; Branco, B.H.M.; Valdés-Badilla, P. Body Composition and Physical Performance by Playing Position in Amateur Female Soccer Players. Appl. Sci. 2024, 14, 5665. [Google Scholar] [CrossRef]
  45. Chena Sinovas, M.; Pérez-López, A.; Álvarez Valverde, I.; Bores Cerezal, A.; Ramos-Campo, D.J.; Rubio-Arias, J.A.; Valadés Cerrato, D. Influence of body composition on vertical jump performance according with the age and the playing position in football players. Nutr. Hosp. 2015, 32, 299–307. [Google Scholar] [CrossRef] [PubMed]
  46. Loturco, I.; Jeffreys, I.; Abad, C.C.C.; Kobal, R.; Zanetti, V.; Pereira, L.A.; Nimphius, S. Change-of-direction, speed and jump performance in soccer players: A comparison across different age-categories. J. Sports Sci. 2020, 38, 1279–1285. [Google Scholar] [CrossRef]
  47. Ramos, G.P.; Nakamura, F.Y.; Penna, E.M.; Mendes, T.T.; Mahseredjian, F.; Lima, A.M.; Garcia, E.S.; Prado, L.S.; Coimbra, C.C. Comparison of Physical Fitness and Anthropometrical Profiles Among Brazilian Female Soccer National Teams from U15 to Senior Categories. J. Strength Cond. Res. 2021, 35, 2302–2308. [Google Scholar] [CrossRef]
  48. Ishøi, L.; Krommes, K.; Nielsen, M.F.; Thornton, K.B.; Hölmich, P.; Aagaard, P.; Penalver, J.J.J.; Thorborg, K. Hamstring and Quadriceps Muscle Strength in Youth to Senior Elite Soccer: A Cross-Sectional Study Including 125 Players. Int. J. Sports Physiol. Perform. 2021, 16, 1538–1544. [Google Scholar] [CrossRef]
  49. Krolo, A.; Gilic, B.; Foretic, N.; Pojskic, H.; Hammami, R.; Spasic, M.; Uljevic, O.; Versic, S.; Sekulic, D. Agility Testing in Youth Football (Soccer)Players; Evaluating Reliability, Validity, and Correlates of Newly Developed Testing Protocols. Int. J. Environ. Res. Public Health 2020, 17, 294. [Google Scholar] [CrossRef]
  50. Pardos-Mainer, E.; Bishop, C.; Gonzalo-Skok, O.; Nobari, H.; Pérez-Gómez, J.; Lozano, D. Associations between Inter-Limb Asymmetries in Jump and Change of Direction Speed Tests and Physical Performance in Adolescent Female Soccer Players. Int. J. Environ. Res. Public Health 2021, 18, 3474. [Google Scholar] [CrossRef]
  51. De Freitas, F.H.; Corrêa Neto, V.G.; Paz, G.; dos Santos, D.T.; Dantas, E.H.M.; Gonçalves, M.; Willardson, J. Correlation between lower limb asymmetry and performance in professional female soccer players. Motricidade 2024, 20, 252–258. [Google Scholar] [CrossRef]
  52. Bishop, C.; Read, P.; McCubbine, J.; Turner, A. Vertical and horizontal asymmetries are related to slower sprinting and jump performance in elite youth female soccer players. J. Strength Cond. Res. 2021, 35, 56–63. [Google Scholar] [CrossRef]
  53. Loturco, I.; Pereira, L.A.; Kobal, R.; Abad, C.C.C.; Rosseti, M.; Carpes, F.P.; Bishop, C. Do asymmetry scores influence speed and power performance in elite female soccer players? Biol. Sport 2019, 36, 209–216. [Google Scholar] [CrossRef] [PubMed]
  54. Bishop, C.; Read, P.; Bromley, T.; Brazier, J.; Jarvis, P.; Chavda, S.; Turner, A. The association between interlimb asymmetry and athletic performance tasks: A season-long study in elite academy soccer players. J. Strength Cond. Res. 2022, 36, 787–795. [Google Scholar] [CrossRef] [PubMed]
  55. Jastrzębska, A.D. Comparison of usefulness of two tests measuring anaerobic performance of untrained and soccer-training girls U12. Sci. Rep. 2023, 13, 19498. [Google Scholar] [CrossRef] [PubMed]
  56. Rađa, A.; Marasović, J.; Erceg, M.; Krustrup, P.; Randers, M.B.; Ardigò, L.P. Relative age effect, morphological status and physical performance of U-15 Croatian football players. PLoS ONE 2025, 20, e0327878. [Google Scholar] [CrossRef]
  57. Clemente, F.M.; Ramirez-Campillo, R.; Sarmento, H. Detrimental Effects of the Off-Season in Soccer Players: A Systematic Review and Meta-analysis. Sports Med. 2021, 51, 795–814. [Google Scholar] [CrossRef]
  58. Becerra Patiño, B.A.; Sarria Lozano, J.C.; Prada Clavijo, J.F. Morphofunctional characteristics by position in U-15 female soccer players from Bogota. Retos 2022, 45, 381–389. [Google Scholar] [CrossRef]
  59. Honório, S.; Batista, M.; Serrano, J.; Petrica, J.; Rebelo, M.; Vieira, F.; Lopes, A.; Santos, J. Analysis of anthropometric and physical performance variables in U-17 soccer players. Front. Sports Act. Living 2023, 5, 1284411. [Google Scholar] [CrossRef]
  60. Nughes, E.; Rago, V.; Aquino, R.; Ermidis, G.; Randers, M.B.; Ardigò, L.P. Anthropometric and Functional Profile of Selected vs. Non-Selected 13-to-17-Year-Old Soccer Players. Sports 2020, 8, 111. [Google Scholar] [CrossRef]
  61. Castro-Infantes, S.; Soto Hermoso, V.M.; Martín-Moya, R.; Manuel Clemente, F.; Sarmento, H.; Castillo-Rodríguez, A.; González-Fernández, F.T. Principal Component Approach and Relationship between Nomination Scale for Identification of Football Talent and Physical Fitness in Young Soccer Players. Appl. Sci. 2024, 14, 7569. [Google Scholar] [CrossRef]
  62. Lukaski, H.; Raymond-Pope, C.J. New Frontiers of Body Composition in Sport. Int. J. Sports Med. 2021, 42, 588–601. [Google Scholar] [CrossRef]
Figure 1. Correlation matrix of the variables.
Physiologia 06 00030 g001
Figure 2. Number of variances explained in response to categories.
Physiologia 06 00030 g002
Figure 3. Principal component analysis is based on physical fitness and anthropometric variables, and the variance explained in response to the categories. (a) presents the principal component analysis with respect to physical fitness and anthropometric variables, as well as the explained variance across the different categories and the distribution of players according to the two principal components. (b) shows the main variables defined by the principal components across the different categories.
Physiologia 06 00030 g003aPhysiologia 06 00030 g003b
Table 1. Key characteristics of the female soccer players evaluated.
VariableU-13 (n:23)U-15 (n:27)U-17 (n:18)
Age (years)13.21 ± 0.7115.05 ± 0.7417.19 ± 0.54
Body Mass (kg)50.75 ± 8.4254.59 ± 6.0154.87 ± 5.80
Height (cm)158.3 ± 5.83160.69 ± 5.34161.99 ± 5.40
BMI (kg/m2)20.16 ± 3.2221.15 ± 1.8620.87 ± 1.65
Sitting Height (cm)80.00 ± 3.4077.94 ± 4.0386.23 ± 3.12
Arm Span (cm)156.89 ± 10.61160.38 ± 6.29162.89 ± 6.89
Lever (cm)118.70 ± 4.35120.74 ± 3.86120.87 ± 3.66
Squat 90° (cm)59.79 ± 4.5170.83 ± 27.6364.16 ± 4.40
Leg Length (cm)99.57 ± 5.79100.74 ± 6.02102.37 ± 5.42
Fat Mass (%)25.68 ± 6.8429.74 ± 4.0128.64 ± 3.85
Muscle Mass (%)39.74 ± 4.7438.65 ± 3.5143.26 ± 4.12
Cormic Index (%)50.53 ± 1.6048.54 ± 2.7453.24 ± 1.30
Waist/hip Ratio0.73 ± 0.100.73 ± 0.030.75 ± 0.02
Note: kg: kilograms; cm: centimeters; BMI: body mass index; %: percentage.
Table 2. Descriptive and inferential analysis of the differences related to jump and hamstring strength variables according to category.
VariableU-13 (n = 23)U-15 (n = 27)U-17 (n = 18)p-Valueω2
SJVelocity (m/s)1.1 ± 0.11.1 ± 0.11.1 ± 0.10.568−0.01
Jump height (cm)25.1 ± 4.025.5 ± 2.826.3 ± 3.70.536−0.01
CMJVelocity (m/s)1.1 ± 0.11.2 ± 0.11.2 ± 0.10.626−0.02
Jump height (cm)26.2 ± 4.227.1 ± 3.527.2 ± 4.00.649−0.02
CMJAVelocity (m/s)1.2 ± 0.11.2 ± 0.11.3 ± 0.10.626−0.02
Jump height (cm)29.7 ± 3.931.1 ± 3.631.7 ± 4.30.2360.01
HSTorque (Nm)268.5 ± 40.6 M307.9 ± 54.9 M288.1 ± 52.60.0420.07
Angle (°)134.2 ± 6.6 K133.8 ± 8.1 L127.2 ± 9.5 KL0.0160.1
Note: Different superscript letters denote significant pairwise differences between groups (p < 0.05). Nm: Newton-meter; cm: centimeters; m/s: meters per second; SJ: squat jump; CMJ: countermovement jump; CMJA: countermovement jump with arms; HS: hamstring strength.
Table 3. Descriptive and inferential analysis of the differences related to the COD-Timer and speed variables according to category.
VariableU-13 (n = 23)U-15 (n = 27)U-17 (n = 18)p-Valueω2
COD deficit1.35 ± 0.621.35 ± 0.391.26 ± 0.200.794−0.02
COD Total time (s)3.32 ± 0.28 JK3.10 ± 0.19 J3.01 ± 0.13 K<0.0010.26
COD Average speed (km/h)10.91 ± 0.90 LM11.65 ± 0.72 L11.97 ± 0.52 M<0.0010.24
COD Contact time (ms)516.21 ± 128.05 N640.78 ± 106.85 N579.40 ± 181.350.0120.1
Sprint Total time (s)3.18 ± 0.583.04 ± 0.262.99 ± 0.170.477−0.01
Sprint Contact time (ms)741.29 ± 366.96711.74 ± 132.10643.40 ± 210.390.1870.02
Sprint Average speed (km/h)7.40 ± 0.767.64 ± 0.387.67 ± 0.330.2570.01
Split 1–5 m (s)1.66 ± 0.181.68 ± 0.161.67 ± 0.080.931−0.03
Split 2–10 m (s)0.89 ± 0.06 X0.85 ± 0.050.87 ± 0.03 X0.0320.07
Split 3–15 m (s)0.83 ± 0.06 Z0.79 ± 0.050.75 ± 0.08 Z0.0020.21
Note: Different superscript letters denote significant pairwise differences between groups (p < 0.05); COD: change in direction; s: seconds; km/h: kilometers per hour; ms: milliseconds.
Table 4. Descriptive and inferential analysis of the differences related to the running anaerobic sprint test variables according to category.
VariableU-13 (n = 23)U-15 (n = 27)U-17 (n = 18)p-Valueη2
Time 1 (s)6.5 ± 0.35.4 ± 0.45.7 ± 0.40.0010.679
Power 1 (W)217.0 ± 39.3442.2 ± 96.9374.3 ± 81.20.0010.615
Time 2 (s)6.7 ± 0.45.6 ± 0.36.3 ± 0.70.0010.574
Power 2 (W)200.2 ± 42.8396.6 ± 68.5294.0 ± 95.80.0010.594
Time 3 (s)7.0 ± 0.45.7 ± 0.36.1 ± 0.50.0010.701
Power 3 (W)174.1 ± 26.5364.2 ± 51.8312.0 ± 101.50.0010.641
Time 4 (s)7.3 ± 0.45.9 ± 0.46.3 ± 0.50.0010.672
Power 4 (W)155.5 ± 26.4323.2 ± 59.3282.5 ± 112.10.0010.533
Time 5 (s)7.3 ± 0.45.9 ± 0.36.7 ± 0.50.0010.695
Power 5 (W)155.8 ± 25.2327.8 ± 43.9231.3 ± 61.30.0010.744
Time 6 (s)7.5 ± 0.46.0 ± 0.46.5 ± 0.60.0010.685
Power 6 (W)145.5 ± 26.9307.3 ± 52.5257.0 ± 76.20.0010.639
Maximum power (W)223.0 ± 42.2459.3 ± 86.8390.5 ± 99.90.0010.63
Minimum power (W)138.4 ± 23.0287.8 ± 42.4217.6 ± 60.00.0010.691
Average power (W)174.7 ± 26.7360.2 ± 48.4281.2 ± 81.90.0010.684
Fatigue index2.0 ± 0.8 &5.0 ± 1.9 &5.0 ± 2.40.0010.389
Note: All variables showed significant inter-group differences, except for the fatigue index, which only differed between U-13 vs. U-15; W: watts; s: seconds.
Table 5. Descriptive and inferential analysis of the differences related to anthropometric variables according to category.
VariableU-13 (n = 23)U-15 (n = 27)U-17 (n = 18)p-Valueω2
Fat percentage (%)25.68 ± 6.8429.74 ± 4.0128.64 ± 3.960.0570.023
Muscle mass %39.74 ± 4.74 C38.65 ± 3.51 B43.26 ± 4.24 BC0.0020.15
Muscle mass (kg)19.97 ± 1.83 E20.96 ± 1.86 F23.73 ± 1.72 EF<0.0010.39
Bone mass %16.56 ± 1.9515.46 ± 1.2315.82 ± 1.100.080.07
Bone mass (kg)8.27 ± 1.018.41 ± 0.798.64 ± 0.710.363−0.00
Residual mass %9.08 ± 3.5211.94 ± 5.21 G8.60 ± 3.32 G0.0330.09
Residual mass (kg)5.05 ± 2.306.62 ± 3.046.57 ± 3.160.080.04
Adipose mass %34.83 ± 6.2244.39 ± 54.0334.63 ± 6.280.657−0.01
Adipose mass (kg)18.09 ± 7.1218.60 ± 3.9119.04 ± 4.040.856−0.02
Faulkner fat mass %20.49 ± 6.54 J20.61 ± 3.83 H15.16 ± 2.83 HJ<0.0010.18
Faulkner fat mass (kg)10.96 ± 6.8711.35 ± 3.018.40 ± 2.140.0910.04
Carter fat mass %17.49 ± 6.31 L17.51 ± 3.61 K11.62 ± 3.36 KL<0.0010.22
Note: Different superscript letters denote significant pairwise differences between groups (p < 0.05); %: percentage; kg: kilograms.
Table 6. Principal component analysis with respective variances and percentage of variance explained.
VariablePC1PC2
Waist/hip ratio0.01830947−0.03614273
Cormic index−0.16737100−0.16376338
Angle (°)−0.03101572−0.06125952
Total 15 m (s)0.251901010.08144984
Contact Time 5-0-5 (ms)0.40154975−0.19937303
Leg length (cm)0.205633380.42331643
Total time COD-Timer 5-0-5 (s)0.45788518−0.23784661
Contact time 5 + 5 (ms)0.218355230.21874129
Residual mass %0.023125550.39892004
Muscle mass %−0.01414816−0.11115199
Bi-styloid diameter (mm)0.111447400.21223402
Split 0–5 m (s)0.202041900.13830400
COD deficit (ms)0.41952789−0.22399329
Residual mass (kg)0.067921160.49051635
Arm span (cm)0.231737310.29080781
Importance of componentsPCA1PCA2
Standard deviation3.1752.433
Proportion of Variance0.6300.370
Cumulative Proportion0.6301.000
Note: s: seconds; kg: kilograms; cm: centimeters; ms: milliseconds; %: percentage; mm: millimeters.
Disclaimer/Publisher’s Note: The statements, opinions and data contained in all publications are solely those of the individual author(s) and contributor(s) and not of MDPI and/or the editor(s). MDPI and/or the editor(s) disclaim responsibility for any injury to people or property resulting from any ideas, methods, instructions or products referred to in the content.