Article

Anthropometric Characteristics Associated with 2000 m Rowing Ergometer Performance in Adolescent Athletes


1
Sport and Health Sciences Research Group, Eszterházy Károly Catholic University, 3300 Eger, Hungary
2
Department of Health Promotion and Exercise Science, Széchenyi István University, 9026 Győr, Hungary
*
Author to whom correspondence should be addressed.
Physiologia 2026, 6(1), 15; https://doi.org/10.3390/physiologia6010015

Submission received: 23 December 2025 / Revised: 25 January 2026 / Accepted: 3 February 2026 / Published: 10 February 2026
(This article belongs to the Section Exercise Physiology)

Abstract

Background: Anthropometric characteristics are known determinants of rowing performance, particularly during adolescence, when rapid physical growth affects strength, leverage, and movement efficiency. Understanding how body size and proportionality relate to rowing output is essential for contextualizing performance differences during youth rowing development. Objective: This study examined the associations between anthropometric variables and 2000 m ergometer performance in a multinational cohort of adolescent rowers, with separate analyses for males and females. Methods: A total of 126 youth rowers (65 males, 61 females) aged 14–16 years from eight countries participated. Standardized anthropometric measurements including body height, body mass, body fat (F%), relative muscle mass (M%), limb lengths, and body surface area (BSA) were assessed. Performance was assessed via maximal 2000 m ergometer testing, recording mean power output (W). Results: Significant anthropometric differences were observed between sexes. Performance outcomes mirrored these patterns: males produced substantially greater ergometer power (327.10 ± 48.65 W) compared to females (219.63 ± 30.96 W, p = 0.015). Across nations, anthropometric and performance means differed numerically but showed no statistically significant between-country differences (p > 0.05), despite small-to-moderate effect sizes. Correlation analyses revealed strong positive associations between ergometer power and body height (males: r = 0.70; females: r = 0.71), body mass (males: r = 0.75; females: r = 0.70), relative muscle mass (males: r = 0.62; females: r = 0.64) and body surface area (males: r = 0.78; females: r = 0.73). Relative fat mass showed a moderate-to-strong negative association with performance (males: r = −0.67; females: r = −0.64; p < 0.01). Conclusions: Anthropometric variables—particularly height, body mass, muscle mass, and body surface area—are strongly associated with rowing ergometer performance in adolescent athletes. These findings underscore the relevance of morphological profiling in youth rowing and provide descriptive insight into anthropometric–performance relationships during early junior rowing.

1. Introduction

Assessing morphological and physiological attributes is a central component of evaluating performance potential in rowing, particularly during youth development where rapid physical changes affect athletic capability [1,2]. Numerous studies across sport science emphasize that body size, proportionality, and metabolic capacity are critical determinants of competitive success—an observation that extends to both rowing and a wide range of other disciplines where talent identification depends on measurable physical indicators [3,4,5,6]. Rowing, however, occupies a distinctive place among endurance sports: athletes generate force primarily from a seated position, reducing the mechanical disadvantages associated with body mass in activities such as running, while enhancing the contribution of leverage-related dimensions such as limb length, arm span, and body surface area (BSA) [7,8,9]. In this context, sweep rowing involves the use of a single oar per athlete, whereas sculling is performed with two oars, one in each hand, reflecting different coordination and mechanical demands. Anthropometric differences between sweep and sculling specialists further illustrate the specificity of morphological demands within the sport [10].
In addition to these biomechanical advantages, rowing performance is underpinned by a unique physiological profile that distinguishes the sport from other endurance disciplines. A standard 2000 m race integrates aerobic, glycolytic, and alactic anaerobic pathways, with an estimated 70–80% of the energy demand supplied aerobically and 20–30% anaerobically [11,12,13,14]. This energy system distribution requires sustained high power output while engaging nearly 70% of the body’s musculature in combined dynamic and static work [11]. Accordingly, rowing places substantial demands on both metabolic and neuromuscular systems during competition [15,16,17,18].
Research consistently shows that successful rowers differ from their less proficient peers in several key anthropometric dimensions. Taller stature, longer upper and lower limbs, higher muscle mass, and lower fat percentage all contribute to mechanical efficiency by improving stroke length and force transfer at the oar [19,20]. Consequently, variables such as height, body weight, limb length, and segmental proportionality have repeatedly been identified as strong predictors of rowing ergometer performance [21,22]. These characteristics may be especially informative among youth athletes, whose ongoing growth and biological maturation can reveal early indicators of long-term performance trajectories [1,23].
While morphology plays a substantial role, rowing performance is also characterized by high and sustained metabolic demands. Standard 2000 m race durations of approximately 5.5–7 min require synchronized contributions from both aerobic and anaerobic energy systems, with the relative balance shifting across race phases [18,24]. At the elite level, these demands are supported by exceptional physiological capacities, including VO2max values frequently exceeding 6.5–7 L/min, supported by enlarged lung volumes, high stroke volumes, and cardiac outputs approaching 40–49 L/min during maximal exertion [25,26,27]. Although these values are characteristic of elite adult athletes, they illustrate the magnitude of physiological demands imposed by the 2000 m rowing task. The extreme cardiorespiratory load is further reflected in acute elevations of systolic blood pressure during forceful strokes, often influenced by Valsalva-like breathing patterns [17]. Such demands highlight the integrated whole-body physiology required for high-level rowing performance.
In junior and adolescent rowers, similar physiological mechanisms are engaged during competition, albeit at lower absolute levels, reflecting ongoing biological maturation and training status. Beyond absolute VO2max, performance is shaped by additional physiological determinants such as stroke efficiency, oxygen economy, ventilatory thresholds, and neuromuscular force–velocity characteristics [11,13,17,28]. These variables may differentiate similarly trained athletes and help explain why technical execution and muscle recruitment strategies significantly influence race outcomes. The mechanisms underlying VO2max itself—left ventricular volume, heart rate, and arteriovenous O2 difference—further highlight the centrality of oxygen transport to rowing physiology [29].
The interplay between anthropometric and physiological variables is therefore multifactorial. While several authors report lean body mass as a principal determinant, others emphasize body dimensions, segmental leverage, and overall proportionality as key contributors to rowing efficiency and performance [30,31]. Among youth athletes, varying rates of biological maturation introduce additional complexity, requiring age- and sex-specific interpretation of body composition and growth-related changes.
Although numerous studies have examined anthropometric determinants of rowing performance, most focus on adult or elite athletes, while evidence on adolescent rowers—particularly within multinational samples—remains limited. Existing youth studies often rely on single-nation cohorts and examine isolated variables, providing an incomplete picture of morphology–performance relationships during early and mid-adolescence. Therefore, the present study addresses this gap by examining associations between multiple anthropometric characteristics and standardized 2000 m ergometer performance in a multinational sample of adolescent rowers, with sex-specific analyses.
In view of these factors, the present study investigates the relationship between anthropometric characteristics and rowing performance in a multinational cohort of youth rowers. We focus specifically on the associations between body size, body composition, limb proportions, body surface area, and ergometer output across four age–sex categories. By identifying morphological patterns linked to performance, this work aims to contribute to the descriptive understanding of anthropometric–performance relationships in youth rowing [4,7].

2. Materials and Methods

A total of 126 young rowers from ten countries participated in this study, including 61 females (mean age: 15.84 ± 0.75 years) and 65 males (mean age: 15.95 ± 0.68 years). The sample included athletes from Slovenia (n = 21), Germany (n = 11), Croatia (n = 19), Hungary (n = 22), Serbia (n = 10), Portugal (n = 18), Austria (n = 9), and the Czech Republic (n = 16).
Only athletes classified as elite within their respective national age groups were eligible for inclusion. Individuals who reported illness or injury within one month prior to testing, and who were therefore unable to participate in regular training, were excluded. Data collection was performed during an international rowing event in Bled (Slovenia) under standardized field-laboratory conditions. All procedures complied with the ethical principles of the Declaration of Helsinki and were approved by the Scientific and Research Ethics Committee of Széchenyi István University (SZE/ETT-46/2025; 30 July 2025). Participation was voluntary; athletes and, where applicable, their legal guardians received written and verbal information prior to providing informed consent. The study was conducted in collaboration with local rowing clubs and the respective national federations. This study was conducted and reported in accordance with the Strengthening the Reporting of Observational Studies in Epidemiology (STROBE) guidelines.
Anthropometric assessments were performed using calibrated Sieber–Hegner instruments, following International Biological Program standards [32]. All measurements were obtained by a trained anthropometrist according to Level 1 protocols of the International Society for the Advancement of Kinanthropometry (ISAK) [33].
Body height (BH) and body weight (BW) were recorded with participants barefoot and wearing light sports clothing.
Sitting height (SH) was measured as the vertical distance from the vertex to the seated surface, with participants maintaining an upright posture and the head positioned in the Frankfurt plane.
Lower limb length (LLL) was derived according to standard ISAK procedures as the difference between standing body height and sitting height. Lower limb length was calculated by subtracting sitting height from standing height, providing a reliable indirect estimate of lower extremity contribution to body proportions.
Arm span (AS) was assessed with the arms fully extended at shoulder height, palms facing forward, and the distance between the tips of the middle fingers recorded. The anthropometer was aligned horizontally at clavicle height.
Derived indices were calculated as follows:
Body mass index (BMI) = BW (kg)/BH2 (m2);
Body surface area (BSA) was estimated using the Mosteller equation:
BSA (m2) = √[(BH in cm × BW in kg)/3600].
Body composition variables—including fat mass, lean mass, and total body water—were evaluated using the InBody 220 (Biospace Co., Seoul, Republic of Korea), based on multi-frequency bioelectrical impedance analysis (BIA). This tetrapolar, eight-point contact device utilizes foot and hand electrodes to measure segmental impedance. The reliability and validity of BIA for estimating body composition have been demonstrated against dual-energy X-ray absorptiometry (DXA) and other reference methods [34,35].
Measurements were performed in accordance with the manufacturer’s standardized protocol and conducted during the morning hours under field-based competitive conditions. Participants were instructed to refrain from eating or drinking for at least 3 h prior to testing, to avoid strenuous physical activity on the day of measurement, and to maintain their usual hydration status. Female participants were measured outside the menstrual phase whenever feasible.

2.1. Performance Testing

Rowing performance was assessed on a Concept2 Model D ergometer using a maximal 2000 m time-trial protocol. Average power output (W) across the trial was recorded as the primary performance indicator. This ergometer model is widely recognized as a gold-standard tool for off-water performance evaluation and is frequently used in both competitive environments and scientific research [36].

2.2. Statistical Analysis

All statistical analyses were performed using Statistica for Windows, Version 13.2 (StatSoft Inc., Tulsa, OK, USA). Prior to hypothesis testing, the distribution of all variables was assessed using the Shapiro–Wilk test, and homogeneity of variances was evaluated with Levene’s test. No extreme outliers were detected. Sex-related differences in anthropometric and performance variables were examined by first applying F-tests for equality of variances. As no violations were detected, two-sample Student’s t-tests were used to compare male and female athletes (p < 0.05). To evaluate between-nationality differences within each sex, one-way ANOVAs were conducted separately for males and females, with nationality entered as a fixed factor. Effect sizes were calculated using partial eta squared (ηp2) to facilitate interpretation of practical relevance independently of statistical significance. Associations between anthropometric variables, body composition, and rowing performance were assessed using Pearson’s product–moment correlation coefficients (p < 0.05). Given the strong intercorrelations among anthropometric variables (e.g., body height, body mass, and body surface area), multivariate modeling was not applied, and the analyses were restricted to bivariate associations.

3. Results

The difference in the mean height (BH; cm), body weight (BW; kg), body fat (F%; %), body muscle (M%; %), arm span (cm), body surface area (BSA; m2), lower limb length (cm) and maximum power (Ergo; W) was significant between the male and female group (p < 0.05); the results and standard deviations of the two groups are shown in Table 1.
Table 2 presents the anthropometric and performance characteristics of male athletes across different nations.
In the male age group, Czech rowers were the tallest (185.8 ± 5.74 cm) and the lowest body fat percentage was observed among Croatian rowers (11.57 ± 1.97%), while relative muscle mass (M%) values were comparable across national subgroups (e.g., 47.49 ± 2.96% for Croatia and 49.65 ± 3.12% for Hungary). Regarding ergometer performance, the Slovenian group achieved the highest mean output (336.5 ± 19.6 W); despite these variations, no statistically significant intergroup differences were found (p > 0.05). Table 3 presents the anthropometric and performance characteristics of female athletes from different nations.
In the female group, Croatian (171.32 ± 4.85 cm) athletes were the tallest, while Slovenian rowers were the shortest (164.47 ± 4.42 cm). The lowest body fat percentage was observed among Croatian competitors (22.73 ± 2.86%), who also demonstrated the highest relative muscle mass (37.55 ± 3.61%). Ergometer performance was greatest in the Croatian group (251.35 ± 16.4 W), followed by Hungarian athletes (237.97 ± 14.8 W), whereas the lowest mean output was recorded for Czech rowers (209.36 ± 15.2 W). Despite these variations, the observed intergroup differences were not statistically significant (p > 0.05).
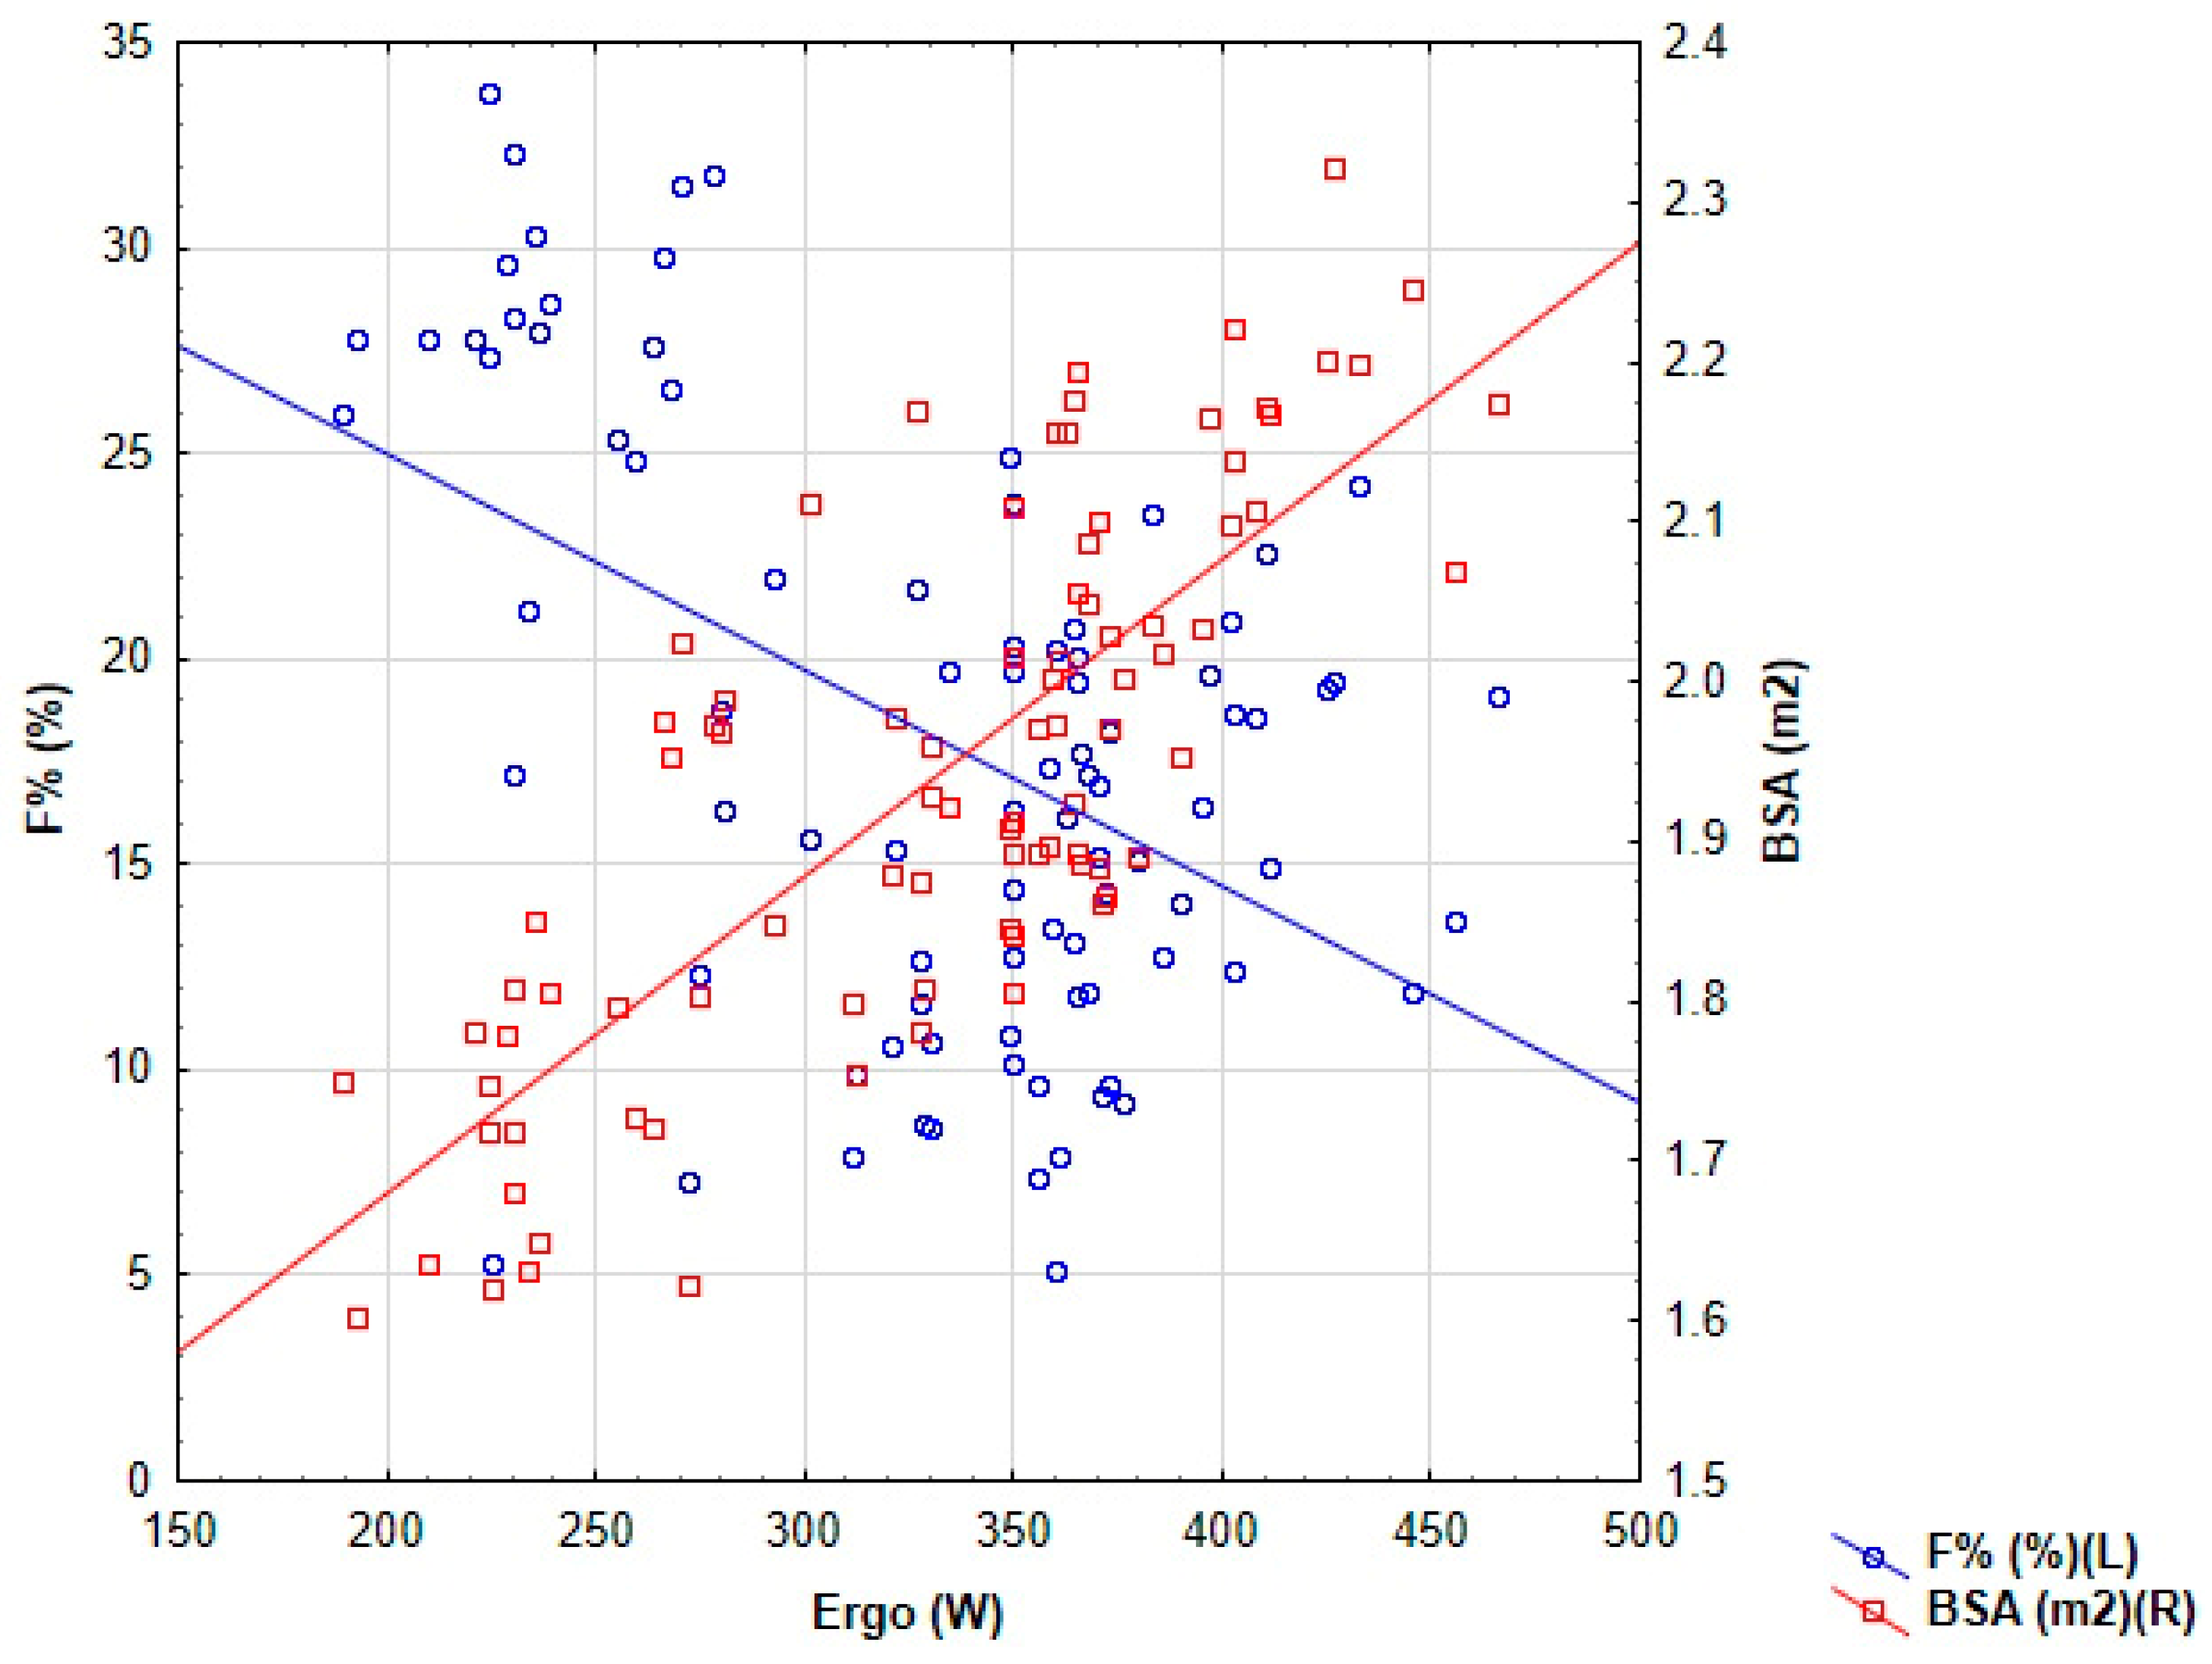
In the male group, the relationship between anthropometric parameters and the performance [maximum power (Ergo; W)] is significant. [Body height (cm; r = 0.7024; p = 0.000); body mass (kg; r = 0.7495; p < 0.001); arm span (cm; r = 0.7517; p < 0.001); lower limb length (cm; r = 0.4263; p = 0.012); sitting height (cm; r = 0.5749; p = 0.006); relative muscle mass (M%; r = 0.6153, p = 0.007) and body surface area (BSA; m2; r = 0.7793; p < 0.001)]. In contrast, a negative correlation was found between relative body fat and performance (F%; r = −0.6682; p = 0.008). The relationship between body surface area (BSA; m2) and the performance [maximum power (Ergo; W)] is the strongest (Figure 1).
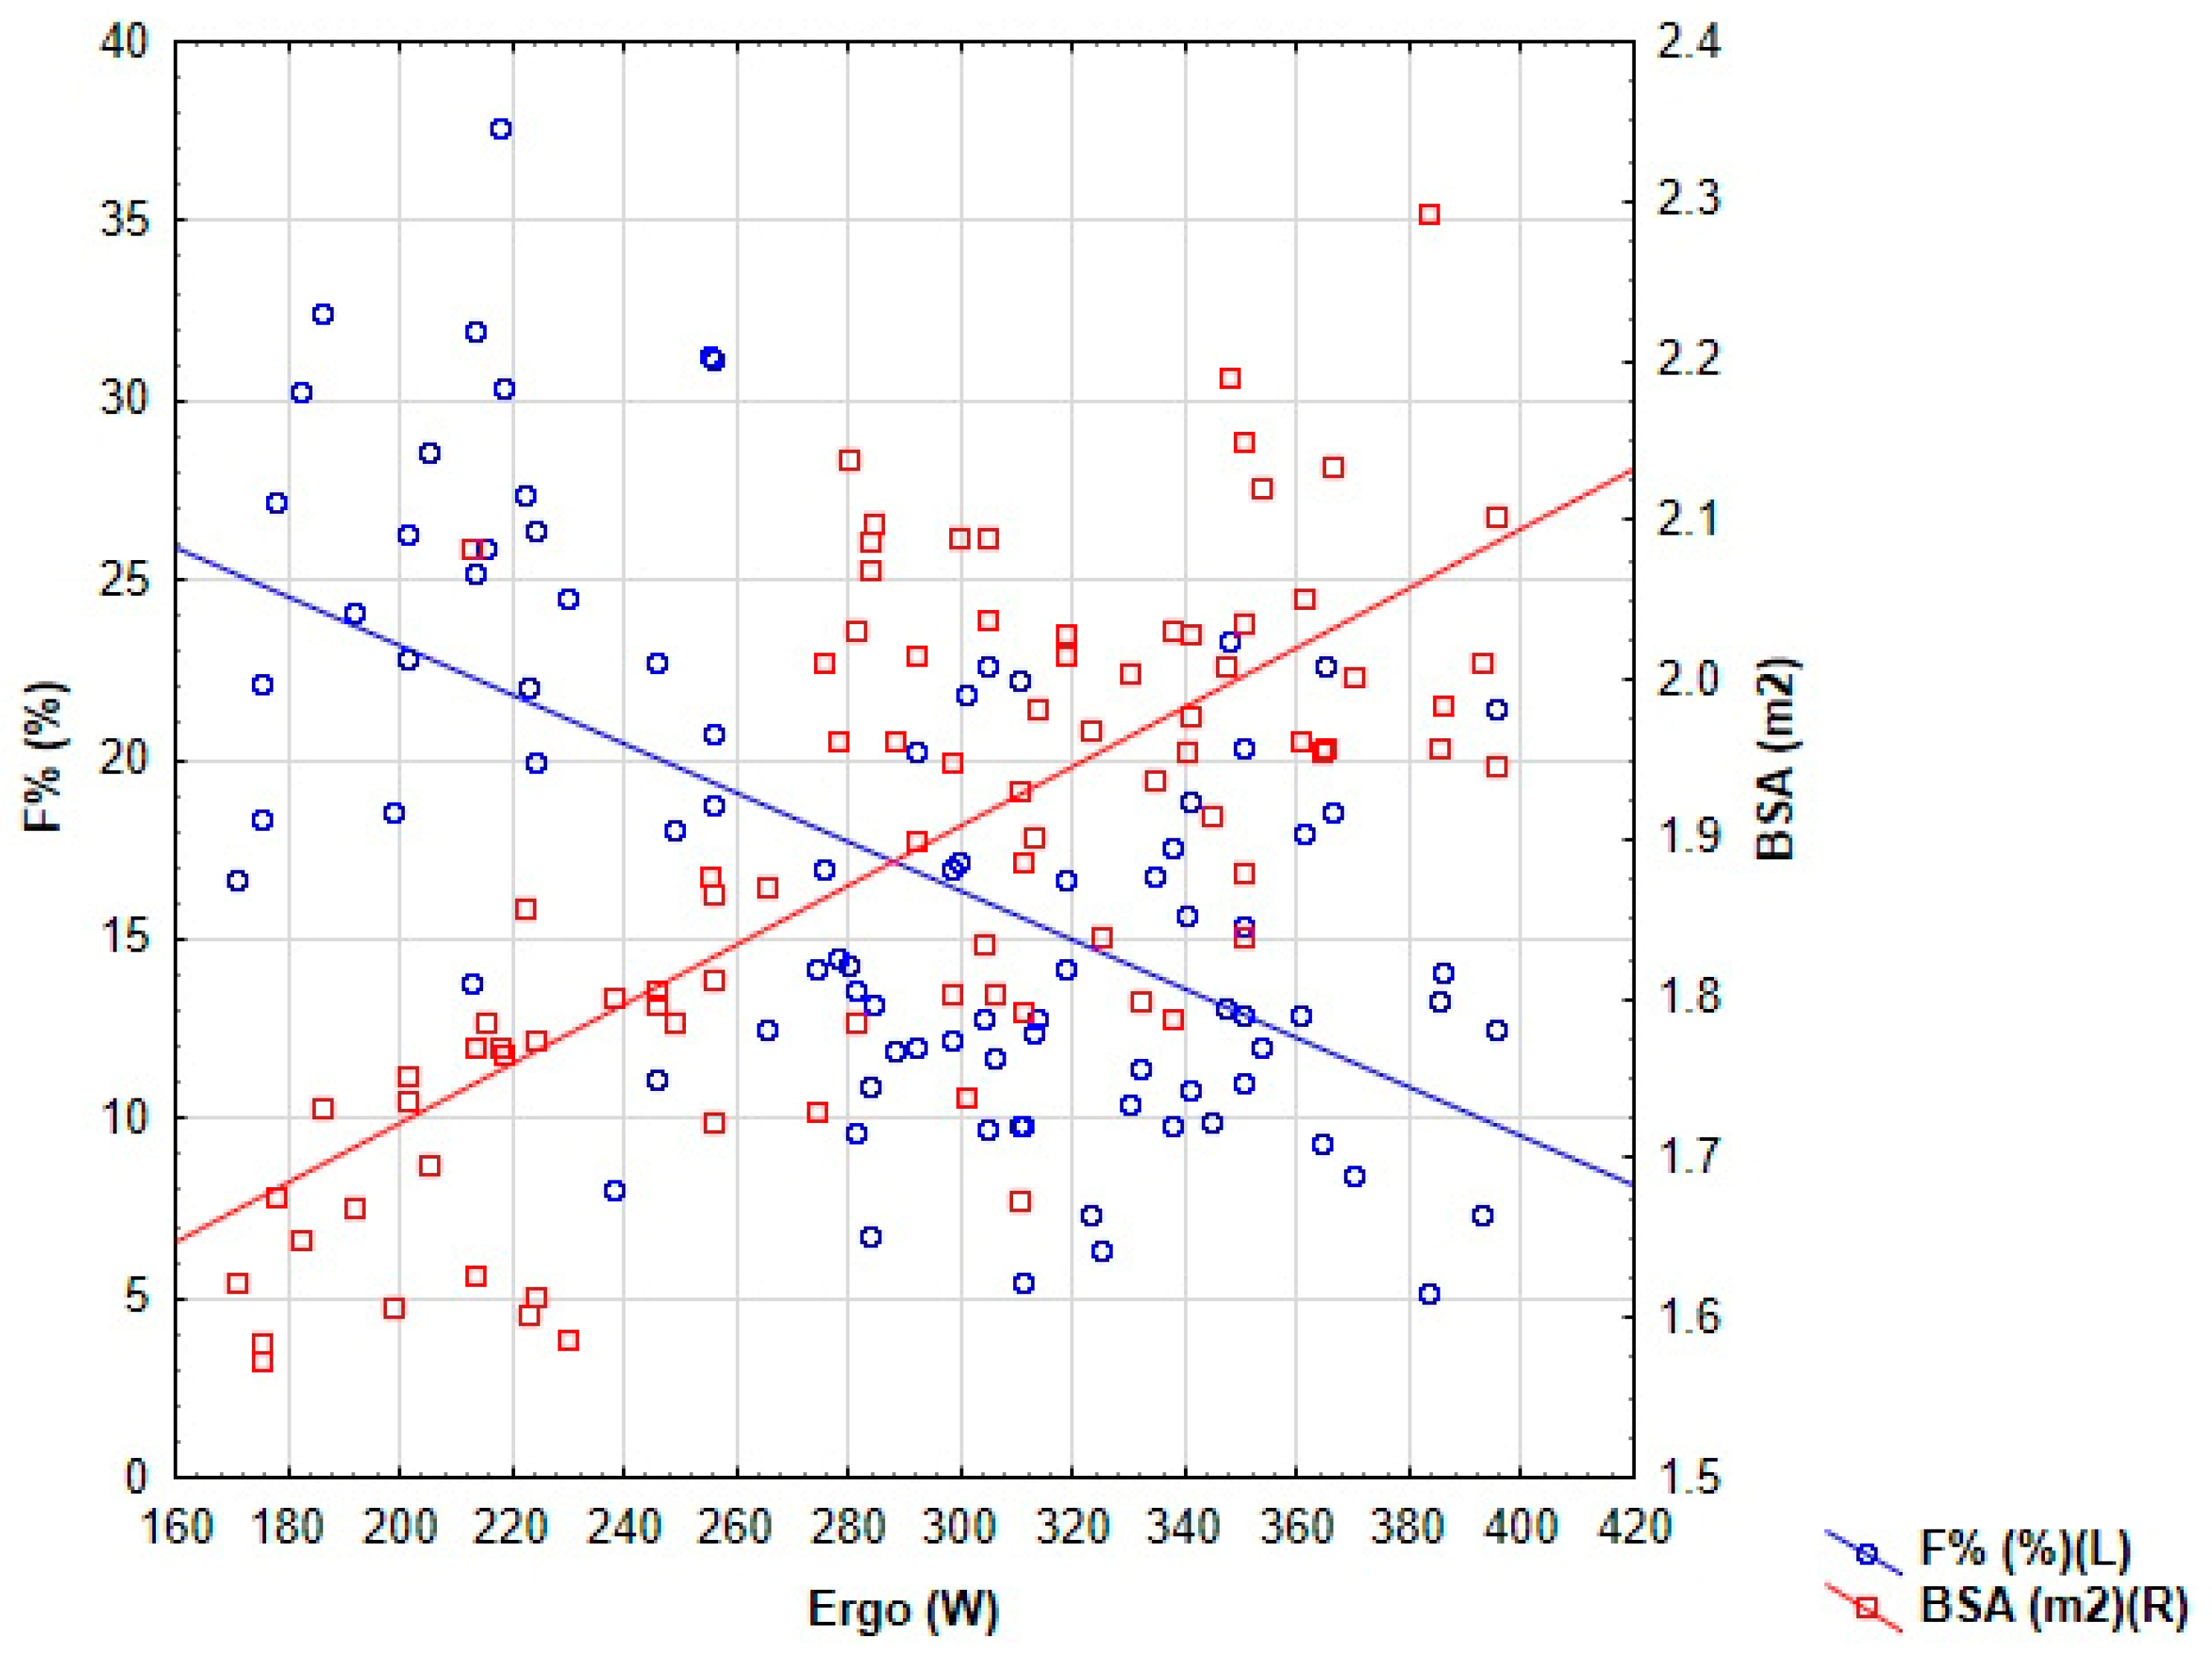
In the female group, the relationship between anthropometric parameters and the performance [maximum power (Ergo; W)] is significant [body height (cm; r = 0.7138; p = 0.003); body mass (kg; r = 0.7038; p = 0.005); arm span (cm; r = 0.6219; p = 0.002); lower limb length (cm; r = 0.5867; p = 0.004); relative muscle mass (M%; r = 0.6573, p = 0.003) and body surface area (BSA; m2; r = 0.7261; p < 0.001)]. In contrast, a negative correlation was found between relative body fat and performance (F%; r = −0.6437; p = 0.008). The relationship between body surface area (BSA; m2) and the performance [maximum power (Ergo; W)] is the strongest (Figure 2).

4. Discussion

The primary aim of this study was to examine how anthropometric characteristics relate to rowing performance in a multinational cohort of adolescent athletes. As expected, clear sex differences appeared across several morphological variables, with male athletes exhibiting greater body height, body mass, muscle mass, arm span, and overall ergometer power output than female athletes. These observations are consistent with earlier reports documenting pronounced divergences in lean mass and physical capacity during mid-puberty [31,37]. Since chronological age did not differ substantially between groups, the observed variation in performance is likely influenced by developmental differences rather than age itself.
When interpreted within a descriptive framework, a central finding of this study is that multiple anthropometric parameters demonstrated strong and consistent correlations with 2000 m ergometer power in both sexes. Performance was most closely associated with body height, body mass, limb lengths, and body surface area—traits that directly influence mechanical leverage, stroke length, and force application. These results are aligned with earlier studies showing that larger rowers tend to exhibit greater propulsive efficiency and performance potential even at young ages [8,9,10]. Likewise, the negative association between relative fat mass and performance reinforces established evidence that lower adiposity supports rowing economy and aerobic efficiency [3].
Although anthropometric means differed numerically between national subgroups, these differences did not reach statistical significance. This is likely attributable to the relatively small sample sizes within each national subgroup and the substantial within-group variability, which reduces statistical power. Notably, η2 values indicated small-to-moderate effect sizes, which should be interpreted cautiously in light of the limited statistical power of these comparisons. This pattern is consistent with previous multinational studies, in which shared training models and developmental pathways reduce systematic country-level divergence [4,7].
Beyond national subgroup comparisons, the strong correlations between performance and multiple anthropometric traits also suggest that adolescent rowers may be characterized by emerging morphological–performance profiles rather than isolated linear predictors. Previous work indicates that combinations of stature, limb length, muscularity, and body surface area can form advantageous phenotypic clusters in youth sport [3,21]. The present findings support this idea, as high-performing athletes tended to display a coherent configuration of favorable traits.
Biological maturation strongly influences body composition, hemoglobin mass, and aerobic capacity during adolescence, highlighting the importance of age- and sex-specific developmental context when interpreting anthropometric data in youth rowing [37,38]. Because athletes of identical chronological age may differ markedly in biological development, anthropometric findings should be interpreted within a maturational framework. Integrating anthropometric profiling into youth development frameworks has been proposed as a means of describing multidimensional morphological characteristics during adolescence, aligning with contemporary long-term athlete development models [36]. Accordingly, the interpretation of the present findings is restricted to early junior contexts and does not extend to senior-level performance outcomes.
Although the present study focused on anthropometric determinants, it is important to acknowledge that rowing performance in adolescents is inherently multifactorial. Technical proficiency, neuromuscular coordination, and pacing strategies substantially influence ergometer outcomes [22,24]. As aerobic and anaerobic metabolic capacities develop progressively through adolescence, morphology may exert proportionally greater influence in this stage, while physiological and technical determinants gain importance with advancing training age.
For practitioners, these findings highlight the value of regularly monitoring anthropometric characteristics—particularly height, limb dimensions, muscle mass, and body surface area—during adolescence [7,8,22]. Such measures can assist in describing and monitoring developmental characteristics of young athletes, provided they are interpreted in relation to maturational status. Coaches should integrate anthropometric data with assessments of technical skill and basic physiological indicators, ensuring that later-maturing athletes are not disadvantaged during developmental evaluation. Emphasis on developing lower-limb and trunk strength, improving stroke mechanics, and supporting optimal body composition may further enhance performance trajectories during this critical developmental period.

Limitations

This study has several limitations that should be acknowledged. Nationality-based comparisons were constrained by small subgroup sample sizes, limiting statistical power and warranting a descriptive interpretation of between-country differences. In addition, biological maturation was not assessed, which is an important consideration in adolescent samples given the wide variability in developmental status; therefore, findings reflect associations based on chronological age. Respiratory muscle strength was not assessed in the present study, despite its established relevance to rowing performance over 2000 m; therefore, a potential mediating role of respiratory muscle capacity in the relationship between anthropometry and ergometer performance cannot be excluded. The reliance on bivariate correlation analyses represents a limitation of this study, as collinearity among anthropometric variables precludes the identification of independent predictors of performance. Accordingly, the reported associations should be interpreted descriptively rather than as evidence of causal or independent effects.
Rowing performance is multifactorial, and variables such as technical skill, training history, and physiological capacity were not directly measured in this study. Finally, body composition was assessed using bioelectrical impedance analysis under standardized but competitive field conditions, and potential influences of hydration and competition-related factors on measurement precision should be considered.

5. Conclusions

This study demonstrates that key anthropometric characteristics—particularly body height, body mass, limb lengths, muscle mass, and body surface area—are strongly associated with 2000 m rowing ergometer performance in adolescent athletes across multiple nations. These findings indicate that higher-performing youth rowers tend to exhibit a coherent morphological profile rather than excelling due to any single physical trait, while greater relative fat mass is consistently associated with lower performance.
Although numerical differences were observed between national subgroups, these did not reach statistical significance, likely due to limited subgroup sample sizes and substantial within-group variability. Overall, the results highlight the relevance of comprehensive anthropometric profiling for describing performance-related characteristics in youth rowing populations.

Author Contributions

Conceptualization, F.I., I.B. and L.S.; methodology, F.I. software, F.I. and L.S.; formal analysis, F.I. and L.S.; investigation, I.B. and L.S. resources, F.I.; data curation, I.B. and Z.A.; writing—original draft preparation, L.S.; writing—review and editing, F.I. and Z.A.; visualization, L.S.; supervision, F.I.; project administration, Z.A.; funding acquisition, Z.A. and I.B. All authors have read and agreed to the published version of the manuscript.

Funding

This research received no external funding.

Institutional Review Board Statement

Data collection was conducted in full compliance with the ethical principles of the Declaration of Helsinki. Participants and their legal guardians were fully informed about the study and gave their written consent to participate. The study was conducted on a voluntary basis in cooperation with the sports clubs and national rowing associations involved. The study was conducted in accordance with the guidelines and regulations of the Scientific and Research Ethics Committee of Széchenyi István University (SZE/ETT-46/2025; 30 July 2025) and the Declaration of Helsinki.

Informed Consent Statement

Informed consent was obtained from all subjects involved in the study.

Data Availability Statement

The data presented in this study are available on request from the corresponding author without undue reservation.

Acknowledgments

The authors thank all participants.

Conflicts of Interest

The authors declare no conflicts of interest.

Abbreviations

The following abbreviations are used in this manuscript:
BMIBody mass index (kg/m2)
BHBody height (cm)
BSABody surface area (m2)
BWBody weight (kg)
M%Relative muscle mass
F%Relative fat mass

References

  1. Volianitis, S.; Secher, N.H. Rowing, the ultimate challenge to the human body—Implications for physiological variables. Clin. Physiol. Funct. Imaging 2009, 29, 241–244. [Google Scholar] [CrossRef]
  2. Komlos, J. Looking Backward and Looking Forward: Anthropometric Research and the Development of Social Science History. Soc. Sci. Hist. 2004, 28, 191–210. [Google Scholar] [CrossRef][Green Version]
  3. Suszter, L.; Barthalos, I.; Fügedi, B.; Ihász, F. Anthropometric and Motor Characteristics of Adolescent Male and Female Rowers, Their Relationship with Performance, and Their Importance in Selection. J. Hum. Sport Exerc. 2023, 18, 871–878. [Google Scholar] [CrossRef]
  4. Ihász, F.; Katona, Z.; Alföldi, Z.; Szabó, A.; Barthalos, I.; Podstawski, R.; Suszter, L.; Finn, K.J.; Kerner, L. Analysis of the laboratory and in-competition characteristics of adolescent motocross (MX) riders: An in situ case study. Appl. Sci. 2024, 14, 8232. [Google Scholar] [CrossRef]
  5. Barthalos, I.; Alföldi, Z.; Soós, I.; Horváth Pápai, A.; Balog, Á.; Suszter, L.; Ihász, F. Analysis of the Physiological Characteristics of Elite Male and Female Junior Rowers during Extreme Exercise. Physiologia 2025, 5, 8. [Google Scholar] [CrossRef]
  6. Suszter, L.; Juhász, I. The Role of Conditional Abilities and Anthropometric Characteristics in the Selection of Youth Handball Players. Hung. J. Sport Sci. 2025, 26, 11–18. [Google Scholar]
  7. Claessens, A.; Bourgois, J.; Van Aken, K.; Van der Auwera, R.; Philippaerts, R.; Thomis, M.; Vrijens, J.; Loos, R.; Lefevere, J. Body proportions of elite male junior rowers in relation to competition level, rowing style and boat type. Kinesiology 2005, 37, 123–132. [Google Scholar]
  8. Bourgois, J. Anthropometric characteristics of elite male junior rowers. Br. J. Sports Med. 2000, 34, 213–216. [Google Scholar] [CrossRef]
  9. Kerr, D.A.; Ross, W.D.; Norton, K.; Hume, P.; Kagawa, M.; Ackland, T.R. Olympic lightweight and open-class rowers possess distinctive physical and proportionality characteristics. J. Sports Sci. 2007, 25, 43–53. [Google Scholar] [CrossRef]
  10. Mikulić, P. Anthropometric and Metabolic Determinants of 6000-m Rowing Ergometer Performance in Internationally Competitive Rowers. J. Strength Cond. Res. 2009, 23, 1851–1857. [Google Scholar] [CrossRef]
  11. Steinacker, J.M. Physiological aspects of training in rowing. Int. J. Sports Med. 1993, 14, S3–S10. [Google Scholar]
  12. De Campos Mello, F.; De Moraes Bertuzzi, R.C.; Grangeiro, P.M.; Franchini, E. Energy systems contributions in 2000 m race simulation: A comparison among rowing ergometers and water. Eur. J. Appl. Physiol. 2009, 107, 615–619. [Google Scholar] [CrossRef]
  13. Martin, S.A.; Tomescu, V. Energy System Efficiency Influences the Results of 2000 m Race Simulation among Elite Rowers. Clujul Med. 2017, 90, 60–65. [Google Scholar]
  14. Smith, T.B.; Hopkins, W.G. Measures of rowing performance. Sports Med. 2012, 42, 343–358. [Google Scholar] [CrossRef]
  15. Riechman, S.E.; Zoeller, R.F.; Balasekaran, G.; Goss, F.L.; Robertson, R.J. Prediction of 2000 m indoor rowing performance using a 30 s sprint and maximal oxygen uptake. J. Sports Sci. 2002, 20, 681–687. [Google Scholar] [CrossRef]
  16. Cerasola, D.; Bellafiore, M.; Cataldo, A.; Zangla, D.; Bianco, A.; Proia, P.; Capranica, L. Predicting the 2000-m rowing ergometer performance from anthropometric, maximal oxygen uptake and 60-s mean power variables in national level young rowers. J. Hum. Kinet. 2020, 75, 77–83. [Google Scholar] [CrossRef]
  17. Cosgrove, M.J.; Wilson, J.; Watt, D.; Grant, S.F. The relationship between selected physiological variables of rowers and rowing performance as determined by a 2000 m ergometer test. J. Sports Sci. 1999, 17, 845–852. [Google Scholar] [CrossRef]
  18. Yoshiga, C.C.; Higuchi, M. Rowing performance of female and male rowers. Scand. J. Med. Sci. Sports 2003, 13, 317–321. [Google Scholar] [CrossRef]
  19. Akça, F. Prediction of Rowing Ergometer Performance from Functional Anaerobic Power, Strength and Anthropometric Components. J. Hum. Kinet. 2014, 41, 133–142. [Google Scholar] [CrossRef]
  20. Izquierdo-Gabarren, M.; De Txabarri Expósito, R.G.; De Villarreal, E.S.; Izquierdo, M. Physiological factors to predict on traditional rowing performance. Eur. J. Appl. Physiol. 2010, 108, 83–92. [Google Scholar] [CrossRef]
  21. Penichet-Tomás, A.; Pueo, B.; Selles-Pérez, S.; Jiménez-Olmedo, J.M. Analysis of Anthropometric and Body Composition Profile in Male and Female Traditional Rowers. Int. J. Environ. Res. Public Health 2021, 18, 7826. [Google Scholar] [CrossRef] [PubMed]
  22. Maestu, J.; Jürimäe, J.; Jürimäe, T. Monitoring of Performance and Training in Rowing. Sports Med. 2005, 35, 597–617. [Google Scholar] [CrossRef]
  23. Jürimäe, J.; Mäestu, J.; Jürimäe, T.; Pihl, E. Prediction of rowing performance on single sculls from metabolic and anthropometric variables. J. Hum. Mov. Stud. 2000, 38, 123–136. [Google Scholar]
  24. Volianitis, S.; Yoshiga, C.C.; Secher, N.H. The physiology of rowing with perspective on training and health. Eur. J. Appl. Physiol. 2020, 120, 1943–1963. [Google Scholar] [CrossRef]
  25. Jensen, K.; Johansen, L.; Secher, N.H. Influence of body temperature on aerobic and anaerobic energy provision during maximal exercise. Eur. J. Appl. Physiol. 2001, 84, 314–319. [Google Scholar] [CrossRef]
  26. Secher, N.H. Physiological and biomechanical aspects of rowing. Sports Med. 1993, 15, 24–42. [Google Scholar] [CrossRef]
  27. Carter, J.E.L.; Ackland, T.R. Kinanthropometry in Aquatic Sports: A Study of World-Class Athletes; Human Kinetics: Champaign, IL, USA, 1994. [Google Scholar]
  28. Kendall, K.L.; Fukuda, D.H.; Smith, A.E.; Cramer, J.T.; Stout, J.R. Critical velocity: A predictor of 2000-m rowing ergometer performance in NCAA Division I female rowers. J. Sports Sci. 2011, 29, 945–950. [Google Scholar] [CrossRef]
  29. Bergh, U.; Ekblom, B.; Åstrand, P.O. Maximal oxygen uptake: ‘Classical’ versus ‘Contemporary’ viewpoints. Med. Sci. Sports Exerc. 2000, 32, 85–88. [Google Scholar] [CrossRef]
  30. Mikulić, P.; Ružić, L. Predicting the 1000 m rowing ergometer performance in 12–13-year-old rowers: The basis for selection process? J. Sci. Med. Sport 2008, 11, 218–226. [Google Scholar] [CrossRef]
  31. Majumdar, P.; Das, D.; Mandal, M.; Pal, H.; Majumdar, S. Body composition, VO2max and performance in rowing. J. Sports Sci. Med. 2017, 16, 164–170. [Google Scholar] [CrossRef]
  32. Weiner, J.S.; Lourie, J.A. Human Biology: A Guide to Field Methods; IBP Handbook No. 9; Blackwell Scientific Publications: Oxford, UK, 1969; pp. 1–36. [Google Scholar]
  33. Marfell-Jones, M.; Stewart, A.; de Ridder, J. International Standards for Anthropometric Assessment; ISAK: Potchefstroom, South Africa, 2012. [Google Scholar]
  34. Cha, K.; Choi, H.; Suh, H. Comparison of android and iOS smartphone applications for BIA-based body composition assessment. J. Med. Syst. 2015, 39, 189. [Google Scholar] [CrossRef]
  35. Sun, G.; French, C.R.; Martin, G.R.; Younghusband, B.; Green, R.C.; Xie, Y.; Mathews, M.; Barron, J.R.; Fitzpatrick, D.G.; Gulliver, W.; et al. Comparison of multifrequency bioelectrical impedance analysis with dual-energy X-ray absorptiometry for assessment of body composition in a population-based study. Am. J. Clin. Nutr. 2005, 81, 74–78. [Google Scholar] [CrossRef] [PubMed]
  36. Smith, T.B.; Hopkins, W.G. Variability and Predictability of Final Rankings in Elite Rowing Competitions. Med. Sci. Sports Exerc. 2011, 43, 2155–2160. [Google Scholar] [CrossRef] [PubMed]
  37. Armstrong, N.; McManus, A.M. Physiology of Elite Young Male Athletes. In Medicine and Sport Science; Hebestreit, H., Bar-Or, O., Eds.; Karger: Basel, Switzerland, 2011; Volume 56, pp. 1–22. [Google Scholar]
  38. Albaladejo-Saura, M.; Vaquero-Cristóbal, R.; García-Roca, J.A.; Esparza-Ros, F. Relationship between biological maturation, physical fitness, and kinanthropometric variables of young athletes: A systematic review and meta-analysis. Int. J. Environ. Res. Public Health 2021, 18, 328. [Google Scholar] [CrossRef] [PubMed]
Figure 1. Contrasting relationships between relative body fat (F%; %) and body surface area (BSA; m2) and performance (Ergo; W) (male group). Legend: The horizontal axis (x) shows the relationship of ergometer performance (Ergo (150–500 W)) with average relative body fat (F%) and body surface area (BSA m2). [Ergo (W): F%, r = −0.6682 (p = 0.008); BSA (m2), r = 0.7793 (p < 0.001)].
Physiologia 06 00015 g001
Figure 2. Contrasting relationships between relative body fat (F%; %) and body surface area (BSA; m2) and performance (Ergo; W) (female group). Legend: The horizontal axis (x) shows the relationship of ergometer performance (Ergo (150–500 W)) with average relative body fat (F%) and body surface area (BSA m2) [Ergo (W): F%, r = −0.6437 (p = 0.008); BSA (m2), r = 0.7261 (p < 0.001)].
Physiologia 06 00015 g002
Table 1. Differences in anthropometric and performance results of all nations, male and female.
VariablesMale (n = 65; Mean ±SD)Female (n = 61; Mean ±SD)p
Sport age (years)8.7512.6738.8972.917(p > 0.05)
Rowing age (years)4.0911.8374.2902.557(p > 0.05)
Height (cm)181.1987.107168.9624.944(p = 0.047)
Body mass (kg)75.3118.41963.5775.445(p = 0.018)
F% (%)13.6144.53625.4965.267(p < 0.001)
M% (%)44.11416.85033.5854.310(p < 0.001)
BMI (kg/m2)22.4212.06122.2841.863(p > 0.05)
Sitting height (cm)93.0634.14288.0943.137(p > 0.05)
Arm span (cm)185.15114.126168.9238.304(p = 0.017)
Lower limb length (cm)104.3656.55199.2694.304(p = 0.023)
BSA (m2)1.9560.1371.7260.087(p = 0.014)
Age15.9510.67915.8360.753(p > 0.05)
Ergo (W)327.10248.649219.63130.960(p = 0.015)
Legend: M% = relative muscle mass. F% = relative fat mass. BSA = body surface area (m2). Sport age indicates total sport participation and rowing age rowing-specific training experience.
Table 2. Anthropometric and performance results by nation in the male group.
VariablesPOR (n = 9)CRO (n = 10)AUT (n = 9)HUN (n = 8)SLO (n = 11)SRB (n = 10)CZE (n = 8)F (df1, df2)pηp2 (95% CI)
Age15.78 ± 0.7215.82 ± 0.6815.96 ± 0.5916.02 ± 0.6315.91 ± 0.7016.05 ± 0.6116.09 ± 0.661.14 (6. 58)(p = 0.32)0.05
Height (cm)174.66 ± 5.20177.34 ± 6.12182.74 ± 5.10179.19 ± 4.89180.67 ± 6.08181.93 ± 5.62185.8 ± 5.742.24 (6. 58)(p = 0.08)0.09
Body mass (kg)71.6 ± 5.8572.62 ± 5.4876.9 ± 6.5073.75 ± 6.8774.37 ± 5.7277.95 ± 6.2176.16 ± 6.331.38 (6. 58)(p = 0.19)0.07
F% (%)15.8 ± 2.3011.57 ± 1.9713.36 ± 2.6012.16 ± 2.0515.87 ± 2.5713.86 ± 2.3115.28 ± 2.212.47 (6. 58)(p = 0.07)0.03
M% (%)41.8 ± 2.8047.49 ± 2.9646.76 ± 2.7149.65 ± 3.1242.63 ± 2.8445.63 ± 2.8941.76 ± 3.051.98 (6. 58)(p = 0.14)0.06
BMI (kg/m2)23.57 ± 1.9523.09 ± 1.9522.18 ± 1.6321.79 ± 1.8221.23 ± 1.6923.28 ± 1.7621.56 ± 1.741.28 (6. 58)(p = 0.61)0.04
Sitting height (cm)90.34 ± 2.7591.8 ± 3.1294.62 ± 2.9494.55 ± 2.7593.35 ± 2.6393.67 ± 2.9196.27 ± 2.861.83 (6. 58)(p = 0.55)0.09
Arm span (cm)182.75 ± 4.60185.4 ± 5.01187.42 ± 4.75184.31 ± 5.38185.57 ± 5.09188.35 ± 4.87189.2 ± 4.521.55 (6. 58)(p = 0.48)0.10
Lower limb length (cm)101.88 ± 2.90103.8 ± 2.97105.42 ± 3.25103.61 ± 3.08104.67 ± 2.89105.4 ± 2.96107.6 ± 3.121.79 (6. 58)(p = 0.32)0.08
BSA (m2)1.938 ± 0.0691.909 ± 0.0691.971 ± 0.0811.996 ± 0.0721.967 ± 0.0681.984 ± 0.0711.989 ± 0.0741.44 (6. 58)(p = 0.26)0.11
Ergo (W)334.7 ± 18.4296.04 ± 19.1333.48 ± 20.2328.17 ± 18.9336.5 ± 19.6334.55 ± 20.1328.8 ± 18.42.09 (6. 58)(p = 0.10)0.12
Legend: M% = relative muscle mass; F% = relative fat mass; BSA = body surface area (m2). POR = Portuguese; CRO = Croatian; AUT = Austrian; HUN = Hungarian; SLO = Slovenian; SRB = Serbian; CZE = Czech. No significant differences were observed in the anthropometric and performance means across groups of different nationalities (p > 0.05).
Table 3. Anthropometric and performance results by nation in the female group.
VariablesGER (n = 11)CRO (n = 9)HUN (n = 14)SLO (n = 10)POR (n = 9)CZE (n = 8)F (df1, df2)pηp2 (95% CI)
Age15.86 ± 0.7415.71 ± 0.6615.92 ± 0.7115.81 ± 0.7415.72 ± 0.8115.96 ± 0.690.97 (5. 55)(p = 0.43)0.04
Height (cm)168.26 ± 5.13171.32 ± 4.85168.95 ± 5.07164.47 ± 4.42166.71 ± 4.26171.37 ± 4.751.87 (5. 55)(p = 0.18)0.08
Body mass (kg)67.28 ± 5.1361.58 ± 4.6262.99 ± 4.8866.7 ± 5.8261.48 ± 3.1964.25 ± 4.821.97 (5. 55)(p = 0.27)0.07
F% (%)29.78 ± 3.8122.73 ± 2.8624.96 ± 3.2829.54 ± 4.8627.71 ± 3.4324.86 ± 3.142.13 (5. 55)(p = 0.32)0.04
M% (%)29.14 ± 3.2937.55 ± 3.6134.73 ± 2.5331.16 ± 3.4732.32 ± 3.9034.48 ± 4.172.39 (5. 55)(p = 0.16)0.07
BMI (kg/m2)23.79 ± 1.3720.98 ± 1.2822.66 ± 1.4225.42 ± 1.3824.73 ± 1.5223.28 ± 1.341.67 (5. 55)(p = 0.41)0.02
Sitting height (cm)88.74 ± 2.8391.47 ± 2.7488.06 ± 2.7686.58 ± 3.6185.28 ± 3.3989.37 ± 2.741.33 (5. 55)(p = 0.61)0.09
Arm span (cm)166.83 ± 4.24173.48 ± 3.79169.35 ± 4.60164.67 ± 4.22167.88 ± 5.21170.71 ± 4.551.69 (5. 55)(p = 0.18)0.07
Lower limb length (cm)97.54 ± 2.93103.27 ± 2.8598.59 ± 2.7696.31 ± 2.62101.93 ± 3.27102.74 ± 2.832.42 (5. 55)(p = 0.11)0.06
BSA (m2)1.773 ± 0.0611.769 ± 0.0581.718 ± 0.0591.733 ± 0.0611.712 ± 0.0631.755 ± 0.0581.44 (5. 55)(p = 0.26)0.10
Ergo (W)216.1 ± 15.2251.35 ± 16.4237.97 ± 14.8231.42 ± 14.5211.46 ± 17.4209.36 ± 15.22.09 (5. 55)(p = 0.08)0.11
Legend: M% = relative muscle mass; F% = relative fat mass; BSA = body surface area (m2). GER = German; CRO = Croatian; HUN = Hungarian; SLO = Slovenian; POR = Portuguese; CZE = Czech. No significant differences were observed in the anthropometric and performance means across groups of different nationalities (p > 0.05).
Disclaimer/Publisher’s Note: The statements, opinions and data contained in all publications are solely those of the individual author(s) and contributor(s) and not of MDPI and/or the editor(s). MDPI and/or the editor(s) disclaim responsibility for any injury to people or property resulting from any ideas, methods, instructions or products referred to in the content.