Abstract
Background: Plantar pressure distribution is a valuable tool for studying how the ground reaction forces are transmitted from the feet to the body and for detecting abnormalities in foot biomechanics. Objectives: The objective of this study was to determine the effect of the foot type (normal foot, flatfoot, and cavus foot) on plantar pressure distribution in healthy Mexican men and women aged from 3 to 74 years. Methods: A database of the plantar pressure distribution under dynamic and static conditions for both feet was studied using descriptive statistics, regression analysis, and statistical factorial design. The database contained images of the soles of the feet and pressure distribution of 996 persons between 3 and 74 years old (53.9% females and 46.1% males). Two different conditions were evaluated; the first was in a static condition, and the second was during walking. The Chippaux–Smirak Index (CSI) was used to classify the type of feet. Results: In the left foot, a linear regression analysis of the soles of the feet shows that the prevalence of flatfoot (p-value = 3.45 × E−5) decreased with age, while the normal foot (p-value = 7.39 × E−5) increased. When people are standing (static), the hindfoot (55.64 ± 18.80%) presents more pressure than the forefoot (45.18 ± 19.50%), while in dynamic, the forefoot (55.95 ± 13.36%) supports more pressure than the hindfoot (44.05 ± 13.36%). Similar behavior occurs in the right foot. A statistical factorial design ANOVA shows that the plantar pressure in the forefoot and hindfoot regions is significantly different (p < 0.05). Conclusions: The prevalence of flatfoot decreased with age, while the proportion of normal foot type increased. Under static conditions, the hindfoot bore more load than the forefoot, whereas under dynamic conditions, the forefoot bore more load than the hindfoot. This research contributes to generating a comprehensive database of reference values of the plantar pressure of different foot types in a Mexican population; this will be useful to podiatrists, clinicians, and physiotherapists for the analysis or treatment of abnormal foot postures.
1. Introduction
The plantar pressure distribution analysis is one of the most common procedures used to investigate the relationship between foot structure (foot type) and the mechanics of the lower limbs of the human body [1,2,3,4]. Several investigations of plantar pressure have been developed to study musculoskeletal disorders of the foot and their effects. For example, plantar pressure has been studied to analyze the relation between the musculoskeletal disorders of the foot and the effect of orthotic devices (insoles) as a conservative treatment [5,6,7,8]. Moreover, abnormal foot posture and plantar pressure are considered risk factors for lower limb injury [1,9]. Another application is footwear science, which studies comfort through plantar pressure and the relationship between the foot and the characteristics of shoes, as this can contribute to sports performance [10,11]. Plantar pressure has been considered in evaluating stress injuries in young soccer players [12,13,14,15]. A decrease in the peak plantar pressure in people with flatfoot could signify a lower risk for stress fractures of the metatarsal bones [16,17]. In addition, clinical studies have determined that plantar pressure can be used to detect stress concentration and provide treatment in patients with diabetic foot [18,19]. Moreover, it has been discovered that the plantar pressure distribution profile for patients with diabetic neuropathy varies from that obtained from healthy individuals [20]. Diabetic foot ulcers and Charcot Foot are serious complications of diabetes, often leading to infection, gangrene, and the need for amputation; therefore, identifying risk factors is crucial for clinical decision-making [21,22,23]. Finally, obese children with flatfoot could present a higher risk for foot injuries, as the foot could be subjected to higher loads and excessive plantar pressures [9,24].
Therefore, it is essential to understand plantar pressure distribution in both healthy individuals and those with conditions such as flatfoot, cavus foot, or diabetic foot. Foot type is classified based on the morphology of the plantar vault. This structure (vault) is formed by three arches of the foot: the medial, lateral, and anterior arches. These three arches support and distribute body weight. The vault plays an important role in foot movement as this structure helps to absorb energy and return it when the body is propelled forward [25]. The efficient propagation of ground reaction forces from the plantar surface to the kinetic chain of the lower extremity is primarily influenced by morphological deviations of the foot, such as flatfoot or cavus foot [10,26]. However, some authors have found that the type of feet or foot posture has a minor effect on knee kinematics during walking [27]. In addition, it has been reported that the foot type does not affect the subtalar joint when participants run for 5 min. Nevertheless, they found a significant increase in the subtalar joint eversion (calcaneal eversion) in individuals with flatfoot and cavus foot after 45 min of running [28].
Several non-invasive methodologies are available for classifying foot types based on plantar footprint analysis, including the Chippaux–Smirak Index (CSI), Staheli Arch Index, Hernández–Corvo Index, Clarke Angle, among others [29,30,31,32,33]. Among these, the CSI is one of the most widely adopted due to its reliability and ease of application [34,35,36]. Moreover, it presents no health risks, as it does not involve exposure to X-rays (ionizing radiation).
It has been reported that the modification of the foot structure (medial longitudinal arch and vault) could modify the kinematics/kinetics of the lower limbs, and have a negative impact on people’s quality of life [2,16,29,37,38].
From the plantar pressure analysis in the standing position and barefoot, it has been found that 60% of the pressure is in the hindfoot region and 40% in the forefoot [25,39]. Other authors have considered 50% of the pressure in the forefoot and hindfoot regions as a normal distribution [6]. There is no standard plantar pressure, and the variations in the reported values could be due to the anthropometric features of the population studied. Then, the pressure distribution of the foot for each condition has yet to be identified.
Although different studies have reported plantar pressure, to the best of our knowledge, there is no study about plantar pressure related to the type of feet of a population from an early age to adulthood. Most of the studies reported describe the effect of the plantar pressure distribution for a specific population with a particular or limited range of ages [9,19,40,41]. One study has reported on the spatiotemporal parameters of gait and plantar pressure patterns in people from 3 to 101 years [42]. However, this study did not consider the relationship between the plantar pressure and the type of feet [42].
Therefore, the main objective of this research was to determine the effect of foot type (normal foot, flatfoot, and cavus foot) on plantar pressure distribution in healthy Mexican men and women aged from 3 to 74 years. Two different conditions were evaluated: the first was in the static condition, and the second was during walking. This research aims to clarify and understand the relationship between the plantar pressure distribution and the type of feet at different ages. A secondary objective was to generate a comprehensive database of reference values, organized by age, type of feet, and plantar pressure distribution in the human lifespan. Moreover, this study examined two hypotheses. The first proposed that foot type is associated with age. The second suggested that plantar pressure distribution in the hindfoot is higher than the forefoot when people are standing (static), and this pattern reverses when people walk.
2. Materials and Methods
A database of the soles of the feet and plantar pressure distribution on dynamic and static conditions of both feet was studied. The database was acquired between 2017 and early 2023.
2.1. Participants
The database included images of the soles of the feet and plantar pressure distribution of 996 persons between 3 and 74 years (53.9% females and 46.1% males). Table 1 shows the gender distribution (males/females), body mass index (BMI), and gait velocity of the participants arranged in 9 groups. The participants were recruited using convenience sampling. The inclusion criteria were healthy male and female participants who were able to execute the gait without impairment. Participants who did not provide anthropometric data or did not complete all trials were excluded from the analysis. Furthermore, participants with musculoskeletal disorders such as hallux valgus, diabetic foot, or recent surgeries were also excluded.

Table 1.
Anthropometric data of the participants and average velocity during walking.
The procedures, risks, and benefits were explained to the participants in order to obtain their voluntary and written consent to participate, following the General Health Law of Mexico, and considering the principles of the Declaration of Helsinki. The process and the execution of this study were approved by the Bioethics Committee of the Center for Applied Innovation in Competitive Technologies, registered with the National Bioethics Commission N.CONBIOETICA11CEI00620131108.
The participants were distributed by age into nine groups, with each having a range of 8 years, as shown in Table 1. Most groups included more than 80 participants. The smallest group had 65 participants, while the largest one included 140. The data were extracted directly from the FreeStep software (ver. 1.6.009, Sensormedica, Guidonia Montecelio, Rome, Italy). Then, the data processing was done in Matlab R2015a software (version 8.5.0.197613, The MathWorks Inc., Natick, MA, USA) using custom-written code.
2.2. Procedure and Assessment of Plantar Pressure Distribution
For the dynamic condition (gait), the participants were instructed to walk barefoot at a comfortable speed as they do in daily life. They walked four times on two pressure platforms at a self-preferred velocity. The dimensions of each pressure platform were 1.2 × 0.5 m (Sensormedica, Guidonia Montecelio, Roma, Italia), as shown in Figure 1. When in static conditions, the participants stayed in a standing anatomical position barefoot on the baropodometer to measure the plantar pressure distribution, as shown in Figure 1. For this condition, the plantar pressure was measured for 10 s, and the results were averaged.
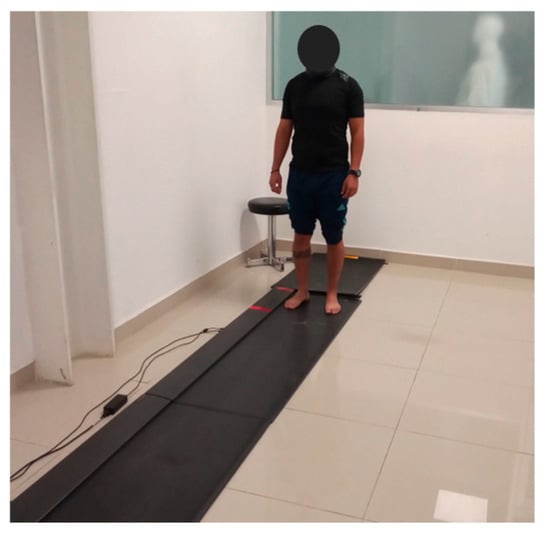
Figure 1.
Equipment for measuring the plantar pressure distribution in static and dynamic conditions.
The mean pressure values of both regions (the hindfoot and forefoot) were obtained directly from the FreeStepTM software. The plantar pressure distribution was normalized with the body mass of each participant. Then, the units of the plantar pressure were in percentage (%). The recording frequency of the baropodometry was 50 Hz.
As the participants stayed barefoot in a standing anatomical position, the soles of the feet were digitized with a Podoscan (Sensormedica, Guidonia Montecelio, Roma, Italia). The measurements of the soles of the feet were considered to classify the type of feet in the participants. The data acquisition was performed by one experienced physiotherapist and a researcher with more than eight years of experience in biomechanics.
The calibration of the equipment was done according to the user manual. Figure 2 shows the plantar pressure distribution on the forefoot and hindfoot regions in static and dynamic conditions. The red color represents the higher plantar pressure distribution. Conversely, the dark brown color represents the lower plantar pressure, as shown in Figure 2.
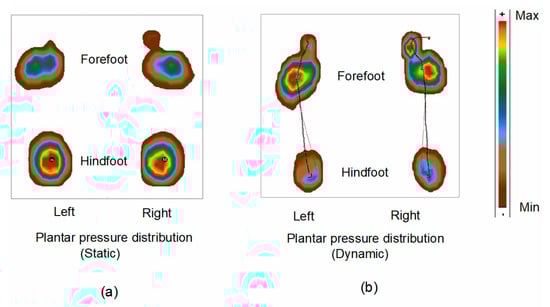
Figure 2.
Foot features: Plantar pressure distribution in (a) static condition and (b) during walking (dynamic). Capital M represents the maximum pressure point for the right foot, and lower m represents the maximum point for the left foot.
2.3. Foot Type Classification
The Chippaux–Smirak Index (CSI) was used to classify the type of feet as has been done in previous studies [35,36,43,44]. The CSI was measured from the widest part of the front foot (forefoot) and the narrowest part of the middle foot (midfoot), as shown in Figure 3. Although there are other techniques to classify the type of feet, the CSI has proved to be a non-invasive and reliable procedure [5,45,46,47,48]. It was decided to classify just three types of feet (normal foot, flatfoot, and cavus foot) to have a significant amount of data to compare the pressure differences between the types of feet. The CSI ratio for a normal foot was 0.25 ≤ CSI < 0.45, for a flatfoot was CSI ≥ 0.45, and for a cavus foot was 0 ≤ CSI < 0.25 [45,46,47,48].
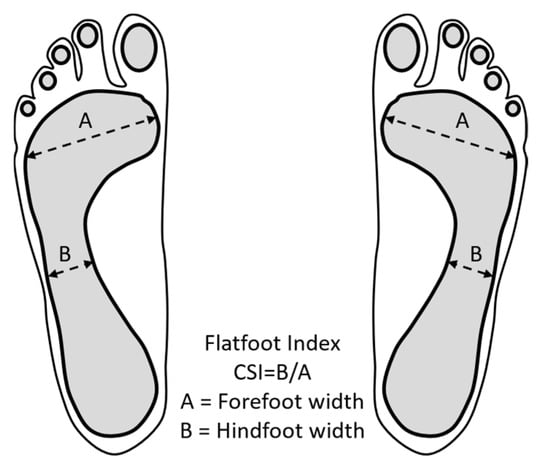
Figure 3.
Measurements of the soles of the feet: Classification of the type of feet through the Chippaux–Smirak Index (CSI).
Once the classification of the type of feet was done, the mean percentage of the plantar pressure of the hindfoot and forefoot regions was correlated for every group and type of feet.
2.4. Statistical Analysis
In this section, descriptive statistics, along with histograms, were used to graphically show the data. Furthermore, a regression analysis was performed to validate the results of the type of feet [49,50]. By doing the regression analysis, it can be determined if there is a significant change in the number of people for each foot type over time. A linear regression model is proposed as shown in Equation (1) for each foot type (flatfoot, normal, and cavus) on each foot (left and right).
where and are the response and the independent variables of the class, respectively, is the intercept and is the slope of the regression model. To determine if the assumptions of the models were fitted, the Shapiro–Wilks test and a visual inspection of the standardized residuals versus fitted values were performed to evaluate normality and homoscedasticity, respectively. The significance level was set at p < 0.05.
In addition, trends in the plantar pressure distribution were analyzed with a statistical factorial design. Factorial designs allow us to observe the factors that influence the increase or decrease in foot pressure. Plantar pressure is a determining factor when observing the patient’s foot type. Three factors were considered for the factorial design: foot type (normal, cavus, and flatfoot), foot part (forefoot and hindfoot), and the type of analysis (static and dynamic). Age was also considered a blocking factor. According to some reported studies, age was blocked because age influences foot type [46,51]. Then, a factorial Analysis of Variance (ANOVA) of those three factors was performed. The significance level was taken to be p < 0.05. The statistical analysis was performed in R software, version 4.2.2 (2022).
3. Results
3.1. Assessment of the Prevalence of the Foot Type
The analysis of the soles of the feet shows a high prevalence of flatfoot at an early age, and it decreases in adulthood, as shown in Figure 4. Conversely, the prevalence of normal feet is low at an early age, and it increases in adulthood. The cavus foot remains within a range from 4 to 14% of prevalence, and on average, this is close to 8%. Figure 4a presents the prevalence of the type of feet in the left foot. The prevalence of flatfoot decreases from 81.2% to 15.9% from an early age (3–10 years) to adulthood (67–74 years) in the left foot. The prevalence of normal foot increases from 14.9% to 76% from the first group to the eighth group (59–66 years) and slightly decreases to 69.8% in the last group (67–74 years). The prevalence of the cavus foot remains in the range from 4% to 14.3%.
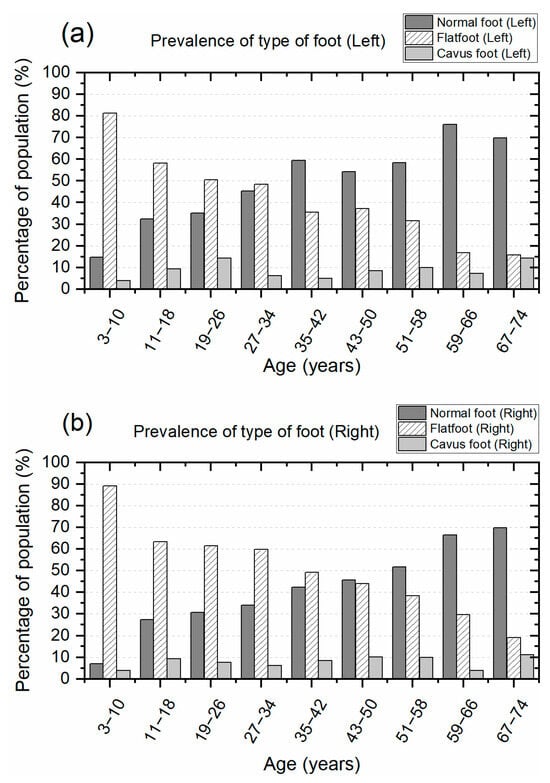
Figure 4.
Classification of the type of feet at different ages, starting from three to seventy-four years: (a) Prevalence of the type of feet in the left foot and (b) prevalence of the type of feet in the right foot.
Similarly, the percentage of prevalence of the type of feet in the right foot presents a comparable trend to that observed for the left foot, as shown in Figure 4b. The prevalence of flatfoot decreases from 89.1% to 19% from an early age (3–10 years) to adulthood (67–74 years) in the right foot. The prevalence of normal foot increases from 6.9% to 69.8% from the first group (3–10 years) to the last group (67–74 years). The prevalence of the cavus foot remains in the range from 4% to 11.1%.
3.2. Plantar Pressure Distribution in Forefoot and Hindfoot Regions
Figure 5a displays the plantar pressure distribution of the left and right feet in the static condition when the participants remain in a standing position. The graphs indicate that most hindfoot pressure values cluster near 100% on both axes. This indicates that the hindfoot, or heel, bears greater pressure compared to the forefoot region. Conversely, the forefoot pressure values stay in the region close to 0% for both axes. This indicates that the forefoot has less pressure when the person is in a standing position. This distribution pattern of pressure occurs on both feet. The mean percentage pressure values of the left foot were 45.18 ± 19.50% for the forefoot region and 55.64 ± 18.80% for the hindfoot. Similarly, the mean percentage pressure values of the right foot were 45.38 ± 18.63% for the forefoot region and 54.62 ± 18.63% for the hindfoot.
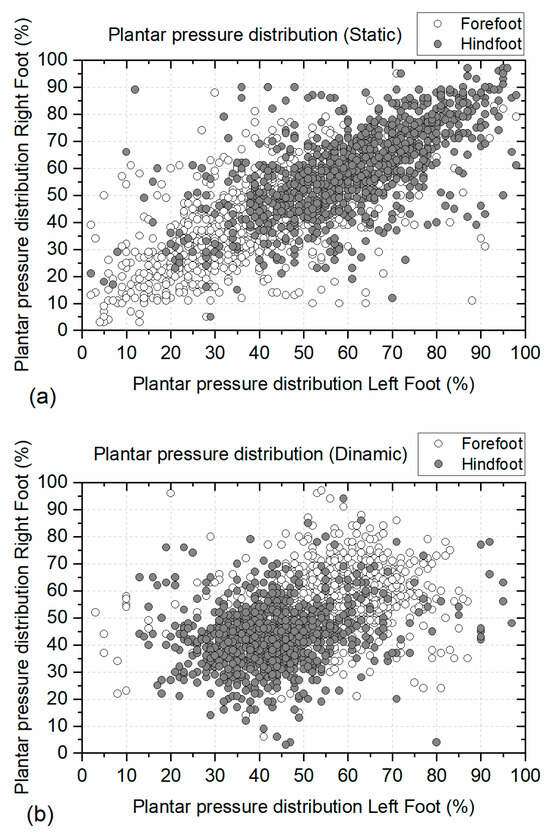
Figure 5.
Plantar pressure distribution in the forefoot and hindfoot regions: (a) Plantar pressure distribution in static conditions, and (b) plantar pressure distribution in dynamic conditions. Plantar pressure normalized with body mass.
Figure 5b presents the plantar pressure distribution of the left and right feet in dynamic conditions when the participants were walking at an average velocity of 4.90 km/h (1.36 m/s). Under dynamic conditions, the forefoot pressure values approach 100% for both axes. This means that the forefoot region is subjected to more pressure, and the pressure in the hindfoot diminishes. The mean percentage pressure values of the left foot were 55.95 ± 13.36% for the forefoot region and 44.05 ± 13.36% for the hindfoot. Similarly, the mean percentage pressure values of the right foot were 57.12 ± 11.10% for the forefoot region and 42.88 ± 11.10% for the hindfoot.
3.3. Plantar Pressure Distribution Across Age Groups
Figure 6 illustrates the mean and standard deviation of plantar pressure distribution by age group under static conditions. In this scenario, plantar pressure was consistently higher in the hindfoot compared to the forefoot across all age groups. This pattern was observed in both the left and right feet.
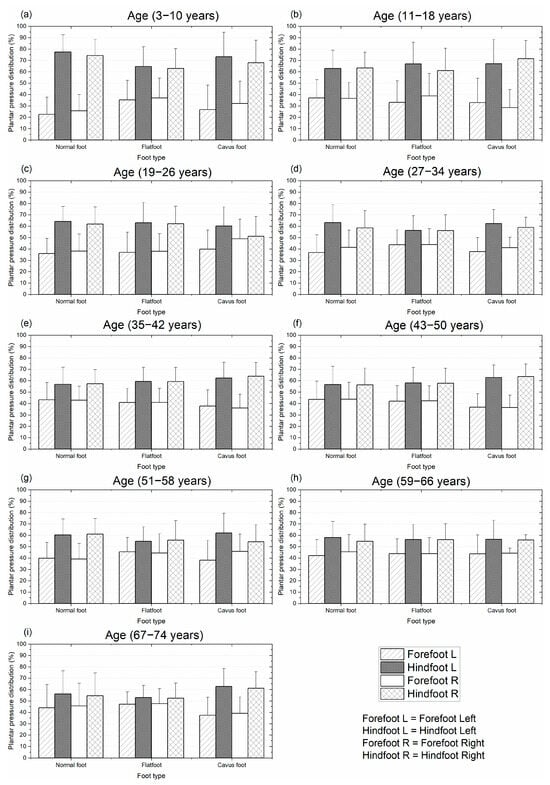
Figure 6.
Mean and standard deviation of the plantar pressure distribution for different types of feet on static condition: distribution by age from 3 to 74 years. Plantar pressure normalized with body mass.
The first group (3–10 years) presented the highest difference in pressure between the forefoot and hindfoot for the three types of feet. Conversely, the group between 67 and 74 years presented the lowest difference in pressure between the forefoot and hindfoot for the normal foot and flatfoot. In most of the groups, the difference in pressure for the two regions (hindfoot vs. forefoot) was reduced as the age increased, as shown in Figure 6. However, there were a few cases where the pressure difference did not decrease with age; this can be observed in the cavus foot of the last group, Figure 6.
Similarly, Figure 7 shows the mean and standard deviation of the plantar pressure distribution in the hindfoot and forefoot regions in dynamic conditions. This figure shows the recorded plantar pressures for the three types of feet being studied for individuals aged from 3 to 74 years. For this condition, in all groups, the plantar pressure distribution was higher in the forefoot region, except in the first group, where the normal foot and cavus foot presented higher pressure in the hindfoot region.
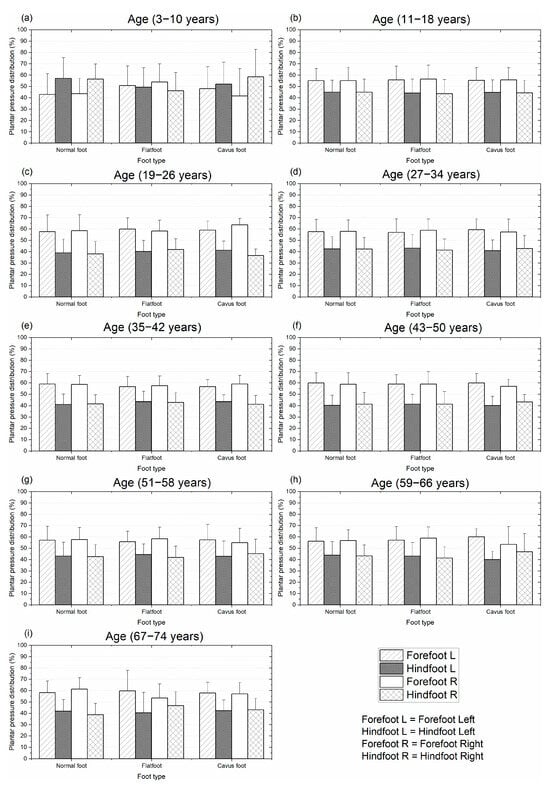
Figure 7.
Mean and standard deviation of the plantar pressure distribution for different types of feet on dynamic condition: distribution by age from 3 to 74 years. Plantar pressure normalized with body mass.
Under dynamic conditions (gait), the difference in plantar pressure between the forefoot and hindfoot regions was nearly uniform across all groups, except for the first group. Unlike the static condition, this pressure difference did not vary with age. Excluding the first group, the mean pressure difference between the two regions across all age groups and foot types was 15%, as illustrated in Figure 7. This pattern was consistent for both the left and right feet.
3.4. Statistical Results of the Type of Feet
The regression analysis performed for the three types of feet in the left foot indicates that the flatfoot and normal foot can be predicted as people age. For the flatfoot class, the p-value is significant (p-value = 3.45 × E−5) and the model fits the data well, as the R-squared value is 0.925, so the number of people who have flat feet is smaller over the years. For the normal foot class, the p-value is significant (p-value = 7.39 × E−5), and the model fits the data well, as the R-squared value is 0.907, so there are more people in this class over time. In the case of cavus foot, the regression model and the coefficients are not significant (p-value = 0.35 × E0); it cannot be said that over time the number of people who have cavus foot increases or decreases significantly.
In addition, the regression analysis for the three types of feet in the right foot presents similar results to the left foot. It is shown that the number of people with flat feet decreases with age (p-value = 1.40 × E−5 and R-squared = 0.942). The opposite happens with the normal foot when the age increases; there is a greater number of people with this type of foot (p-value = 5.54 × E−6 and R-squared = 0.955). For the cavus foot, the linear regression model and coefficients are not significant.
3.5. Statistical Results of the Plantar Pressure Distribution Across Ages
Table 2 shows the ANOVA found. This analysis shows three significant factors, which are those with bold p-values. Some of these significant factors are factor interactions, so individual factors are not ruled out based on the hierarchy principle. The foot part (forefoot or hindfoot) is considered significant for the plantar pressure on the feet when standing and walking. Furthermore, the plantar pressure significantly changes in the foot when people are standing or walking. The significance of the results comes mostly from the foot part since, in the two significant interactions, the one factor is the foot part, as shown in Table 2.
Table 2.
ANOVA of the factors influencing foot pressure.
How the foot part influences the pressure is observed in Figure 8. We observe that the direction of the plantar pressure changes if a static or dynamic (walking) analysis is performed for each part of the foot. Moreover, it is visible how the plantar pressure changes concerning the foot part (forefoot and hindfoot).
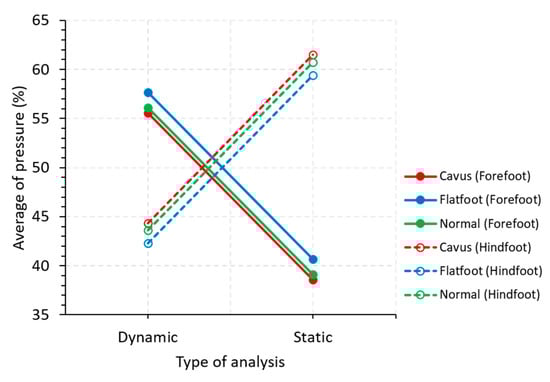
Figure 8.
Main effects graph for the average pressure.
4. Discussion
The analysis of plantar pressure distribution across different foot types and ages demonstrates variations in pressure distribution with age. The first hypothesis set at the beginning has been partially accepted, as the foot type is associated with age, except for the cavus foot. This means the foot structure (flatfoot and normal foot) could change as people age. The second hypothesis was accepted; a significant difference was found between the forefoot and hindfoot when people are standing or walking. These results were validated with statistical tools and linear regression analysis in each type of foot.
It is known that the plantar pressure distribution has been used to identify foot disorders. From the results, it was found that the plantar pressure was higher in the hindfoot than the forefoot when the participants were standing. Furthermore, the plantar pressure distribution between the forefoot and hindfoot regions tends to be similar in static conditions as people get older, except for the cavus foot. This plantar pressure pattern may enhance stability during standing [52]. Moreover, the foot structure (muscles, tendons, and ligaments) tends to change as people age, making the foot more flexible. Age-related structural changes in the foot may influence plantar pressure distribution. It is known that elderly people tend to walk more slowly as a protective mechanism to avoid falls [52,53]. Our results support this idea, as gait speed tends to decrease as people age. This trend is consistent with Pomarino’s findings, which reported increased forefoot pressure with age [54]. Furthermore, from the statistical factorial design, it was found that the foot part (forefoot and hindfoot) and the type of analysis (static and dynamic) were the factors that most affected the plantar pressure distribution.
Analyzing the plantar pressure distribution in people from an early age to adulthood is useful for identifying abnormal plantar pressure in people with diabetes [19]. It is recommended to treat or resolve those foot disorders that could affect the plantar pressure distribution, especially when they can produce foot ulcers. The results of the plantar pressure distribution found in static conditions support the idea that the plantar pressure is different between young and elderly people [52]. Furthermore, our results of the plantar pressure were not the same but were close to the values of Viladot and Pomarino (60% hindfoot and 40% forefoot) [25,52]. This means that the Mexican population presents a particular plantar pressure distribution. The pressure differences among other studies could be because we considered people from an early age to adulthood. Moreover, it is known that body mass can affect the postural sway and the center of pressure [55,56]. The characteristics of the study (gait speed), the different age ranges, or the type of subjects (anthropometric features) considered in the research could contribute to those differences as well.
Other authors have considered that the plantar pressure should be 50% for the forefoot and hindfoot [6]. In our results, the main pressure differences were found between the forefoot and hindfoot regions of the foot in static and dynamic conditions. Our findings show that the plantar pressure during walking tends to be higher in the anterior part of the foot, except for the youngest group of people (3–10 years). It is possible that the maturation of the foot structure played an important role in the plantar pressure distribution, as in this case, the vault could not be completely developed.
Moreover, the fact that the plantar pressure in the forefoot was higher could be produced by the ground reaction force that the body structure has to overcome (inertia) to move forward (push-off phase). This pressure distribution pattern was observed on both feet.
There is limited research on plantar pressure distribution from early childhood to adulthood [54,57]. Most existing studies focus on healthy subjects in a static position [27] or limited age groups [1,2,56]. Comparative analysis of normative plantar pressure datasets is hindered by methodological heterogeneity, particularly concerning data normalization procedures and regional foot segmentation frameworks. There is a lack of consensus regarding the appropriate scaling parameters, such as normalization to body mass, foot contact area, foot length, or peak force, which can substantially alter the interpretation of pressure magnitudes. Furthermore, inconsistencies in the anatomical delineation of plantar regions (e.g., forefoot, midfoot, hindfoot, and subregions such as the metatarsal heads or heel quadrants) result in variable spatial resolution and data granularity across studies. These discrepancies limit the interoperability of datasets, constrain meta-analytical synthesis, and impede the establishment of universally applicable normative benchmarks in plantar pressure research [1,42,56,58].
To the best of our knowledge, this is the first study to examine the relationship between plantar pressure distribution and foot types across different age groups in a Mexican population. Although the plantar pressure patterns related to the spatiotemporal gait parameters have been studied, the relationship between the plantar pressure and foot type from early age to adulthood has not been reported yet [42].
Our study presents some limitations. First, the results cannot be generalized due to the size of the sample considered in the analysis. Further work has to be done considering more people per group and reducing the range of ages between groups (i.e., from 2 to 4 years). This is important for young people when the foot dimensions change rapidly. Second, even though the participants were instructed to walk at a comfortable speed as they usually do in daily life, there were some differences between young and elderly people. Therefore, the plantar pressure could increase as velocity increases. Third, although we measured the BMI in the participants, we did not study the relationship between the BMI and plantar pressure distribution. Finally, the type of foot classification could be affected by the index selected (CSI), as there are other methods to classify the type of feet, such as the Staheli Arch Index, Hernández–Corvo Index, Clarke Angle, Foot Posture Index, and so on. Then, the interpretation of the results must be taken with caution.
However, although there are some limitations, the results clearly show that the plantar pressure distribution is different between young and elderly people. Moreover, the mean plantar pressure in the forefoot tends to be similar to the forefoot region as people age. It will be necessary to consider more variables in future studies, such as sports activities, shoe-wearing habits, overweight conditions, and so on, to have a better understanding of plantar pressure in daily life activities. Reference or normative data contribute to evaluating the effectiveness of rehabilitative interventions and can also be used for comparison across different studies.
Similarly, further studies have to be done to analyze the plantar pressure distribution during gait at higher velocities or during different sports maneuvers. We hypothesize that the plantar pressure distribution in the forefoot will increase significantly and could be a risk factor for getting a stress injury [12,14,15]. There are few studies with conclusive information regarding plantar pressure distribution at different ages, so the comparison of results becomes difficult.
5. Conclusions
In conclusion, the prevalence of flatfoot decreased with age, while the proportion of normal foot type increased. Under static conditions, the hindfoot bore more load than the forefoot, whereas under dynamic conditions, the forefoot bore more load than the hindfoot. The static load discrepancy decreased with age, but the dynamic load pattern remained unchanged. Furthermore, the present study contributes to the development of a comprehensive normative database of plantar pressure distributions across various foot types within a Mexican population, providing a valuable reference for clinical assessment, gait analysis, and the design of preventive strategies that target foot health and balance in young and elderly populations.
Author Contributions
Conceptualization, J.A.R.-F., D.O. and I.M.-A.; methodology, J.A.R.-F., D.S.-O. and I.M.-A.; software, J.A.R.-F.; validation, J.S.J.-F., L.A.O.-L., A.V.L. and I.M.-A.; formal analysis, D.O., D.S.-O. and J.S.J.-F.; investigation, A.V.L., L.A.O.-L., J.A.R.-F. and I.M.-A.; resources, I.M.-A.; data curation, J.A.R.-F., D.O., D.S.-O. and J.S.J.-F.; writing—original draft preparation, J.A.R.-F., I.M.-A. and A.V.L.; writing—review and editing, D.O., D.S.-O., J.A.R.-F. and I.M.-A.; visualization, L.A.O.-L., J.S.J.-F. and A.V.L.; supervision, I.M.-A.; project administration, J.A.R.-F. and I.M.-A. All authors have read and agreed to the published version of the manuscript.
Funding
This research received no external funding.
Institutional Review Board Statement
The protocol and the execution of this study were approved by the Bioethics Committee of the Center for Applied Innovation in Competitive Technologies, registered with the National Bioethics Commission N.CONBIOETICA11CEI00620131108 (approval date: 6 December 2016).
Informed Consent Statement
Informed consent was obtained from all subjects involved in the study.
Data Availability Statement
Data presented in this research are not publicly available but may be obtained from the authors upon request.
Acknowledgments
The authors would like to thank the SECIHTI for supporting the postgraduate students involved in this work.
Conflicts of Interest
The authors declare no conflicts of interest.
References
- Buldt, A.K.; Allan, J.J.; Landorf, K.B.; Menz, H.B. The relationship between foot posture and plantar pressure during walking in adults: A systematic review. Gait Posture 2018, 62, 56–67. [Google Scholar] [CrossRef]
- Said, A.M.; Justine, M.; Manaf, H. Plantar pressure distribution among older persons with different types of foot and its correlation with functional reach distance. Scientifica 2016, 2016, 8564020. [Google Scholar] [CrossRef]
- Bloks, B.E.; Wilders, L.M.; Louwerens, J.W.K.; Geurts, A.C.; Nonnekes, J.; Keijsers, N.L.W. Quantitative assessment of plantar pressure patterns in relation to foot deformities in people with hereditary motor and sensory neuropathies. J. Neuroeng. Rehabil. 2023, 20, 65. [Google Scholar] [CrossRef] [PubMed]
- Shu, L.; Hua, T.; Wang, Y.; Qiao Li, Q.; Feng, D.D.; Tao, X. In-shoe plantar pressure measurement and analysis system based on fabric pressure sensing array. IEEE Trans. Inf. Technol. Biomed. 2010, 14, 767–775. [Google Scholar] [CrossRef] [PubMed]
- Costea, M.; Sarghie, B.; Mihai, A.; Rezus, E. Classification of the elderly foot types based on plantar footprints. Procedia Eng. 2017, 181, 36–43. [Google Scholar] [CrossRef]
- Mazur, F.; Swoboda, B.; Carl, H.D.; Lutter, C.; Engelhardt, M.; Hoppe, M.W.; Hotfiel, T.; Grim, C. Plantar pressure changes in hindfoot relief devices of different designs. J. Exp. Orthop. 2019, 6, 7. [Google Scholar] [CrossRef]
- López-López, D.; Ortiz-González, L.M.; Saleta-Canosa, J.L.; Bouza-Prego, M.D.L.Á.; García-Sánchez, M.M.; Tajes, F.A. Determinación de la presión plantar en personas que utilizan ortesis a medida en el pie. Gac. Med. Mex. 2015, 151, 318–322. [Google Scholar]
- Hernández-Gandarillas, P.; Orozco-Villaseñor, S.L.; Mayagoitia-Vázquez, J.J.; Miguel-Andrés, I.; Herrera-Rangel, J.P.; de la Cruz-Alvarado, K.D. Results of the Use of Personalized Insoles for the Treatment of Cavus Foot and Comorbidities. IFMBE Proc. 2020, 75, 921–932. [Google Scholar] [CrossRef]
- Yan, S.; Wang, Y.; Li, R.; Zhang, L.; Chen, W.; Yang, L. The effect of foot type on the foot morphology and plantar pressure distribution of obese children. Leather Footwear J. 2017, 17, 227–234. [Google Scholar] [CrossRef]
- Hawrylak, A.; Brzeźna, A.; Chromik, K. Distribution of plantar pressure in soccer players. Int. J. Environ. Res. Public Health 2021, 18, 4173. [Google Scholar] [CrossRef]
- Hennig, E.M. Plantar pressure measurements for the evaluation of shoe comfort, overuse injuries and performance in soccer. Footwear Sci. 2014, 6, 119–127. [Google Scholar] [CrossRef]
- Azevedo, R.R.; Nery, S.B.; Stefanyshyn, D.J.; Carpes, F.P. Plantar loading in the youth soccer player during common soccer movements and risk for foot injury. Injury 2020, 51, 1905–1909. [Google Scholar] [CrossRef]
- Azevedo, R.R.; da Rocha, E.S.; Franco, P.S.; Carpes, F.P. Plantar pressure asymmetry and risk of stress injuries in the foot of young soccer players. Phys. Ther. Sport. 2017, 24, 39–43. [Google Scholar] [CrossRef]
- Wilzman, A.R.; Tenforde, A.S.; Troy, K.L.; Hunt, K.; Fogel, N.; Roche, M.D.; Kraus, E.; Trikha, R.; Delp, S.; Fredericson, M. Medical and Biomechanical Risk Factors for Incident Bone Stress Injury in Collegiate Runners: Can Plantar Pressure Predict Injury? Orthop. J. Sport Med. 2022, 10, 232596712211047. [Google Scholar] [CrossRef]
- Matsuda, S.; Fukubayashi, T.; Hirose, N. Characteristics of the foot static alignment and the plantar pressure associated with fifth metatarsal stress fracture history in male soccer players: A case-control study. Sport. Med. Open 2017, 3, 27. [Google Scholar] [CrossRef]
- Ortiz-Lango, L.A.; Miguel-Andrés, I.; López-López, D.; Mayagoitiza-Vázquez, J.J.; Becerro-de-Bengoa-Vallejo, R.; Losa-Iglesias, M.; Gómez-Salgado, J.; Saavedra-Garcia, M. An overview of the risk factors for producing fifth metatarsal fracture in sports activities: A systematic review. J. Foot Ankle Res. 2024, 17, e70012. [Google Scholar] [CrossRef] [PubMed]
- Chuckpaiwong, B.; Nunley, J.A.; Mall, N.A.; Queen, R.M. The effect of foot type on in-shoe plantar pressure during walking and running. Gait Posture 2008, 28, 405–411. [Google Scholar] [CrossRef]
- Deschamps, K.; Matricali, G.A.; Roosen, P.; Desloovere, K.; Bruyninckx, H.; Spaepen, P.; Nobels, F.; Tits, J.; Flour, M.; Staes, F. Classification of forefoot plantar pressure distribution in persons with diabetes: A novel perspective for the mechanical management of diabetic foot? PLoS ONE 2013, 8, e79924. [Google Scholar] [CrossRef] [PubMed]
- Sutkowska, E.; Sutkowski, K.; Sokołowski, M.; Franek, E.; Dragan, S. Distribution of the highest plantar pressure regions in patients with diabetes and its association with peripheral neuropathy, gender, age, and BMI: One centre study. J. Diabetes Res. 2019, 2019, 7395769. [Google Scholar] [CrossRef] [PubMed]
- Bacarin, T.A.; Sacco, I.C.N.; Hennig, E.M. Plantar pressure distribution patterns during gait in diabetic neuropathy patients with a history of foot ulcers. Clinics 2009, 64, 113–133. [Google Scholar] [CrossRef]
- Greco, T.; Mascio, A.; Comisi, C.; Polichetti, C.; Caravelli, S.; Mosca, M.; Mondanelli, N.; Troiano, E.; Maccauro, G.; Perisano, C. RANKL-RANK-OPG Pathway in Charcot diabetic foot: Pathophysiology and clinical-therapeutic implications. Int. J. Mol. Sci. 2023, 24, 3014. [Google Scholar] [CrossRef] [PubMed]
- Mascio, A.; Comisi, C.; Cinelli, V.; Pitocco, D.; Greco, T.; Maccauro, G.; Perisano, C. Radiological assessment of Charcot neuro-osteoarthropathy in diabetic foot: A narrative review. Diagnostics 2025, 15, 767. [Google Scholar] [CrossRef]
- Farine, F.; Rapisarda, A.M.; Roani, C.; Giuli, C.; Comisi, C.; Mascio, A.; Greco, T.; Maccauro, G.; Perisano, C. Predictive factors of amputation in diabetic foot. Biomedicines 2024, 12, 2775. [Google Scholar] [CrossRef]
- Dowling, A.M.; Steele, J.R.; Baur, L.A. What are the effects of obesity in children on plantar pressure distributions? Int. J. Obes. 2004, 28, 1514–1519. [Google Scholar] [CrossRef]
- Voegeli, A.V. Anatomía funcional y biomecánica del tobillo y el pie. Rev. Esp. Reumatol. 2003, 30, 467–538. [Google Scholar]
- Orozco-Villaseñor, S.; Mayagoitia-Vázquez, J.; Miguel-Andrés, I.; Cruz-Alvarado, K.D.L. Villanueva-Salas, R. Factores de riesgo asociados a patologías musculoesqueléticas en deportistas con pie cavo anterior a través de estudios de baropodometría. Acta Ortop. Mex. 2021, 35, 317–321. [Google Scholar] [CrossRef]
- Buldt, A.K.; Levinger, P.; Murley, G.S.; Menz, H.B.; Nester, C.J.; Landorf, K.B. Foot posture and function have only minor effects on knee function during barefoot walking in healthy individuals. Clin. Biomech. 2015, 30, 431–437. [Google Scholar] [CrossRef] [PubMed]
- Sinclair, C.; Svantesson, U.; Sjöström, R.; Alricsson, M. Differences in pes planus and pes cavus subtalar eversion/inversion before and after prolonged running, using a two-dimensional digital analysis. J. Exerc. Rehabil. 2017, 13, 232–239. [Google Scholar] [CrossRef] [PubMed]
- Fuentes-Venado, C.E.; Ángeles-Ayala, A.; Salcedo-Trejo, M.S.; Sumano-Pérez, L.J.; Valle, C.Y.V.-D.; Martínez-Herrera, E.O.; León, M.G.F.; González-Gutiérrez, L.E.; Monjaras-Bernal, I.G.; Pinto-Almazán, R. Comparative assessment of flatfoot in preschool children. Bol. Med. Hosp. Infant. Mex. 2020, 77, 312–319. [Google Scholar] [CrossRef]
- Luengas, L.; Díaz, M.; González, J.L. Determinación de tipo de pie mediante el procesamiento de imágenes. Ingenium Rev. La. Fac. Ing. 2016, 17, 147–161. [Google Scholar]
- Mosca, V.S. Flexible flatfoot in children and adolescents. J. Child. Orthop. 2010, 4, 107–121. [Google Scholar] [CrossRef] [PubMed]
- Mortazavi, J.; Espandar, R.; Baghdadi, T. Flatfoot in children: How to approach? Iran. J. Pediatr. 2007, 17, 163–170. [Google Scholar]
- Nikolaidou, M.E.; Boudolos, K.D. A footprint-based approach for the rational classification of foot types in young schoolchildren. Foot 2006, 16, 82–90. [Google Scholar] [CrossRef]
- Arizmendi, L.A.; Huanaco, E.P.; Lara, B.R. Prevalencia de pie plano en niños de Morelia. Rev. Mex. Pediatr. 2004, 71, 66–69. [Google Scholar]
- Miguel-Andrés, I.; Ramos-Frutos, J.; Sharawi, M.; Oliva, D.; Reyes-Dávila, E.; Casas-Ordaz, Á.; Perez-Cisneros, M.; Zapotecas-Martinez, S. Wrapper-Based Feature Selection to Classify Flatfoot Disease. IEEE Access 2024, 12, 22433–22447. [Google Scholar] [CrossRef]
- Miguel Andrés, I.; Mayagoitia Vázquez, J.J.; Orozco Villaseñor, S.L.; León Rodríguez, M.; Samayoa Ochoa, D. Efecto de la morfología de las plantas de los pies en la distribución de presión plantar en atletas jóvenes con diferentes tipos de pie. Fisioterapia 2021, 43, 30–37. [Google Scholar] [CrossRef]
- Kodithuwakku Arachchige, S.N.K.; Chander, H.; Knight, A. Flat feet: Biomechanical implications, assessment and management. Foot 2019, 38, 81–85. [Google Scholar] [CrossRef]
- Wafai, L.; Zayegh, A.; Woulfe, J.; Mahfuzul, S.; Begg, R. Identification of foot pathologies based on plantar pressure asymmetry. Sensors 2015, 15, 20392–21408. [Google Scholar] [CrossRef]
- Cavanagh, P.R.; Rodgers, M.M.; Liboshi, A. Pressure distribution under symptom-free feet during barefoot standing. Foot Ankle Int. 1987, 7, 262–278. [Google Scholar] [CrossRef]
- Deepashini, H.; Omar, B.; Paungmali, A.; Amaramalar, N.; Ohnmar, H.; Leonard, J. An insight into the plantar pressure distribution of the foot in clinical practice: Narrative review. Pol. Ann. Med. 2014, 21, 51–56. [Google Scholar] [CrossRef]
- Demirbüken, İ.; Özgül, B.; Timurtaş, E.; Yurdalan, S.U.; Çekin, M.D.; Polat, M.G. Gender and age impact on plantar pressure distribution in early adolescence. Acta Orthop. Traumatol. Turc. 2019, 53, 215–220. [Google Scholar] [CrossRef]
- McKay, M.J.; Baldwin, J.N.; Ferreira, P.; Simic, M.; Burns, J.; Vanicek, N.; Wojciechowski, E.; Mudge, A.; Burns, J.; For the 1000 Norms Project Consortium. Spatiotemporal and plantar pressure patterns of 1000 healthy individuals aged 3–101 years. Gait Posture 2017, 58, 78–87. [Google Scholar] [CrossRef]
- Miguel Andrés, I.; Rivera Cisneros, A.E.; Mayagoitia Vázquez, J.J.; Orozco Villaseñor, S.L.; Rosas Flores, A. Índice de pie plano y zonas de mayor prevalencia de alteraciones músculo-esqueléticas en jóvenes deportistas. Fisioterapia 2020, 42, 17–23. [Google Scholar] [CrossRef]
- Chang, C.H.; Chen, Y.C.; Yang, W.T.; Ho, P.C.; Hwang, A.W.; Chen, C.H.; Chang, J.H.; Chang, L.W. Flatfoot diagnosis by a unique bimodal distribution of footprint index in children. PLoS ONE 2014, 9, e115808. [Google Scholar] [CrossRef]
- Onodera, A.N.; Sacco, I.C.N.; Morioka, E.H.; Souza, P.S.; Sá MRde Amadio, A.C. What is the best method for child longitudinal plantar arch assessment and when does arch maturation occur? Foot 2008, 18, 142–149. [Google Scholar] [CrossRef]
- Ramos-Frutos, J.A.; Miguel-Andrés, I.; León-Rodríguez, M.; Ortiz-Lango, L.A.; Orozco-Villaseñor, S.L.; Vidal-Lesso, A. Type of feet in a Mexican population: Analysis of the footprint morphology and literature review. Rev. Mex. Ing. Bioméd. 2023, 44, 6–15. [Google Scholar] [CrossRef]
- Miguel Andrés, I.; Pons Portugal, M.; Mayagoitia Vázquez, J.D.J.; Carrum Siller, E.G.; Pérez Rodríguez, M.E. Assessment of flatfoot index and prevalence of musculoskeletal disorders of the foot in young athletes: Swimming, rowing and weightlifting. Eur. J. Pod. 2020, 6, 58–63. [Google Scholar] [CrossRef]
- Filho, R.G.T.; Rodrigues, T.C.P.; Brant, A.C.; Rodrigues, N.L.M.; Mazuquim, B.F.; Richard, J. Classification of foot type from podography: Correlation of results between six quantitative assessment methods. J. Foot Ankle 2023, 17, 29–33. [Google Scholar] [CrossRef]
- Schroeder, L.D.; Sjoquist, D.L.; Stephan, P.E. Understanding Regression Analysis: An Introductory Guide; SAGE Publications: Thousand Oaks, CA, USA, 2016. [Google Scholar]
- Montgomery, D.C.; Peck, E.A.; Vining, G.G. Introduction to Linear Regression Analysis; John Wiley & Sons: Hoboken, NJ, USA, 2021. [Google Scholar]
- Scott, G.; Menz, H.B.; Newcombe, L. Age-related differences in foot structure and function. Gait Posture 2007, 26, 68–75. [Google Scholar] [CrossRef] [PubMed]
- Hessert, M.J.; Vyas, M.; Leach, J.; Hu, K.; Lipsitz, L.A.; Novak, V. Foot pressure distribution during walking in young and old adults. BMC Geriatr. 2005, 5, 8. [Google Scholar] [CrossRef]
- Mickle, K.J.; Munro, B.J.; Lord, S.R.; Menz, H.B.; Steele, J.R. Gait, balance and plantar pressures in older people with toe deformities. Gait Posture 2011, 34, 347–351. [Google Scholar] [CrossRef] [PubMed]
- Pomarino, D.; Pomarino, A. Plantar static pressure distribution in healthy individuals: Percentiles for the evaluation of forefoot loading. Foot Ankle Spec. 2014, 7, 293–297. [Google Scholar] [CrossRef]
- Cieślińska-Świder, J.M.; Błaszczyk, J.W. Posturographic characteristics of the standing posture and the effects of the treatment of obesity on obese young women. PLoS ONE 2019, 14, e0220962. [Google Scholar] [CrossRef]
- Phethean, J.; Nester, C. The influence of body weight, body mass index and gender on plantar pressures: Results of a cross-sectional study of healthy children’s feet. Gait Posture 2012, 36, 287–290. [Google Scholar] [CrossRef]
- Syed, N.; Karvannan, H.; Maiya, A.G.; Binukumar, B.; Prem, V.; Chakravarty, R.D. Plantar pressure distribution among asymptomatic individuals: A cross-sectional study. Foot Ankle Spec. 2012, 5, 102–106. [Google Scholar] [CrossRef] [PubMed]
- Jonely, H.; Brismée, J.M.; Sizer, P.S.; James, C.R. Relationships between clinical measures of static foot posture and plantar pressure during static standing and walking. Clin. Biomech. 2011, 26, 873–879. [Google Scholar] [CrossRef] [PubMed]


Disclaimer/Publisher’s Note: The statements, opinions and data contained in all publications are solely those of the individual author(s) and contributor(s) and not of MDPI and/or the editor(s). MDPI and/or the editor(s) disclaim responsibility for any injury to people or property resulting from any ideas, methods, instructions or products referred to in the content. |
© 2025 by the authors. Licensee MDPI, Basel, Switzerland. This article is an open access article distributed under the terms and conditions of the Creative Commons Attribution (CC BY) license (https://creativecommons.org/licenses/by/4.0/).