Abstract
Background: The positive effects of prolonged every-other-day (EOD) feeding include decreased body weight and prolonged life span, but also changes in liver metabolism and functions. In the present paper, our aim was to examine the expression of adiponectin (ADIPOQ), leptin, and their receptors (ADIPOR1, ADIPOR2, and LEPR) in the liver tissue of EOD-fed mice in comparison to ad libitum (AL)-treated mice. Methods: After 9 months of EOD treatment, liver tissue was harvested and prepared for analysis. RT-PCR, protein semi-quantitative estimation, and cellular immunolocalization was performed. Results: We noted a decreased expression of leptin in the liver tissue of the EOD male mice in comparison to the AL mice on the protein level. ADIPOQ receptor R1 protein expression was decreased in the liver of EOD-fed male mice, while the expression of ADIPOR2 on the protein level was increased in the EOD animals. Conclusions: To the best of our knowledge, this is the first report showing ADIPOQ and leptin immunolocalization in the liver tissue in a dietary regime experiment. Decreases in leptin expression and IL-6 expression in liver tissue and increases in ADIPOR2 expression may be partly responsible for the beneficial effects of EOD treatment in the liver, including the decrease in inflammation. Further studies are needed to establish whether these changes depend on factors like the type of treatment, species, strain, gender, time of treatment, and others.
1. Introduction
Every-other-day (EOD) feeding is a lifestyle modification that results in increased life spans in animal models [1,2]. It is a form of dietary modification, where feeding days are separated by fasting days, without calorie intake reduction during feeding days. Although EOD feeding is often perceived as a form of caloric restriction (CR), there is no net calorie decrease over longer periods of time [1]. The effects of EOD feeding are similar to the effects of CR, including decreased body weight and body temperature, decreased metabolic rate, a decreased rate of tumorigenesis, decreased fasting glucose and insulin levels, increased resistance to tumor induction, toxic insults, and oxidative stress, and, more importantly, prolonged life span [1,3,4]. In experiments comparing CR, time-restricted feeding, the Daniel Fast (vegan or non-processed food diet plan), and alternate-day fasting (ADF = EOD), the Daniel Fast and EOD feeding were the most beneficial for glucose tolerance and insulin sensitivity [5]. The EOD feeding caused a reduction in body mass, decreased fat mass, and improved hepatic triglyceride (Tg) levels, even in a model with a high-fat diet (HFD), when fasting days were separated by HFD days [6].
We have already presented some changes in the liver and other tissues found in a long experiment with an EOD feeding regime. In our previous papers concerning prolonged EOD treatment in C56Bl/6 young mice, we noted sex-dependent changes in proliferation and apoptosis marker expression, as well as morphological changes in the liver parenchyma after EOD feeding in female and male mice. We concluded that EOD feeding caused a switch from cellular turn-over to cellular maintenance [7]. Decreased lipid contents in the hepatocytes of EOD-treated mice were shown in comparison to ad libitum (AL)-fed mice [7].
The liver is a crucial organ for the maintenance of whole-body homeostasis: a variety of metabolic functions are performed or controlled by the liver tissue. An overload of energetic substrates, which cannot be stored in adipose tissue, causes lipid accumulation and generates steatosis, which leads to oxidative stress and inflammation in hepatocytes [8,9]. The presence of large lipid droplets in hepatocytes, i.e., in non-alcoholic fatty liver disease (NAFLD) or obesity, may lead to the development of liver fibrosis and eventually liver cancer [10]. There is a relationship between changes in fat tissue mass and circulating plasma levels and local levels of ADIPOQ when various forms of CR are implemented [11,12,13]. ADIPOQ and leptin are found to influence the liver physiology [9,14]. Adiponectin reduces gluconeogenesis and glycogenolysis and increases glycolysis and fatty acid oxidation [14]. Additionally, adiponectin decreases the production of proinflammatory cytokines and enhances the production of IL-10 (an anti-inflammatory cytokine) in liver tissue [9]. In liver tissue, leptin may cause pyroptotic-like cell death of hepatocytes and may lead to the development of fibrosis [9]. There are multiple links between adipokine levels and liver steatosis after CR in both animals and humans [15,16].
It is already known that CR has positive effects on the liver, as it decreases liver steatosis [17,18]. In the case of EOD feeding, data concerning its influence on liver steatosis and adipokine status are limited and published observations concerning patients treated with EOD feeding regimes are contradictory [9]. In the present paper, our aim was to examine the adipokines adiponectin (ADIPOQ) and leptin alongside their receptors (ADIPOR1, ADIPOR2, and LEPR) in EOD-treated liver tissue in comparison to that of AL-treated mice. We have chosen male mice in this part of our research as we have previously observed differences in lipid content in the liver between fasted (EOD-fed) and control group mice [7].
2. Results
2.1. General Morphology of the Liver Tissue
In this experiment, we observed significant weight loss in males after EOD feeding (AL males: 41.79 ± 4.96 g; EOD males: 29.67 ± 2.54 g) and an insignificant decrease in liver weight in the EOD males (1.42± g vs. 1.74 g ±—EOD vs. AL); the liver/body weight ratio remained unchanged (EOD vs. AL, 4.78% vs. 4.16%). During the 9 months of treatment, all animals increased their body weight. This weight gain was significantly lower in the animals fed the EOD diet (45% vs. 21%, AL vs. EOD). Cumulative food intake per animal during the experiment was greater in the AL animals than the EOD animals (AL males 949.65 ± 8.27 g vs. EOD males 698.26 ± 4.94 g, per animal) [7]. Immunohistochemical analysis of the liver sections confirmed our previous observations concerning higher lipid contents in the hepatocytes of AL-fed mice [7]. Negative control slides (Figure 1) showed enlarged, ballooning hepatocytes with enlarged or double nuclei (highlighted with black arrows), and with clumped cytoplasm and optically clear areas in the AL group (highlighted with a red arrow), which are considered to be a feature of non-alcoholic steatohepatitis (NASH) [19]. Sinusoids were pointed out with yellow arrows. No signs of massive inflammation or necrosis were noted (Figure 1).
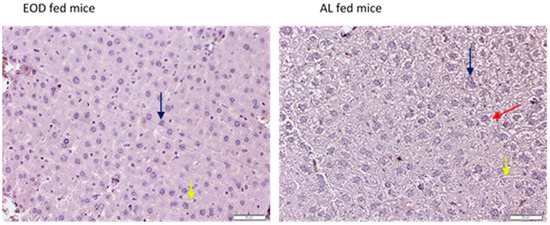
Figure 1.
IHC negative control images of liver tissue. Black arrows—nuclei of hepatocytes; red arrow—lipid deposit; yellow arrows—sinusoid. Magnification ×20, scale bar = 50 µm.
2.2. Expression of Adipokines and Their Receptors in the Liver Tissue
2.2.1. Expression of ADIPOQ and Receptors in Liver Tissue
In the livers of the EOD-fed animals, we noted the unchanged expression of ADIPOQ on the mRNA level (Figure 2A). Similarly, for ADIPOR1 and ADIPOR2, we observed no change in mRNA expression after EOD treatment (Figure 2B,C).
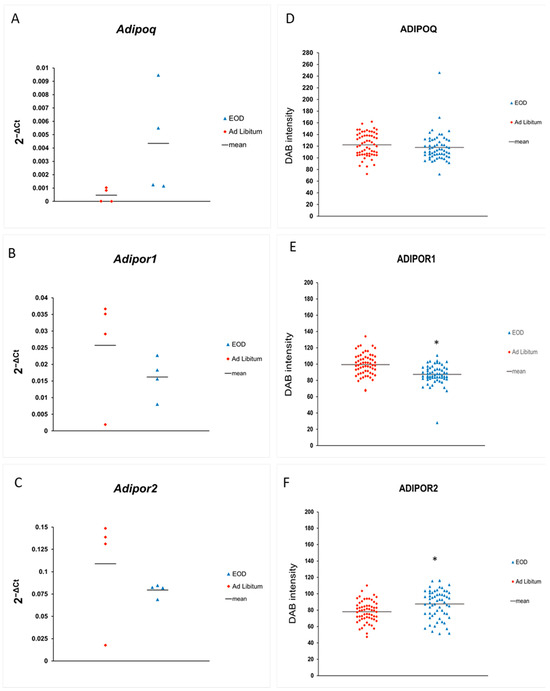
Figure 2.
(A–C): Absolute expression of mRNA for ADIPOQ, ADIPOR1, and ADIPOR2 in livers; (D–F): semi-quantitative estimation of proteins, measured as the intensity of DAB staining on IHC slides. * p < 0.05.
Immunoexpression of ADIPOQ was unchanged when measured with DAB staining on IHC slides (Figure 2D, Table 1). Immunolocalization of ADIPOQ on the IHC liver slides was evaluated as moderate in the hepatocytes—highlighted with asterisks—and strong in the sinusoids (blue arrows) and Kupffer cells (KCs; liver sinuses macrophages—red arrow) of the EOD mice, in comparison to this reaction being positive in the hepatocytes, moderate in the blood vessels, and strong in the KCs of the AL mice (Figure 3A,B).

Table 1.
Semi-quantitative protein expression measured as DAB intensity: mean ± standard error (SE) values. * p < 0.05.
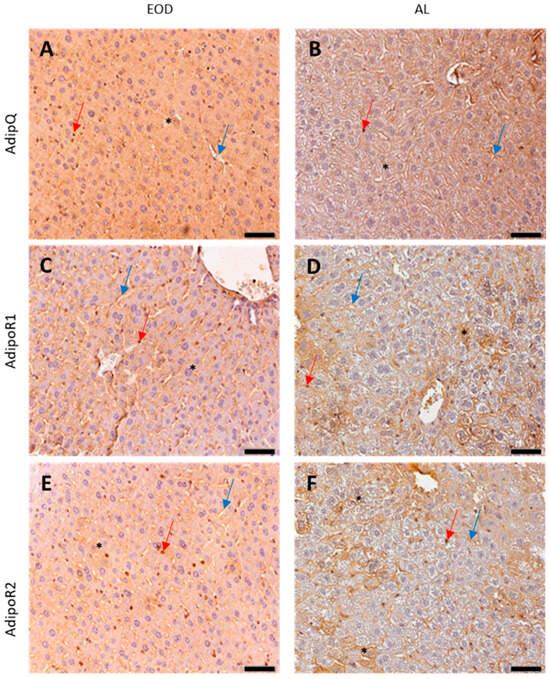
Figure 3.
Expression of ADIPOQ and ADIPOR1 and ADIPOR2—immunohistochemical staining of liver samples. EOD—every other day; AL—ad libitum; (A,B)—ADIPOQ; (C,D)—ADIPOR1; (E,F)—ADIPOR2. Original objective magnification ×20; scale bar 50 µm; only representative images are presented. Red arrows—KCs; blue arrows—blood vessels; black asterisks—hepatocytes.
Protein expression of ADIPOR1 was significantly lower in the EOD group when measured as DAB intensity in the semi-quantitative protein expression method (Figure 2E, Table 1). Immunolocalization of the ADIPOR1 receptor revealed that the expression was very weak in the hepatocytes of EOD mice, but moderate in their blood vessels and KCs, while ADIPOR1 was detected at a moderate level in vessels and KCs in the AL livers and was weak or moderate in the AL hepatocytes (Figure 3C,D).
ADIPOR2 expression at the protein level was estimated to be strong in all types of cells in both groups, and semi-quantitative analysis of DAB intensity on the IHC slides revealed a statistically higher intensity of the DAB signal on the slides of the EOD livers (Figure 2F, Table 1). In the hepatocytes of the AL animals, ADIPOR1 and ADIPOR2 showed non-equal expressions, with a moderate or strong expression in some hepatocytes and a weak or no expression in others (Figure 3E,F).
2.2.2. Leptin Expression in Liver Tissue
Leptin expression was unchanged in EOD animals at the mRNA level in comparison to AL mice (Figure 4). Lepr expression was significantly increased at the mRNA level when measured with RQ-PCR (Figure 4B).
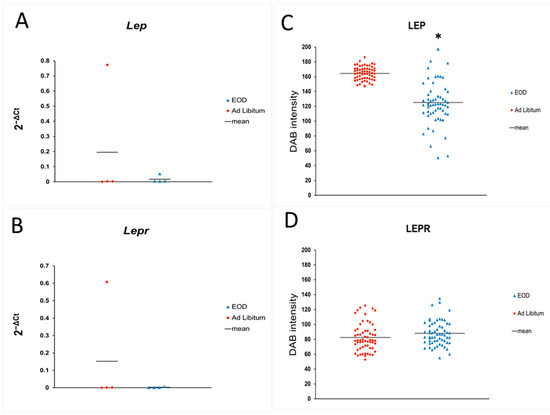
Figure 4.
(A,B): Absolute expressions of mRNA for leptin and LEPR in livers; (C,D): semi-quantitative estimation of proteins, measured as the intensity of DAB staining on IHC slides. * p < 0.05.
Our semi-quantitative estimation of leptin showed a significant decrease in leptin protein expression (Figure 4C). Immunolocalization analysis of leptin on IHC slides of liver tissue showed positive to moderate leptin expression in the hepatocytes, blood vessel walls, and KCs of both studied groups of animals (Figure 5A,B). Analysis of IHC staining of the liver slides of AL-fed mice revealed a non-equal expression of leptin (positive to moderate) in the hepatocytes (Figure 5B).

Figure 5.
Expression of leptin and its receptor (LEPR)—immunohistochemical staining of liver samples (n = 6 for each group). EOD—every other day; AL—ad libitum; (A,B)—leptin; (C,D)—LEPR; (E,F)—neg contr.—negative control slides (primary antibody was replaced with PBS). Original objective magnification ×20; scale bar 50 µm; only representative images are presented. Red arrows—KCs; blue arrows—blood vessels; black asterisks—hepatocytes.
Semi-quantitative LEPR protein estimation on IHC slides showed no change in protein expression (Figure 4D, Table 1). Cellular localization of LEPR protein expression revealed a moderate expression in KCs in both groups of animals—highlighted with red arrows; hepatocytes of the EOD mice showed moderate to strong positive reactions in comparison to the weak or positive reactions in the AL hepatocytes (non-equal distribution of proteins in EOD group—black asterisk). The expression of LEPR protein was moderate in blood vessels of EOD livers and positive to moderate in the AL animals (Figure 5C,D).
2.3. IL-6 Expression in the Liver
To demonstrate functional alterations after the change in leptin expression, IHC analyses of inflammatory marker IL-6 were performed, as leptin influences the secretion of inflammatory cytokines [20]. The expression of IL-6 was decreased in EOD livers in comparison to AL mice, when measured as DAB intensity (Figure 6E). The expression of IL-6 was present in the hepatocytes, KCs, and blood vessel walls and estimated to be strong in the livers of AL mice, and was moderate in the hepatocytes and blood vessels and strong in the KCs of EOD mice (Figure 6A,B).
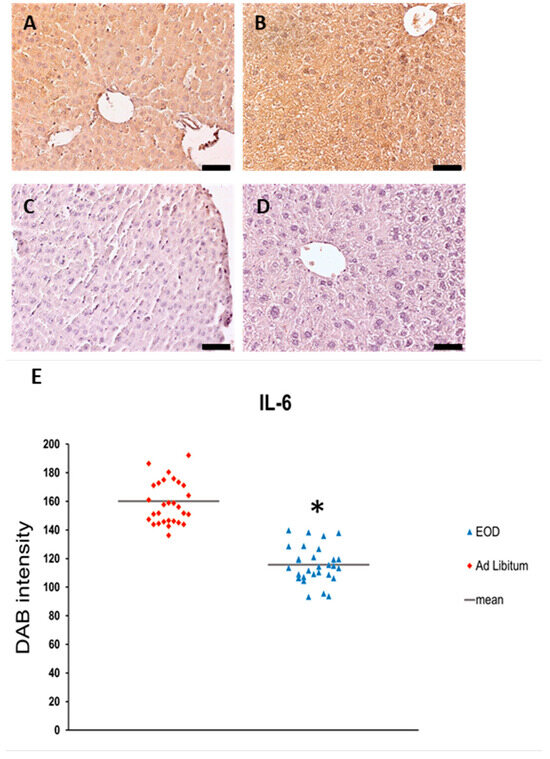
Figure 6.
Expression of IL-6 immunohistochemical staining of liver samples (n = 6 for each group). EOD—every other day; AL—ad libitum; (A,B)—IL-6 expression; (C,D)—neg contr.—negative control slides (primary antibody was replaced with PBS). Original objective magnification ×20; scale bar 50 µm; only representative images are presented. (E)—Semi-quantitative estimation of IL-6 protein expression. * p < 0.05.
3. Discussion
In dietary restrictions, decreases in body weight, reduced inflammation, carcinogenesis, and the prolongation of life span are often observed, although these results vary, depending on the type of restriction used, sex, age, and species, and also on the examined tissue. In EOD feeding, which implies complete food deprivation every other day, the prolonged-treatment calorie intake is similar to that of AL feeding, with beneficial effects on body mass, life span, and inflammatory status being visible. This may lead to the conclusion that it is not a simple effect of improved energy balance [1]. It was previously shown in wild-type (WT) and mutant mice that EOD feeding decreases the metabolic rate and mitochondrial complexes I and III in two-month-long EOD feeding experiments [3,21].
Our own experiments with prolonged (9 months) EOD feeding in young C57Bl/6 mice revealed decreased body weights in males, decreased liver weight, and unchanged liver/body weight ratio [7]. The ballooning hepatocytes with optically clear, non-vesiculated areas in the clumped cytoplasm found in our study are a key feature of NASH recognition [19]. In the present study, the expression of adipokines in the murine liver tissue after prolonged EOD treatment is presented. We observed a decreased expression of leptin in the liver tissue of EOD-treated male mice in comparison to AL-treated mice. ADIPOR1 expression was decreased in the livers of the EOD group, while the expression of ADIPOR2 was increased in the EOD animals.
There are two methods used to estimate protein expression in tissue: Western blot (WB) and immunohistochemistry (IHC). Both of these methods are semi-quantitative. Both WB and IHC are based on the recognition and binding of a primary antibody to the target protein, and further detection of the protein–antibody complex with a secondary antibody and visualization. The difference between these methods lies in the material preparation. In WB, whole-tissue homogenates are used, and in IHC, histopathological slides are used. In this study, we have chosen the IHC method to estimate not only adipokine and receptor protein expressions, but also to show the cellular localization of proteins in liver tissue. We have shown that adipokines and receptors were expressed in hepatocytes, KCs, and blood vessels.
Adiponectin belongs to the complement (C1q) tumor necrosis factor superfamily and is mainly synthesized in white adipose tissue (WAT) [14]. Its circulating level is correlated with body fat and is significantly increased in various treatment regimens where fat mass is lost due to dietary restrictions, in humans and in animal models [4,11,12,13,15,16]. Circulating ADIPOQ causes a reduction in glyconeogenesis and glycogen lysis, thus inhibiting liver glucose production, which further decreases insulin release and inhibits insulin overproduction by β-cells [14,22]. In hepatocytes, ADIPOQ lowers the lipid content, including ceramides, which leads to tumor suppression in liver tissue [22]. There are data suggesting the expression of adiponectin in tissues other than adipose tissue: bone marrow, skeletal muscle, synovial membranes, cardiomyocytes, and salivary gland epithelium [8,23,24,25]. Local ADIPOQ production’s involvement in the regulation and metabolism of cardiomyocytes has been postulated [24]. ADIPOQ has also been found in human milk [26]. To the best of our knowledge, this is the first report showing ADIPOQ cellular immunolocalization in liver tissues in a dietary regime experiment. The expression of hepatic mRNA for ADIPOQ was unchanged in the EOD group, but we noted unchanged protein expression in IHC images. Immunolocalization analyses of IHC slides revealed that, after prolonged EOD feeding, ADIPOQ expression was noted in hepatocytes, endothelium, and KCs, while the expression of ADIPOQ in hepatocytes was very weak or absent in AL-fed mice. Ballooning was marked in the AL group, where ADIPOQ expression in the liver tissue was lower. This has also been found for human patients with simple steatosis and non-alcoholic steatohepatitis (NASH) [15]. The expression of ADIPOQ in the walls of liver vessels and in macrophages has already been shown in biopsies of chronic hepatitis B (CHB) patients with negatively stained hepatocytes [27]. Hepatocytes are found to be a source of ADIPOQ in liver diseases, while hepatic stellate cells (HSCs) in the quiescent and activated state are described to express ADIPOQ at the mRNA and protein levels [28,29]. The increased expression of ADIPOR2 in liver tissue after EOD feeding may be one of the reasons for increased adiponectin action and increased tumorigenesis resistance, which has already been established for EOD feeding regimes in animal models, as it is known that ADIPOQ levels are negatively correlated with liver cancer risk, cardiovascular diseases, and the progression of Alzheimer’s disease [4,14].
ADIPOQ receptor2 (ADIPOR2) expression is already known to be liver-specific, but we also noted ADIPOR1 expression in hepatocytes, which is described as muscle-specific; however, it was also found in the liver tissue of humans and rodents [16,22,27,29]. ADIPOR1 with ADIPOR2 was previously described for HSCs in liver tissue [29]. The major physiological difference between these two types of receptors is their binding affinity to adiponectin and different signaling cascades: through AMP-activated kinase (AMPK) for ADIPOR1, and with the activation of peroxisome proliferator-activated receptor alpha (PPARα) for ADIPOR2 [22,30]. The expression of ADIPOR1 is mainly found in the endothelium and KCs, but there is also some weak expression in hepatocytes. ADIPOR1 expression at the mRNA level in the liver has been detected in liver biopsies of CHB patients and tended to be higher in patients without steatosis [27]. These authors found the immunolocalization of ADIPOR2 on liver slides of the patients, but did not do the same for ADIPOR1, so it was impossible to establish the cellular localization of ADIPOR1 in liver tissue in this study [27]. In their study, ADIPOR2 was found in the hepatocyte cytoplasm and endothelial cells of liver vessels [27]. This is consistent with our current results. Moreover, a decrease in ADIPOR1 and ADIPOR2 expression in steatohepatitis caused by a high-fat diet (HFD) was established for C57Bl/6 mice [16]. After CR, the hepatic levels of both ADIPORs increased and correlated with decreased levels of inflammatory cytokines [16]. The hepatic expression of ADIPOR2 was also decreased in patients with NASH in comparison to simple steatosis patients [15]. ADIPOR1 and ADIPOR2 expressed in the liver have been implicated as mediators useful in treating hepatic steatosis [16]. Insignificant changes in the expression of ADIPORs in adipose tissue (AT) were observed in rats after CR, although the level of AT ADIPOQ was increased [12]. In our study, we found a significant increase in ADIPOR2 and a significant decrease in ADIPOR1 expression at the protein level, while the expression of mRNAs for these receptors was unchanged in the EOD group’s livers. The discrepancies in semi-quantitative expressions of the ADIPOR1 and ADIPOR2 may be a result of unequal protein expression between hepatocytes in the sample—we observed that on a single specimen, some hepatocytes were moderate or strongly positive, while other were weakly positive or negative. The differences between mRNA and protein levels for the studied proteins may be a result of changes in the regulation of transcription and post-transcriptional and post-translation modification levels, which have already been described for CR in Rhesus monkeys [31].
Leptin is known as a satiety hormone with pleiotropic effects, affecting, among others, liver tissue biology [9]. One of its roles is the inhibition of ectopic lipid accumulation via the stimulation of fatty acid oxidation in the liver [32,33]. In the liver, leptin acts directly through OB-R(LEPR), but also indirectly through the central nervous system (CNS)—via the liver axis [33]. Dietary modifications reveal changes in leptin levels and leptin resistance in human and animal models [32]. After EOD treatment, the expression of leptin was unchanged in mRNA and was decreased at the protein level in liver tissue. Our cellular immunolocalization analysis revealed the presence of moderate positive reactions for leptin in the hepatocytes of EOD-fed mice in comparison to positive to moderate expressions in the hepatocytes of AL-fed mice. In the blood vessels and KCs, expression was similar (positive to moderate) in both groups of animals. An increase in leptin expression has been noted in liver tissue regarding the fibrosis state in rats with induced fibrosis and in their serum after CR with IGF-1 infusion [11,34]. There are data concerning sources of leptin other than adipose tissue in normal conditions, i.e., skeletal muscle, placenta, the stomach, and the pituitary gland [35]. The reason for the appearance of leptin expression in hepatocytes after toxic insult (fibrosis induction) or dietary manipulation is still unknown. It is known that leptin promotes NASH and liver fibrosis, as steatohepatitis develops due to low-grade inflammation and hepatocyte apoptosis [36]. We also observed higher leptin levels in AL-fed animals, with ballooning hepatocytes, which are considered a hepatocyte injury found in NASH [19]. As leptin contributes in low-grade inflammation [35] and causes the production of proinflammatory cytokines in immunocompetent cells [20], we performed an analysis of inflammatory marker Il-6. We revealed a higher expression of IL-6 in the livers of the AL mice in comparison to the EOD animals. This may be a result of leptin action, as there are reports showing increase in IL-6 expression in non-inflammatory cells, i.e., cultures of primary osteoarthritis synovial fibroblasts, after leptin stimulation [37]. Leptin can also increase cellular proliferation and decrease Bax expression, but we did not see these effects in EOD-treated males in our experiments [7]. Thus, it is possible that this could be a result of the noted decreased local leptin expression. It may also be related to the enhanced expression of LEPR, which was found in the livers of EOD-fed mice in comparison to AL-fed animals. While expression in the hepatocytes of the AL animals was very weak to positive, the hepatocytes of the EOD-fed mice showed moderate to strong expression of LEPR. The strong increase in LEPR immunolocalization in hepatocytes and lack of significant change in the overall LEPR expression may be explained by characteristics of the method used for semi-quantitative protein estimation: the DAB signal intensity was detected over an entire field of view (micrograph), not in particular cells pointed out as regions of interest (ROIs). An increase in LEPR after leptin treatment and a short fasting period has already been observed in C57Bl/6 mice [38]. The increased expression of LEPR while local leptin expression is lower may improve leptin action in the liver and cause a lack of steatosis and the NASH symptoms observed in the EOD livers, as we have already shown weight loss and decreased cumulative food intake in EOD-fed males, and because leptin prevents lipid accumulation in the liver [7,33].
Adipose tissue is a major source of ADIPOQ and leptin, but there are reports showing other local sources of these adipokines, like synovial membranes in inflammatory disorders such as rheumatoid arthritis (RA) and osteoarthritis (OA), induced liver fibrosis, or pregnancy [23,34,39]. There are also reports showing changes in the expression of adipokines and their receptors in plasma, adipose tissue, and tumors after CR regimes [4,11,12,13,15,38]. In our study, we showed that Kupffer cells are also local sources of adiponectin and leptin and show the expression of receptors for these adipokines. This is consistent with other studies showing that leptin receptor presence in KCs is responsible for KC production of TNF-α [40] and activated by leptin KC participates in the development of liver fibrosis [41]. Adiponectin acts via ADIPORs in LPS-activated KCs and decreases production of TNF-α [42]. Our study is the first to show changes in ADIPOQ and leptin expression in the hepatocytes of the liver after dietary treatment. Further studies are needed to establish whether these changes depend on factors like the type of treatment, species, strain, gender, and time of treatment, among others.
The main limitation of this study is the number of animals used for treatment in the feeding regime: only six individuals were studied per group. This reflects the EU policy of reducing the number of individuals used in animal studies (the 3R rule: reduction, refine, replacement). Despite this fact, important changes were observed in mice liver physiology and further studies are required to explore the importance of adipokine expression in liver tissue.
Nutrition and various dietary interventions not only play roles in the pathophysiology of metabolic diseases, but also may be a powerful tool in the management of metabolic patients, including NAFLD patients [43]. Personalized diet plans based on various forms of IF, including EOD feeding/ADF, may become important as a supplementary form of treatment for metabolic patients.
4. Materials and Methods
4.1. Animals
Eight-week-old C57Bl/6 male mice were employed in our experiments (purchased from Charles River Laboratories). The mice were randomly divided into two groups (6 animals/group) and were housed under controlled conditions of optimum temperature (21 °C), ventilation, and light timed to follow a circadian rhythm (12:12 h). All animals had free access to tap water. One group of mice was fed a commercial diet for the maintenance of adult rodents—Labofeed H (containing net energy 12.8 MJ/kg in proportion: 60% carbohydrates, 30% proteins, 10% fat) (Morawski, Poland)) ad libitum (AL), while the other half of the animals were deprived of food and fed AL only every other day (EOD) [3]. Body weight was measured weekly starting on day 0 until the end of the study (9 months total). All recruited animals remained in the experiment until the end of the feeding regime. To avoid short fast influence on biochemical and metabolic parameters, mice were sacrificed after the final feeding night for the EOD-fed mice. During necropsy, their livers were isolated, weighed, and prepared for further analyses. Liver tissue from each group of animals was prepared for both mRNA and protein analyses. All animal protocols were approved by the Local Ethics Committee (Local Ethical Committee in Szczecin, approval no. 27/2012, date of approval 17 October 2012). The number of animals that participated in the study was adopted according to the requirements of DIRECTIVE 2010/63/EU of the European Parliament and of the Council of 22 September 2010 on the protection of animals used for scientific purposes (3R rule: reduction, refine, replacement).
4.2. Tissue Preparation
Livers for histological and immunohistochemical analyses (n = 6 EOD and n = 6 AL) were fixed in 10% buffered formalin for 24 h. After fixation, samples were dehydrated and embedded in paraffin blocks. For RQ-PCR, livers (n = 6 EOD and n = 6 AL) were immediately frozen in liquid nitrogen.
4.3. Immunohistochemical Staining of Liver Samples
Deparaffinized sections of the livers (3 μm thick) were hydrated and heat epitope retrieval was performed in a microwave oven in retrieval solution buffer pH = 6 (DAKO retrieval solution, Dako, Denmark). After cooling to room temperature (RT), the slides were incubated with primary antibodies and visualized with the ImmPRESS® HRP Universal (horse anti-mouse/rabbit IgG) PLUS Polymer Kit, Peroxidase and ImmPRESS® HRP (goat anti-rat) Kit, Peroxidase (Vector Laboratories, Nevark, CA, USA). Briefly, the first specimens were incubated with BLOXALL Endogenous Enzyme-Blocking Solution for the blocking of endogenous peroxidase, washed twice with PBS, and further incubated with 2.5% normal horse serum and 2.5% goat serum for the IL-6 antibody. Then, slides were incubated with the primary antibodies shown in Table 2 for 1 h at RT or overnight at 4 ℃, according to the manufacturers’ instructions for each antibody. After double-washing in PBS, slides were incubated with the ImmPRESS Universal Antibody Polymer Reagent for anti-mouse/rabbit and anti-rat primary antibodies. After washing in PBS, the reactions were visualized with ImmPACT DAB EqV Substrate. After visualization, slides were counterstained with hematoxylin (Harris modified hematoxylin, Sigma, Merck, Darmstadt, Germany) and mounted in Histokitt (CarlRoth, GmbH, Karlsruhe, Germany).
Table 2.
Antibodies used for IHC staining.
For the negative control, the primary antibody was replaced with PBS on the specimen.
4.3.1. Immunolocalization of Adipokines and Receptors on IHC-Stained Liver Slides
Positive staining was defined by the visual identification of yellow/brown pigmentation in the light microscope. Ten random fields of view were estimated for each animal in every group. Staining intensity was estimated in two separate analyses by two researchers (KP and KZ); further results were discussed and presented in a table as unified values. Results of staining intensity in the immunolocalization analyses were described as follows: negative, weakly positive, positive, moderate positive, and strong positive reaction. Images were collected with an Olympus IX81 inverted microscope (Olympus, Germany) with a color camera and the CellSens image-processing software (CellSens Standard 1.5, Olympus, Germany).
4.3.2. ImageJ Semi-Quantitative Estimation of Protein Expression on IHC Images
IHC-stained sections of the AL and EOD livers were analyzed with the use of the ImageJ Fiji software (Johannes Schindelin, Albert Cardona, Mark Longair, Benjamin Schmid, and others; https://imagej.net/software/fiji/downloads, version 1.2, accessed on 16 January 2023) using a published protocol [44]. Briefly, after color deconvolution was performed, to separate hematoxylin and the DAB channel, a threshold was selected and the minimum threshold value was set at zero. The maximum threshold value was adjusted so that the background signal was removed without removing the DAB signal. The intensity of staining was measured on 10 fields of view for each section (n = 6) under ×40 magnification for both AL and EOD samples. The intensity of expression was presented as the intensity of DAB staining on an image with a scale of 0–255.
4.4. Real-Time Quantitative Reverse-Transcription PCR (RQ-PCR)
Total RNA was isolated from liver samples of the experimental (EOD) and control (AL) mice with the RNeasy Kit. RNA (Qiagen, Venlo, Nederlands) was reverse-transcribed with a First-Strand cDNA Synthesis Kit (Thermo Scientific, Waltham, MA, USA). From the total n = 6 samples, after quality control, n = 4 samples were used in further analyses. Quantitative assessment of mRNA levels was performed by real-time reverse-transcriptase polymerase chain reaction (RT-PCR) on an ABI 7500 Fast instrument using Power SYBR Green PCR Master Mix reagent (Applied Biosystems, USA). The real-time conditions were as follows: 95 °C (15 s), 40 cycles at 95 °C (15 s), and 60 °C (1 min). According to melting point analysis, only one PCR product was amplified under these conditions. The relative quantification value of the target (the fold change), normalized to the endogenous control β-2 microglobulin gene and relative to a calibrator, is expressed as 2∆∆Ct, where ∆Ct = (Ct of target genes)—(Ct of endogenous control gene, β-2 microglobulin), and ∆∆Ct = (∆Ct of sample for target gene)—(∆Ct of calibrator for the target gene). The sequences of the primers used are as follows: adiponectin: F: TGTTCCTCTTAATCCTGCCCA; R: CCAACCTGCACAAGTTCCCTT; leptin: F: GTGGCTTTGGTCCTATCTGTC; R: CGTGTGTGAAATGTCATTGATCC; ADIPOR1: F: AATGGGGCTCCTTCTGGTAAC; R: GGATGACTCTCCAACGTCCCT; ADIPOR2: F: GCCAAACACCGATTGGGGT; R: GGCTCCAAATCTCCTTGGTAGTT; LEPR: F: ACCTGGCATATCCAATCTCTCC; R: TTCAAAGCCGAGGCATTGTTT.
4.5. Statistical Analysis
The data in Table 1 are presented as mean ± standard error (SE). The distribution of results for individual variables was obtained with the Shapiro–Wilk W test. As most of the distributions deviated from the normal distribution, non-parametric tests were used for further analyses. To assess the differences between the studied groups, the non-parametric Mann–Whitney U-test was used, and p ≤ 0.05 was considered as statistically significant. Statistical analysis was performed using STATISTICA PL ver. 13.1 software (StatSoft, Inc., Tulsa, OK, USA, 2016, STATISTICA data analysis software system).
5. Conclusions
After EOD treatment, lower levels of leptin, ADIPOR1, and IL-6 and higher levels of the ADIPOR2 receptor were noted in the liver tissues of male C57Bl/6 mice. Cellular immunolocalization analyses revealed that expression of the studied adipokines also appeared in hepatocytes, and this is, to the best of our knowledge, the first report revealing hepatocyte expression of these adipokines after dietary modification. We assumed that the changed expressions of these proteins may play a role in the beneficial effects of an EOD feeding regime, including inflammation reduction. Further studies are needed to reveal the mechanisms of these changes.
Author Contributions
Conceptualization, K.P. and M.T.; methodology, K.P., M.T. and P.T.; software, K.P.; validation, K.P., M.T. and K.Z.; formal analysis, K.P., M.T., P.T. and M.C.; investigation, K.P. and M.T.; resources, K.P.; data curation, K.P. and M.T.; writing—original draft preparation, K.P.; writing—review and editing, K.P. and M.T.; visualization, K.P.; supervision, A.P.; project administration, K.P. and K.Z.; funding acquisition, A.P. All authors have read and agreed to the published version of the manuscript.
Funding
This research was funded by the statutory budget of the Department of Physiology (WMS-133/S/2016-2023), Pomeranian Medical University in Szczecin, Szczecin, Poland.
Institutional Review Board Statement
All animal protocols were approved by the Local Ethics Committee (Local Ethical Committee in Szczecin, approval no. 27/2012, date of approval 17 October 2012).
Informed Consent Statement
Not applicable.
Data Availability Statement
Raw data are available on reasonable request.
Conflicts of Interest
The authors declare no conflicts of interest.
References
- Anson, R.M.; Jones, B.; de Cabod, R. The diet restriction paradigm: A brief review of the effects of every-other-day feeding. Age 2005, 27, 17–25. [Google Scholar] [CrossRef] [PubMed]
- Xie, K.; Neff, F.; Markert, A.; Rozman, J.; Aguilar-Pimentel, J.A.; Amarie, O.V.; Becker, L.; Brommage, R.; Garrett, L.; Henzel, K.S.; et al. Every-other-day feeding extends lifespan but fails to delay many symptoms of aging in mice. Nat. Commun. 2017, 8, 155. [Google Scholar] [CrossRef]
- Westbrook, R.; Bonkowski, M.S.; Arum, O.; Strader, A.D.; Bartke, A. Metabolic alterations due to caloric restriction and every other day feeding in normal and growth hormone receptor knockout mice. J. Gerontol. A Biol. Sci. Med. Sci. 2014, 69, 25–33. [Google Scholar] [CrossRef] [PubMed]
- Rogozina, O.P.; Bonorden, M.J.; Seppanen, C.N.; Grande, J.P.; Cleary, M.P. Effect of chronic and intermittent calorie restriction on serum adiponectin and leptin and mammary tumorigenesis. Cancer Prev. Res. 2011, 4, 568–581. [Google Scholar] [CrossRef] [PubMed]
- Smith, N.J.; Caldwell, J.L.; van der Merwe, M.; Sharma, S.; Butawan, M.; Puppa, M.; Bloomer, R.J. A Comparison of Dietary and Caloric Restriction Models on Body Composition, Physical Performance, and Metabolic Health in Young Mice. Nutrients 2019, 11, 350. [Google Scholar] [CrossRef] [PubMed]
- Henderson, C.G.; Turner, D.L.; Swoap, S.J. Health Effects of Alternate Day Fasting Versus Pair-Fed Caloric Restriction in Diet-Induced Obese C57Bl/6J Male Mice. Front. Physiol. 2021, 12, 641532. [Google Scholar] [CrossRef] [PubMed]
- Piotrowska, K.; Tarnowski, M.; Zgutka, K.; Pawlik, A. Gender Differences in Response to Prolonged Every-Other-Day Feeding on the Proliferation and Apoptosis of Hepatocytes in Mice. Nutrients 2016, 8, 176. [Google Scholar] [CrossRef] [PubMed]
- Francisco, V.; Sanz, M.J.; Real, J.T.; Marques, P.; Capuozzo, M.; Ait Eldjoudi, D.; Gualillo, O. Adipokines in Non-Alcoholic Fatty Liver Disease: Are We on the Road toward New Biomarkers and Therapeutic Targets? Biology 2022, 11, 1237. [Google Scholar] [CrossRef]
- Ristic-Medic, D.; Bajerska, J.; Vucic, V. Crosstalk between dietary patterns, obesity and nonalcoholic fatty liver disease. World J. Gastroenterol. 2022, 28, 3314–3333. [Google Scholar] [CrossRef]
- Marchisello, S.; Di Pino, A.; Scicali, R.; Urbano, F.; Piro, S.; Purrello, F.; Rabuazzo, A.M. Pathophysiological, Molecular and Therapeutic Issues of Nonalcoholic Fatty Liver Disease: An Overview. Int. J. Mol. Sci. 2019, 20, 1948. [Google Scholar] [CrossRef]
- Yamaza, H.; Komatsu, T.; To, K.; Toyama, H.; Chiba, T.; Higami, Y.; Shimokawa, I. Involvement of insulin-like growth factor-1 in the effect of caloric restriction: Regulation of plasma adiponectin and leptin. J. Gerontol. A Biol. Sci. Med. Sci. 2007, 62, 27–33. [Google Scholar] [CrossRef]
- Ding, Q.; Ash, C.; Mracek, T.; Merry, B.; Bing, C. Caloric restriction increases adiponectin expression by adipose tissue and prevents the inhibitory effect of insulin on circulating adiponectin in rats. J. Nutr. Biochem. 2012, 23, 867–874. [Google Scholar] [CrossRef]
- Miller, K.N.; Burhans, M.S.; Clark, J.P.; Howell, P.R.; Polewski, M.A.; DeMuth, T.M.; Eliceiri, K.W.; Lindstrom, M.J.; Ntambi, J.M.; Anderson, R.M. Aging and caloric restriction impact adipose tissue, adiponectin, and circulating lipids. Aging Cell 2017, 16, 497–507. [Google Scholar] [CrossRef] [PubMed]
- Khoramipour, K.; Chamari, K.; Hekmatikar, A.A.; Ziyaiyan, A.; Taherkhani, S.; Elguindy, N.M.; Bragazzi, N.L. Adiponectin: Structure, Physiological Functions, Role in Diseases, and Effects of Nutrition. Nutrients 2021, 13, 1180. [Google Scholar] [CrossRef] [PubMed]
- Kaser, S.; Moschen, A.; Cayon, A.; Kaser, A.; Crespo, J.; Pons-Romero, F.; Ebenbichler, C.F.; Patsch, J.R.; Tilg, H. Adiponectin and its receptors in non-alcoholic steatohepatitis. GUT 2005, 54, 117–121. [Google Scholar] [CrossRef]
- Cho, J.; Koh, Y.; Han, J.; Kim, D.; Kim, T.; Kang, H. Adiponectin mediates the additive effects of combining daily exercise with caloric restriction for treatment of non-alcoholic fatty liver. Int. J. Obes. 2016, 40, 1760–1767. [Google Scholar] [CrossRef]
- Jové, M.; Naudí, A.; Ramírez-Núñez, O.; Portero-Otín, M.; Selman, C.; Withers, D.J.; Pamplona, R. Caloric restriction reveals a metabolomic and lipidomic signature in liver of male mice. Aging Cell 2014, 13, 828–837. [Google Scholar] [CrossRef] [PubMed]
- Kim, K.E.; Jung, Y.; Min, S.; Nam, M.; Heo, R.W.; Jeon, B.T.; Song, D.H.; Yi, C.O.; Jeong, E.A.; Kim, H.; et al. Caloric restriction of db/db mice reverts hepatic steatosis and body weight with divergent hepatic metabolism. Sci. Rep. 2016, 6, 30111. [Google Scholar] [CrossRef]
- Cabezas, J.; Mayorga, M.; Crespo, J. Nonalcoholic Fatty Liver Disease: A Pathological View. In Liver Biopsy—Indications, Procedures, Results; InTech: Berlin, Germany, 2012; Available online: https://www.intechopen.com/chapters/41027 (accessed on 2 October 2023).
- Kiernan, K.; MacIver, N.J. The Role of the Adipokine Leptin in Immune Cell Function in Health and Disease. Front. Immunol. 2021, 11, 622468. [Google Scholar] [CrossRef]
- Brown-Borg, H.M.; Rakoczy, S. Metabolic adaptations to short-term every-other-day feeding in long-living Ames dwarf mice. Exp. Gerontol. 2013, 48, 905–919. [Google Scholar] [CrossRef][Green Version]
- Combs, T.P.; Marliss, E.B. Adiponectin signaling in the liver. Rev. Endocr. Metab. Disord. 2014, 15, 137–147. [Google Scholar] [CrossRef]
- Łączna, M.; Kopytko, P.; Tkacz, M.; Zgutka, K.; Czerewaty, M.; Tarnowski, M.; Larysz, D.; Tkacz, R.; Kotrych, D.; Piotrowska, K.; et al. Adiponectin Is a Component of the Inflammatory Cascade in Rheumatoid Arthritis. J. Clin. Med. 2022, 11, 2740. [Google Scholar] [CrossRef] [PubMed]
- Piñeiro, R.; Iglesias, M.J.; Gallego, R.; Raghay, K.; Eiras, S.; Rubio, J.; Diéguez, C.; Gualillo, O.; González-Juanatey, J.R.; Lago, F. Adiponectin is synthesized and secreted by human and murine cardiomyocytes. FEBS Lett. 2005, 579, 5163–5169. [Google Scholar] [CrossRef] [PubMed]
- Katsiougiannis, S.; Kapsogeorgou, E.K.; Manoussakis, M.N.; Skopouli, F.N. Salivary gland epithelial cells: A new source of the immunoregulatory hormone adiponectin. Arthritis Rheum. 2006, 54, 2295–2299. [Google Scholar] [CrossRef] [PubMed]
- Martin, L.J.; Woo, J.G.; Geraghty, S.R.; Altaye, M.; Davidson, B.S.; Banach, W.; Dolan, L.M.; Ruiz-Palacios, G.M.; Morrow, A.L. Adiponectin is present in human milk and is associated with maternal factors. Am. J. Clin. Nutr. 2006, 83, 1106–1111. [Google Scholar] [CrossRef] [PubMed]
- Wu, D.; Li, H.; Xiang, G.; Zhang, L.; Li, L.; Cao, Y.; Zhang, J. Adiponectin and its receptors in chronic hepatitis B patients with steatosis in China. Hepat. Mon. 2013, 13, e6065. [Google Scholar] [CrossRef] [PubMed]
- Heydari, M.; Cornide-Petronio, M.E.; Jiménez-Castro, M.B.; Peralta, C. Data on Adiponectin from 2010 to 2020: Therapeutic Target and Prognostic Factor for Liver Diseases? Int. J. Mol. Sci. 2020, 21, 5242. [Google Scholar] [CrossRef] [PubMed]
- Ding, X.; Saxena, N.K.; Lin, S.; Xu, A.; Srinivasan, S.; Anania, F.A. The roles of leptin and adiponectin: A novel paradigm in adipocytokine regulation of liver fibrosis and stellate cell biology. Am. J. Pathol. 2005, 166, 1655–1669. [Google Scholar] [CrossRef] [PubMed]
- Yamauchi, T.; Iwabu, M.; Okada-Iwabu, M.; Kadowaki, T. Adiponectin receptors: A review of their structure, function and how they work. Best. Pract. Res. Clin. Endocrinol. Metab. 2014, 28, 15–23. [Google Scholar] [CrossRef]
- Rhoads, T.W.; Burhans, M.S.; Chen, V.B.; Hutchins, P.D.; Rush, M.J.P.; Clark, J.P.; Stark, J.L.; McIlwain, S.J.; Eghbalnia, H.R.; Pavelec, D.M.; et al. Caloric Restriction Engages Hepatic RNA Processing Mechanisms in Rhesus Monkeys. Cell Metab. 2018, 27, 677–688.e5. [Google Scholar] [CrossRef]
- Mendoza-Herrera, K.; Florio, A.A.; Moore, M.; Marrero, A.; Tamez, M.; Bhupathiraju, S.N.; Mattei, J. The Leptin System and Diet: A Mini Review of the Current Evidence. Front. Endocrinol. 2021, 12, 749050. [Google Scholar] [CrossRef]
- Martínez-Uña, M.; López-Mancheño, Y.; Diéguez, C.; Fernández-Rojo, M.A.; Novelle, M.G. Unraveling the Role of Leptin in Liver Function and Its Relationship with Liver Diseases. Int. J. Mol. Sci. 2020, 21, 9368. [Google Scholar] [CrossRef]
- Ikejima, K.; Takei, Y.; Honda, H.; Hirose, M.; Yoshikawa, M.; Zhang, Y.J.; Lang, T.; Fukuda, T.; Yamashina, S.; Kitamura, T.; et al. Leptin receptor-mediated signaling regulates hepatic fibrogenesis and remodeling of extracellular matrix in the rat. Gastroenterology 2002, 122, 1399–1410. [Google Scholar] [CrossRef]
- Pérez-Pérez, A.; Sánchez-Jiménez, F.; Vilariño-García, T.; Sánchez-Margalet, V. Role of Leptin in Inflammation and Vice Versa. Int. J. Mol. Sci. 2020, 21, 5887. [Google Scholar] [CrossRef]
- Cortegana- Jiménes, C.; García-Galey, A.; Tami, M.; del Pino, P.; Carmona, I.; López, S.; Alba, G.; Sánchez-Margalet, V. Role of Leptin in Non-Alcoholic Fatty Liver Disease. Biomedicines 2021, 9, 762. [Google Scholar] [CrossRef]
- Yang, W.H.; Liu, S.C.; Tsai, C.H.; Fong, Y.C.; Wang, S.J.; Chang, Y.S.; Tang, C.H. Leptin induces IL-6 expression through OBR1 receptor signalling pathway in human synovial fibroblasts. PLoS ONE 2013, 8, e75551. [Google Scholar]
- Cohen, P.; Yang, G.; Yu, X.; Soukas, A.A.; Wolfish, C.S.; Friedman, J.M.; Li, C. Induction of leptin receptor expression in the liver by leptin and food deprivation. J. Biol. Chem. 2005, 280, 10034–10039. [Google Scholar] [CrossRef]
- Schanton, M.; Maymó, J.L.; Pérez-Pérez, A.; Sánchez-Margalet, V.; Varone, C.L. Involvement of leptin in the molecular physiology of the placenta. Reproduction 2018, 155, R1–R12. [Google Scholar] [CrossRef]
- Shen, J.; Sakaida, I.; Uchida, K.; Terai, S.; Okita, K. Leptin enhances TNF-alpha production via p38 and JNK MAPK in LPS-stimulated Kupffer cells. Life Sci. 2005, 77, 1502–1515. [Google Scholar] [CrossRef]
- Wang, J.; Leclercq, I.; Brymora, J.M.; Xu, N.; Ramezani-Moghadam, M.; London, R.M.; Brigstock, D.; George, J. Kupffer cells mediate leptin-induced liver fibrosis. Gastroenterology 2009, 137, 713–723. [Google Scholar] [CrossRef]
- Mandal, P.; Park, P.H.; McMullen, M.R.; Pratt, B.T.; Nagy, L.E. The anti-inflammatory effects of adiponectin are mediated via a heme oxygenase-1-dependent pathway in rat Kupffer cells. Hepatology 2010, 51, 1420–1429. [Google Scholar] [CrossRef] [PubMed]
- Semmler, G.; Datz, C.; Trauner, M. Eating, diet, and nutrition for the treatment of non-alcoholic fatty liver disease. Clin. Mol. Hepatol. 2023, 29, S244–S260. [Google Scholar] [CrossRef] [PubMed]
- Crowe, A.R.; Yue, W. Semi-quantitative Determination of Protein Expression using Immunohistochemistry Staining and Analysis: An Integrated Protocol. Bio-Protocol 2019, 9, e3465. [Google Scholar] [CrossRef] [PubMed]


Disclaimer/Publisher’s Note: The statements, opinions and data contained in all publications are solely those of the individual author(s) and contributor(s) and not of MDPI and/or the editor(s). MDPI and/or the editor(s) disclaim responsibility for any injury to people or property resulting from any ideas, methods, instructions or products referred to in the content. |
© 2024 by the authors. Licensee MDPI, Basel, Switzerland. This article is an open access article distributed under the terms and conditions of the Creative Commons Attribution (CC BY) license (https://creativecommons.org/licenses/by/4.0/).