Article

Intervention of Natural Microalgal Bioactives on Type 2 Diabetes: Integrated Scientometric Mapping and Cellular Efficacy Studies

by
Ran Chen
1,2,3,†,
Hongxiang Zhao
1,2,3,†,
Shilin Wu
1,2,3,†,
Ning Yang
1,2,3,
Zhen Zhang
1,2,3,*,
Kun Li
1,2,3,
Jingyun Chen
1,2,3,
Pei Wang
1,2,3,
Xiaojun Liu
1,2,3 and
Rongqing Zhang
2,3,4
1
College of Fisheries and Life Science, Shanghai Ocean University, Shanghai 201306, China
2
Zhejiang Provincial Key Laboratory of Multiomics and Molecular Enzymology, Yangtze Delta Region Institute of Tsinghua University, Jiaxing 314006, China
3
UK-China Joint Laboratory of Microalgal Biomanufacturing and Bioengineering, Yangtze Delta Region Institute of Tsinghua University, Jiaxing 314006, China
4
Ministry of Education Key Laboratory of Protein Sciences, School of Life Sciences, Tsinghua University, Beijing 100084, China
*
Author to whom correspondence should be addressed.
These authors contributed equally to this work.
Phycology 2025, 5(3), 36; https://doi.org/10.3390/phycology5030036
Submission received: 30 June 2025 / Revised: 1 August 2025 / Accepted: 6 August 2025 / Published: 8 August 2025

Abstract

Type 2 diabetes mellitus (T2DM) is recognized as a multifactorial health disorder associated with various complications. This paper presents a bibliometric analysis of type 2 diabetes mellitus and natural active substances. Currently, the research field in this area is on an upward trajectory, with major research hotspots focusing on pathogenesis, pharmacological activities, the gut microbiota, and lipid metabolism. Algae-derived natural active substances, namely astaxanthin, extracellular polysaccharide from Porphyridium cruentum (EPS-P), and β-carotene, all exhibit high antioxidant properties and safety, along with favorable hypoglycemic effects. Therefore, their therapeutic intervention effects on type 2 diabetes mellitus were evaluated through in vitro experiments. Compared with the model group, astaxanthin, β-carotene, and Porphyridium cruentum polysaccharide (EPS-P) improved various indicators by at least 24.17%, 7.7%, and 6.7%, respectively. All three substances could, to a certain extent, enhance glucose consumption, glycogen content, and pyruvate activity, as well as improve and restore the condition of IR-HepG2 cells. The order of intervention efficacy was astaxanthin, followed by β-carotene, and then Porphyridium cruentum polysaccharide (EPS-P). These findings provide a scientific basis for the biomedical applications of algae-derived natural products.

1. Introduction

Diabetes mellitus (DM) stands as the most prevalent metabolic disorder, having emerged as a major global health concern due to its escalating worldwide prevalence [1]. Currently, 463 million individuals globally (9.3% of adults aged 20–79) live with diabetes, with type 2 diabetes mellitus (T2DM) accounting for approximately 90% of all cases [2]. As shown in Figure 1, Despite the lack of a definitive cure for T2DM, its pathogenesis and complications are strongly associated with oxidative stress (OS) and low-grade chronic inflammation [3]. Chronic dysregulation of carbohydrate and lipid metabolism triggers multiple pathways, leading to impaired pancreatic β-cell insulin secretion, insulin resistance, reduced peripheral glucose utilization, and enhanced hepatic glucose production [4]. While conventional synthetic antidiabetic agents (e.g., metformin, gliclazide) demonstrate efficacy in glycemic control, their use is limited by adverse effects and risks of pharmacological dependency [5].
Natural active substances, characterized by structural diversity and bioactivities such as antioxidant, anti-inflammatory, anti-allergic, and anti-aging properties, have garnered extensive applications in pharmaceuticals, food, and cosmetics [6]. Astaxanthin (ASTA; 3,3′-dihydroxy-β,β′-carotene-4,4′-dione), a xanthophyll carotenoid [7], ranks among the most potent carotenoids, with exceptional antioxidant capacity and which is naturally sourced from microorganisms and marine organisms (e.g., microalgae, crustaceans, and plants) [8]. Among these, Haematococcus pluvialis is recognized as the richest natural source of all-trans astaxanthin in nature. When compared with astaxanthin with other structural configurations, all-trans astaxanthin exhibits higher antioxidant activity and stability. Studies have shown that oral supplementation of ASTA (8 mg/day for 8 weeks) significantly reduced fructosamine and blood glucose concentrations in patients with type 2 diabetes mellitus, while improving glucose metabolism and blood pressure regulation [9]. Arunkumar et al. [10] reported that ASTA (6 mg/kg/d for 45 days) attenuated hyperglycemia and hyperinsulinemia while enhancing insulin sensitivity in high-fat fructose-diet (HFFD)-fed mice. β-Carotene, a provitamin A carotenoid, exhibits antioxidant and coloring functions [11], conferring protection against T2DM, cardiovascular diseases, obesity, and metabolic syndrome (MetS) [12,13,14]. Natural sources of β-carotene are widely distributed among algae and plants, such as Dunaliella salina and Chlorella. Under extreme conditions of high salinity and intense light, Dunaliella salina can accumulate β-carotene at levels exceeding 10% of its dry weight, with the cis-isomer being more readily absorbed by the human body [15]. Mechanistically, β-carotene modulates inflammatory and oxidative pathways by suppressing pro-inflammatory transcription factors and cytokines implicated in obesity and insulin resistance [16]. In metabolic diseases such as obesity and insulin resistance, the levels of interleukin-6 (IL-6) significantly increase. Beta-carotene can reduce the production of IL-6 by inhibiting the activity of relevant transcription factors, thereby improving inflammatory responses and metabolic status. It can also decrease the production of tumor necrosis factor-α (TNF-α) by inhibiting the activity of transcription factors like NF-κB. Additionally, beta-carotene inhibits the expression and phosphorylation of AP-1 subunits (such as c-Jun/c-Fos), blocking the mitogen-activated protein kinase (MAPK) signaling pathways (including JNK, ERK, and p38). Furthermore, it suppresses the secretion of TNF-α by macrophages and adipocytes, alleviating adipose tissue inflammation and improving insulin signaling [17,18,19]. Emerging evidence also highlights its regulatory roles in adipogenesis, lipolysis, and insulin signaling—key determinants of T2DM pathophysiology [20]. The extracellular polysaccharide of Porphyridium exhibit various biological activities, including moisturizing, anti-aging, anti-inflammatory, antioxidant, and antitumor properties [21]. Dvir I et al. [22] found that both Porphyridium powder and exopolysaccharide could effectively reduce blood glucose, increase plasma superoxide dismutase (SOD) activity, and protect the normal morphology of pancreas in alloxan diabetic mice. Setyaningsih I et al. [23] treated diabetic rats with 450 mg/kg BW of crude polysaccharide from Porphyridium, and their results show that polysaccharides can significantly reduce blood glucose levels and increase pancreatic β-cell activity.
This study conducted a bibliometric analysis on natural active substances and T2DM and compared in vitro the intervention effects of microalgae active substances—astaxanthin, Porphyridium cruentum extracellular polysaccharide, and β-carotene—on T2DM to support natural drug development.

2. Materials and Methods

2.1. Materials and Reagents

The extracellular polysaccharides from Porphyridium were isolated and purified in our laboratory [24]. Other materials and reagents for cell culture included DMEM high-glucose medium, β-carotene, astaxanthin, insulin, metformin hydrochloride, CCK-8 kit, fetal bovine serum (FBS), penicillin–streptomycin solution, trypsin, and dimethyl sulfoxide (DMSO), all purchased from Beijing Solarbio Science & Technology Co., Ltd. (Beijing, China). The pyruvate kinase (PK) assay kit, glycogen assay kit, and glucose detection kit were obtained from Nanjing Jiancheng Bioengineering Institute (Nanjing, China). Human hepatocellular carcinoma HepG2 cells were sourced from Shanghai Yuchi Cell Bank (Shanghai, China).

2.2. Instruments and Equipment

SW-CJ-1FD Laminar Flow Cabinet (Sujing Group Antai Company, Suzhou, China); Thermo 371 Cell Culture Incubator (Thermo Fisher Scientific, Waltham, MA, USA); EnSight Multifunctional Microplate Reader (Shenzhen Keshida Electronic Technology Co., Ltd., Shenzhen, China); XDS 200C Inverted Microscope (Shanghai Caikang Optical Instrument Co., Ltd., Shanghai, China); Sorvall LYNX 6000 High-Speed Centrifuge (Thermo Fisher Scientifi, Co., Ltd., Beijing, China).

2.3. Extraction, Purification, and Physicochemical Properties of EPS-P

Extraction and purification were performed following standard laboratory protocols, yielding polysaccharides with a purity of 60.67 ± 0.52%. Subsequent full-wavelength scanning analysis and infrared spectroscopy confirmed the absence of free nucleic acids and protein components, thereby validating its polysaccharide identity [25]. The processes of cultivation, harvesting, extraction, separation and purification were all carried out in accordance with the literature. Porphyridium cruentum polysaccharide is primarily composed of xylose, glucose, and galactose; it has an average molecular weight of 2918 kDa; and it exhibits characteristic absorption peaks of polysaccharides, indicating that it is a sulfated polysaccharide and suggesting the presence of β-d-glucopyranose [26].

2.4. Literature Collection and Analysis

The retrieved data came from the Web of Science (WOS) core dataset. The data were retrieved through the precise and advanced search terms of the online library of Shanghai Ocean University on 3 January 2025. The search terms were TS = (type 2 diabetes OR T2DM OR 2DM OR diabetes mellitus, Type II) AND TS = (treatment OR prevent OR interfere OR healing) AND TS = (natural products OR natural substances OR natural drugs OR nature medicine OR natural medicine). The retrieval time span is from 2000 to 2025. A total of 1178 documents were initially retrieved. After removing meeting minutes, book chapters, editorial materials, letters, withdrawals, and briefings, the documents that meet the research standards were collected and sorted, and a total of 1164 documents were obtained.
Bibliometric analysis and visualization were conducted using CiteSpace 6.3.R1, with the following parameters: TimeSlicing = 2000–2025, years per slice = 1, threshold criteria set to “Top N = 50”, and g-index (k = 8). Node types included authors, institutions, countries, and keywords. National collaboration networks were visualized using VOSviewer1.6.18.0.

2.5. Cell Experiment

2.5.1. Cell Culture and Establishment of an IR-HepG2 Cell Model

Thawed HepG2 cells were transferred into T25 cell culture flasks containing high-glucose DMEM medium supplemented with 10% fetal bovine serum (FBS) and 1% penicillin–streptomycin solution. The cells were incubated in a 37 °C, 5% CO2 incubator for 24 h. Logarithmic-phase cells (with approximately 80% confluency, viability >90%, and in a rapid proliferation stage) were harvested for subsequent experiments. To establish the IR-HepG2 cell model, the cells were treated with 1 μmol/L insulin for 24 h. The IR status of IR-HepG2 cells was verified using a glucose assay kit [27].

2.5.2. Assessment of Cell Viability Effects of Astaxanthin, β-Carotene, and Porphyridium Polysaccharides on HepG2 Cells Using the CCK-8 Assay

Logarithmic-phase HepG2 cells were seeded into 96-well plates at a density of 1 × 10⁵ cells/mL. Experimental groups included a blank control (medium only), negative control (cells only), and sample treatment groups. The sample groups were administered astaxanthin at concentrations of 0.02 g/L, 0.015 g/L, 0.01 g/L, 0.005 g/L, and 0.0025 g/L; β-carotene at concentrations of 20 μM, 15 μM, 10 μM, 5 μM, and 1 μM; and Porphyridium polysaccharides at concentrations of 0.5 g/L, 0.1 g/L, 0.05 g/L, and 0.01 g/L. Each concentration was tested in triplicate. Following 24 h of incubation, the medium was replaced with fresh medium containing CCK-8 reagent (CCK-8:medium = 1:9). After an additional 2 h incubation, absorbance was measured at 450 nm using a microplate reader.

2.5.3. Effects of Astaxanthin, β-Carotene, and Porphyridium Polysaccharides on Glucose Consumption in IR-HepG2 Cells

Logarithmic-phase IR-HepG2 cells were seeded into 96-well plates at a density of 1 × 10⁵ cells/mL. The experimental groups included the following: Blank control (medium only), negative control (cells only), positive control (metformin-treated cells), and sample treatment groups (astaxanthin, β-carotene, or Porphyridium polysaccharides). The sample groups were administered the following concentrations: Astaxanthin: 0.02 g/L, 0.015 g/L, 0.01 g/L, 0.005 g/L, and 0.0025 g/L; β-carotene: 15 μM, 12 μM, 9 μM, 6 μM, and 3 μM; and Porphyridium polysaccharides: 0.5 g/L, 0.1 g/L, 0.05 g/L, and 0.01 g/L. Each concentration was tested in triplicate. After 24 h of incubation, glucose concentrations in the cell culture media were measured using a glucose assay kit.

2.5.4. Effects of Astaxanthin, β-Carotene, and Porphyridium Polysaccharides on Glycogen Content and Pyruvate Kinase (PK) Activity in IR-HepG2 Cells

Logarithmic-phase IR-HepG2 cells were seeded into 6-well plates at a density of 1 × 10⁵ cells/mL. The experimental groups included the following: Blank control (medium only), negative control (cells only), positive control (metformin-treated cells), and sample treatment groups (astaxanthin, β-carotene, or Porphyridium polysaccharides). The sample groups were administered the following concentrations: Astaxanthin: 0.02 g/L, 0.015 g/L, 0.01 g/L, 0.005 g/L, and 0.0025 g/L; β-carotene: 15 μM, 12 μM, 9 μM, 6 μM, and 3 μM; and Porphyridium polysaccharides: 0.5 g/L, 0.1 g/L, 0.05 g/L, and 0.01 g/L. Each concentration was tested in triplicate. After 24 h of incubation, cellular glycogen content was measured using a liver/muscle glycogen assay kit, and pyruvate kinase (PK) activity was determined using a PK activity assay kit.

2.6. Statistical Analysis

Experimental data are presented as mean ± standard deviation (mean ± SD). Statistical analysis and graphical visualization were performed using GraphPad Prism 8.0 software. One-way analysis of variance (ANOVA) followed by Dunnett’s multiple comparisons test was applied to evaluate significant differences. Statistical significance was defined at a 95% confidence level (p < 0.05).

3. Results

3.1. Bibliometric Analysis

3.1.1. Annual Trend of Publications

As illustrated in Figure 2, the number of publications in the field of natural active compounds and type 2 diabetes (T2DM) has shown a consistent upward trend from 2000 to 2024, indicating increasing research interest and widespread attention from scholars worldwide. Over the past 25 years, the volume of publications on the applications of natural active compounds in T2DM has generally followed a linear growth pattern. From 2000 to 2007, fewer than 20 papers were published annually, suggesting that research in this area had not yet received adequate attention. Between 2008 and 2024, however, the number of publications gradually increased, rising from 5 papers to 133 papers. Since 2020, over 100 papers have been published each year. Notably, in 2023, the number of publications reached 133, representing a 5.78-fold increase compared with 2008 and a 4.43-fold increase compared with 2009. This rapid growth may be attributed to the expanded utilization of natural products. The recent linear growth trend reflects the escalating recognition of natural active compounds in T2DM research by global researchers.

3.1.2. National Distribution and Collaboration Networks

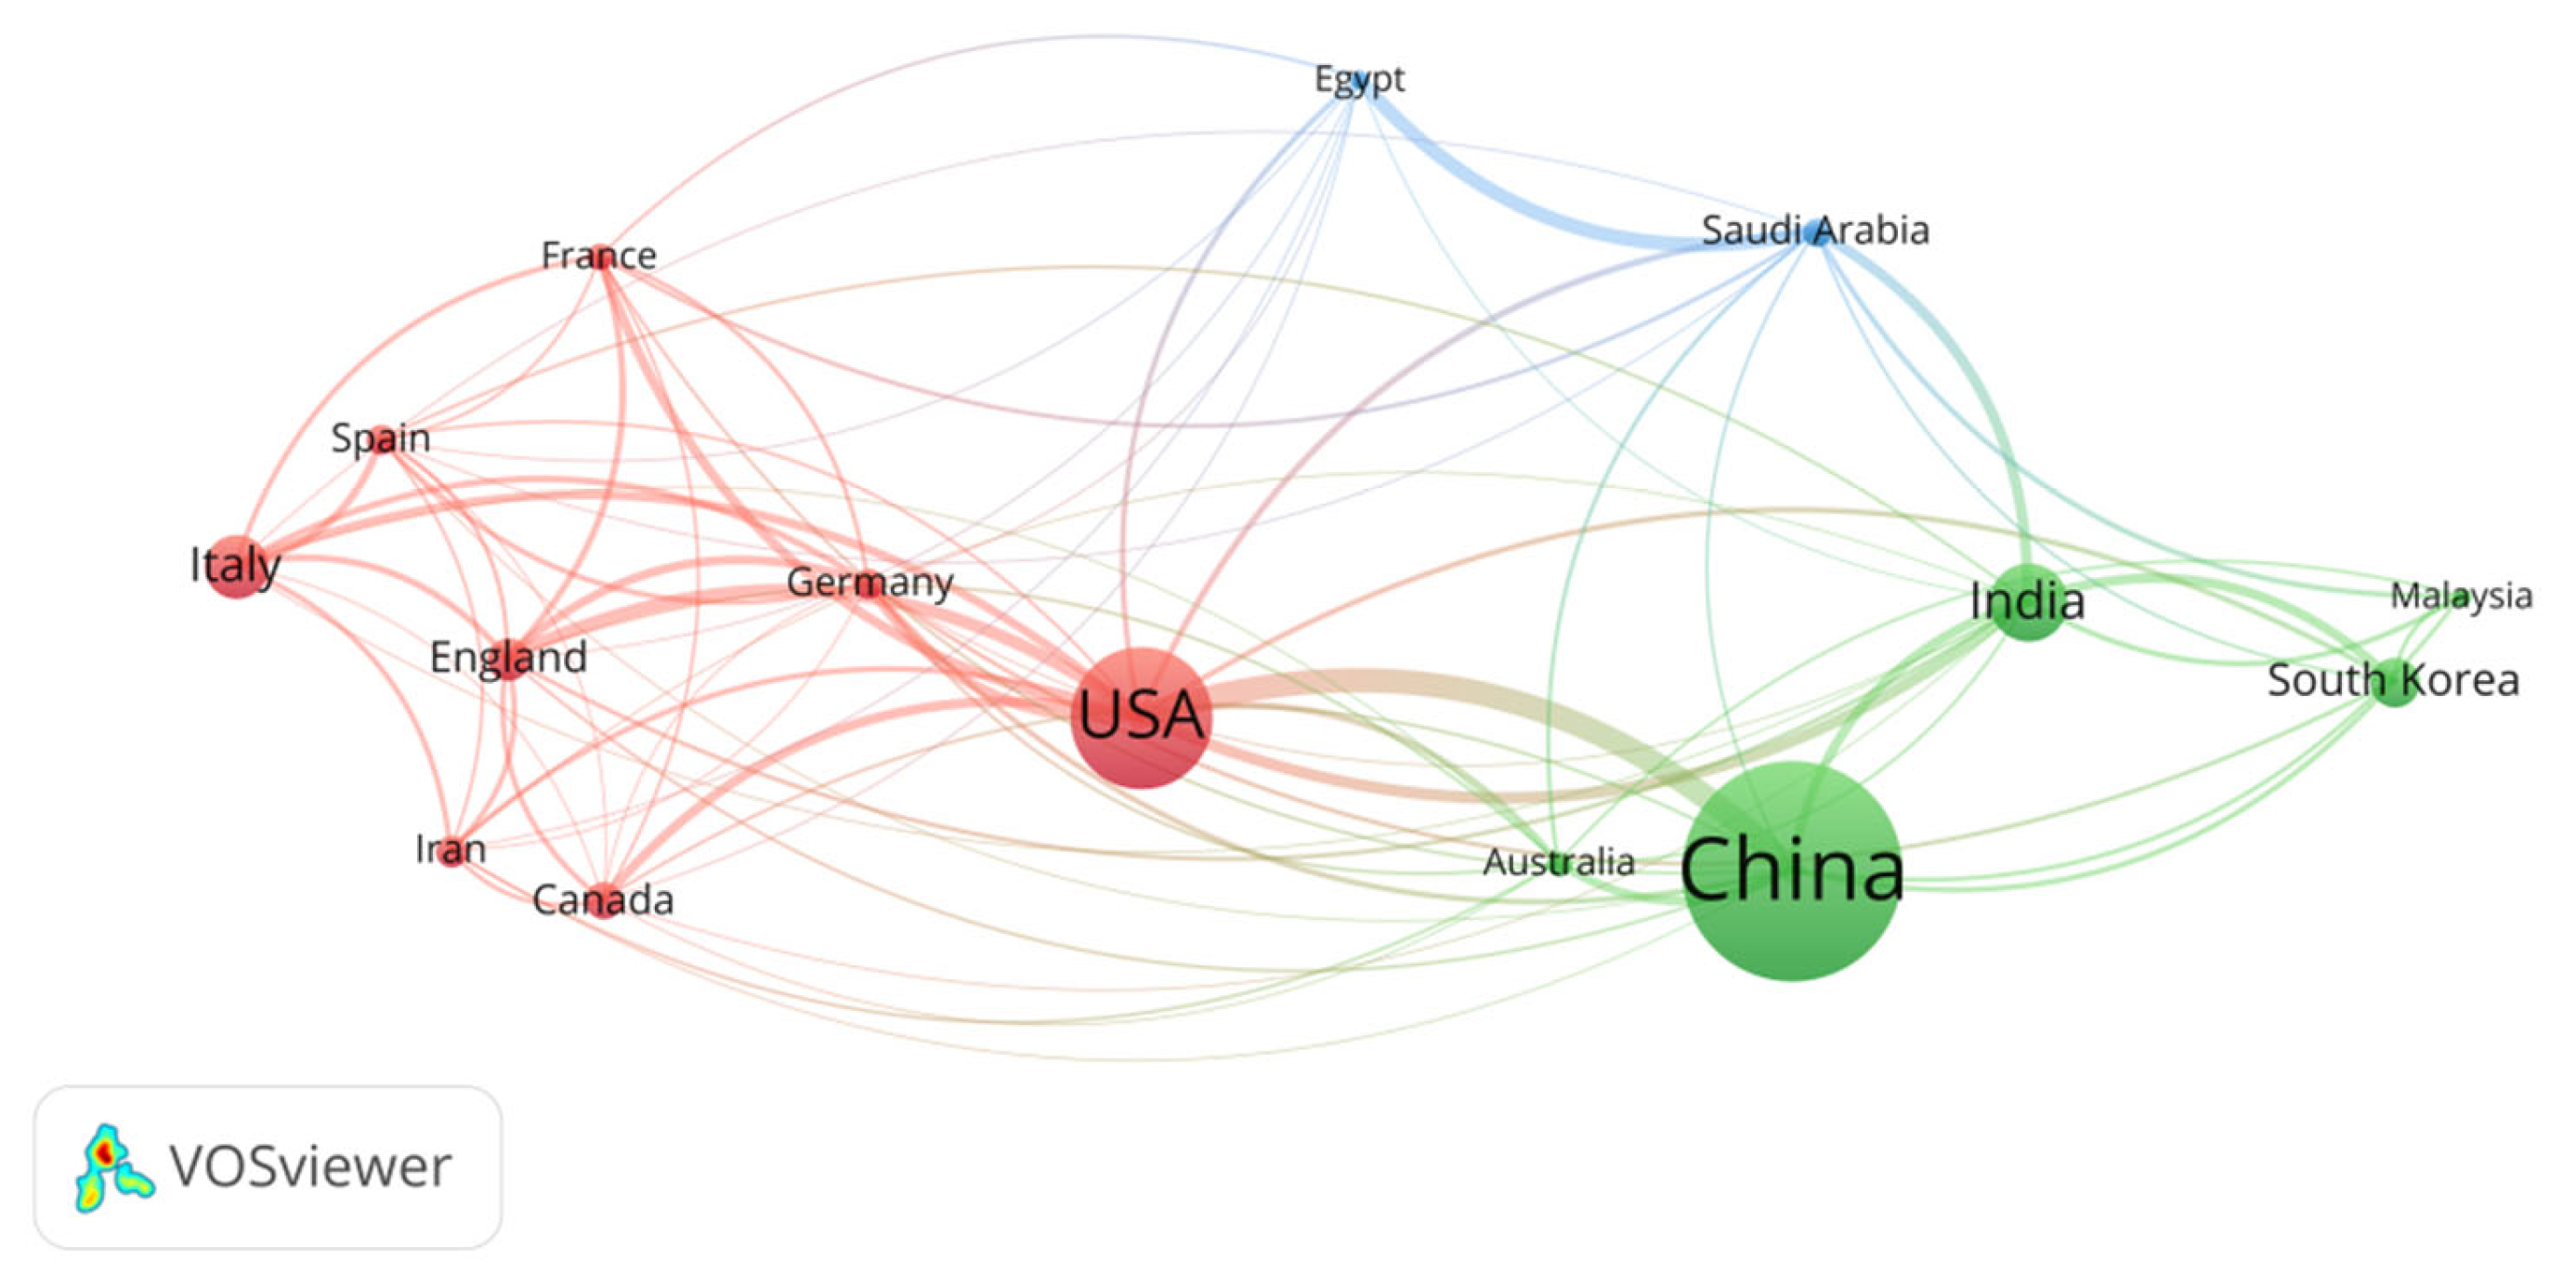
A country collaboration network map was generated using VOSviewer (Figure 3). Among nations, China emerged as the dominant contributor to this research field, publishing 295 papers (25.26% of the total), followed by the United States (190 papers, 16.32%) and India (105 papers, 9.00%). These findings highlight China and the United States as the primary research forces in the applications of natural active compounds for type 2 diabetes (T2DM). Based on collaboration strength rankings, the top five countries in this field from 2000 to 2025 are listed in Table 1. The results indicate that the United States exhibits the strongest inter-country collaborative ties within this domain, followed by China and India.

3.1.3. Research Institutions

A collaboration network and high-output institution analysis were conducted for research institutions publishing in the field of natural active compounds for type 2 diabetes (T2DM), using “institution” as the node type. As illustrated in Figure 4, the network comprises 226 nodes and 188 connections. According to Price’s Law (M = 0.749 × (Nmax)1/2) [28], the institution with the highest publication count (Nmax = 40) published 40 papers. Substituting Nmax into the formula yields M = 4.74, indicating that core institutions in this field must have published at least 5 papers. These core institutions account for 9.2% of all institutions analyzed. The top five institutions by publication volume are as follows: Chinese Academy of Sciences (40 papers), Egyptian Knowledge Bank (EKB) (19 papers), Chengdu University of Traditional Chinese Medicine (15 papers), University of Naples Federico II (10 papers), and University of London (8 papers).

3.1.4. Authors and Co-Authorship Networks

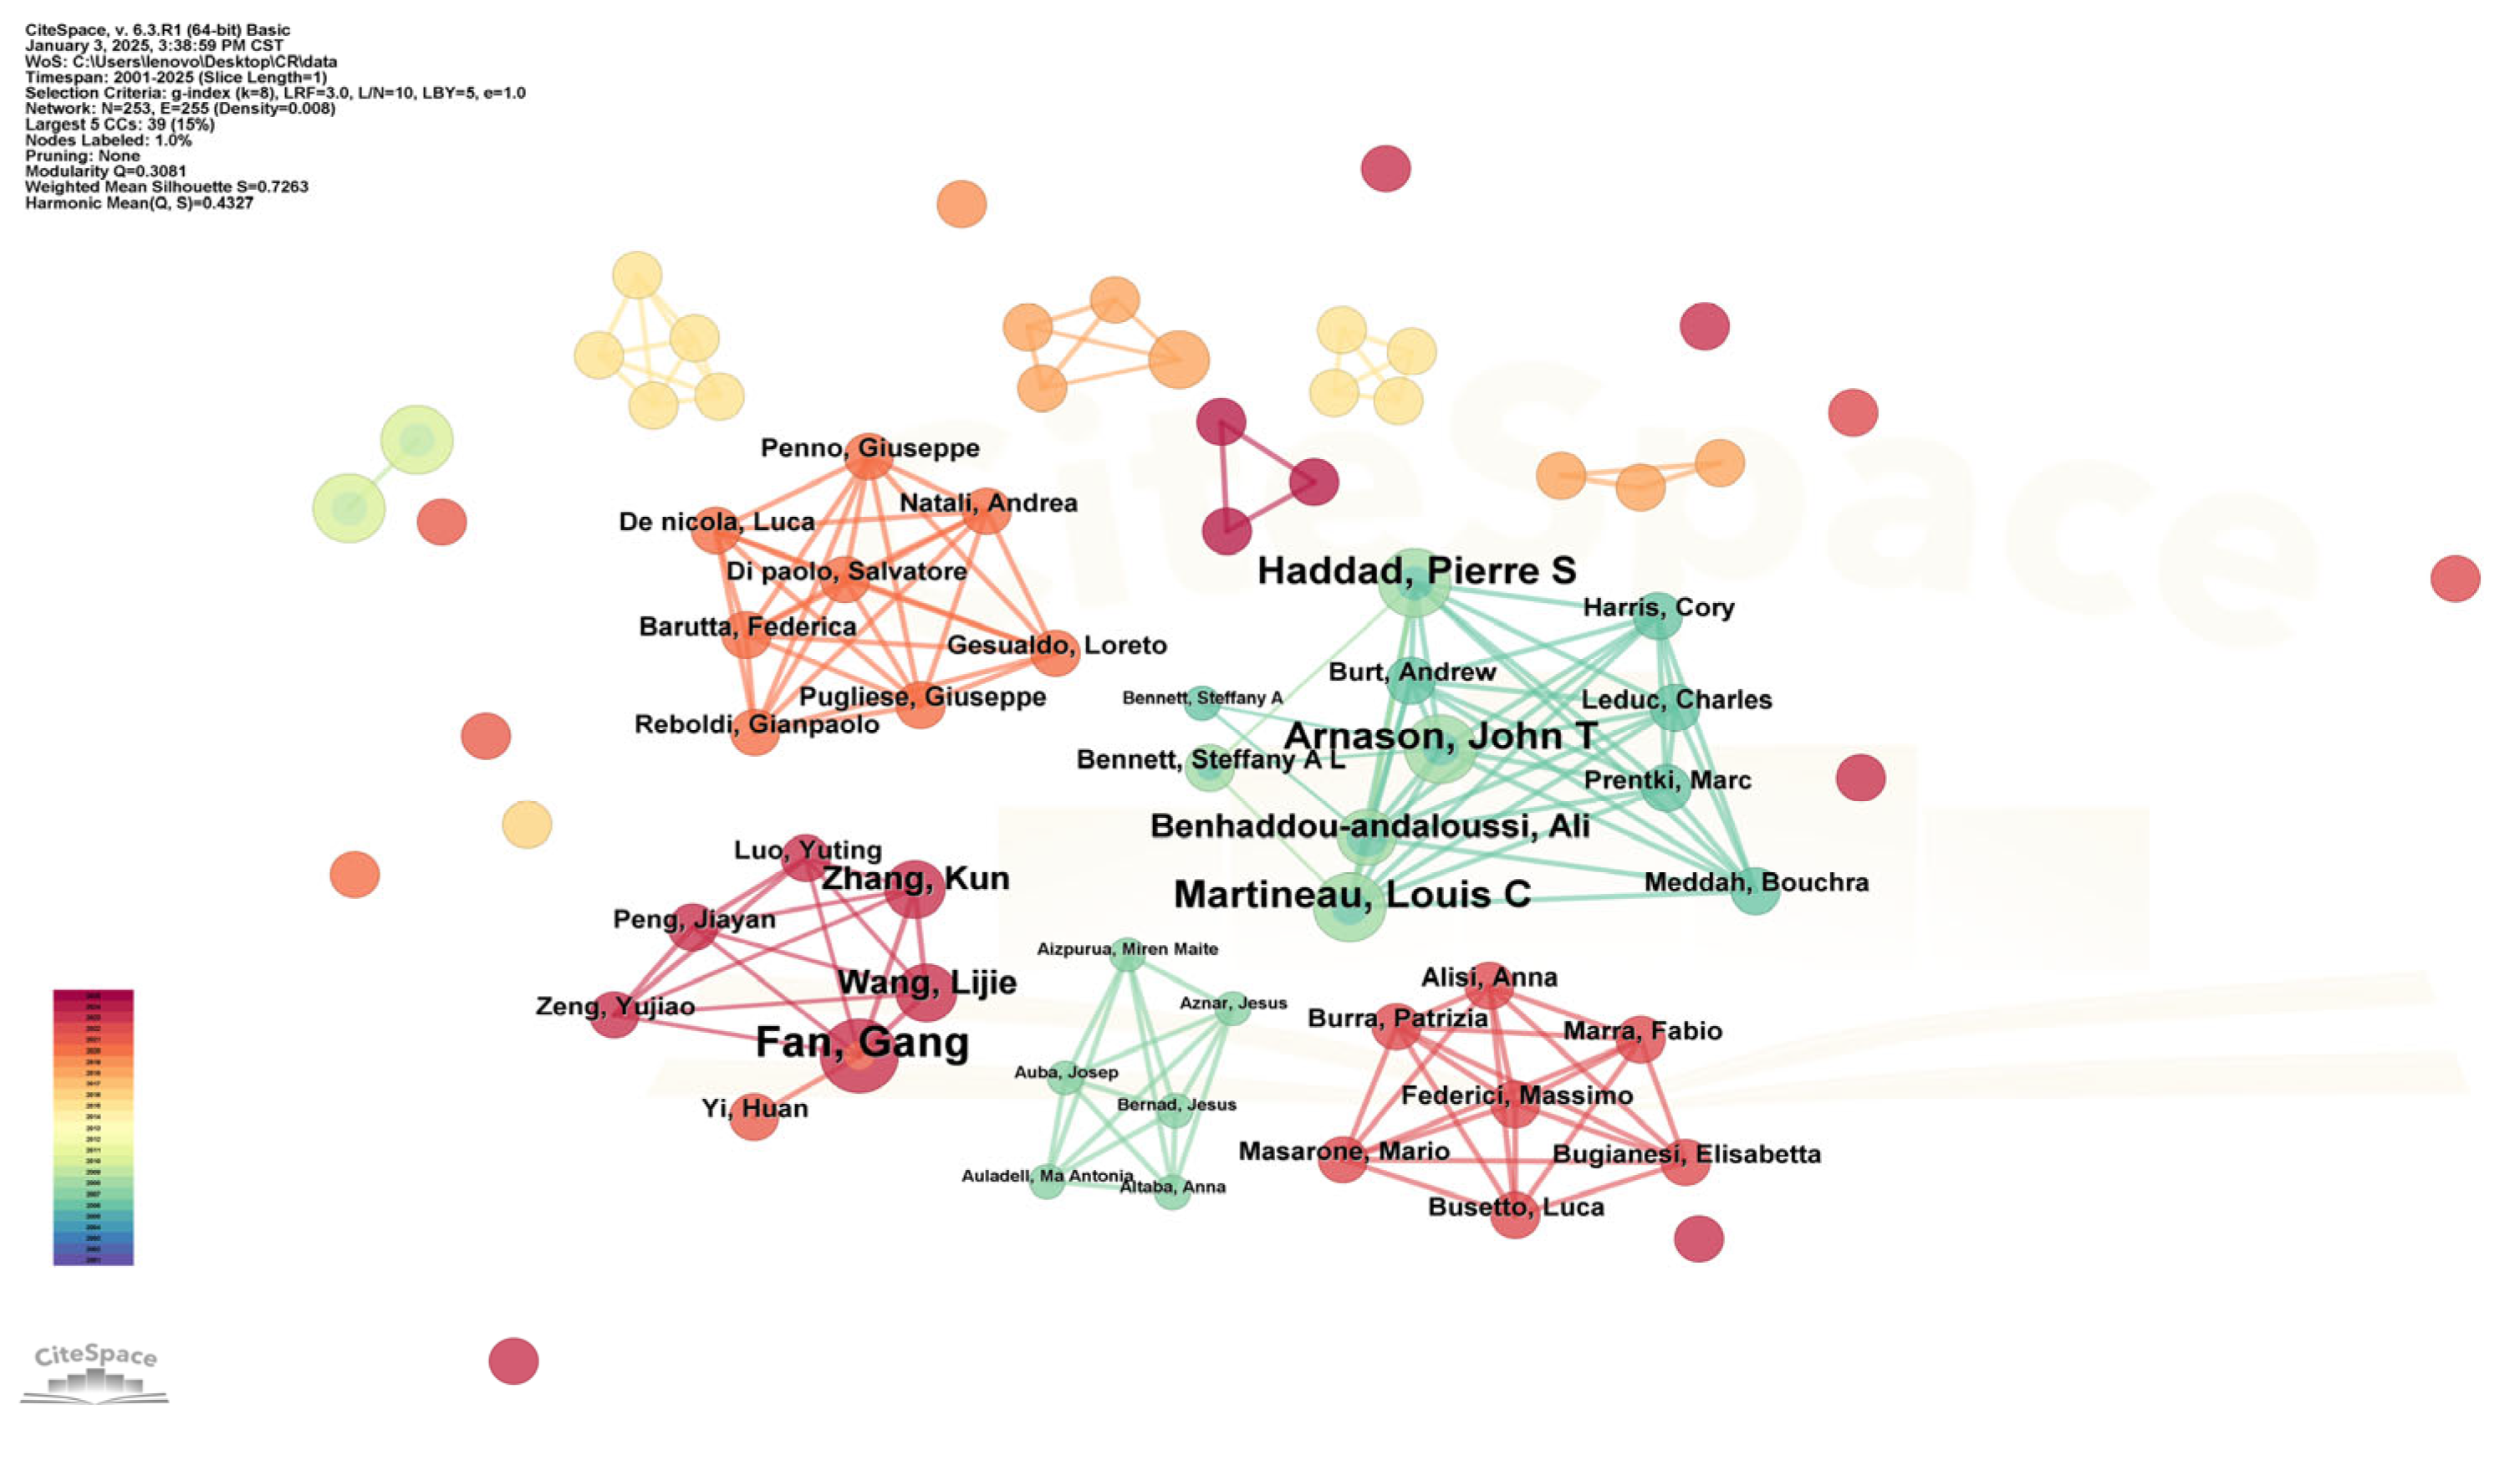
As depicted in Figure 5, the co-authorship network illustrates collaborations among authors [29], with lines connecting different authors representing collaborative relationships. High-productivity authors typically maintain stable partnerships with other researchers. Each node in the network corresponds to an author, and the size of the node reflects the number of papers published by that author—larger nodes indicate higher publication volumes [30,31]. The top five authors by publication count are as follows: Fan, Gang (5 papers), Pinto, B. Mario (4 papers), Arnason, John T. (4 papers), Mohan, Sankar (4 papers), Martineau, Louis C. (4 papers). A total of 1,164 publications were analyzed, involving 280 authors. Applying the aforementioned calculation method, the minimum publication threshold for core authors in this field was determined to be two papers. Consequently, 114 core authors were identified, accounting for 40.71% of all authors included in the study. Collectively, these core authors contributed 245 papers, representing 21.05% of the total literature corpus. As this proportion is below 50%, it suggests that a cohesive core author group has not yet emerged in this field.

3.1.5. Keyword Co-Occurrence Analysis

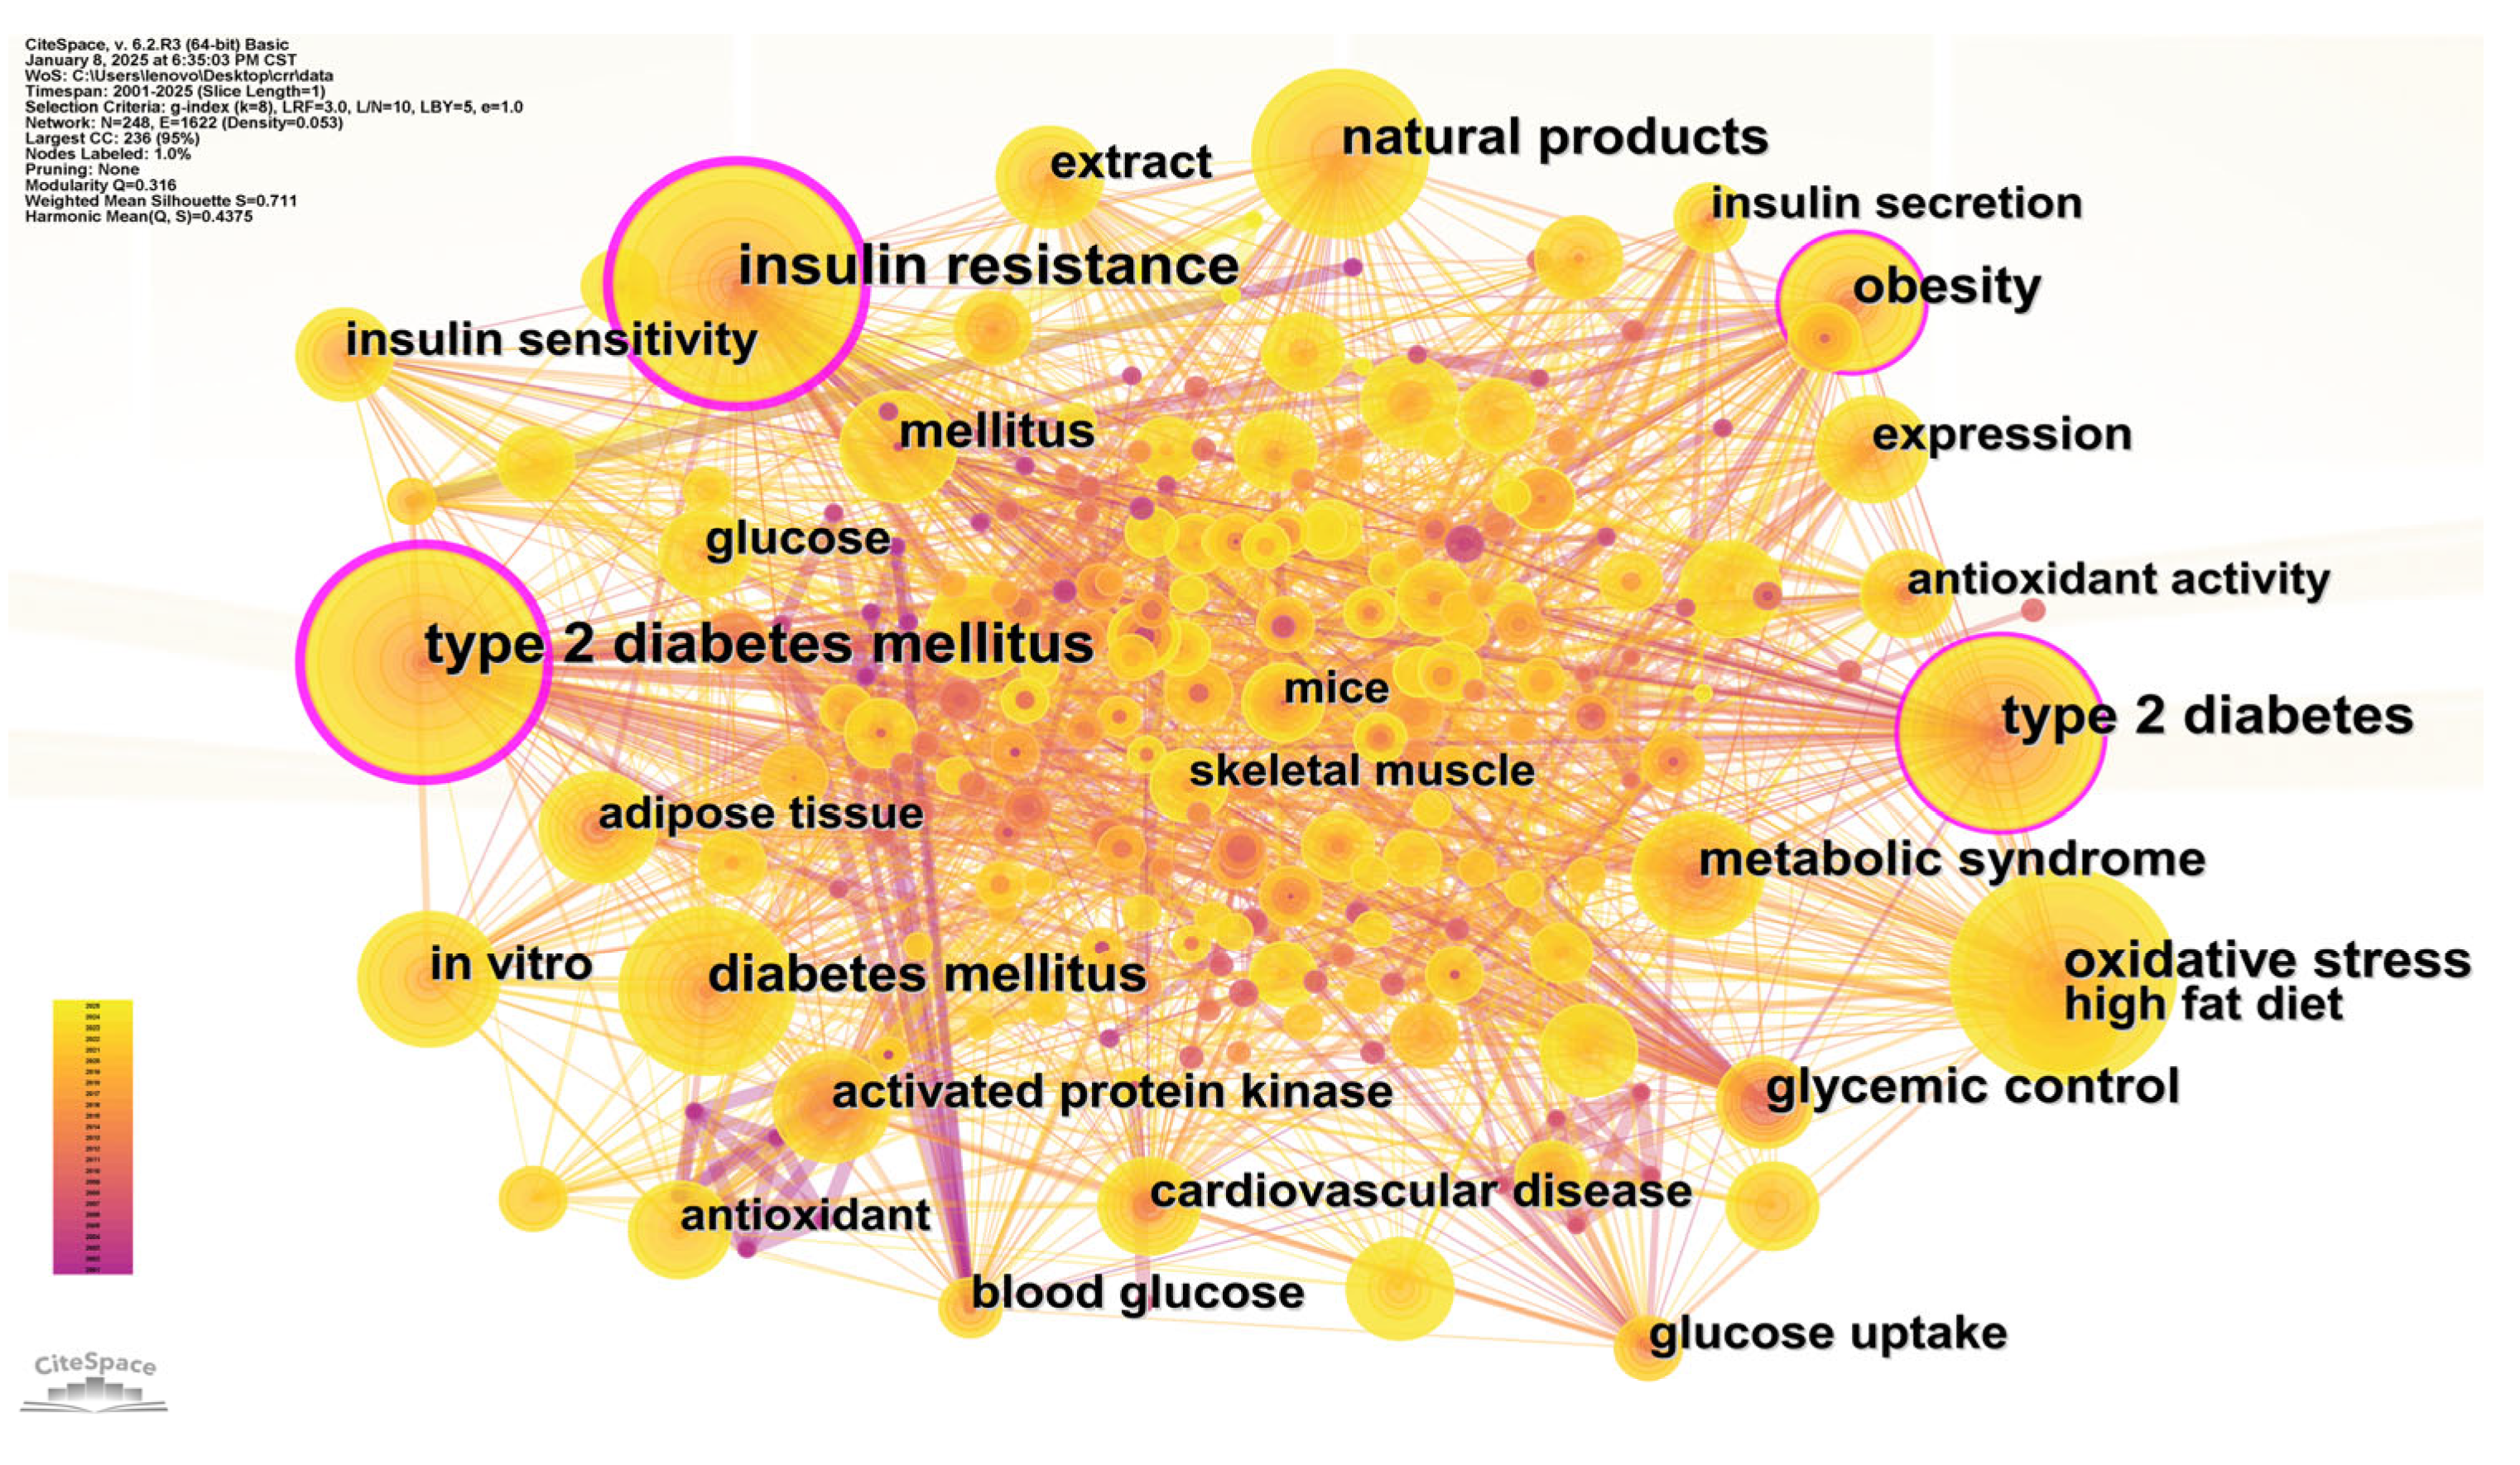
Keywords serve as high-level summaries that encapsulate research priorities in a field. High-frequency and high-centrality keywords typically reflect the core focuses of the discipline [32]. Figure 6 presents a keyword co-occurrence map for research on the applications of natural active compounds in type 2 diabetes (T2DM), derived from the Web of Science (WoS) database. The CiteSpace visualization generated 248 nodes and 1622 connections, where the lines and their thickness between keywords represent their relational proximity and co-occurrence frequency [33]. As shown in Figure 6, beyond thematic keywords such as “type 2 diabetes mellitus” and “natural products”, prominent and frequently occurring keywords in this research area include “insulin resistance”, “oxidative stress”, “metabolic syndrome”, “expression”, and “activated protein kinase”, among others.

3.1.6. Keyword Clustering Analysis

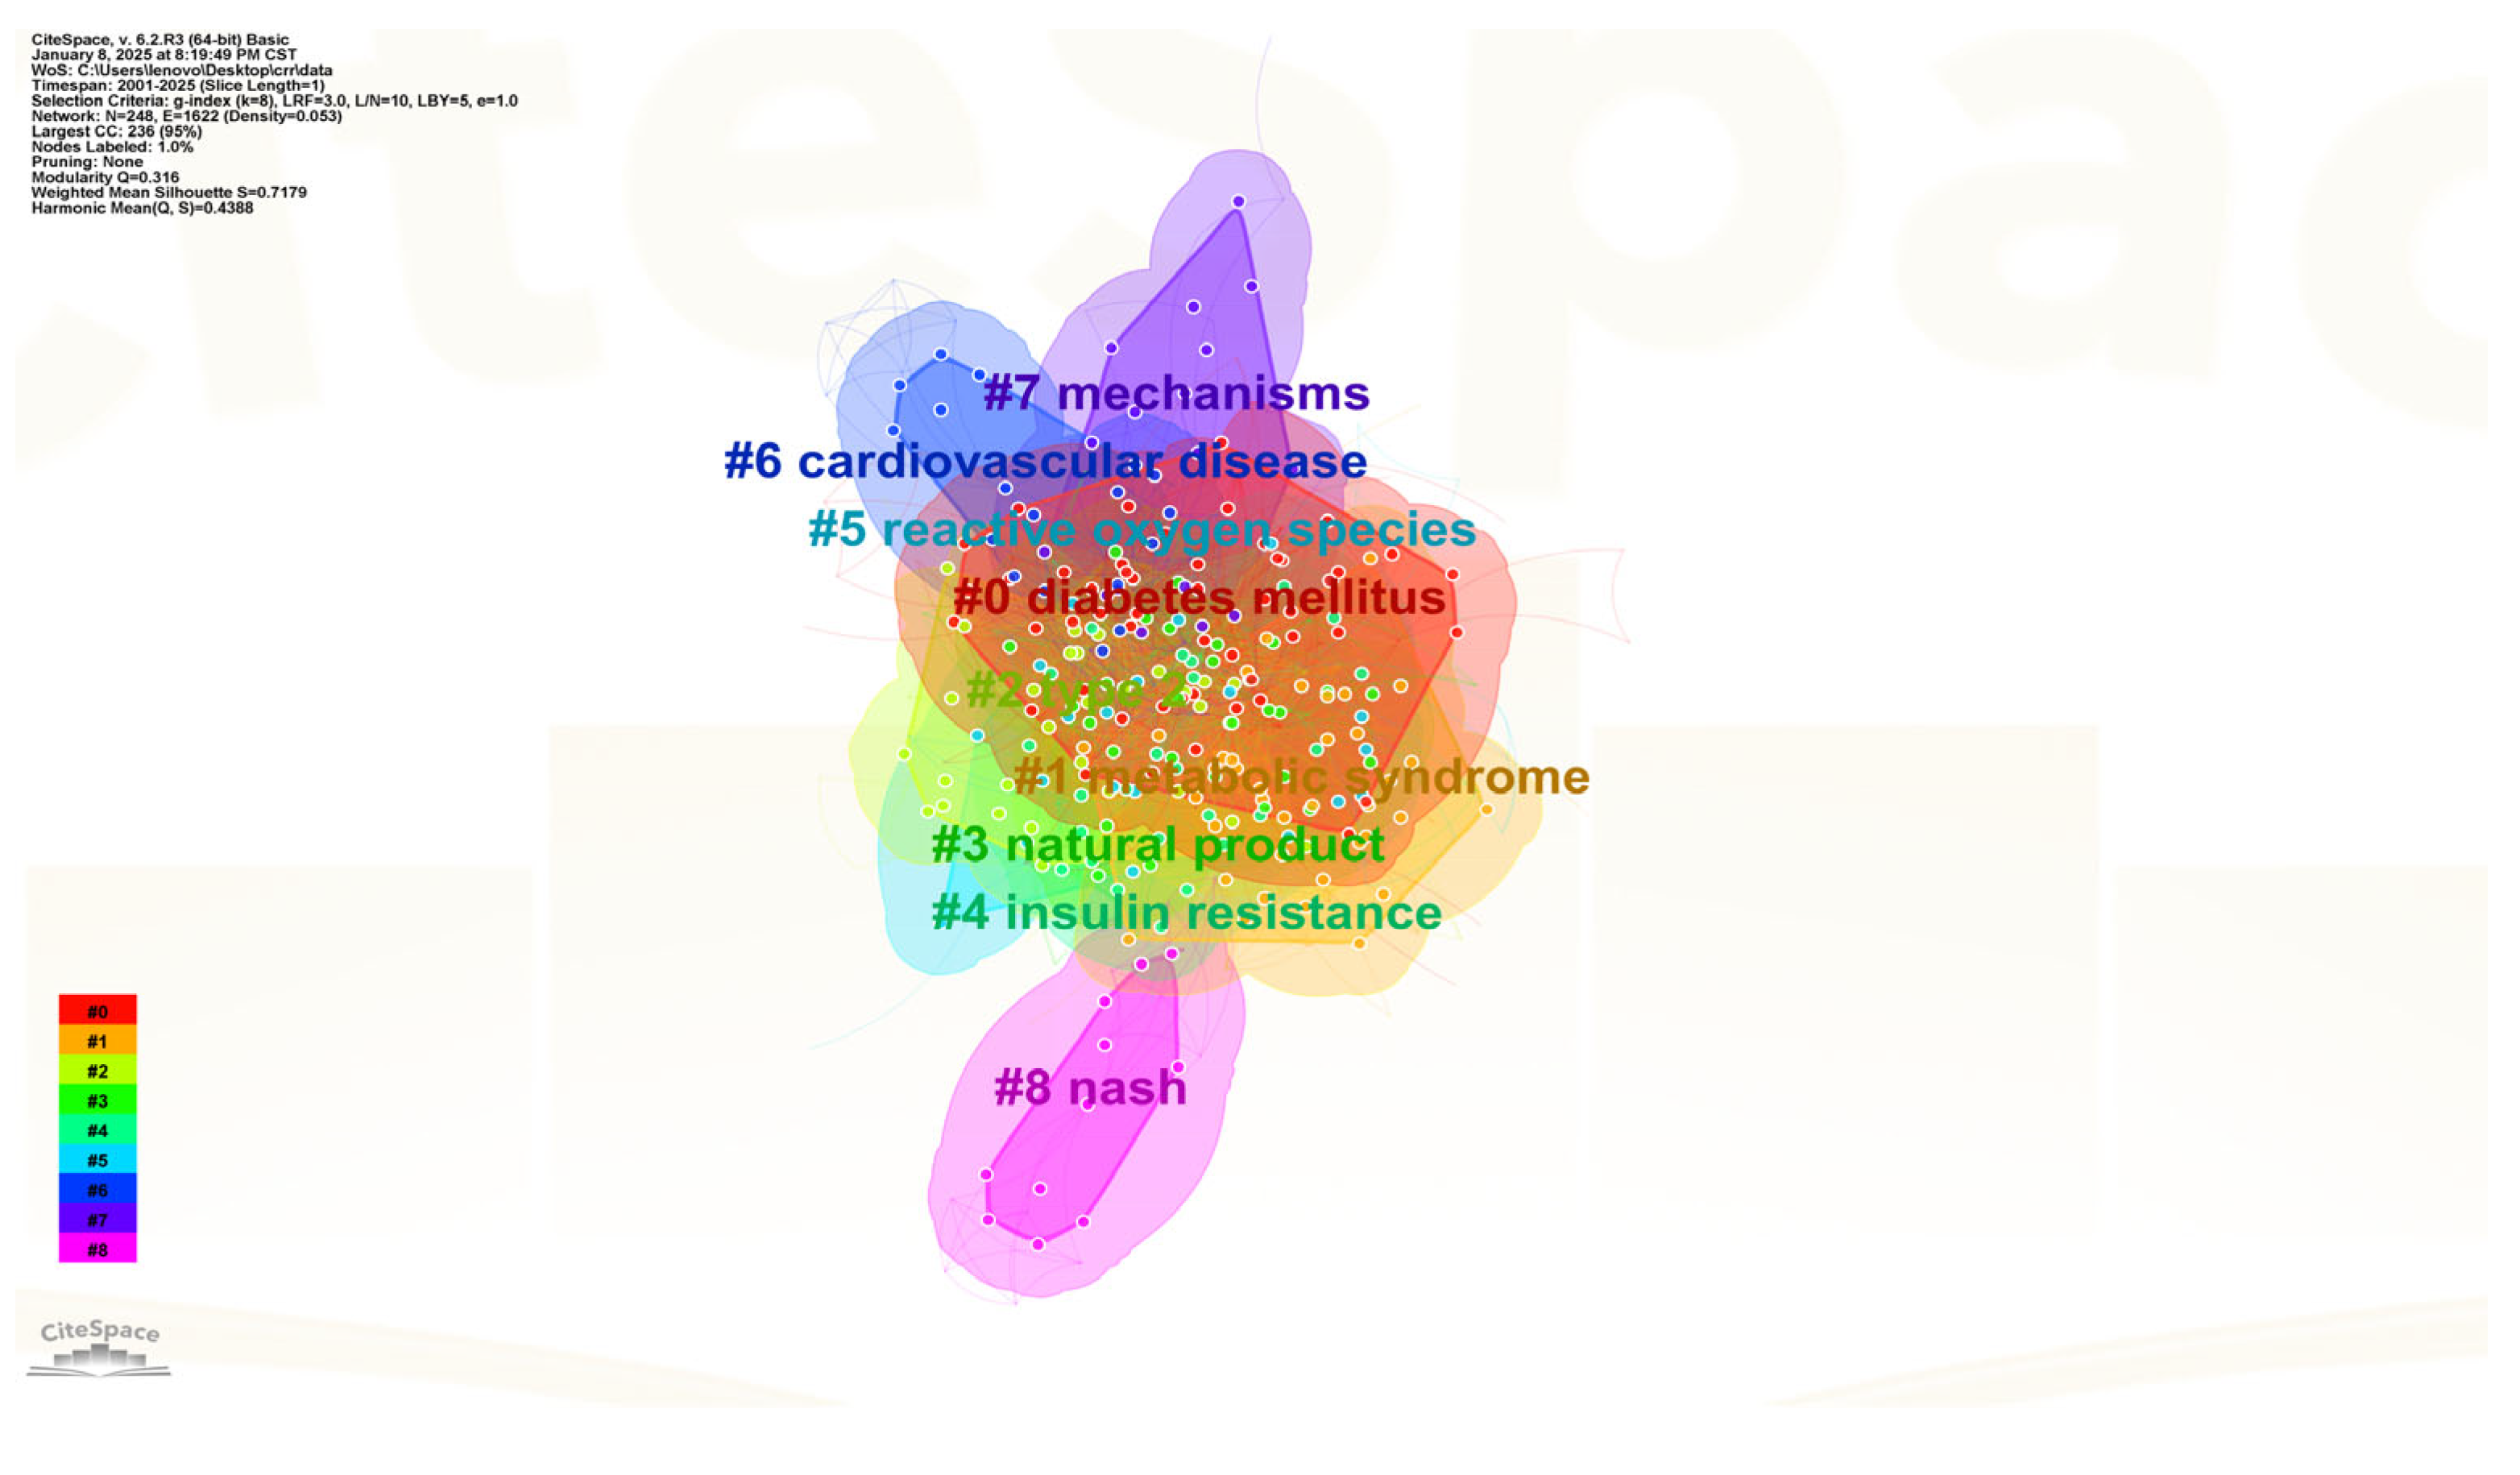
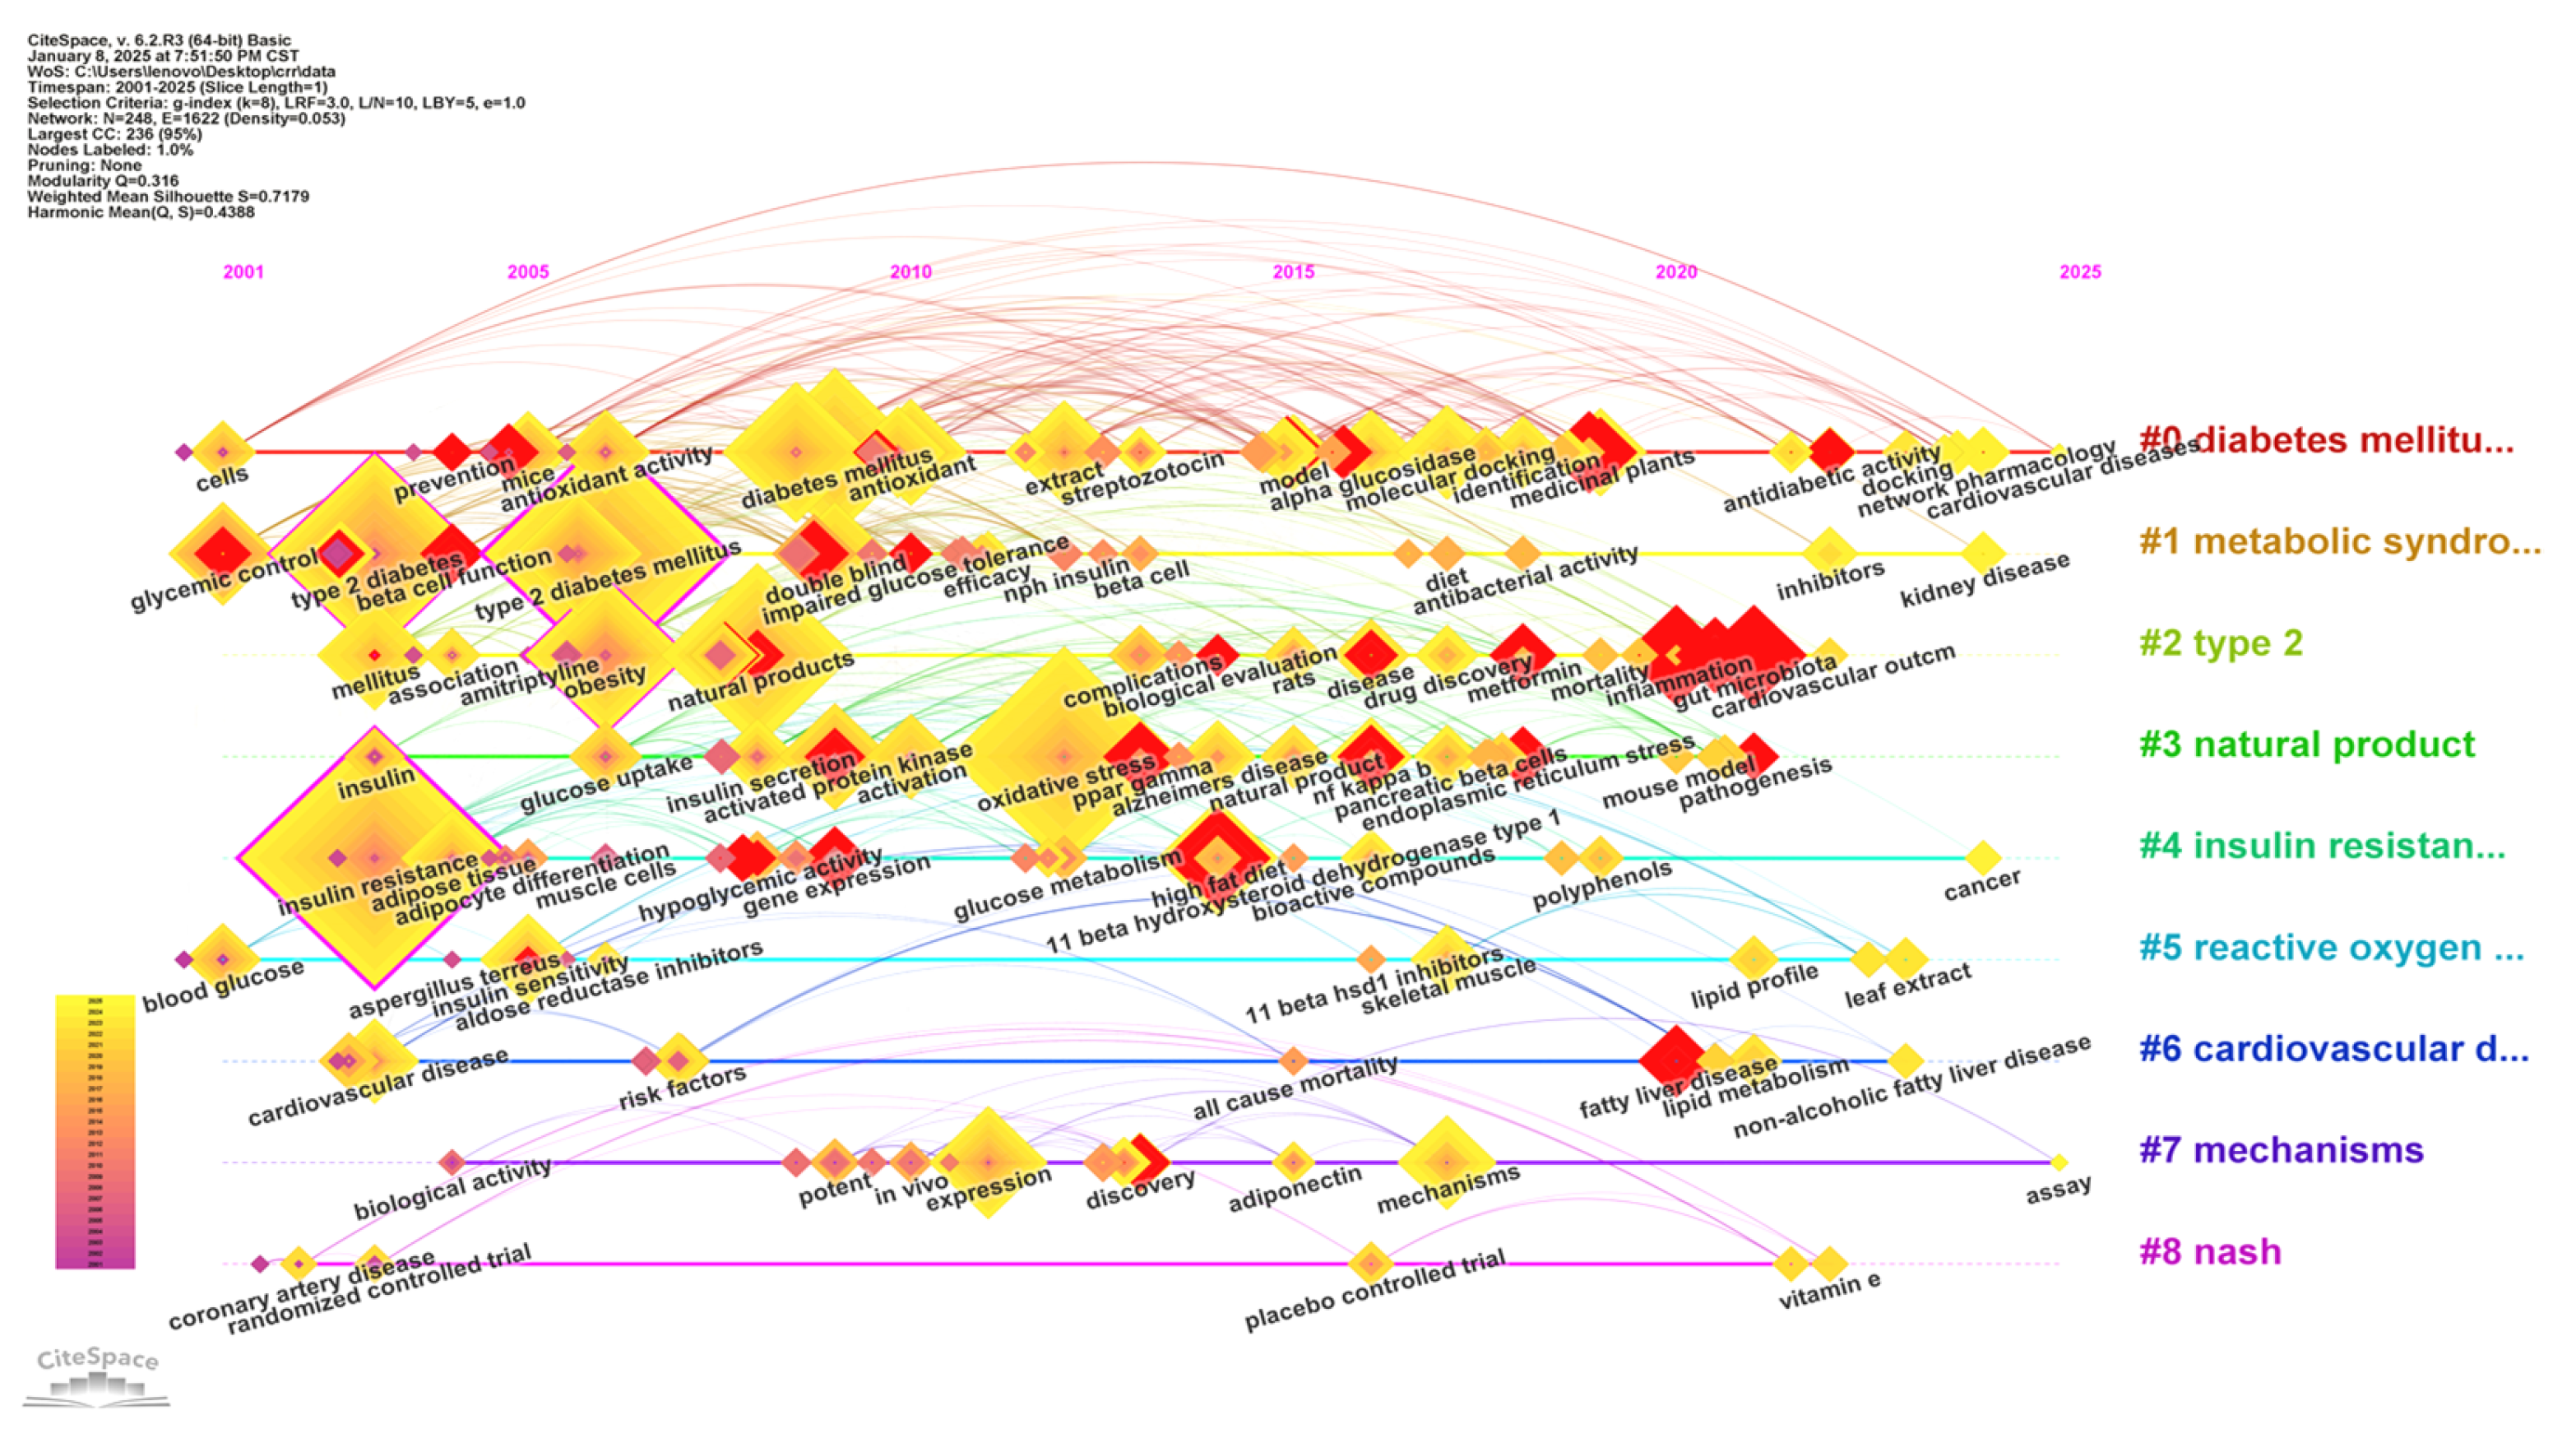
Figure 7 presents the results of keyword clustering analysis for research on the applications of natural active compounds in type 2 diabetes (T2DM), derived from the Web of Science (Wos) database. Clustering analysis of keywords enables in-depth exploration of their inherent relationships and reveals underlying themes. Generally, a silhouette value greater than 0.7 indicates highly efficient and persuasive clustering, while values above 0.5 are considered reasonable [34]. In this analysis, the modularity Q value (Q = 0.316 > 0.3) and the mean silhouette score (S = 0.7179 > 0.5) confirm the effectiveness of the clustering. Figure 7 displays nine cluster modules, with significant overlap observed among clusters #0–#7, suggesting strong interconnections between them. Figure 7 displays nine cluster modules, with significant overlap observed between clusters #0–#7, indicating strong interconnections among them. Highly cited clusters—such as #1 (“metabolic syndrome”), #4 (“insulin resistance”), #5 (“reactive oxygen species”), and #7 (“mechanisms”)—represent areas with high academic recognition and should be prioritized for mechanistic exploration or clinical applications. The cluster distribution exhibits a “centralized head” pattern, with research hotspots primarily concentrated on mechanistic studies, reactive oxygen species, and insulin resistance. This suggests an overallocation of research resources to a limited number of directions. Policy interventions are needed to encourage diversified exploration, highlighting the necessity to strengthen studies beyond mechanistic investigations and address existing research gaps.

3.1.7. Keyword Burst Analysis

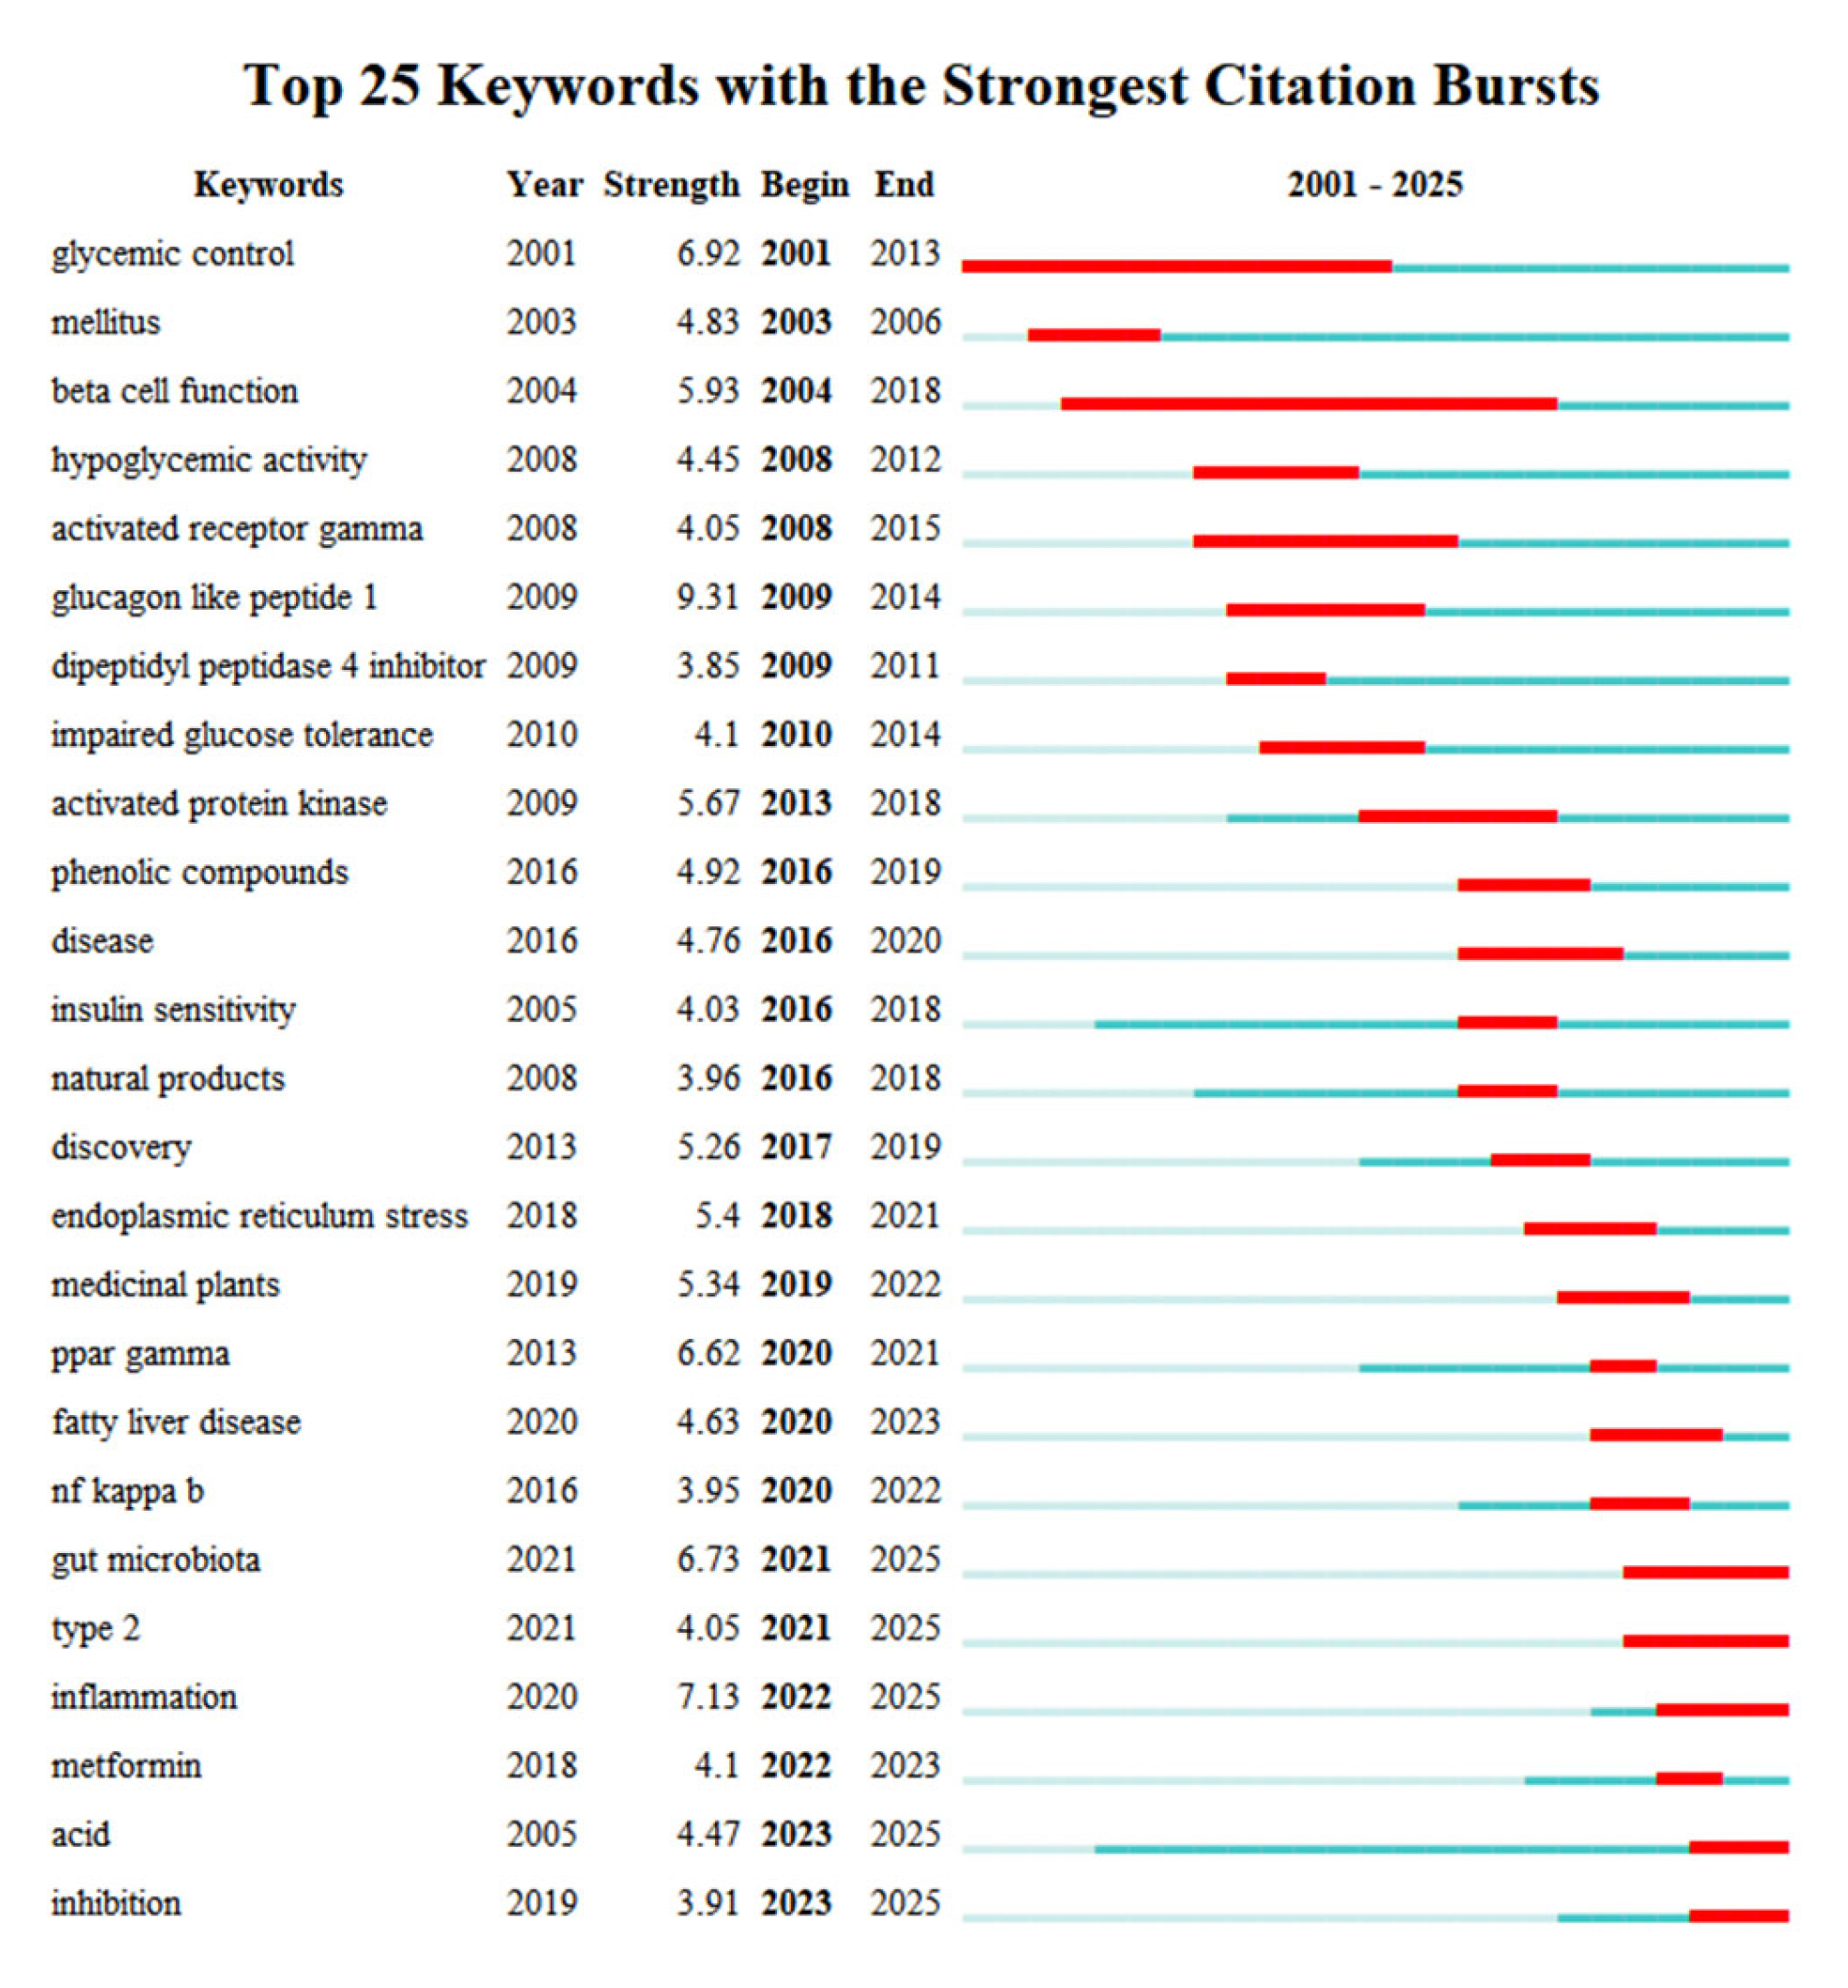
The sudden emergence of keywords often signifies the rise of new research hotspots in a field, with red and blue bars indicating burst years and non-burst years, respectively [35]. Figure 8 presents the results of keyword burst analysis for research on the applications of natural active compounds in type 2 diabetes (T2DM), derived from the Web of Science (WoS) database. This visualization highlights shifts in research hotspots within this domain. The keywords “glycemic control” and “beta cell function” exhibited the longest burst durations, spanning 13 years, suggesting that research during this period primarily focused on effective blood glucose reduction strategies. Starting from 2016, “natural products” and “medicinal plants” gained significant attention, indicating a growing scientific interest in the therapeutic applications of natural substances for T2DM. These studies not only provided scientific evidence for the antidiabetic effects of natural active compounds but also advanced the development and clinical application of related drugs. In the past five years, “acid”, “inhibition”, “inflammation”, and “gut microbiota” have emerged as research hotspots, suggesting that current investigations may place greater emphasis on the molecular mechanisms and influencing factors through which natural active compounds act on T2DM.

3.1.8. Timeline Visualization of Keyword Co-Occurrence and Burst Analysis

Based on keyword co-occurrence and burst detection analyses, a timeline visualization of keywords is presented in Figure 9. In this visualization nodes represent distinct co-occurring keywords, with larger node sizes indicating higher cumulative frequencies of the associated keywords. The position of nodes along the timeline marks the first occurrence of each keyword. Lines connecting nodes denote high correlations between keywords. Clusters signify different concentrations of expertise or thematic focuses [36,37,38]. From Figure 9, the following research trends emerge: In 2001–2010, research primarily centered on blood glucose control, insulin resistance, obesity, natural products, antioxidants, and reductase inhibitors, driving advancements in T2DM treatment. In 2011–2019, the focus shifted to oxidative stress, glucose metabolism, endoplasmic reticulum stress, skeletal muscle, gene expression, and drug discovery. Additionally, the diversity of animal experimental models became increasingly prominent. From 2020 to the present, research themes prioritized pathogenesis, drug activity, network pharmacology, gut microbiota, vitamin E, and lipid studies, indicating a transition toward higher-level research.

3.2. In Vitro Experiments

3.2.1. Effects of Three Natural Algal Active Substances on HepG2 Cell Viability

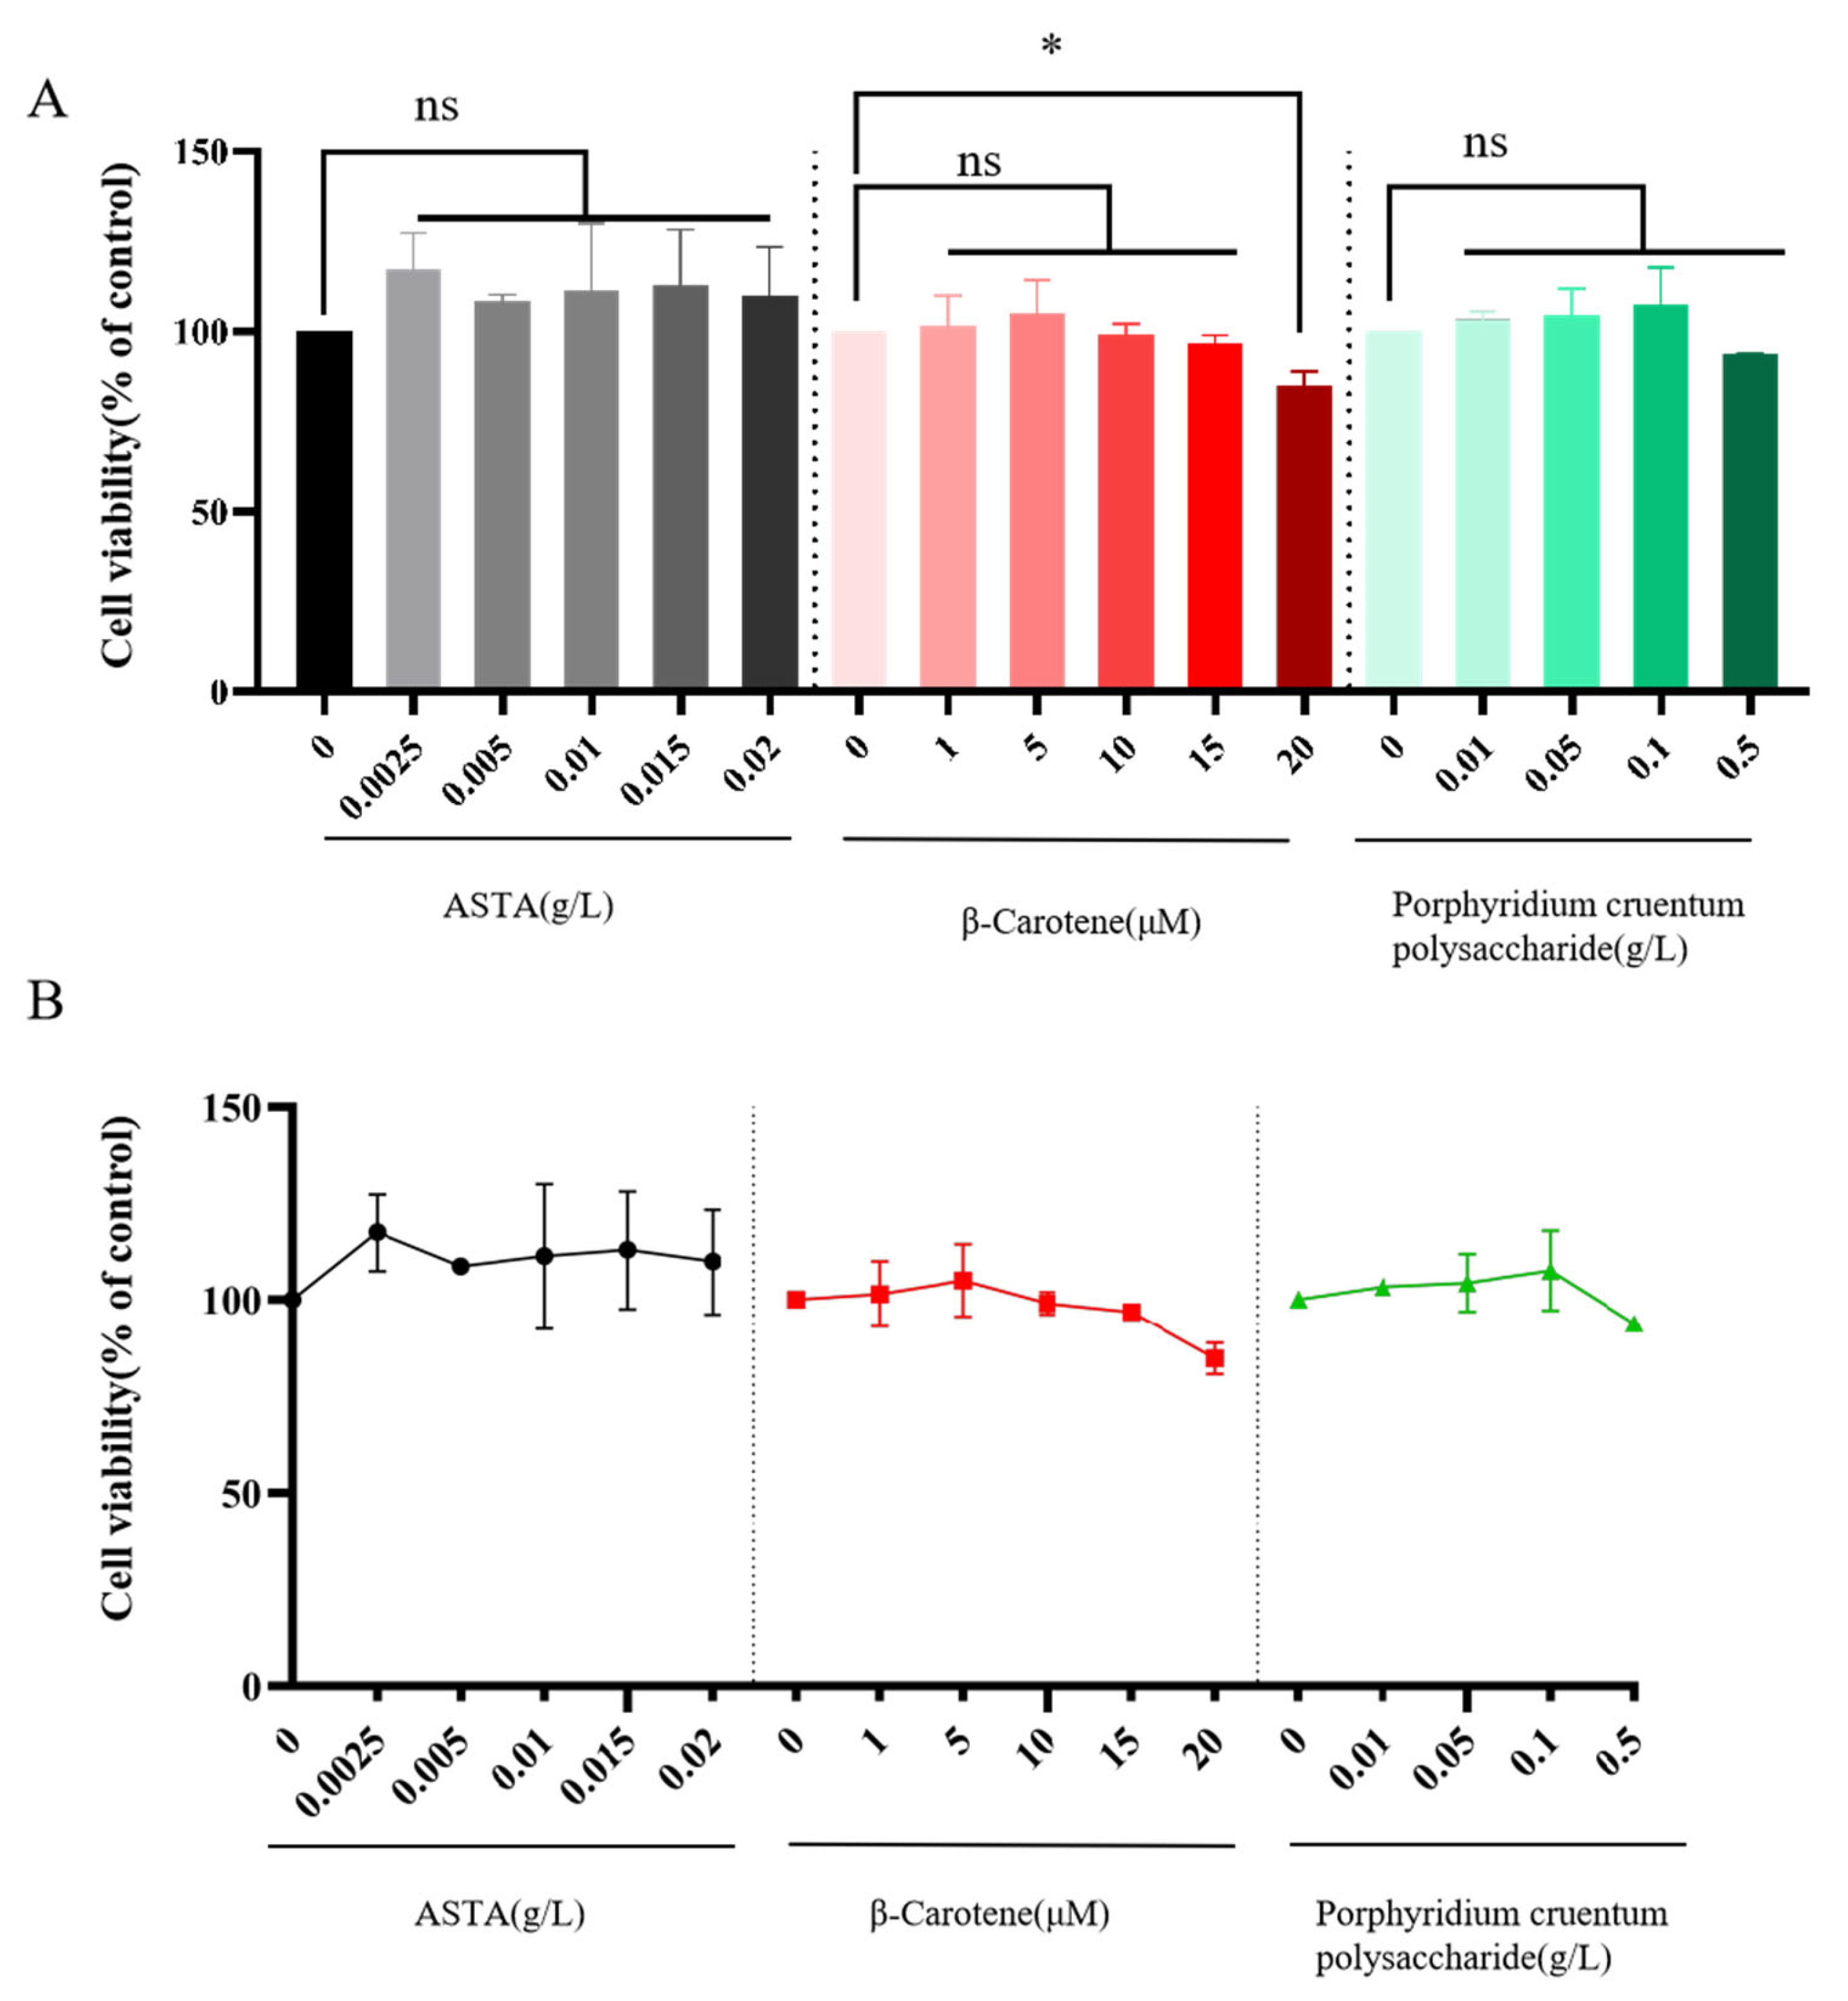
The results, as illustrated in Figure 10, are as follows: For astaxanthin, compared with the 0 g/L concentration, concentrations ranging from 0.0025 to 0.02 g/L exhibited no cytotoxic effects on HepG2 cell growth, and no significant differences were observed. Therefore, the safe working concentration range of 0–0.02 g/L was selected for subsequent experiments. For β-carotene, a significant difference was observed at the 20 μM concentration compared with the 0 μM control, with a cell viability rate of 84.83%. Concentrations ranging from 0 to 15 μM showed no cytotoxic effects on HepG2 cell growth, and no significant differences were detected. Consequently, the safe working concentration range of 1–15 μM was chosen for further experiments. For Porphyridium polysaccharide, when compared with the 0 g/L concentration, concentrations ranging from 0.01 to 0.5 g/L showed no cytotoxic effects on HepG2 cell growth, and no significant differences were detected. Thus, the safe working concentration range of 0.01–0.5 g/L was selected for subsequent experiments.

3.2.2. Effects of Three Natural Algal Active Substances on Glucose Consumption in IR-HepG2 Cells

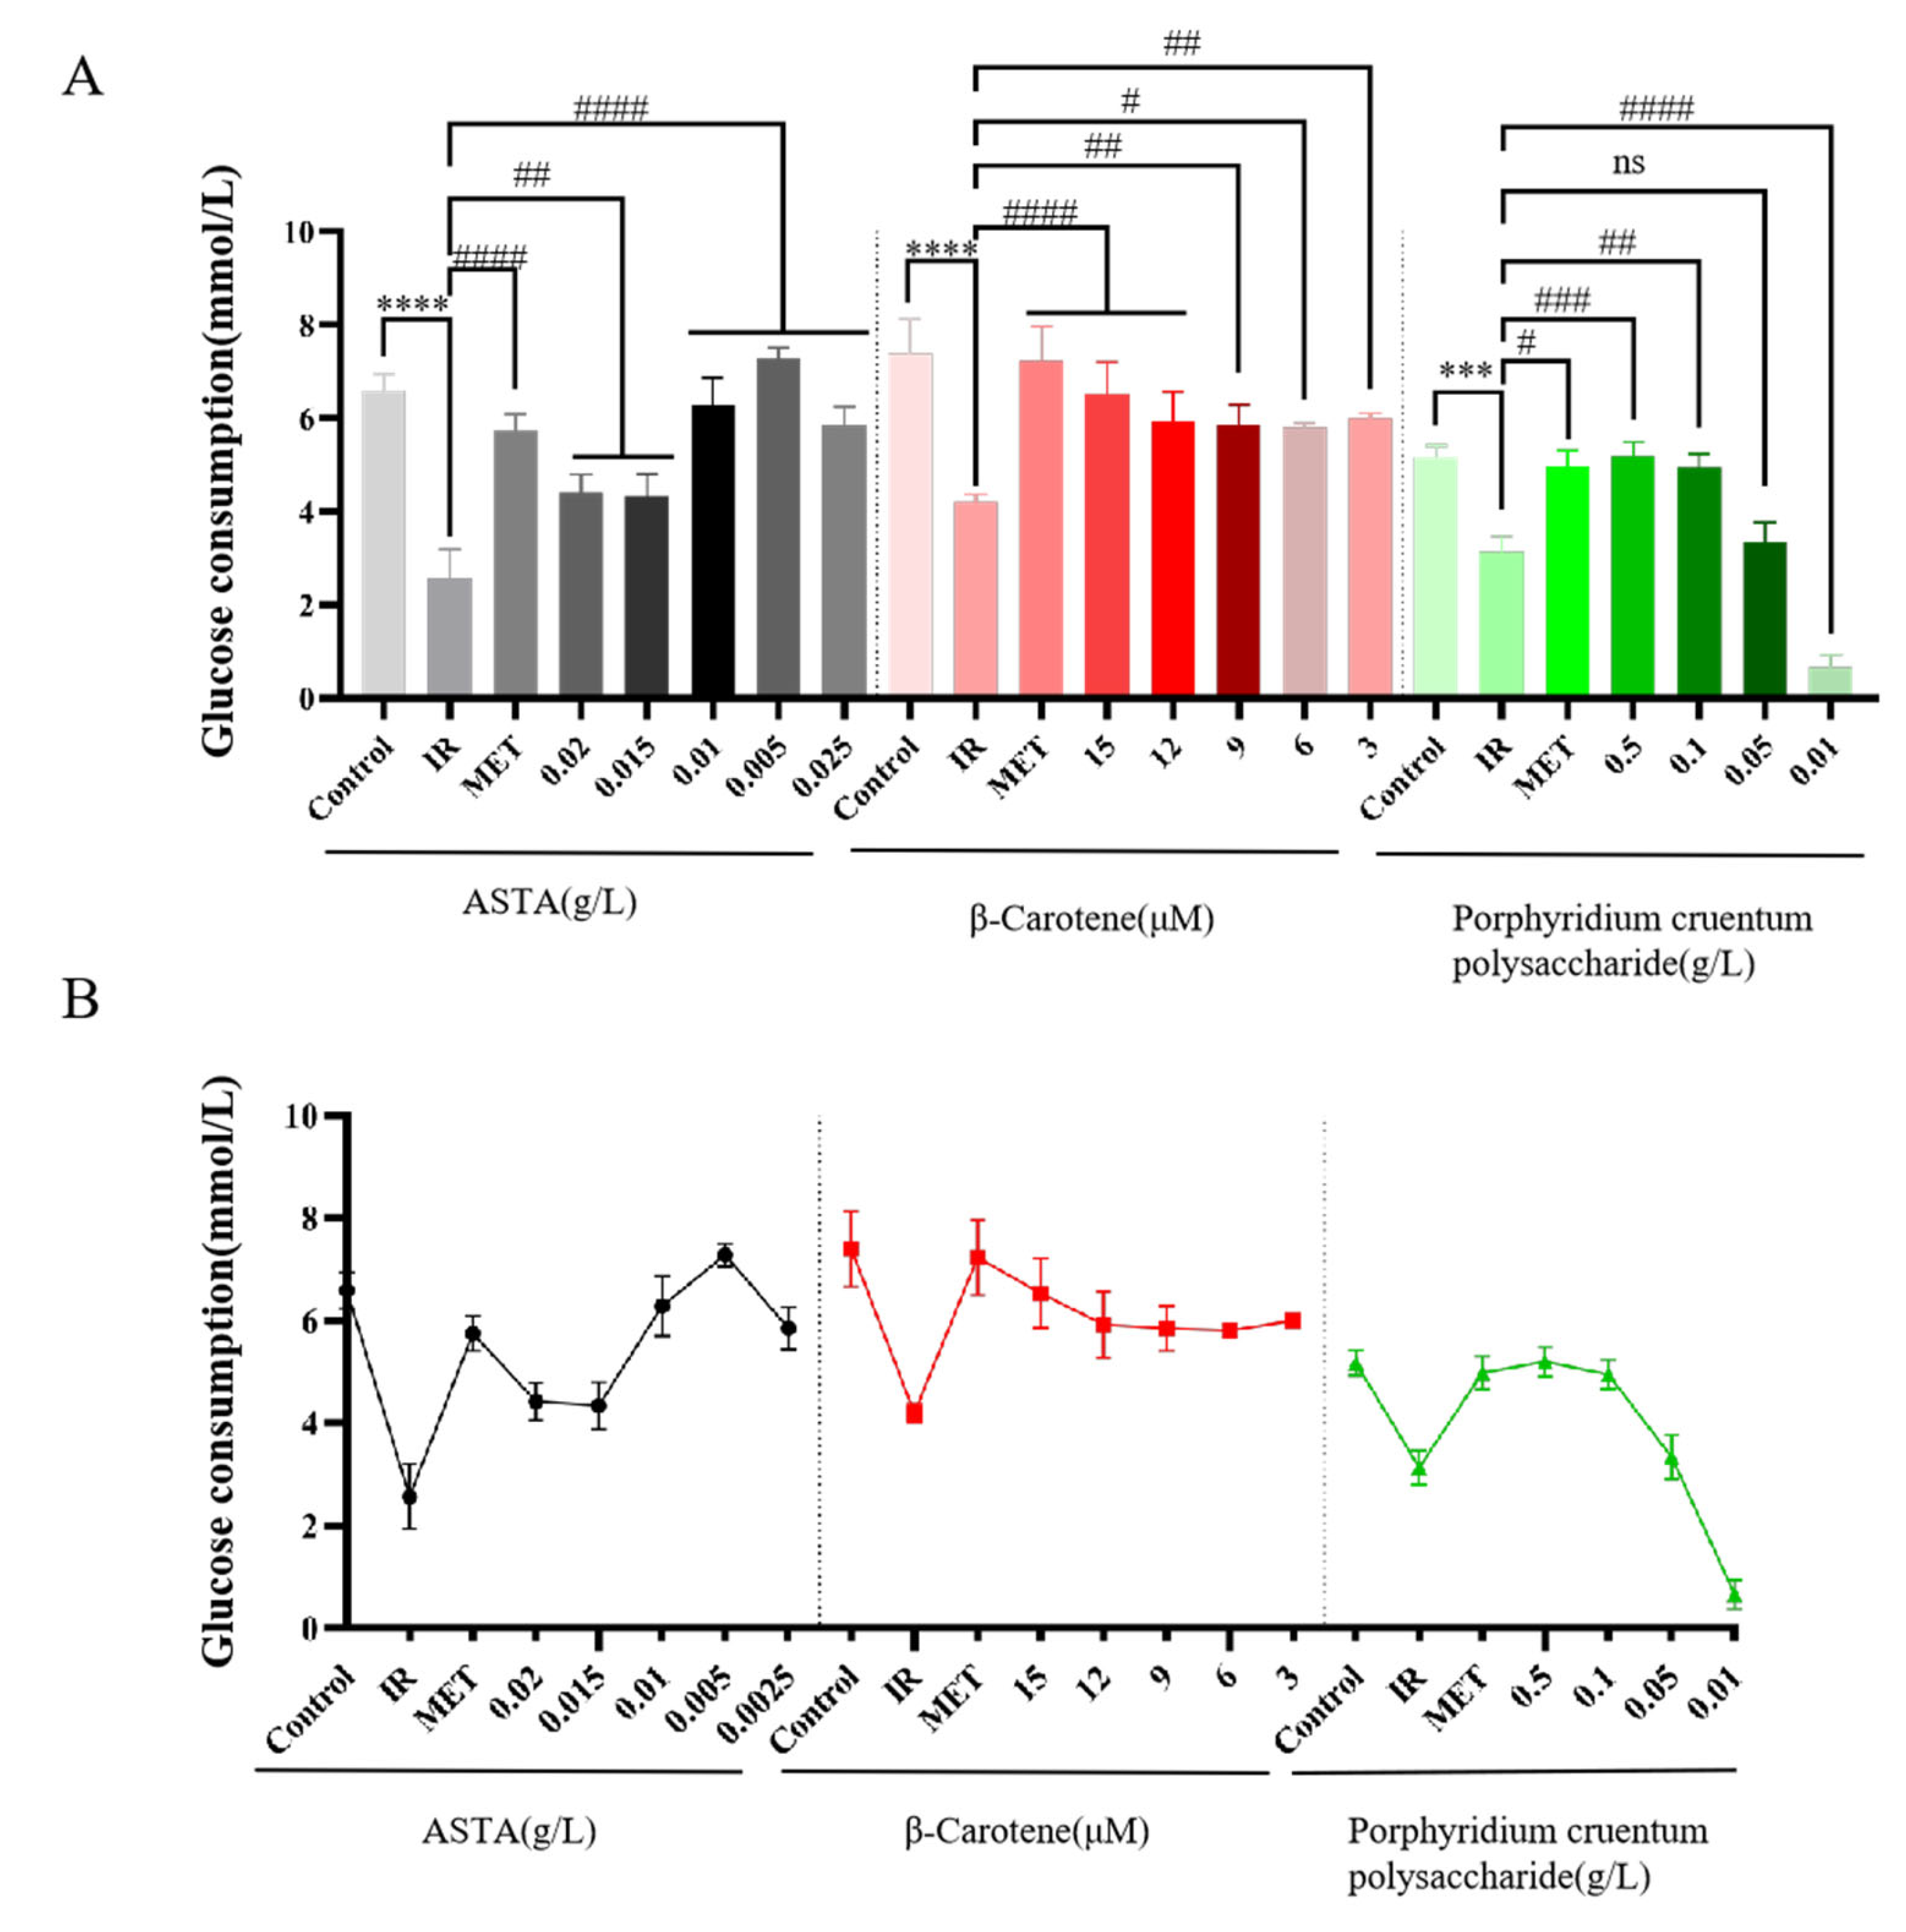
The results, as depicted in Figure 11, are as follows: The glucose consumption in the insulin-resistant (IR) group was significantly lower than that in the control group (p < 0.001), indicating the establishment of an IR state in this group. Compared with their respective control groups, the positive control group and the sample groups treated with astaxanthin, β-carotene, and Porphyridium polysaccharide all demonstrated an ability to enhance glucose consumption to varying degrees, with all differences being statistically significant. Compared with the model group, astaxanthin, β-carotene, and Porphyridium polysaccharide could increase glucose consumption by at least 65.23%, 39.38%, and 6.7%, respectively. These findings suggest that these three algal active substances can improve the IR state of the cells. Among them, astaxanthin at concentrations of 0.05 g/L and 0.01 g/L exhibited the most pronounced effects, with efficacy comparable to or even exceeding that of the positive control group. For the β-carotene and Porphyridium polysaccharide groups, higher concentrations of the samples led to greater increases in glucose consumption.

3.2.3. Effects of Three Natural Algal Active Substances on Glycogen Content in IR-HepG2 Cells

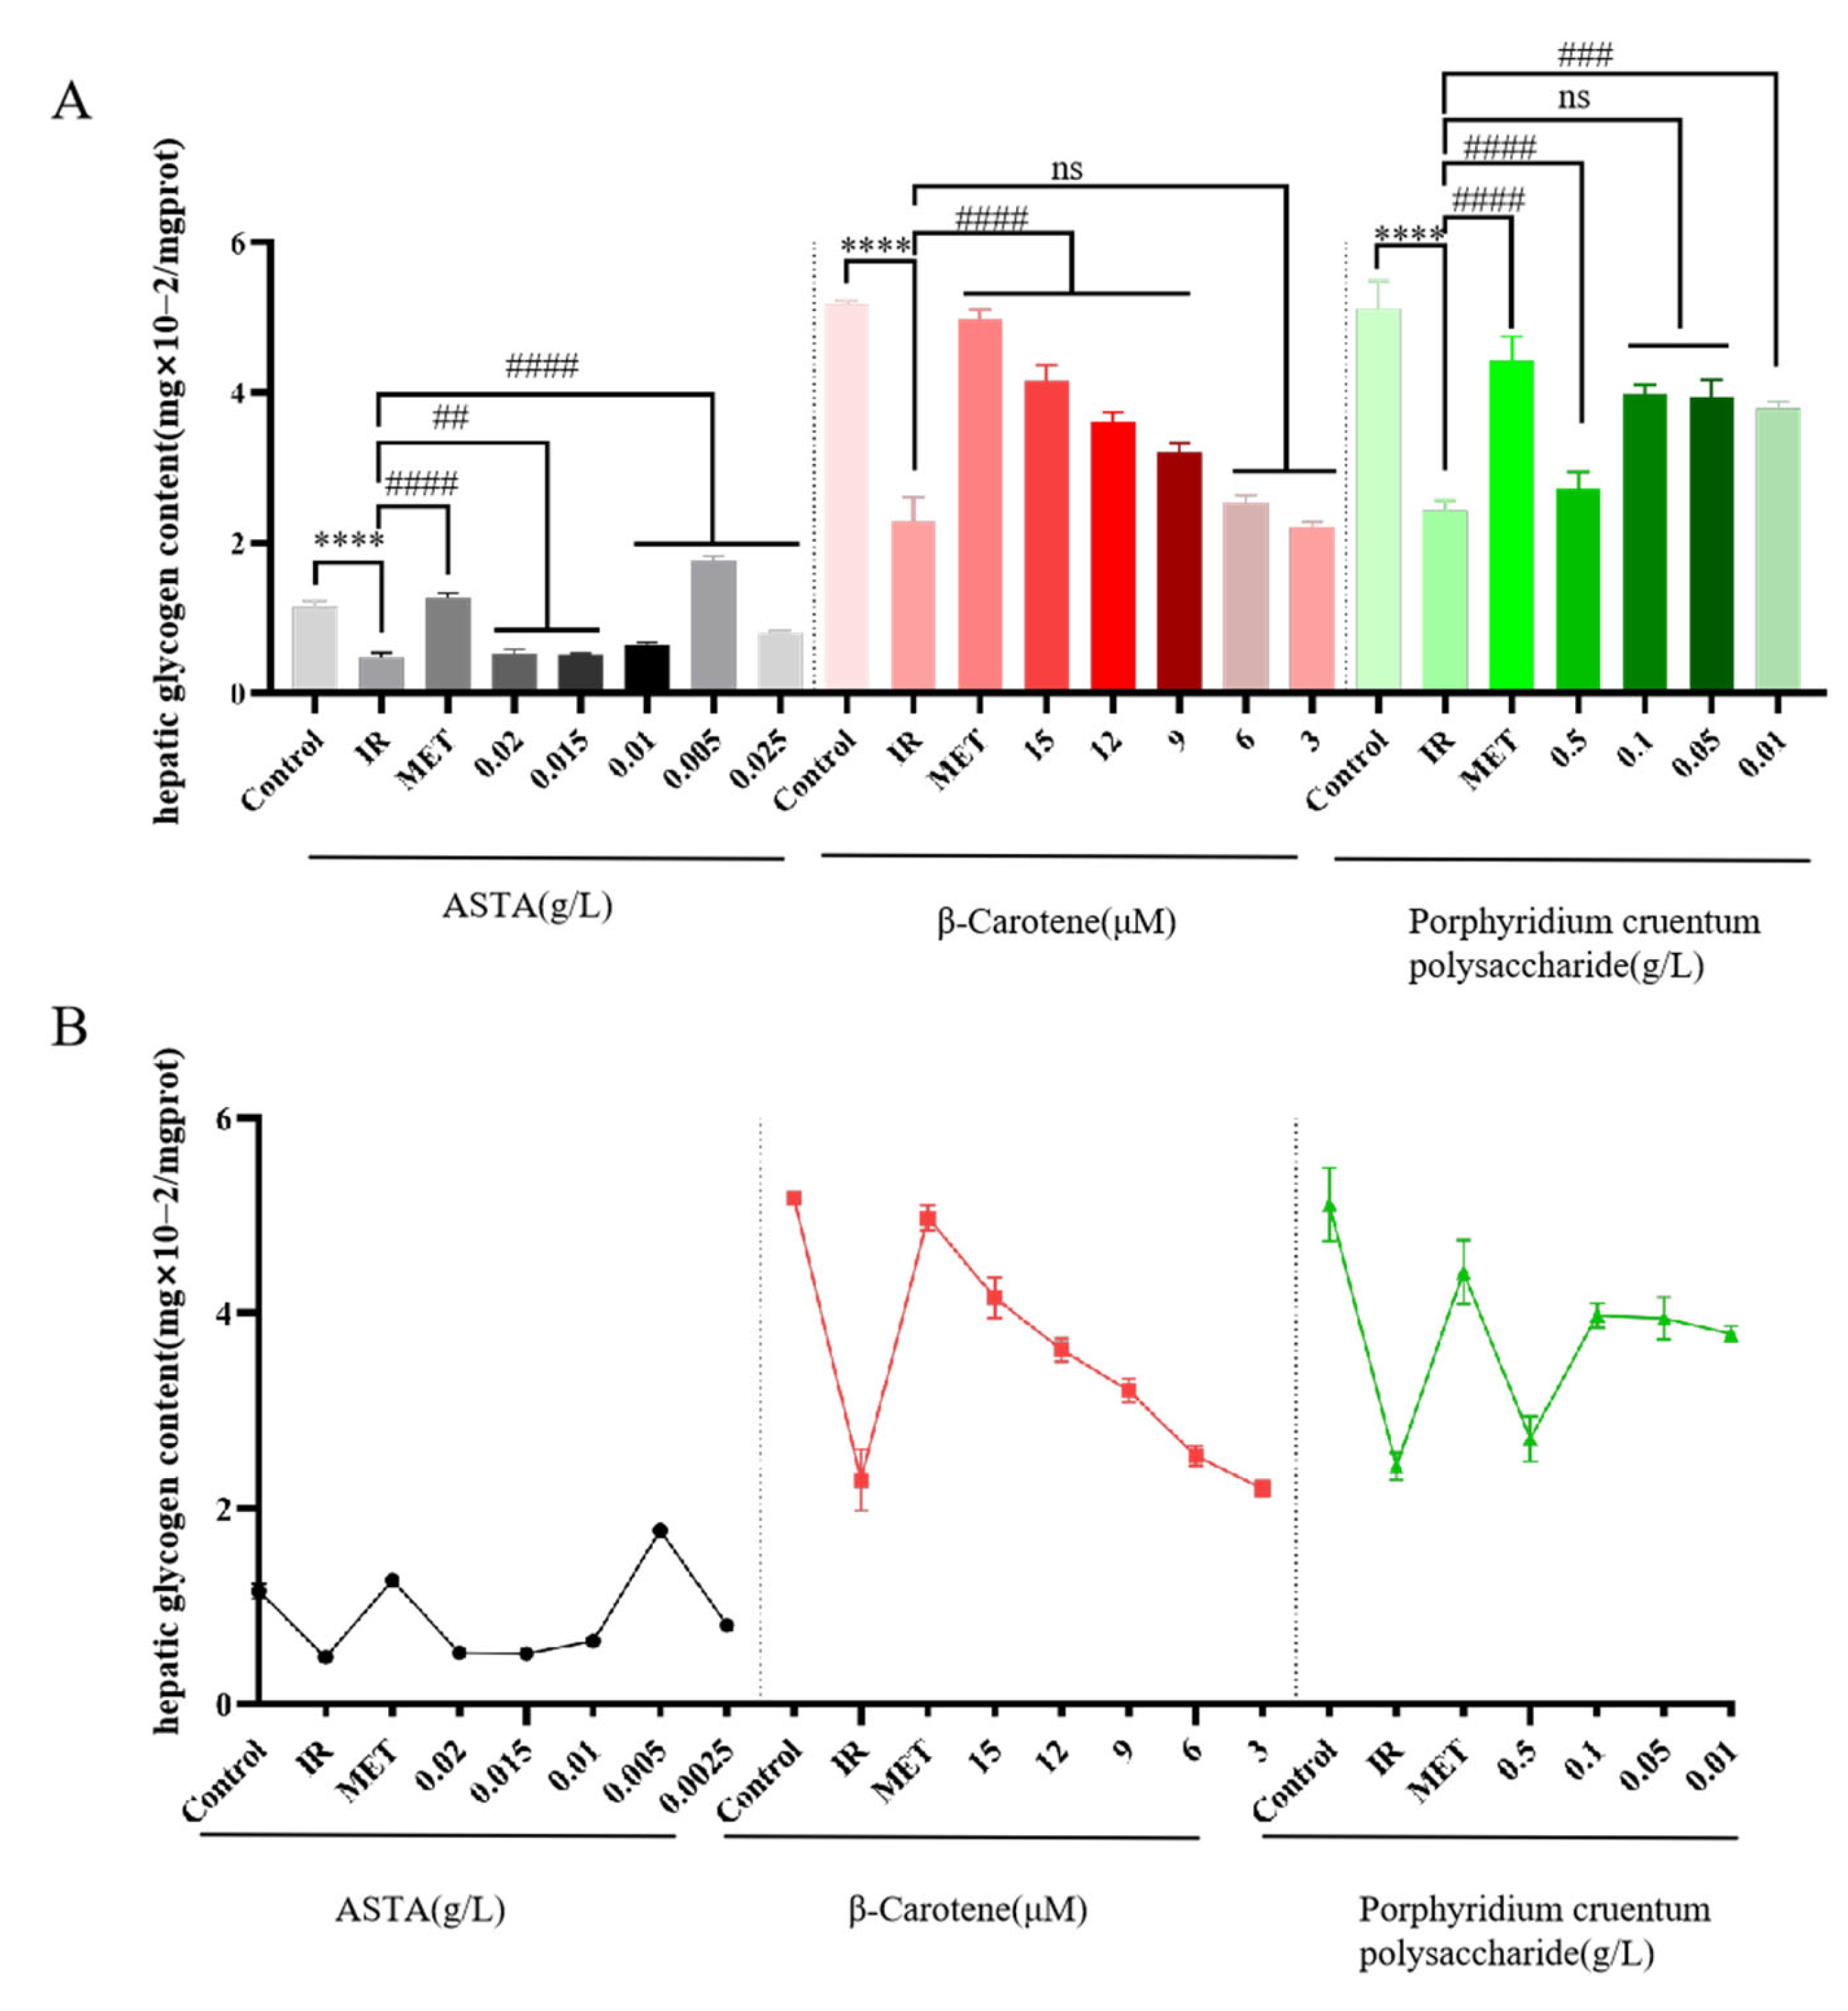
The results, as illustrated in Figure 12, are as follows: In the IR-HepG2 cell model group treated with insulin, glycogen content was significantly lower compared with the normal control group (p < 0.001), indicating impaired glycogen synthesis under IR conditions. Compared with the model group, both the positive control group and the sample groups (treated with astaxanthin, β-carotene, and Porphyridium polysaccharide) increased intracellular glycogen content in IR-HepG2 cells, thereby promoting glucose metabolism and exerting hypoglycemic effects. Among them, astaxanthin at concentrations of 0.025–0.05 g/L effectively increased glycogen content, with a minimum increase of 10.42%. There was no significant difference between the 0.05 g/L astaxanthin group and its corresponding control group. For β-carotene, glycogen content increased in a dose-dependent manner with increasing concentration. Although its efficacy did not reach that of the positive control group, high concentrations could still increase glycogen content by up to 81.66%. Low concentrations of Porphyridium polysaccharide (0.01, 0.05, and 0.1 mg/mL) could enhance glycogen content in IR-HepG2 cells, with increases ranging from 55.97% to 63.79%, while high concentrations of Porphyridium polysaccharide were not conducive to glycogen synthesis in HepG2 cells.

3.2.4. Effects of Three Natural Algal Active Substances on Pyruvate Kinase Activity in IR-HepG2 Cells

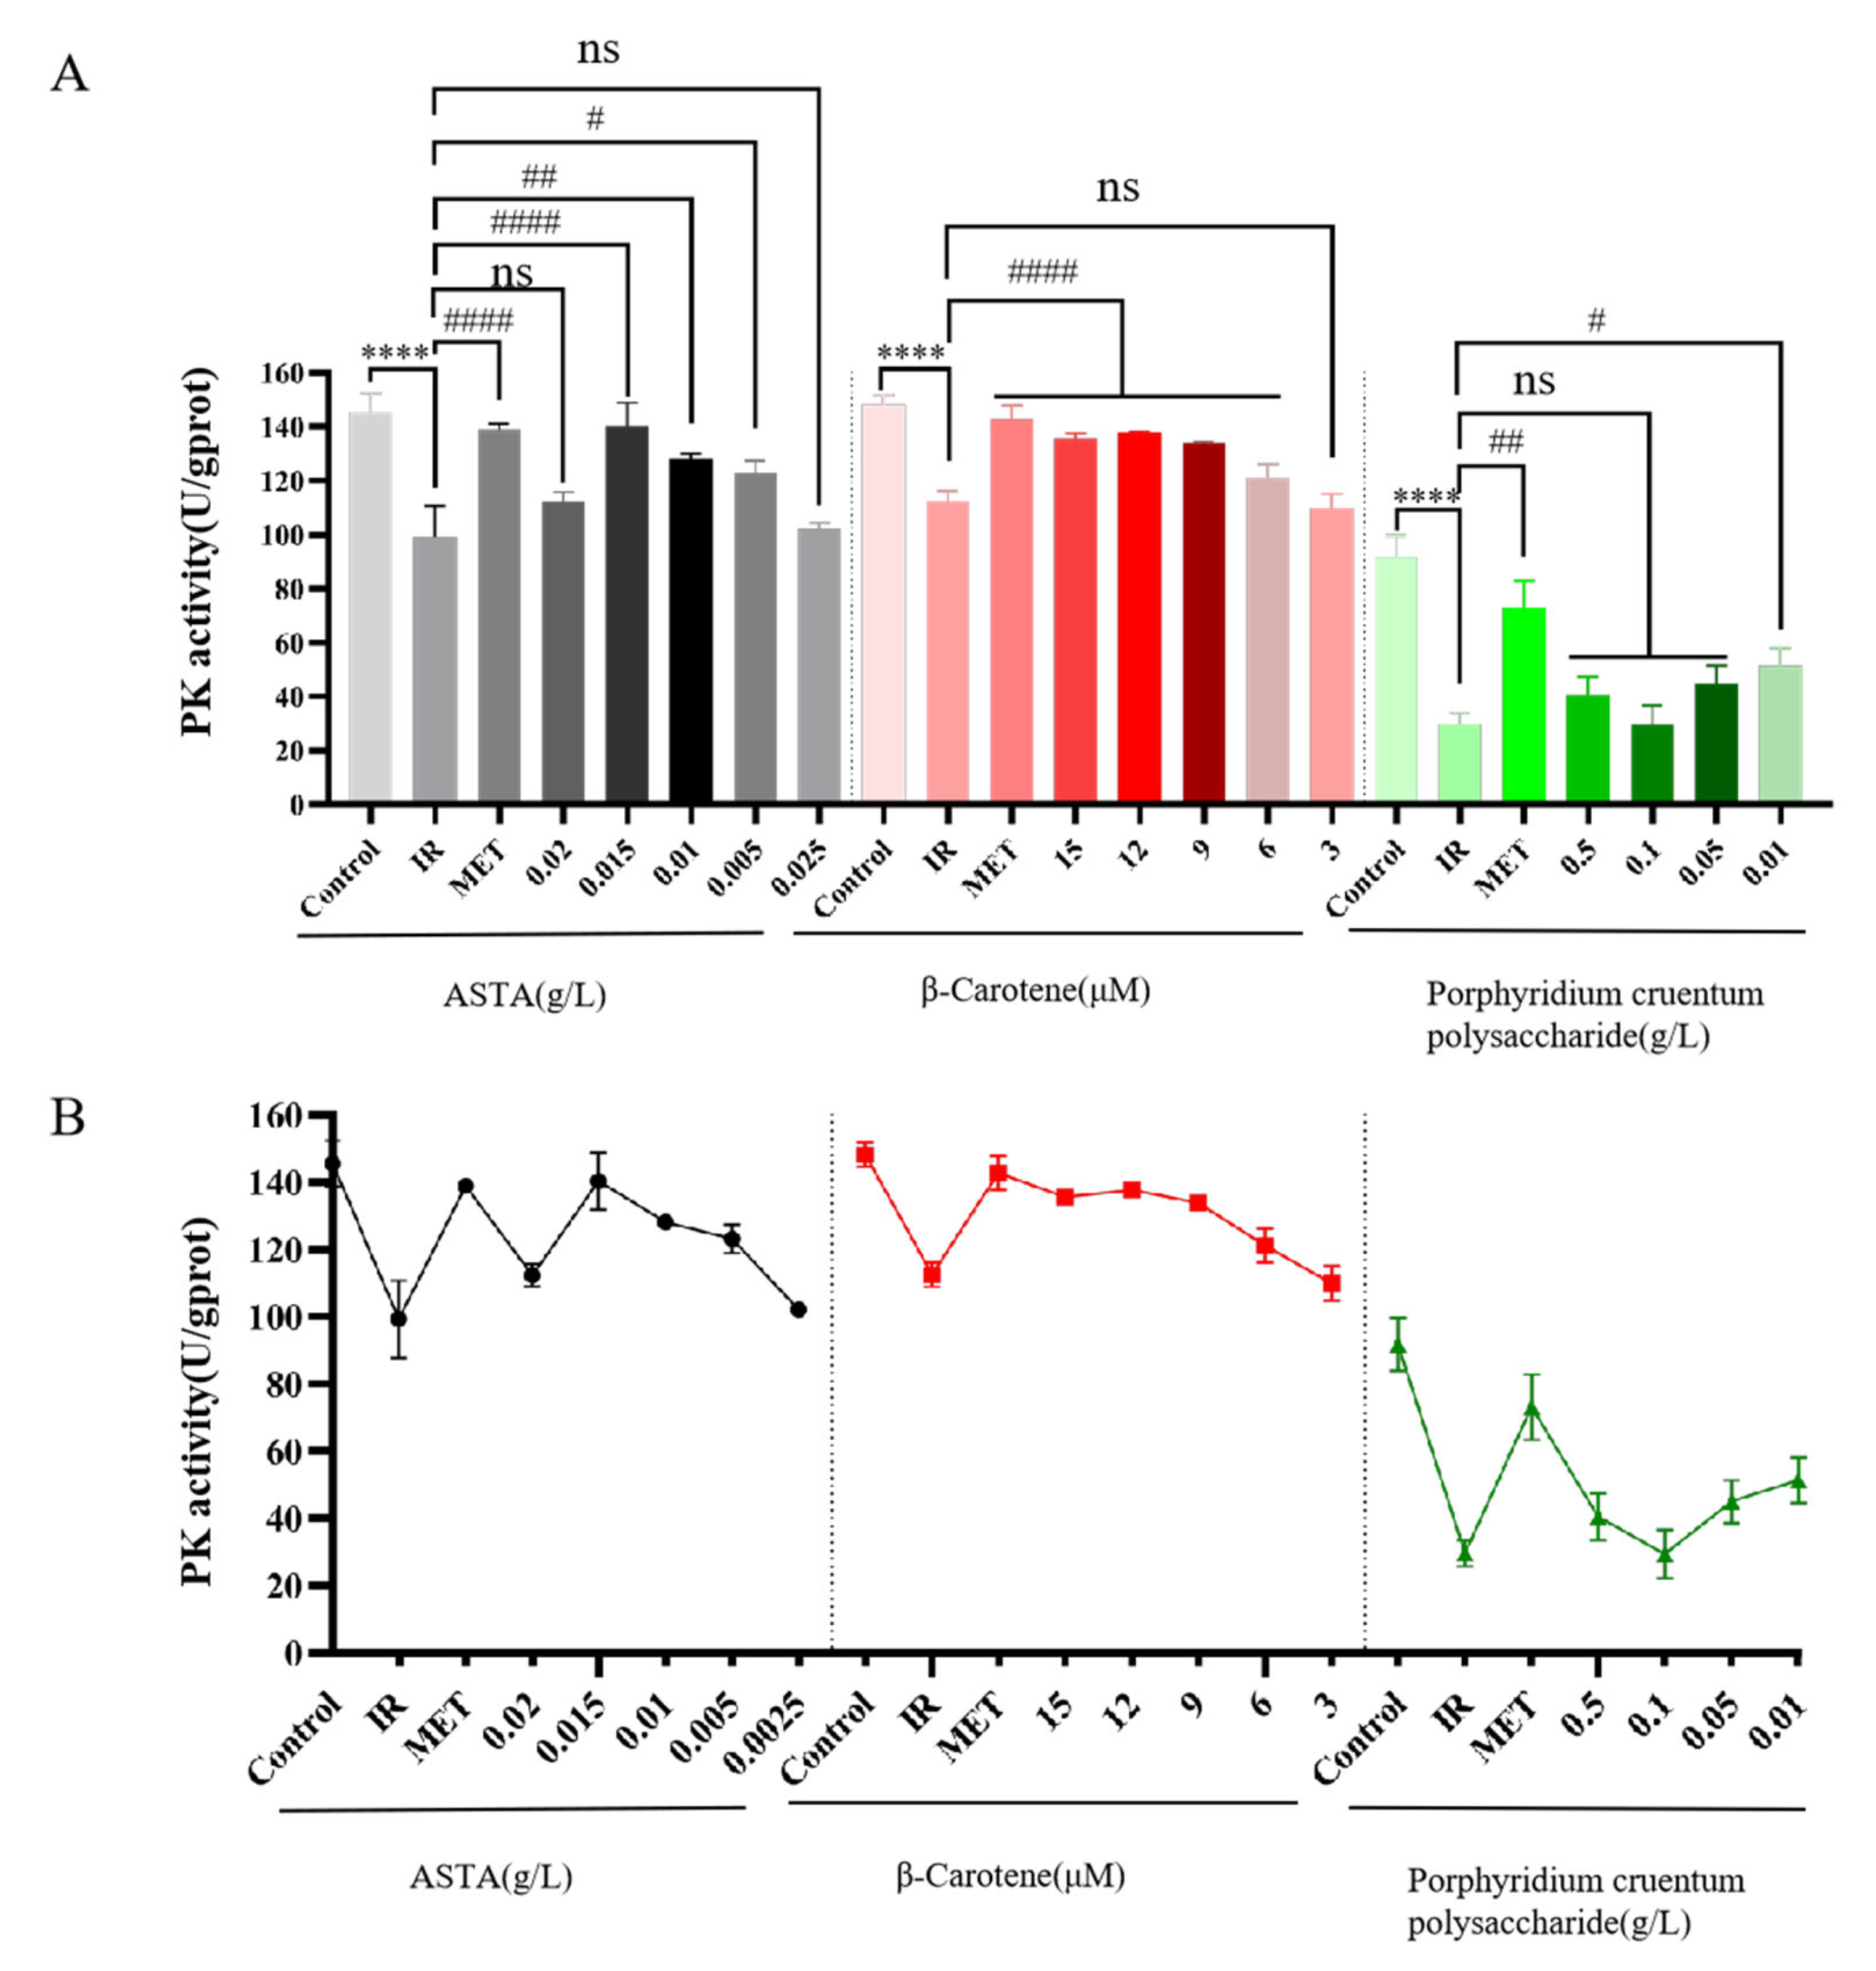
The results, as depicted in Figure 13, are as follows: In the IR-HepG2 cell model group treated with insulin, glycogen content was significantly lower compared with the normal control group (p < 0.001), indicating impaired glycogen synthesis under IR conditions. Compared with the model group, the positive control group exhibited increased pyruvate kinase activity, with the difference being statistically significant (p < 0.01). For astaxanthin, as the concentration increased from 0.005 to 0.015 g/L, pyruvate kinase activity gradually rose, with an increase of 24.17% to 41.46%, and the therapeutic effect approached that of the positive control group. However, although a high concentration of 0.02 g/L astaxanthin also increased pyruvate kinase activity, its therapeutic effect was not as pronounced as that of the medium concentration. For β-carotene, pyruvate kinase activity initially increased and then plateaued with increasing concentration, resulting in an increase in activity of 7.7% to 22.42%. Treatment with 0.01 g/L Porphyridium polysaccharide enhanced pyruvate kinase activity in IR-HepG2 cells. Although concentrations of 0.05–0.5 g/L Porphyridium polysaccharide also improved pyruvate kinase activity in HepG2 cells, the differences were not statistically significant.

4. Discussion

Natural products have long served as a crucial source of potential lead compounds and a primary channel for innovative drug discovery, making significant contributions to disease treatment throughout history. According to statistics, approximately 40% of new drugs globally over the past two decades have originated from natural products, while 60% of anticancer drugs and 75% of anti-infective agents are derived from natural sources [39]. The natural substance artemisinin, extracted from Artemisia annua (sweet wormwood), has led to a 47% reduction in malaria mortality rates, making a tremendous contribution to global malaria prevention and control. Therefore, the integration of natural active substances with medicine represents an effective approach for treating diseases and is a vital means of adapting pharmaceutical development to societal needs and contemporary trends.
Type 2 diabetes mellitus is, to date, one of the most prevalent forms of diabetes, accounting for 90% of diabetes cases and representing the most common and clinically significant metabolic disorder [40]. According to the International Diabetes Federation (IDF), the incidence of T2DM continues to rise, with 387 million people currently living with diabetes, a number projected to increase to 592 million by 2035 [41]. Current data from China indicate a gradual increase in the prevalence of adult diabetes, reaching 10.4% in 2013, with projections suggesting that the number of diabetic patients will reach 130 million by 2030. Furthermore, T2DM and its complications significantly elevate the risk of premature mortality in patients and impose substantial economic burdens on individuals and their families. In 2015, the direct cost of diabetes in China was estimated at USD 141.58 billion, accounting for 1.3% of the gross domestic product (GDP) [42]. Although various synthetic antidiabetic drugs are currently in clinical use, these medications often entail multiple side effects, such as weight gain, liver and gastrointestinal disturbances, and heart failure, thereby limiting their applicability [43]. In contrast, natural active substances have garnered attention due to their lower toxicity and fewer adverse reactions. For instance, the polysaccharide PCPs-I extracted from Polygonum cuspidatum has demonstrated significant antidiabetic effects. PCPs-I not only effectively inhibits α-glucosidase activity to lower blood glucose levels but also alleviates T2DM symptoms by modulating the gut microbiota composition [44]. These natural active substances, typically characterized by minimal toxicity and adverse reactions, offer new therapeutic options for T2DM patients.
Glycogen synthesis and degradation constitute key metabolic pathways through which the liver regulates blood glucose levels. Under IR conditions, the body’s sensitivity to insulin diminishes, directly impairing insulin’s ability to promote hepatic glycogen synthesis and disrupting blood glucose regulation mechanisms [40]. Consequently, glycogen content serves as a critical indicator for evaluating the efficacy of drug interventions. Pyruvate kinase (PK), a central enzyme in the intracellular glycolytic pathway, catalyzes the conversion of phosphoenolpyruvate (PEP) to pyruvate. Under IR conditions, PK activity declines, reducing cellular glucose uptake and utilization and potentially leading to elevated blood glucose levels [45]. Therefore, enhancing PK activity can improve cellular glucose utilization and mitigate the adverse effects of IR. This study aimed to validate the therapeutic effects of certain natural active substances on T2DM by measuring these indicators. Astaxanthin can reduce oxidative stress-induced damage to pancreatic β-cells, thereby protecting pancreatic β-cell function and contributing to the normal secretion of insulin. Insulin promotes the uptake of glucose into cells, which in turn enhances glucose consumption and glycogen synthesis. Additionally, astaxanthin can regulate the activity of enzymes involved in glucose metabolism, such as pyruvate kinase (PK), to facilitate the glycolytic process and accelerate glucose consumption and utilization [46]. Studies have demonstrated that astaxanthin alleviates insulin resistance through the PTP1B/PI3K/Akt signaling pathway [47]. β-Carotene can significantly enhance the sensitivity of insulin receptors, enabling cells to better utilize glucose. This makes cells more responsive to insulin, promoting glucose uptake into cells, increasing glucose consumption, and facilitating glycogen synthesis. β-Carotene can also prevent oxidative reactions by scavenging free radicals, activating the cellular antioxidant enzyme system, and regulating the expression of genes related to glucose metabolism, thereby promoting glucose metabolism [48]. In gestational diabetes mellitus, β-carotene promotes glucose transport and suppresses insulin resistance by increasing the expression of SHBG [49]. Porphyridium polysaccharide can promote glucose uptake and utilization, increase glucose consumption, and facilitate glycogen synthesis by regulating the secretion and action of hormones involved in glucose metabolism, such as insulin, thus directly or indirectly activating enzymes related to glucose metabolism, like PK, and improving the body’s immune status and metabolic environment [50]. Current research has not yet directly elucidated the specific signaling pathways through which Porphyridium polysaccharides ameliorate insulin resistance. However, existing literature indicates that Chlorella pyrenoidosa polysaccharides can improve insulin resistance via the IL-6R/FOXO-1 and GLP-1R/FOXO-1 pathways [51].
The results indicate that, based on the number of publications on natural active substances and T2DM over the past 25 years, research in this area has emerged as a relatively recent direction in the last decade, with a later start compared with other fields but exhibiting an upward trend and a diverse, comprehensive development. By integrating multi-dimensional indicators such as publication volume, collaboration networks, research institutions, leading authors, and citation analysis, a comprehensive analysis reveals that China and the United States are in a leading position in this research field. Keyword analysis highlights recent research hotspots focusing on pathogenesis, pharmacological activity, the gut microbiota, and lipids.
Experimental results demonstrate that astaxanthin, β-carotene, and Porphyridium polysaccharide had certain intervention effects on T2DM. In terms of glucose consumption, astaxanthin at 0.0025–0.01 g/L, Porphyridium polysaccharide at 0.1–0.5 g/L, and β-carotene at 3–15 μM showed no significant differences compared with the positive control group. Regarding glycogen content, astaxanthin at 0.005 g/L and Porphyridium polysaccharide at 0.01–0.1 g/L exhibited no significant differences compared with the positive control group. In terms of pyruvate kinase activity, Porphyridium polysaccharide demonstrated a relatively weaker intervention effect compared with astaxanthin and β-carotene. Based on a comprehensive analysis of intervention efficacy and resource conservation, we rank the therapeutic effects as follows: astaxanthin, β-carotene, and then Porphyridium polysaccharide. These findings provide important biological data references and theoretical support for the treatment of diseases using natural products. The study is limited to in vitro experiments and requires further complexity simulation and in vivo validation. Moreover, the clinical translation of algal bioactive compounds follows a stepwise research progression encompassing “in vitro mechanistic studies, animal validation, and human trials.” It is essential to elucidate their chemical structures and conduct in vivo evaluations to assess efficacy and safety. Finally, safety testing in healthy volunteers and dose optimization/efficacy verification in diabetic patients should be performed. Consequently, researchers may further develop clinically translational therapeutic strategies in the future, offering significant insights for the development of natural product-based drugs.
Based on the aforementioned research, algae can be incorporated into daily diets to provide bioactive compounds while increasing dietary fiber and essential minerals (e.g., magnesium, zinc), synergistically improving metabolic health and promoting a structured, balanced dietary pattern [52]. For instance, algal polysaccharides can serve as low-glycemic-index (GI) ingredients to partially replace staple foods, thereby supporting glycemic homeostasis. Furthermore, combining astaxanthin-rich sources (e.g., Haematococcus pluvialis) and β-carotene-rich foods (e.g., carrots, leafy greens) forms an anti-inflammatory and antioxidant dietary framework (e.g., a Mediterranean-style diet). Notably, diabetic patients often exhibit deficiencies in antioxidants such as vitamins E and C. Astaxanthin supplementation may compensate for this gap, particularly in individuals with inadequate fruit and vegetable intake [53]. A tiered prevention system can be established: Primary prevention (healthy populations), where a dietary model of “algae + whole grains + dark-colored vegetables”, with a daily intake of 10–20 g algae (e.g., nori, spirulina) and ≥6 mg β-carotene (equivalent to ~100 g carrots) is promoted. Secondary prevention (prediabetic individuals), in which astaxanthin (4–8 mg/day) or algal polysaccharide extracts are used as supplements alongside lifestyle interventions to delay disease progression. Diabetic patients should consume ≥500 g/day of dark-colored vegetables, with β-carotene-rich varieties (e.g., carrots) constituting ≥30% of intake [54]. Tertiary management (diagnosed patients), employed for those with diabetic nephropathy and where β-carotene may replace animal-derived vitamin A sources (e.g., liver, egg yolk) to reduce phosphorus burden. In confirmed cases, adjunctive use of algal bioactive compounds (e.g., astaxanthin for ocular protection, β-carotene for renal protection) alongside pharmacotherapy may mitigate complications. This approach strengthens the link between algal bioactive compounds, dietary strategies, and public health initiatives, encouraging patients to adopt optimized solutions.

5. Conclusions

By employing a strategy that combines bibliometrics with in vitro cellular experiments, we systematically reviewed and visualized the annual research trends, institutional and author distributions, as well as research hotspots in the field of natural active substances and type 2 diabetes mellitus (T2DM). We also investigated the intervention effects of algae-derived natural active substances—astaxanthin, β-carotene, and Porphyridium polysaccharide—on type 2 diabetes mellitus. All three substances can, to a certain extent, increase glucose consumption, elevate glycogen content, and enhance pyruvate kinase activity in IR-HepG2 cells, thereby improving and restoring the cellular state of IR-HepG2 cells. The therapeutic efficacy, in descending order, is astaxanthin, followed by β-carotene, and then Porphyridium polysaccharide. Bibliometric analysis shows that natural active substances are gaining more focus in T2DM research, but efficacy mechanism studies lag. In vitro experiments confirm that astaxanthin, β-carotene, and Porphyridium polysaccharide improve glucose metabolism, providing a theoretical foundation for the development of novel hypoglycemic drugs. In conclusion, natural products are likely to emerge as promising components for treating T2DM and its complications.

Author Contributions

Writing—original draft preparation and investigation, R.C., H.Z. and S.W.; writing—review and editing, N.Y. and K.L.; validation, N.Y., H.Z., J.C., P.W. and X.L.; funding acquisition, supervision, project administration, and writing—review and editing, Z.Z. and R.Z. All authors have read and agreed to the published version of the manuscript.

Funding

This research was supported by Special Fund for New R&D Institutions in Jiaxing City (Phase IV, Yangtze Delta Region Institute of Tsinghua University, Zhejiang, No. LZZLX24B002).

Institutional Review Board Statement

Not applicable.

Informed Consent Statement

Not applicable.

Data Availability Statement

The datasets used and/or analyzed during the current study are available from the corresponding author on reasonable request.

Acknowledgments

We appreciate the support of the marine industry science and technology project of the Zhejiang marine economic development department.

Conflicts of Interest

The authors declare that they have no known competing financial interests or personal relationships that could have appeared to influence the work reported in this paper.

References

  1. Zhao, S.; Zhu, Y.; Schultz, R.D.; Li, N.; He, Z.; Zhang, Z.; Caron, A.; Zhu, Q.; Sun, K.; Xiong, W.; et al. Partial Leptin Reduction as an Insulin Sensitization and Weight Loss Strategy. Cell Metab. 2019, 30, 706–719. [Google Scholar] [CrossRef]
  2. Landon, R.; Gueguen, V.; Petite, H.; Letourneur, D.; Pavon-Djavid, G.; Anagnostou, F. Impact of astaxanthin on diabetes pathogenesis and chronic complications. Mar. Drugs 2020, 18, 357. [Google Scholar] [CrossRef]
  3. Newsholme, P.; Cruzat, V.F.; Keane, K.N.; Carlessi, R.; de Bittencourt, P.I.H. Molecular mechanisms of ROS production and oxidative stress in diabetes. Biochem. J. 2016, 473, 4527–4550. [Google Scholar] [CrossRef] [PubMed]
  4. Rehman, K.; Akash, M.S.H. Mechanism of Generation of Oxidative Stress and Pathophysiology of Type 2 Diabetes Mellitus: How Are They Interlinked? Oxidative Stress and diabetes mellitus. Cell Biochem. 2017, 118, 3577–3585. [Google Scholar] [CrossRef] [PubMed]
  5. Lu, D.Y.; Che, J.Y.; Yarla, N.S.; Wu, H.Y.; Lu, T.R.; Xu, B.; Zhu, H. Type 2 diabetes treatment and drug development study. Open Diabetes J. 2018, 8, 1. [Google Scholar] [CrossRef]
  6. Vladkova, T.; Georgieva, N.; Staneva, A.; Gospodinova, D. Recent progress in antioxidant active substances from marine biota. Antioxidants 2022, 11, 439. [Google Scholar] [CrossRef]
  7. Ambati, R.R.; Moi, P.S.; Ravi, S.; Aswathanarayana, R.G. Astaxanthin: Sources, extraction, stability, biological activities and its commercial applications—A review. Mar. Drugs 2014, 12, 128–152. [Google Scholar] [CrossRef]
  8. Routray, W.; Dave, D.; Cheema, S.K.; Ramakrishnan, V.V.; Pohling, J. Biorefinery approach and environment-friendly extraction for sustainable production of astaxanthin from marine wastes. Crit. Rev. Biotechnol. 2019, 39, 469–488. [Google Scholar] [CrossRef]
  9. Mashhadi, N.S.; Zakerkish, M.; Mohammadiasl, J.; Zarei, M.; Mohammadshahi, M.; Haghighizadeh, M.H. Astaxanthin improves glucose metabolism and reduces blood pressure in patients with type 2 diabetes mellitus. Asia Pac. J. Clin. Nutr. 2018, 27, 341–346. [Google Scholar]
  10. Arunkumar, E.; Bhuvaneswari, S.; Anuradha, C.V. An intervention study in obese mice with astaxanthin, a marine carotenoid—Effects on insulin signaling and pro-inflammatory cytokines. Food Funct. 2012, 3, 120–126. [Google Scholar] [CrossRef]
  11. Gupta, I.; Adin, S.N.; Panda, B.P.; Mujeeb, M. β-Carotene—Production methods, biosynthesis from Phaffia rhodozyma, factors affecting its production during fermentation, pharmacological properties: A review. Biotechnol. Appl. Biochem. 2022, 69, 2517–2529. [Google Scholar] [CrossRef]
  12. Mounien, L.; Tourniaire, F.; Landrier, J.F. Anti-obesity effect of carotenoid: Direct impact on adipose tissue and adipose tissue-driven indirect effects. Nutrients 2019, 11, 1562. [Google Scholar] [CrossRef]
  13. Rodriguez-Concepcion, M.; Avalos, J.; Bonet, M.L. A global perspective on carotenoids: Metabolism, biotechnology, and benefits for nutrition and health. Progress. Lipid Res. 2018, 70, 62–93. [Google Scholar] [CrossRef]
  14. Perera, C.R.; Yen, G.M. Functional properties of carotenoids in human health. Int. J. Food Prop. 2007, 10, 201–230. [Google Scholar] [CrossRef]
  15. Guedes, A.C.; Amaro, H.M.; Malcata, F.X. Microalgae as sources of carotenoids. Mar. Drugs 2011, 9, 625–644. [Google Scholar] [CrossRef]
  16. Bohn, T. Determinants and determination of carotenoid bioavailability from infant food formulas and adult nutritionals including liquid dairy products. J. AOAC Int. 2019, 102, 1044–1058. [Google Scholar] [CrossRef]
  17. Li, R.; Hong, P.; Zheng, X. β-carotene attenuates lipopolysaccharide-induced inflammation via inhibition of the nf-κb, jak2/stat3 and jnk/p38 mapk signaling pathways in macrophages. Anim. Sci. J. 2018, 90, 140–148. [Google Scholar] [CrossRef]
  18. Wu, T.; Xie, Y.; Wu, Z.; Li, Y.; Jiang, M.; Yu, H. β-carotene protects mice against lipopolysaccharide and d-galactosamine induced acute liver injury via regulation of nf-κb, mapk, and nrf2 signaling. J. Oleo Sci. 2023, 72, 1027–1035. [Google Scholar] [CrossRef] [PubMed]
  19. Chun, L.; Xiang-Dong, W.; Bronson, R.T.; Smith, D.E.; Krinsky, N.I.; Russell, R.M. Effects of physiological versus pharmacological β-carotene supplementation on cell proliferation and histopathological changes in the lungs of cigarette smoke-exposed ferrets. Carcinogenesis 2000, 21, 2245–2253. [Google Scholar]
  20. Beydoun, M.A.; Chen, X.; Jha, K.; Beydoun, H.A.; Zonderman, A.B.; Canas, J.A. Carotenoids, vitamin A, and their association with the metabolic syndrome: A systematic review and meta-analysis. Nutr. Rev. 2019, 77, 32–45. [Google Scholar] [CrossRef] [PubMed]
  21. Patel, A.K.; Laroche, C.; Marcati, A.; Ursu, A.V.; Jubeau, S.; Marchal, L.; Michaud, P. Separation and fractionation of exopolysaccharides from Porphyridium cruentum. Bioresour. Technol. 2013, 145, 345–350. [Google Scholar] [CrossRef] [PubMed]
  22. Dvir, I.; Chayoth, R.; Sod-Moriah, U. Soluble polysaccharide and biomass of red microalga Porphyridium sp. alter intestinal morphology and reduce serum cholesterol in rats. Br. J. Nutr. 2000, 84, 469–476. [Google Scholar] [CrossRef] [PubMed]
  23. Setyaningsih, I.; Prasetyo, H.; Agungpriyono, D.R.; Tarman, K. Antihyperglycemic activity of Porphyridium cruentum biomass and extra-cellular polysaccharide in streptozotocin-induced diabetic rats. Int. J. Biol. Macromol. 2020, 156, 1381–1386. [Google Scholar] [CrossRef] [PubMed]
  24. Yang, N.; Li, K.; Zhang, Z. The preservation effect of purple algae polysaccharide coating treatment on Nanhu Ling. Food Fer Ind. 2024, 50, 123–132. [Google Scholar]
  25. Yang, N. Isolation, Purification, and Application Research of Extracellular Polysaccharides from Porphyridium. Master’s Thesis, Shanghai Ocean University, Shanghai, China, 2024. [Google Scholar]
  26. Sun, L. Preparation and Biological Activity Study of Purple Algae Polysaccharides. Ph.D. Thesis, Dalian University of Technology, Dalian, China, 2009. [Google Scholar]
  27. Cai, S.P.; Li, J.; Huang, C. Study on the Effect and Mechanism of Tanshinone Ⅰ on Insulin Resistance in HepG2 Cells. Acta Univ. Med. Anhui 2016, 51, 974–977. [Google Scholar]
  28. Huang, S.; Miao, Y.; Wang, Y.; Ma, Q.; Liu, X.; Shen, T.; Guo, G. A bibliometric analysis of the trends and evolution on inhalation injury research. J. Burn Care Res. 2024, 45, 438–450. [Google Scholar] [CrossRef]
  29. Zhang, P.; Yan, F.; Du, C. A comprehensive analysis of energy management strategies for hybrid electric vehicles based on bibliometrics. Renew. Sustain. Energy Rev. 2015, 48, 88–104. [Google Scholar] [CrossRef]
  30. Zhao, W.; Chen, Y.; Hu, N.; Long, D.; Cao, Y. The uses of zebrafish (Danio rerio) as an in vivo model for toxicological studies: A review based on bibliometrics. Ecotoxicol. Environ. Saf. 2024, 272, 116023. [Google Scholar] [CrossRef]
  31. Zhang, Y.; Min, T.; Zhao, Y.; Cheng, C.; Yin, H.; Yue, J. The developments and trends of electrospinning active food packaging: A review and bibliometrics analysis. Food Control 2024, 160, 110291. [Google Scholar] [CrossRef]
  32. Pei, Z.; Chen, S.; Ding, L.; Liu, J.; Cui, X.; Li, F.; Qiu, F. Current perspectives and trend of nanomedicine in cancer: A review and bibliometric analysis. J. Control. Release 2022, 352, 211–241. [Google Scholar] [CrossRef]
  33. Liu, Z.; Yin, Y.; Liu, W.; Dunford, M. Visualizing the intellectual structure and evolution of innovation systems research: A bibliometric analysis. Scientometrics 2015, 103, 135–158. [Google Scholar] [CrossRef]
  34. Wang, M.; Chai, L. Three new bibliometric indicators/approaches derived from keyword analysis. Scientometrics 2018, 116, 721–750. [Google Scholar] [CrossRef]
  35. Chen, Y.; Ye, X.; Zhang, X.; Guo, Z.; Chen, W.; Pan, Z.; Zhang, Z.; Li, B.; Wang, H.; Yao, J. Combination of Evidence from Bibliometrics and Bioinformatics Analysis Identifies miR-21 as a Potential Therapeutical Target for Diabetes. Metabolites 2024, 14, 403. [Google Scholar] [CrossRef]
  36. Zhang, J.; Zhu, L. Trends in exercise therapy research for neurological diseases: A bibliometric and visualization approach from 2000 to 2024. Front. Neurol. 2024, 15, 1479731. [Google Scholar] [CrossRef] [PubMed]
  37. Liu, Y.; Dong, Y.; Xie, F. Global research hotspots and trends of iodinated contrast agents in medical imaging: A bibliometric and visualization analysis. Front. Med. 2024, 11, 1506634. [Google Scholar] [CrossRef] [PubMed]
  38. Li, B.; Xu, Z.; Hong, N.; Hussain, A. A bibliometric study and science mapping research of intelligent decision. Cogn. Comput. 2022, 14, 989–1008. [Google Scholar] [CrossRef]
  39. Feng, J.; Pan, H.X.; Tang, G.L. Research progress on biosynthesis of natural product drugs in the past decade. Synth. Biol. J. 2024, 5, 408–446. [Google Scholar]
  40. Yang, W.J.; Shuai, Z.R.; Gong, P. Study on the Extraction of Urticaceae Polysaccharides and Their Hypoglycemic Effect on HepG2 Cells. Food Fer Ind. 2024, 50, 23–33. [Google Scholar]
  41. Reed, J.; Bain, S.; Kanamarlapudi, V. A review of current trends with type 2 diabetes epidemiology, aetiology, pathogenesis, treatments and future perspectives. Diabetes Metab. Syndr. Obes. 2021, 14, 3567–3602. [Google Scholar] [CrossRef]
  42. Ding, C.; Bao, Y.; Bai, B. An update on the economic burden of type 2 diabetes mellitus in China. Expert. Rev. Pharmacoecon. Outcomes Res. 2022, 22, 617–625. [Google Scholar] [CrossRef]
  43. Nelson, C.P.; Lai, F.Y.; Nath, M.; Ye, S.; Webb, T.R.; Schunkert, H.; Samani, N.J. Genetic assessment of potential long-term on-target side effects of PCSK9 (Proprotein Convertase Subtilisin/Kexin Type 9) inhibitors. Circ. Genom. Precis. Med. 2019, 12, e002196. [Google Scholar] [CrossRef] [PubMed]
  44. Zhang, Z.; Lai, J.; Fan, X. Extraction of polysaccharides from Polygonum cuspidatum with activity against Type 2 Diabetes via alterations in gut microbiota. Food Chem. 2025, 470, 140047. [Google Scholar] [CrossRef] [PubMed]
  45. Hou, X.T.; He, Y.T.; Du, Z.C. Research on the Source and Hypoglycemic Activity of Polysaccharides from Hypoglycemic Plants. Chin. Arch. Tradit. Chin. Med. 2017, 35, 358–360. [Google Scholar]
  46. Fassett, R.G.; Coombes, J.S. Astaxanthin: A potential therapeutic agent in cardiovascular disease. Mar. Drugs 2011, 9, 447–465. [Google Scholar] [CrossRef]
  47. Liao, Z.; He, X.; Chen, A.; Zhong, J.; Lin, S.; Guo, Y. Astaxanthin attenuates glucose-induced liver injury in largemouth bass: Role of p38mapk and pi3k/akt signaling pathways. Cell Biosci. 2024, 14, 122. [Google Scholar] [CrossRef]
  48. Seo, J.S.; Lee, K.S.; Jang, J.H.; Quan, Z.; Yang, K.M.; Burri, B.J. The effect of dietary supplementation of β-carotene on lipid metabolism in streptozotocin-induced diabetic rats. Nutr. Res. 2004, 24, 1011–1021. [Google Scholar] [CrossRef]
  49. Liu, X.; Wang, N.; Gao, Z. β-Carotene regulates glucose transport and insulin resistance in gestational diabetes mellitus by increasing the expression of SHBG. Clin. Exp. Pharmacol. Physiol. 2022, 49, 1307–1318. [Google Scholar] [CrossRef]
  50. Tannin-Spitz, T.; Bergman, M.; Van-Moppes, D.; Grossman, S.; Arad, S. Antioxidant activity of the polysaccharide of the red microalga Porphyridium sp. J. Appl. Phycol. 2005, 17, 215–222. [Google Scholar] [CrossRef]
  51. Qiu, Y.; Gao, X.; Chen, R.; Lu, S.; Wan, X.; Farag, M.A.; Zhao, C. Metabolomics and Biochemical Insights on the Regulation of Aging-Related Diabetes by a Low-Molecular-Weight Polysaccharide from Green Microalga Chlorella Pyrenoidosa. Food Chem. X 2022, 14, 100316. [Google Scholar] [CrossRef]
  52. Nurkolis, F.; Harbuwono, D.S.; Taslim, N.A.; Soegondo, S.; Suastika, K.; Sparringa, R.A.; Tjandrawinata, R.R. New insight on dietary strategies to increase insulin sensitivity and reduce diabetes prevalence: An expert perspective and recommendation. Discov. Food 2025, 5, 136. [Google Scholar] [CrossRef]
  53. Mularczyk, M.; Michalak, I.; Marycz, K. Astaxanthin and other nutrients from Haematococcus pluvialis—Multifunctional applications. Mar. Drugs 2020, 18, 459. [Google Scholar] [CrossRef]
  54. Sathasivam, R.; Ki, J.S. A review of the biological activities of microalgal carotenoids and their potential use in healthcare and cosmetic industries. Mar. Drugs 2018, 16, 26. [Google Scholar] [CrossRef]
Figure 1. Main factors affecting type 2 diabetes and therapeutic drugs.
Phycology 05 00036 g001
Figure 2. Trend chart of publication volume from January 2000 to January 2025.
Phycology 05 00036 g002
Figure 3. Country distribution and cooperation network. The size of nodes reflects a country’s position and influence within the collaboration network, while the thickness of lines indicates the strength and closeness of collaboration between countries.
Phycology 05 00036 g003
Figure 4. Institutional cooperation network. The size of nodes is directly proportional to indicators such as the number of publications, citation frequency, or centrality of research institutions within the academic collaboration network. The thickness of lines is directly proportional to the collaboration intensity or frequency between research institutions.
Phycology 05 00036 g004
Figure 5. Author collaboration network. Larger nodes imply that the corresponding author has high activity and influence within the academic collaboration network, and their research achievements have received widespread attention and citations. Thicker lines indicate closer collaboration between two authors, suggesting a greater abundance of collaborative outcomes.
Phycology 05 00036 g005
Figure 6. Keyword co-occurrence network diagram. The size of nodes is positively proportional to indicators such as the frequency of occurrence or centrality of keywords within the literature dataset. The thickness of lines is positively proportional to the co-occurrence frequency or association strength between keywords.
Phycology 05 00036 g006
Figure 7. Keyword clustering analysis network diagram. The cluster labels are generated from combinations of representative keywords extracted by the log-likelihood ratio (LLR) algorithm.
Phycology 05 00036 g007
Figure 8. Analysis diagram of key words. Burst terms are keywords that exhibit a significant increase in frequency within a specific time period, indicating that the corresponding research direction has become a hotspot during that time.
Phycology 05 00036 g008
Figure 9. Keyword timeline visualization. The x-axis is the published year of keywords and the y-axis is the cluster number.
Phycology 05 00036 g009
Figure 10. Effects of astaxanthin, β-carotene, and Porphyridium extracellular polysaccharide on HepG2 cell viability. Compared with the group without medication (concentration 0), * p < 0.05 (n = 3), ns: not significant. (A) Bar chart and (B) line chart.
Phycology 05 00036 g010
Figure 11. Effect of Astaxanthin, β-Carotene, and Porphyridium Crude Polysaccharide on Glucose Consumption in IR-HepG2 Cells. Compared with the normal group (Control), the model group (IR) showed *** p < 0.001, **** p < 0.0001 (n = 3); Compared with the model group (IR), the positive control group (MET) and sample group (ASTA) showed significant differences in # p < 0.05, ## p < 0.01, ### p < 0.001, #### p < 0.0001 (n = 3), ns: not significant. (A) bar chart, (B) line chart.
Phycology 05 00036 g011
Figure 12. Effect of astaxanthin, β-carotene, and Porphyridium crude polysaccharide on glycogen content in IR-HepG2 cells. Compared with the normal group (control), the model group (IR) showed **** p < 0.0001 (n = 3); compared with the model group (IR), the positive control group (MET) and sample group (ASTA) showed significant differences in ## p < 0.01, ### p < 0.001, #### p < 0.0001 (n = 3), ns: not significant. (A) Bar chart and (B) line chart.
Phycology 05 00036 g012
Figure 13. Influence of astaxanthin, β-carotene, and Porphyridium extracellular polysaccharide on pyruvate kinase activity in IR-HepG2 cells. Compared with the normal group (control), the model group (IR) showed **** p < 0.0001 (n = 3); compared with the model group (IR), the positive control group (MET) and sample group (ASTA) showed significant differences in # p < 0.05, ## p < 0.01, #### p < 0.0001 (n = 3), ns: not significant. (A) bar chart and (B) line chart.
Phycology 05 00036 g013
Table 1. National connection strength of natural active substances and type 2 diabetes from 2000 to 2025.
RankingCountryTotal Link Strength
1USA112
2China66
3India58
4England56
5Germany49
Disclaimer/Publisher’s Note: The statements, opinions and data contained in all publications are solely those of the individual author(s) and contributor(s) and not of MDPI and/or the editor(s). MDPI and/or the editor(s) disclaim responsibility for any injury to people or property resulting from any ideas, methods, instructions or products referred to in the content.