Article

Sargassum Biomass Movement and Proliferation in the Eastern Tropical Atlantic

by
Yanna Alexia Fidai
1,2,*,
Jadu Dash
2,
Emma Tompkins
2,
Donatus Yaw Atiglo
3,4,
Philip-Neri Jayson-Quashigah
5,
Winnie Naa Adjorkor Sowah
6 and
Kwasi Appeaning Addo
5
1
Plymouth Marine Laboratory, Prospect Place, Plymouth PL1 3DH, UK
2
School of Geography and Environmental Science, Highfield Campus, University of Southampton, Southampton SO17 1BJ, UK
3
Regional Institute for Population Studies, University of Ghana, Accra P.O. Box LG 96, Ghana
4
Department of Sociology, University of Pretoria, Private Bag X20, Hatfield 0028, South Africa
5
Institute for Environment and Sanitation Studies, University of Ghana, Accra P.O. Box LG 209, Ghana
6
Department of Marine and Fisheries Sciences, University of Ghana, Accra P.O. Box LG 99, Ghana
*
Author to whom correspondence should be addressed.
Phycology 2025, 5(2), 17; https://doi.org/10.3390/phycology5020017
Submission received: 20 March 2025 / Revised: 25 April 2025 / Accepted: 28 April 2025 / Published: 2 May 2025

Abstract

:
Since 2011, pelagic sargassum blooms (S. fluitans and S. natans) have impacted coastal communities, aquaculture, tourism, and biodiversity across the Tropical Atlantic region. Whilst the initial event is generally attributed to an anomalous North Atlantic Oscillation (2009–2010), the drivers of sargassum movement and proliferation remain unclear. This research gap is particularly evident in West Africa, where annual and seasonal sargassum variability is under-researched, and a lack of consensus exists on seasonal and annual trends. This paper addresses these gaps by (1) providing a first attempt at characterising the seasonal and annual trends of sargassum biomass in the Eastern Tropical Atlantic, through using satellite imagery to create a time-series for 2011–2022; and (2) exploring the hypothetical drivers of movement and proliferation of sargassum for this area, through assessing its co-variation with potential drivers including atmospheric, oceanic, and policy, establishing a historical timeline of events. The time-series analysis reveals an annual biomass peak in September and a second peak between March and May. The exploration of potential drivers reveals that alongside sea surface temperature there are multiple factors that could be influencing sargassum biomass, and that further research is necessary to clarify primary and secondary drivers. The results contribute to understanding drivers, impacts, and predictions of sargassum blooms in the Eastern Tropical Atlantic. We anticipate that our findings will enable sargassum-affected areas to better anticipate the size and timing of sargassum events in West Africa and offer researchers a new perspective on possible drivers of proliferation within the wider Tropical Atlantic region.

1. Introduction

The appearance of large sargassum blooms in the tropical Atlantic presents a new environmental challenge for affected communities. Since 2011, ocean surface blooms and beach landings of the holopelagic sargassum species S. natans and S. fluitans have been impacting coastal communities in the Caribbean, the Gulf of Mexico, the equatorial Atlantic and the Gulf of Guinea [1]. Wind and currents aggregate sargassum plants into large rafts or windrows of varying size and shape [2]. As they approach land, these large rafts create nearshore and onshore environmental challenges, including impacts on biodiversity and species population dynamics such as mortality of benthic flora and fauna; changes to beach nourishment; beach erosion and shore stability; pollution; oxygen depletion; reduced light; and deterioration of water quality [3,4]. For example, Rodríguez-Martínez et al. (2019) [5] showed that in Mexico’s Caribbean coast 78 faunal species died due to sargassum, water quality deterioration extended at least 480 m from shore, and that sargassum may have a deleterious impact on coral reefs. Affected coastal communities can also experience challenges from sargassum events, particularly socio-economic ones relating to the fishing and tourism industries [6,7], as well as public health threats (including pulmonary, neurological, and cardiovascular conditions) [8]. In Ghana, it was found that sargassum blooms disrupt livelihoods as sargassum-entangled nets leads to low fish catch and that beached sargassum impacts aesthetics and creates an odour; this has direct socio-economic impacts as communities have had to undertake food/fish rationing, take out loans, wear nose/face masks, and seek alternative income options [9]. However, sargassum influxes can also present an opportunity for communities. There is ongoing exploration into the valorisation of sargassum as animal feed, biofuel, bioplastics, fertiliser, construction blocks and more [10,11], as well exploration into disposal and carbon sequestration [12]. Whilst there is a goal to valorise sargassum, and understanding the movement, proliferation and variability of blooms works towards this, there are constraints and challenges associated with this. These include that the supply of sargassum is unpredictable and variable; that there are difficulties harvesting, transporting, and storing sargassum; and that the composition is variable and may contain micro-pollutants [13]. Due to these spectra of impacts and opportunities, sargassum influxes are of consequence to coastal Atlantic communities.
Sargassum blooms have high annual variability, and in the Western Tropical Atlantic, the seasonality of sargassum has been largely established with consensus that the season spans the boreal spring and summer months [1,14,15]. However, the seasonality of sargassum influxes is not yet established for other regions, including West Africa and the Gulf of Guinea. Ody et al. (2019) [2] noted that sargassum aggregations were observed from September to November 2017 near the West African coast and across the North Tropical Atlantic. In the Western and Central Tropical Atlantic, multiple seasonal forecasting systems have been developed for sargassum transport and beach landings. For example, Marsh et al. (2021) [16] used an ocean model hindcasting to predict the movement of blooms in the Central Atlantic, Eastern Caribbean and Jamaica; Marechal et al. (2017) [17] used surface current models to develop the Sargassum Watch System (SaWS) for the Lesser Antilles; and Wang and Hu (2017) [14] used hindcasting to provide early warnings for the Caribbean Sea and Central West Atlantic. The Centre for Resource Management and Environmental Studies (CERMES) also produces a sub-regional sargassum outlook bulletin which is a 3-monthly island-scale forecast for the Eastern Caribbean. Forecasting work is at a relatively advanced stage for the Western and Central Tropical Atlantic, so that it is now possible to review and critique extant forecast models [18]. Despite rapid growth in research and forecasting of pelagic sargassum in the Western and Central Tropical Atlantic, there remains uncertainty about the nature, extent, timing, and driving processes of sargassum influxes and events in the Eastern Tropical Atlantic [19].
Sargassum research from the Eastern Tropical Atlantic is not at such an advanced stage, with tens of sargassum monitoring papers (compared to hundreds of papers relating to the Western Tropical Atlantic). Notable contributions that focus on prevalence and composition assessment include Addico and DeGraft-Johnson (2016) [20] and Oyesiku and Egunyomi (2014) [21], both of which sampled beached sargassum along the coasts of Ghana and Nigeria, respectively, for chemical composition analysis. Adet et al., (2018) [22] used satellite observations from the Moderate Resolution Imaging Spectroradiometer (MODIS) sensor using fluorescence values to detect near-shore blooms and beach landings along the West African coast from Sierra Leone to Nigeria from 2011 to 2016; due to cloud cover the study’s analysis was restricted and in some years as few as 2 months were analysed, limiting the potential to assess seasonality and annual variability from the data. In Nigeria, Solarin et al. (7 2014) [7] surveyed beaches in 2011 and 2012 and observed that sargassum events coincided with the rainy season (May–August). The limited research in West Africa has focused mostly on beaching events, rather than open-ocean blooms and data collection is typically short-term with no seasonal or annual variation characterised.
Research on open-ocean blooms in the Eastern Tropical Atlantic contains some significant disagreement, e.g., on the transport pathways and origins of the blooms affecting coastal West Africa. For example, Gower and King (2020) [23] acknowledge that sargassum influxes are extending to the Gulf of Guinea from the Tropical Atlantic or Amazon plume. Contrastingly, Brooks et al. (2018) [24] and Franks et al. (2016) [25] suggest that blooms are exported from the Gulf of Guinea to the Tropical Atlantic. Oviatt et al. (2019) [26] bring these ideas together to suggest a third option, notably that sargassum enters the Gulf of Guinea by the equatorial counter current and is circulated south before being returned to the Tropical Atlantic via the South Equatorial Current. These contrasting suggestions on transport pathways and bloom origins highlight uncertainties surrounding the movement of sargassum in West Africa.
Drivers of sargassum blooms have been researched to date with a focus on the Caribbean or Western Central Tropical Atlantic. Multiple theories explaining sargassum growth and dispersal exist, such as the role of nutrient-rich waters from the Amazon River Plume (propagated by deforestation, agro-industrial and urban activities), warmer sea surface temperatures, and equatorial upwelling combined with a southern-shifting inter-tropical convergence zone [27,28]. Iron and phosphate from Saharan dust transported to the Caribbean have also been theorised to be a further source of nutrients [29]. Alongside this, a negative phase of the Atlantic Meridional Mode (AMM) and El Niño Southern Oscillation (ENSO), stronger trade winds, and stronger north-westward nutrient transport appear relevant to increases in sargassum blooms and secondary winter blooms [27]. The United Nations Environmental Protection (UNEP) has summarised and categorised many of these proximal factors (potential drivers) into causal pathways, which are as follows: sargassum exists elsewhere, transfer to a new consolidation region, persistence/proliferation in new consolidation region, and separation and transport to the Caribbean; these highlight that there are many hypotheses and uncertainties of the processes surrounding why/how sargassum is transferred and persists [30]. Other hypothesised explanations include warming temperatures, climate change, changes in wind regimes, and exceeding biosphere tipping points [1,31,32]. In Ghana, an investigation into community perceptions of sargassum showed that some coastal communities assume that sargassum blooms are driven by oil and gas exploration activities (which began in 2010 shortly before sargassum appeared) although the authors challenge these assumptions [9]. Overall, a lack of long-term large-scale sargassum bloom data for the Eastern Tropical Atlantic has prevented investigation into the drivers and causes of sargassum blooms. The result is limited investigation into the movement and perpetuation of the blooms in the Eastern Atlantic region, and failure to consolidate potential theories for this region.
A final challenge for detecting and monitoring sargassum in the Eastern Tropical Atlantic is the accessibility of useable satellite data over West Africa. The intertropical convergence zone is associated with dense cloud cover which prevents optical satellite imagery from being used easily in the Eastern Tropical Atlantic, as noted by Marsh et al. (2021) [16]. Other satellite sensors which could overcome cloud barriers, such as microwaves, do not provide high enough spatial and temporal resolution data which means sargassum mats cannot be well detected. Due to the size and distribution of each sargassum mat a near daily monitoring with moderate resolution (<100 m) dataset would be optimal for monitoring pelagic sargassum. Although many freely variable satellite sensors meet the spatial resolution requirements nearer the coast (e.g., Landsat and Sentinel 2), achieving a near daily temporal resolution is challenging. Consequently, there is a lack of characterisation of seasonal and annual variability, investigation into drivers, forecasting and agreement on transport pathways. Collectively, these research gaps hinder effective management of pelagic sargassum events (as defined by Fidai et al., 2020 [19]) in the Eastern Tropical Atlantic region.
Whilst the trigger for the initial sargassum seeding event (from the Sargasso Sea to the Tropical Atlantic) is largely undisputed (anomalous North Atlantic Oscillation 2009–2010), the drivers of movement and causes of proliferation within and across the Eastern Tropical Atlantic remain unclear. Knowledge gaps remain about the annual and seasonal variability of sargassum in this region, specifically on the coast of West Africa. This paper addresses these two research gaps, by (1) providing a first attempt at characterising the seasonal and annual trends of sargassum influxes in Eastern Tropical Atlantic, and (2) exploring the hypothetical drivers of movement and proliferation.
To achieve this, the following research questions are addressed: (i) what datasets and methods are suitable to detect oceanic sargassum in the Eastern Tropical Atlantic? (ii) How much floating sargassum is there in the Eastern Tropical Atlantic, and what is the seasonal and annual variability? And (iii) were there any large-scale atmospheric, oceanic, or other events that co-vary with the presence of sargassum biomass in the Eastern Tropical Atlantic region between 2011 and 2022?

2. Methods

2.1. Location

The area investigated follows the coastline from Guinea as western bound through Sierra Leone, Liberia, Cote D’Ivoire, Ghana, Togo, Benin, Nigeria in the east, and south to Cameroon, Equatorial Guinea, Gabon, Congo, Democratic Republic of Congo and ending in Angola, south of Luanda. The Tropical Atlantic Ocean along these coastlines including the Gulf of Guinea and Bight of Biafra is collectively referred to as the Eastern Tropical Atlantic in this study (shown in Figure 1).
This study area was selected as it is an under-researched region affected by sargassum blooms and beach deposits, and has communities whose livelihoods are highly vulnerable to sargassum impacts [19]. Due to the speculation around the effects of river discharge and nutrients, the major rivers joining the Atlantic system in the region were included (Volta, Sanaga, Niger, Congo, Cavalla, and Ogooué rivers). The study region was further split into two sub-study areas: the North (from Guinea to Gabon) and the South (from Gabon to Angola). This separation was identified as the South study area experiences lower sargassum biomass and it enables investigation into temporal and spatial variability of sargassum biomass within the Eastern Tropical Atlantic. The North study area is focused on the Gulf of Guinea and the South on where the Congo River joins the Atlantic Ocean. The years 2011–2022 were selected as reports of a significant increase in sargassum biomass and the Great Atlantic Sargassum Belt in the Tropical Atlantic were identified from 2011, and has persisted through this time period [1].

2.2. Sargassum Detection and Quantification

2.2.1. Sargassum Detection Methods

To identify the most appropriate method for detecting sargassum in the study region, a literature search was undertaken to find empirical publications that detect pelagic sargassum using remote sensing methods in Google Scholar and Scopus literature search engines (search terms: “sargassum + detection + Atlantic”; “sargassum + remote sensing + Atlantic”; “sargassum + monitoring + Atlantic”). Relevant publications (remote sensing-based, empirical, on pelagic sargassum in the Tropical Atlantic, with full text access) were read (n = 18), and their detection method(s) was(were) noted, along with the study location, sensor/satellite used and any associated limitations of the method. These were then compiled and summarised into a table which is presented in the Supplementary Material (Section S1, Table S1). Based on this exploration, the index selected for use in this work was the Alternative Floating Algae Index (AFAI) using the Moderate Resolution Imaging Spectroradiometer (MODIS) satellite.
A F A I = R r c , N I R R r c , N I R
R r c , N I R = R r c , R E D + R r c , S W I R R r c , R E D × λ N I R λ R E D / ( λ S W I R λ R E D )
AFAI was first developed by Wang and Hu (2016) [33] and it examines the red-edge reflectance to detect floating vegetation. The formula for AFAI is outlined above (1) where Rrc refers to Rayleigh-corrected reflectance, NIR near infrared wavelength (748 nm), SWIR shortwave infrared wavelength (869 nm), and RED the red wavelength (667 nm).
The output of this method is three classifications for pixels: ‘no-observation’, ‘sargassum-containing’ and ‘sargassum-free’; operational implementation of this method involved four main steps. The first step to create the ‘no-observation’ classification was achieved by applying Formula (1) to the MODIS images, then masking clouds and cloud shadows, sunglint, and removing ambiguous pixels such as no-data pixels, thereby creating a ‘no-observation’ classification, where pixels containing these features were masked. Additionally, images which contained more than 50% cloud coverage were removed as the outputs would be unreliable. In the second step, the AFAI classification was undertaken to identify ‘sargassum-containing’ pixels. This was done by creating a sargassum-free ocean background image by applying a four-degree polynomial surface fit to smooth the masked image. The sargassum-free ocean background smoothed masked image was then subtracted from the AFAI masked image to generate background AFAI values with a median filter. Then, the AFAI global-scope threshold (1.79 × 10⁻⁴) was applied to segment the image to determine sargassum-free and sargassum-containing pixels. Next, linear unmixing of sargassum-containing pixels was undertaken using minimal and maximal sub-pixel coverage to estimate the fractional sargassum coverage within a pixel. In the third step, data binning of individual valid sargassum-free and sargassum-containing pixels into grids at monthly intervals for the period 2011–2022 was undertaken to calculate the mean sargassum fractional coverage for each month and grid to enable a time-series of area coverage for each study area to be produced.

2.2.2. Sargassum Biomass Relationship

Finally, Wang et al. (2018) [34] established an index-biomass density model where MODIS AFAI values correspond to sargassum density which enables calculation of sargassum biomass per area. The model was developed from in situ measurements of sargassum biomass weight per area, where the wet weight of a 1 m2 quadrat was measured, and digital photos were taken and used to calculate the areal density. The AFAI-Biomass density model was developed by converting the in situ data to MODIS AFAI using simulations (considering maritime and coastal aerosol types for atmospheric conditions) and applying a regression model to the satellite-derived AFAI. The model was applied directly to percentage coverage maps from AFAI outputs to create a wet biomass estimate for the study areas across the time period. The model gives a time-series of monthly wet sargassum biomass estimations in metric tons at 50 km spatial resolution (provided by the Optical Oceanography Lab at the University of South Florida).

2.2.3. Spatio-Temporal Variation of Sargassum Biomass

The time-series graphs are presented and discussed in the results section, the magnitude of the peaks and annual accumulation are calculated, as well as linear regression (using Santer’s Method [35,36]) to determine trend over time, and the significance of the trends (using Python 3.8.10), for each study region (North and South). This linear regression method was chosen as it improves upon standard linear regression by addressing the issue of autocorrelation in residuals by modelling the autocorrelation structure using the lag-1 autoregressive model and adjusting the standard errors accordingly, which is particularly important when working with time-series data as it cannot be assumed that residuals are independent and identically distributed overtime. This method increases the statistical robustness of the trend analyses as it compensates for autocorrelation and improves the standard error calculation, making p-values more accurate; it is also broadly used in climate science trend analysis including in the IPCC AR6 report [35,36].

2.3. Assessing Co-Variance

To explore co-variance of potential events and sargassum biomass, a variety of data were used covering the period 2011–2022. Potential drivers were identified from existing literature and included nutrient inputs, ocean events and atmospheric events. Data which represent these categories are included and, where monthly data are available, statistical trend analysis and co-variation analysis (after detrending) were undertaken in Python (3.8.10). Time-series ocean data including sea surface temperature, the North Atlantic Oscillation (NAO) index, and ocean salinity, were collated and presented using Python 3.8.10 or Microsoft Excel software. Where monthly data were available for each study area, a cross-correlation analysis was undertaken (using Python 3.8.10) to identify any temporal lags between the biomass time-series and the potential drivers. A historical timeline was established from 2011 which includes standalone oceanic events, extremes, and long-term trends (Supplementary Material see Section S2, Table S2). This qualitative approach enables a broad exploration of potential drivers and events over the entire time period (2011–2022), which allows a bigger picture of how the events may be interlinked across the time period. Table 1 summarises the events, the datasets used, and their sources.

3. Results and Discussion

3.1. Sargassum Detection

Through investigating existing detection methods and assessing their limitations (Supplementary Material see Section S1), we conclude that the most appropriate method for this study region is to apply AFAI using MODIS data. The reasons for this include that the study region is large and includes open ocean, and MODIS data offer complete temporal coverage for the time period and full spatial coverage of the ocean study region as well, allowing a single sensor and dataset to be used. Despite the coarse resolution associated with this method, as the Eastern Tropical Atlantic is frequently impacted by cloud cover, the compositing method employed is advantageous in enabling an estimate of sargassum biomass in a monthly period. Additionally, it overcomes many of the limitations of FAI including differentiating cloud from sargassum, and the lower signal to noise ratio compensates for the lower resolution. This method also allows calculation of wet biomass to be estimated, going beyond percentage cover or area estimation that most other methods offer. A potential weakness of AFAI is that it considers all floating vegetation in the region and does not differentiate between sargassum and Trichodesmium, for example, thus the output can be used as an indicator of sargassum but it may also include other floating vegetation. Wang and Hu (2016) [33] indicate that AFAI extracts 95% of sargassum-containing pixels, but the biomass calculation has a relative uncertainty of ~12% (illustrated in Figure 2).

3.2. How Much Floating Sargassum Is There in the Eastern Tropical Atlantic, and What Is the Seasonal and Annual Variability?

The time-series analysis revealed distinct patterns and variation between the North study area and the South study area (Figure 2).

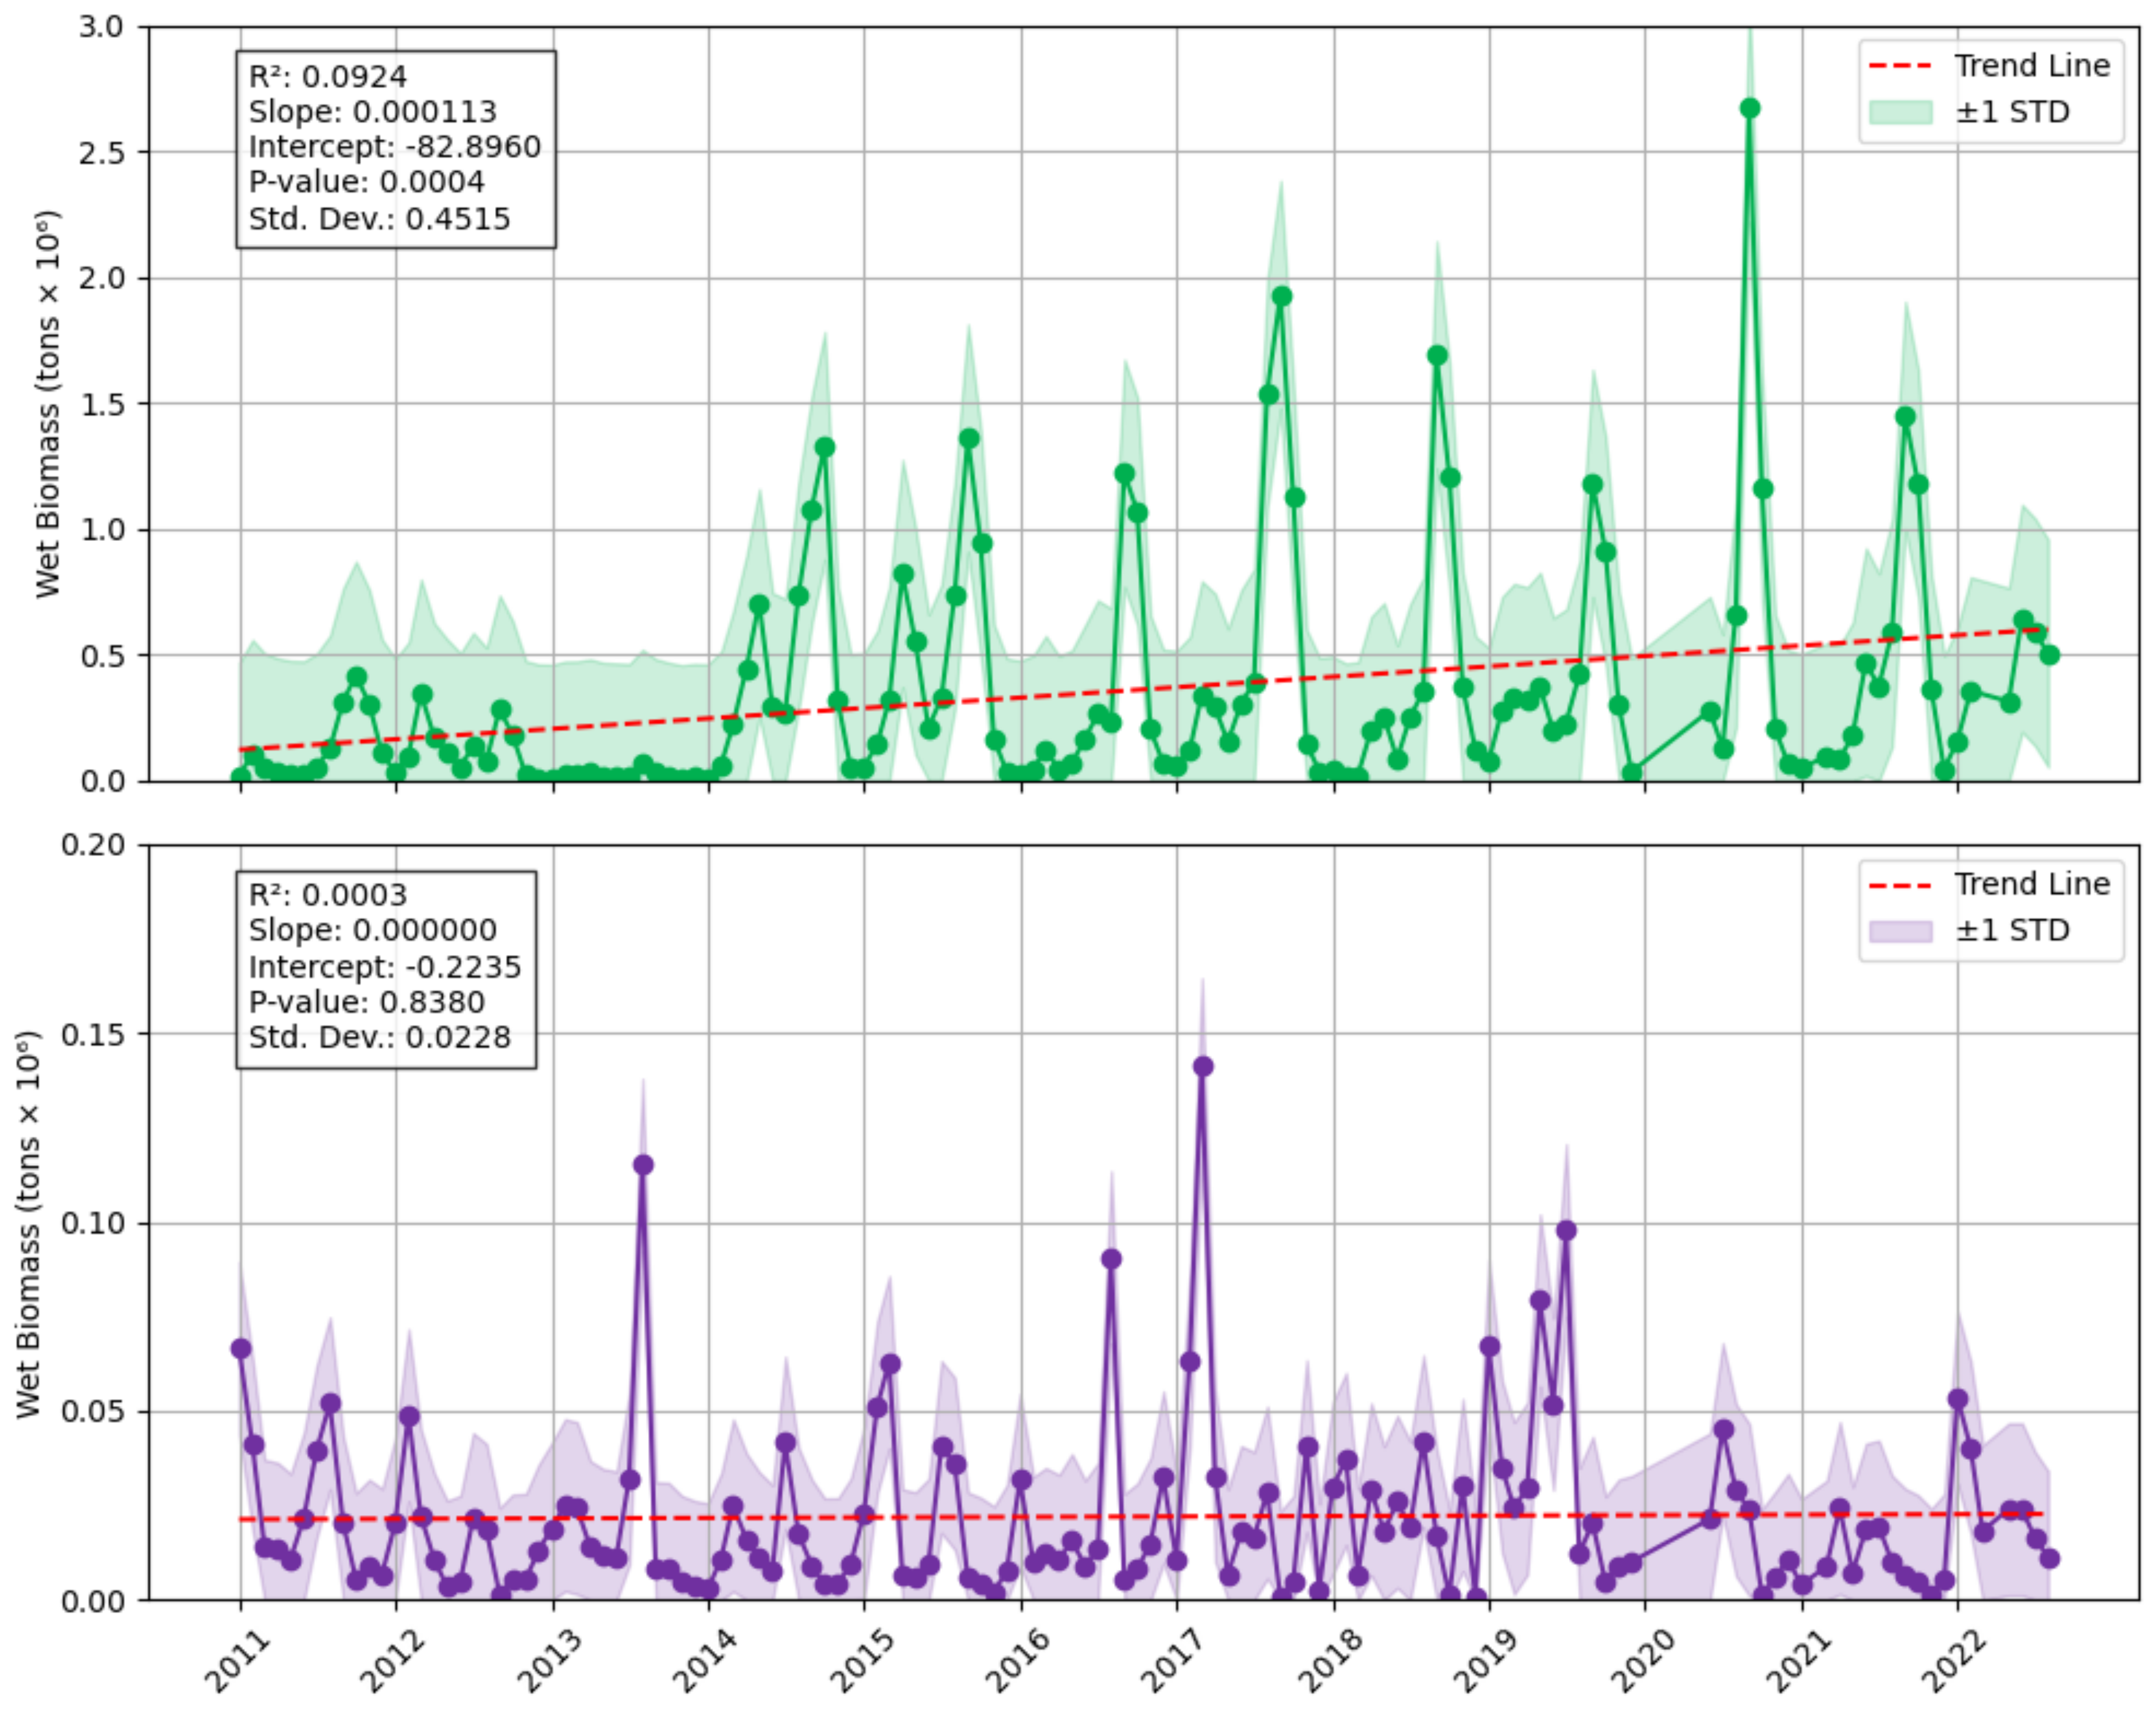
3.2.1. Magnitude of Peak Biomass of Sargassum in the Eastern Tropical Atlantic

The linear regression indicates a statistically significant increase in biomass over the time period 2011–2022 in the North study area; and non-statistically significant increasing trend in the South study area. It is apparent that both study areas have distinct biomass patterns, volumes, and trends; as such, their co-variance with potential drivers has been explored separately (see Supplementary Material for the combined dataset Figure S1), with the South study area overall experiencing less biomass than the North. The magnitude of the peaks in each study area are vastly different, the peak in the North study area was nearly 19 times greater than the South, as the maximum biomass in the North was 2,672,800 tons in September 2020, and 141,717 tons in the South in March 2017. This is due to sargassum being transported from the Atlantic Ocean via the Guinea Current in the North study area; once deposited on the beach, only a small amount of biomass remains available for transport to the southern part of the study area. Comparatively, Wang et al., (2019) [1] showed that for the entire Great Atlantic Sargassum Belt (Gulf of Mexico, Caribbean, Tropical Atlantic across to Sierra Leone) there was a peak of over 20 million tons in June 2018. While recognising that we are comparing different years, this suggests that about 13% of peak Great Atlantic Sargassum Belt biomass was found in the North study area—clarifying the importance of understanding annual and seasonal variable for West Africa.

3.2.2. Seasonality of Sargassum in the Eastern Tropical Atlantic

In the North study area, most years appear to experience a first (smaller) peak (most commonly between March and May but varying between February and June) and a second (larger) peak in September. Seven of the eleven complete years (2015–2021) experienced a peak in the month of September, with October, March, or August peaking in the other four years. The September peak ranged between 1,180,470 tons in 2019 and 2,672,800 tons in September 2021. The smaller peak earlier in the year occurred in eight of the eleven years which ranged from 107,532 tons in February 2011 to 822,123 tons in April 2015. There were two peaks in 2012, however it is anomalous in that the earlier peak in March (347,256 tons) was greater than the peak in September (283,776 tons). This first attempt at providing a seasonal assessment of sargassum biomass for the North study area (from Guinea to Gabon) has significant implications for sargassum management in the associated 11 West African countries (see discussion below).
Despite initial assessments of differing biomass patterns in the North and South study areas, both exhibit two annual peaks: one dominant and one smaller. In the South, the timing of the dominant peak is less consistent; for six of the eleven years, it occurred in July or August, while in the other years, it fell between January and April, ranging from 24,286 tons in April 2021 to 141,717 tons in March 2017. The minor peak was very varied by month across the year, with no clear pattern, and 2016, 2017 and 2019 experienced two minor peaks; minor peak months included January (×2), February, March, May, July (×3), August (×2), November and December. The year 2018 experienced a lot of fluctuation with no clear peaks.
It is challenging to draw statistical inference between anthropogenic and ecological drivers of biomass peaks due to the aggregate nature of sargassum biomass data, although we explore co-variance of drivers below in Section 3.3. However, there is a clear seasonality, which overlaps with impacts on communities; for example, during the peak months when biomass increases it disrupts fishers’ access to the sea and fishing activities [9].

3.2.3. Annual Sargassum Biomass Accumulation in the Eastern Tropical Atlantic

In the North study area, the years with highest annual biomass accumulation were 2017 (6,450,252 tons), 2015 (5,668,610 tons) and 2014 (5,532,239 tons), which is unexpected as 2020 is the year with the highest September peak in monthly biomass (Figure 3). In the South study area, 2019, 2017 and 2011 have the highest biomass accumulation of 441,534 tons, 366,749 tons, 301,008 tons, respectively. Wang et al. (2018) [34] showed that the years that reported the highest biomass in the Great Atlantic Sargassum Belt were 2015 and 2018. This shows that the biomass accumulations in the Eastern Tropical Atlantic are not necessarily congruent with the Western Tropical Atlantic; it is possible that this is due to variation in data availability and monitoring capabilities. To offer a sense of decadal change for the years with complete data (2011–2021), a linear regression was applied to annual accumulation, for the North (R2 = 0.42, Slope = 392,417.27, p-value = 0.0306), which indicates a statistically significant increasing trend, and South (R2 = 0.008, Slope = −2752.20, p-value = 0.7892) which is non-significant decreasing trend.
The time-series analysis is limited by gaps in the dataset impact annual biomass accumulation figures. Gaps in the dataset are observed for 8 months in the North study area and 7 months in the South during the study period, and these occurred due to high cloud cover in the images. Where five of these are consecutive in 2020 it makes identifying a second peak impossible and offers an explanation for this year not having the highest biomass. It also highlights the challenges surrounding the intertropical convergence zone and dense cloud cover in the region for monitoring. There is a need for alternative monitoring and detection methods in this region for more reliable and higher resolution analysis. Another consideration is the depth of the mats, as the method used for determining biomass aggregations does not consider the vertical direction, meaning that this time-series is indicative of the lower bound estimations.
To summarise the annual and seasonal variability identified in the time-series, in the North study area (from Guinea to Gabon) there is an increasing trend with two peaks annually, a primary peak in September and a minor peak between March and May. In the South study area, there is no statistically significant trend, but there are also usually two peaks, with a primary peak most commonly occurring in July or August and usually one or more minor peaks occurring at another time in the year.

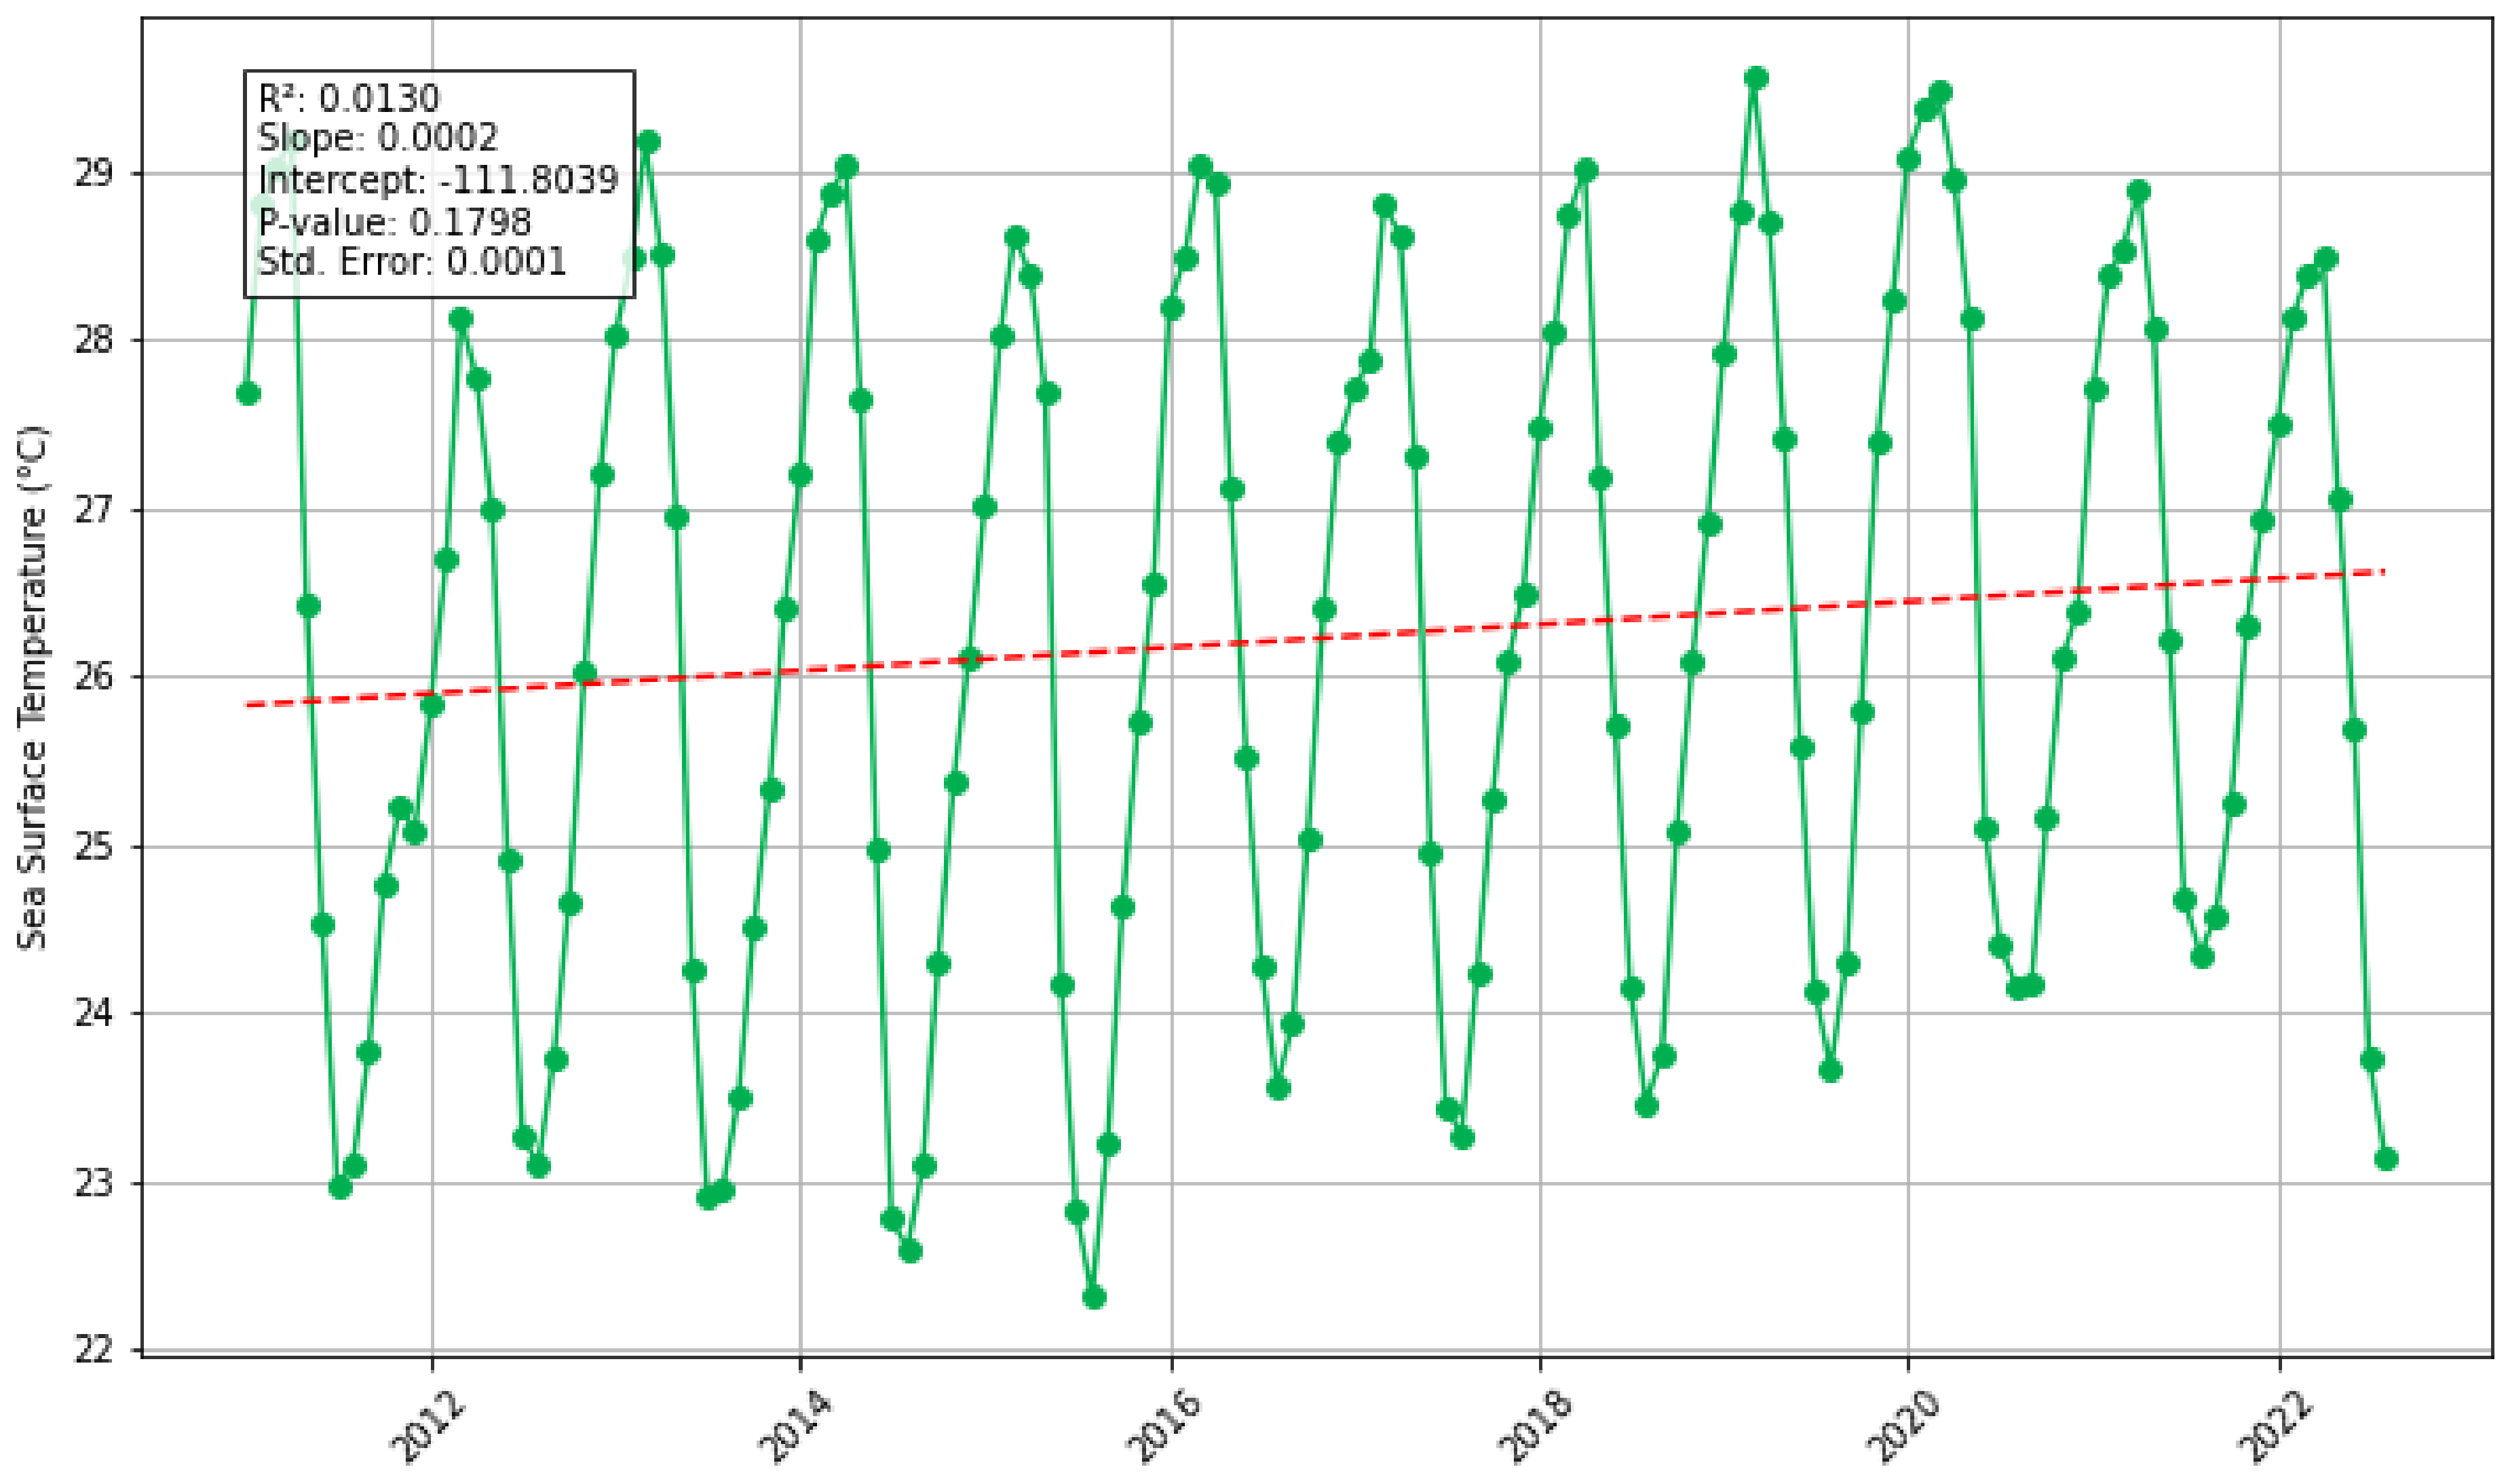
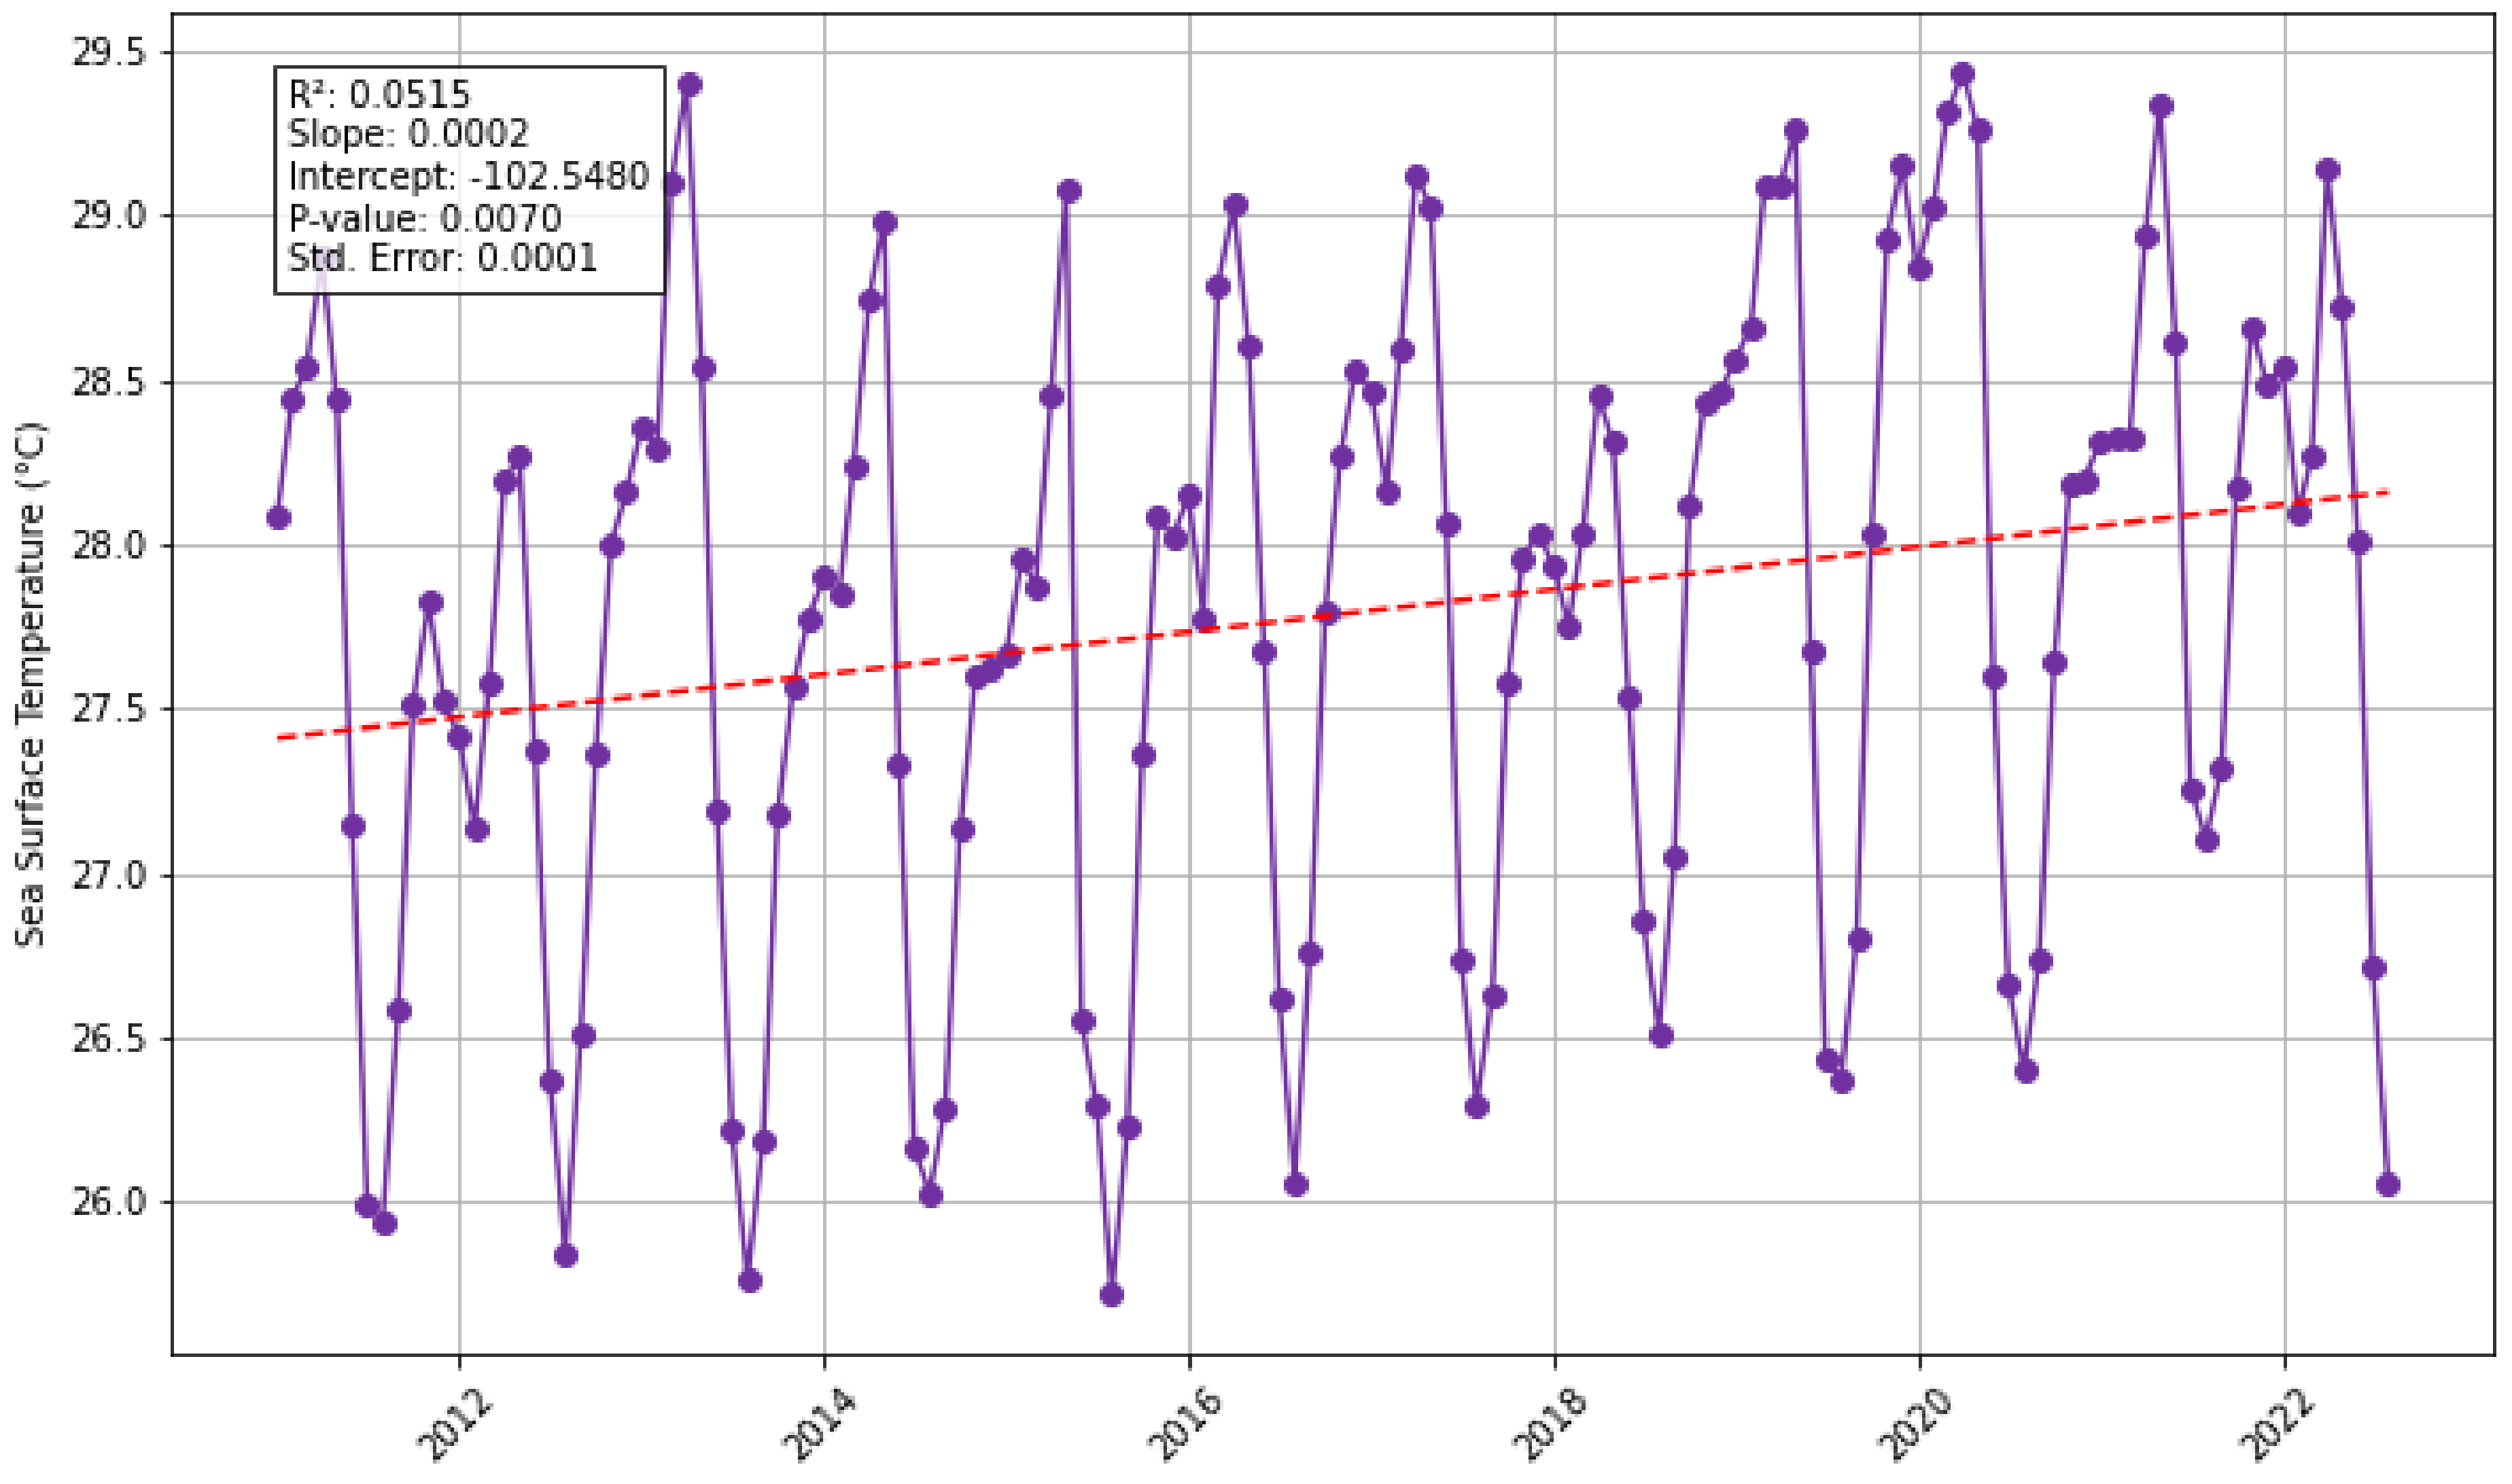
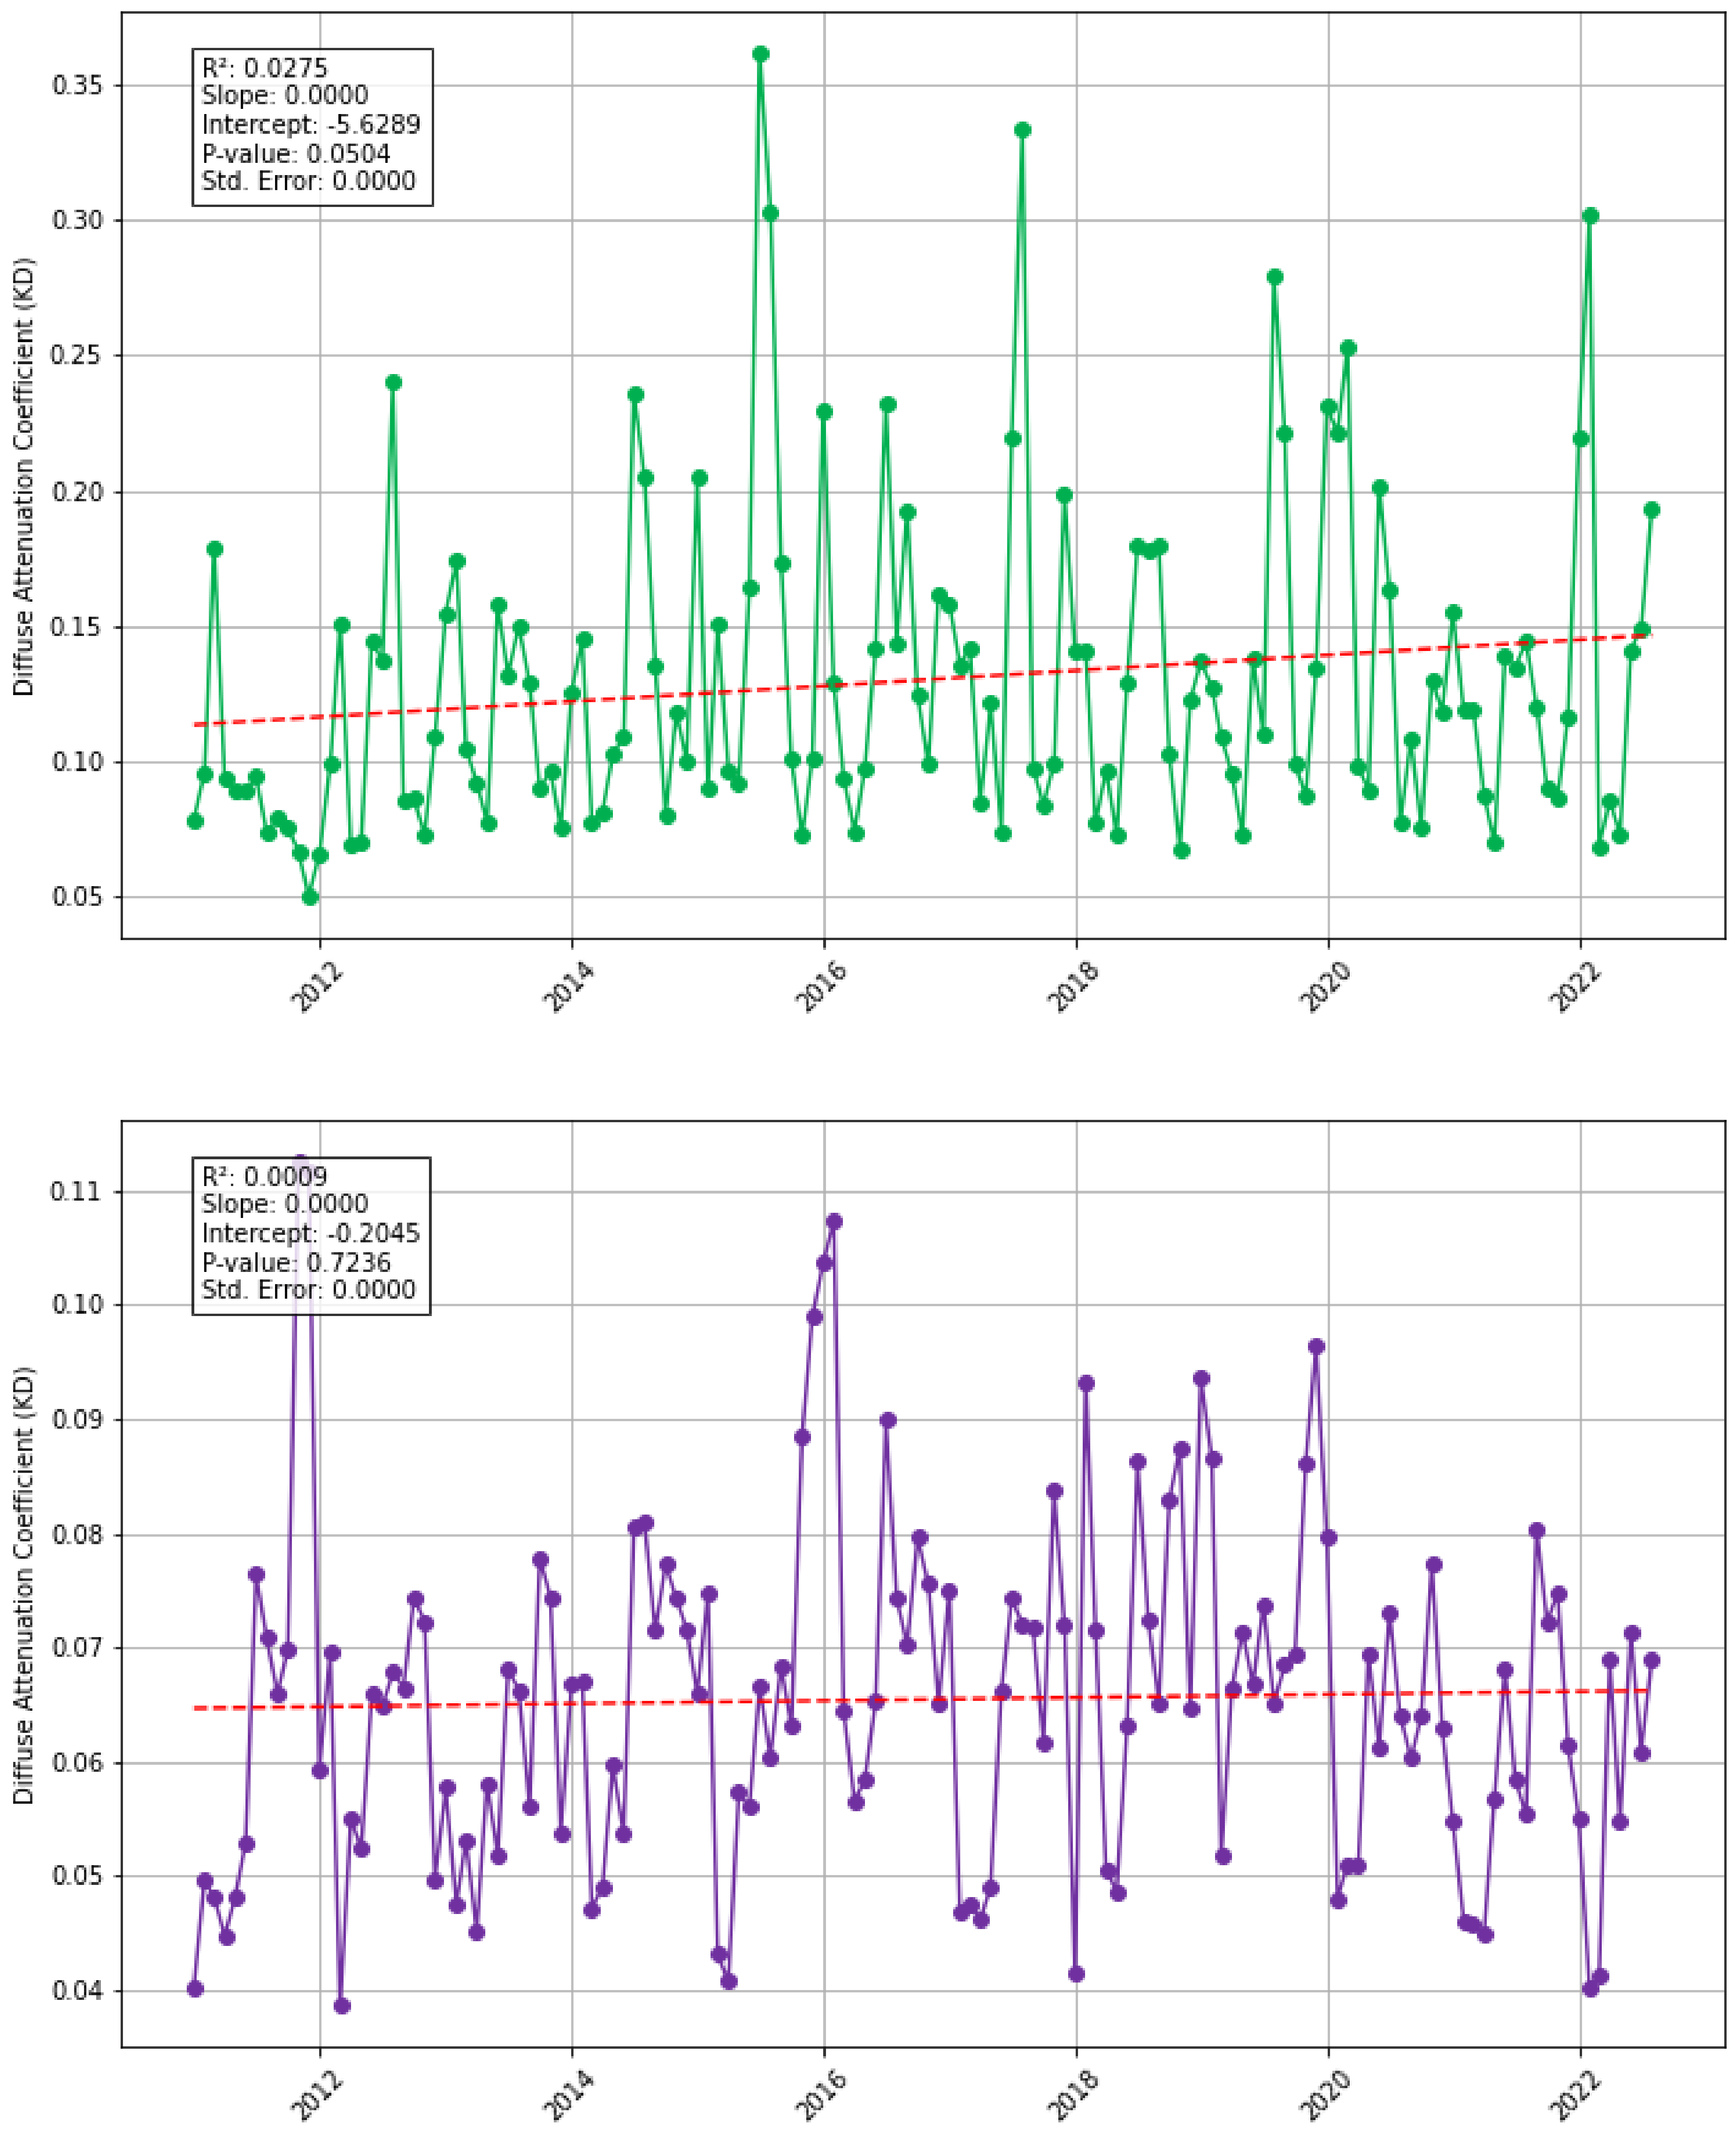
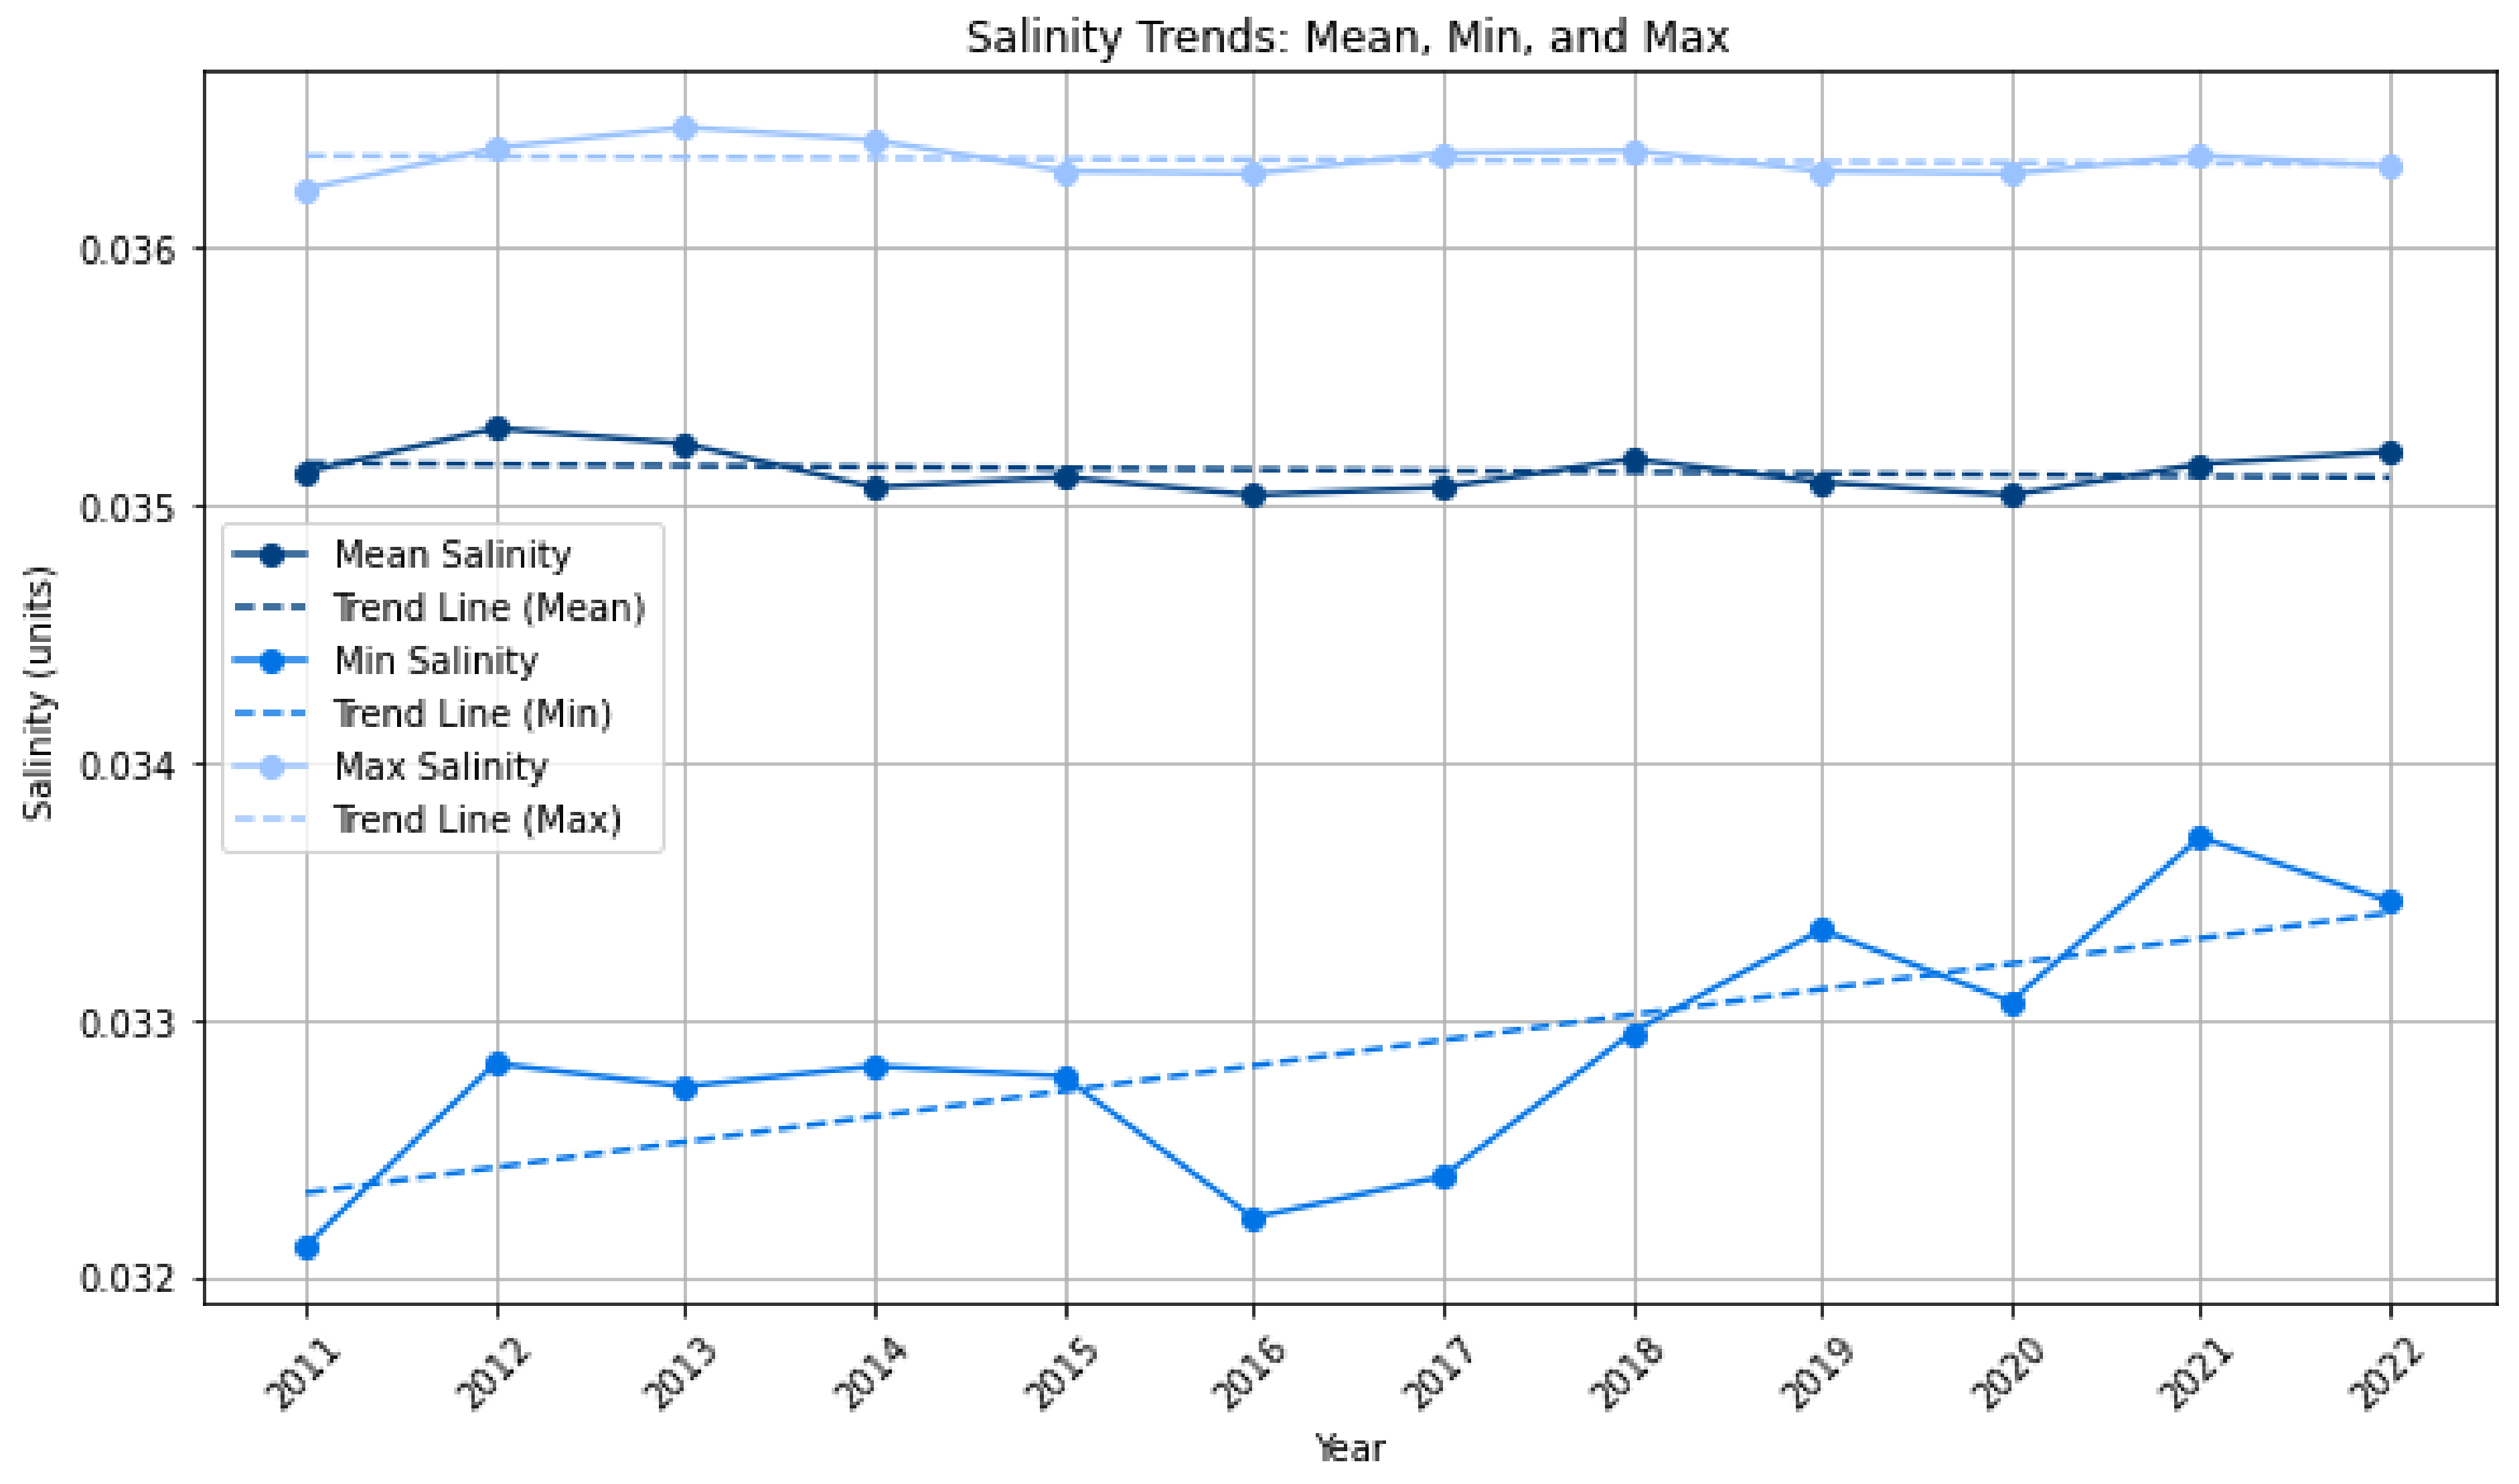
3.3. Does Sea-Surface Temperature, Atmospheric and Riverine/Coastal Nutrient Inputs Co-Vary with Sargassum in the Eastern Tropical Atlantic Region Between 2011 and 2022?

In this section, we explore if sea-surface temperature, atmospheric, and riverine/coastal nutrient inputs co-vary with sargassum biomass in both the North and South study areas. This is achieved through using the data outlined in Table 1, applying linear regressions, and exploring connections to existing empirical literature. The UNEP Sargassum White Paper [30] categorises proximal factors into causal pathways. Proximal factors are those elements that change local levels of abundance or affect the movement of the sargassum. We do not suggest that proximal factors contribute to the presence or absence of sargassum. The factors explored here are broadly categorised into these pathways, including ‘sargassum exists elsewhere’, ‘transfer into a consolidation region’, and ‘persistence/proliferation in a new consolidation region’, and we further these categories with the addition of ‘transport within a consolidation region’. To support this a historical timeline of events has been established (Supplementary Material see Section S2).
Sea Surface Temperature (SST): There is a statistically significant increasing trend in SST in the North study area (p-value = 0.007), and no statistically significant trend in the South study area (p-value = 0.18) (Figure 4). These trend results indicate a potential co-variance with sargassum biomass as they indicate similar trends. Magana-Gallegos et al. (2023) [44] found that in an ex situ environment, different sargassum morphotypes respond to temperature differently; with maximum growth at 28 °C for S. fluitans III, 22–25 °C for S. natans VIII, and S. natans I at 25 °C, all three experienced decreased growth at 31 °C. To explore temperature-temporal lags a cross-correlation was undertaken (Supplementary Material Figure S2); it was found that the correlation for –5 months (where biomass leads the biomass by 5 months) has a statistically significant correlation (correlation = 0.5617, p-value = 0.00), meaning that changes in the biomass are followed by changes in SST 5 months after. Additionally, a lag of 7 months was also statistically significant (correlation = 0.4256, p-value = 0.00), meaning that changes in North SST are followed by changes in biomass 7 months after. For the South study area, the cross correlation indicated no statistically significant time lag. It is important to note that there could be simultaneous factors constraining growth at the same time in the south. The annual average sea surface temperatures for the Eastern Tropical Atlantic in all years fall in the range of 25.6–26.7 °C in the south and 27.34–28.23 °C in the north; this variation could be indicative that different morphotypes are dominant and thrive in each of the study regions. These observations raise further questions: could this suggest that (i) sargassum grows and reproduces outside of the Eastern Tropical Atlantic region in cooler waters and are transported to the east; or (ii) sargassum grows in the region but not at the maximum rate? Sargassum biomass and sea surface temperature appear to experience a positive co-variation in the north, but the mechanisms of this require further investigation along with further statistical analysis to overcome any potential spurious correlations.
Saharan dust: To estimate Saharan dust in the Eastern Tropical Atlantic, aerosol optical depth (AOD) serves as an indicator (Figure 5). The regression analysis indicates no statistically significant trends in AOD for both the North and South study areas, with non-significant decreasing trends observed. This suggests no co-variance between sargassum biomass and AOD from 2011 to 2022. However, there are notable coincidences; 2013 had the lowest AOD in the North study area, and the third lowest in the South, correlating with low biomass in both areas. Conversely, 2015 was the peak year for AOD in both regions and also saw the second-highest biomass in the North. Monthly AOD trends reveal that January-March typically have the highest AOD peaks in the North, with March 2012 also experiencing a biomass peak. In the South study area, August consistently has the highest AOD, except in 2014, suggesting that biomass peaks occur one month earlier than AOD peaks. Cross-correlation analysis for both North and South study areas shows that there are multiple monthly lags which are statistically significant (see Supplementary Material Figure S3), indicating that there is the potential for delayed or cumulative effects of AOD on biomass accumulation; this pattern may also suggest a distributed lagged response (which could be seasonal), or it may reflect autocorrelation within the time series themselves; alternatively, some significant lags could arise due to spurious correlations. Saharan dust is a source of nutrients for sargassum growth due to the iron (Fe), nitrogen (N) and phosphorus (P) contents [29,45]. Fe in particular was found to boost sargassum growth; Fe becomes abundant after rain episodes due to Saharan dust deposition; it supports sargassum growth as it is coupled with oceanic P and N cycles and it limits primary production [45]. Xu-Yang et al. (2022) [46] found that Saharan dust deposits transported across the Atlantic contained essential nutrients including iron, calcium, and potassium. Whilst some of the literature acknowledges the role of Saharan dust nutrients, it has been considered less critical than riverine and upwelling sources and upward fluxes; in the Eastern Tropical Atlantic the equatorial and northwest African upwelling systems could also be sources of Fe, N and P, as well as external nutrients from rivers such as the Congo [1,26,27,31]. However, Xian et al. (2020) [47] indicated higher concentrations of Saharan dust in West Africa compared to the Caribbean, implying greater significance for the Eastern Tropical Atlantic. Based on the statistical trends, the existing literature, and detailed data analysis, we cannot confidently conclude co-variance between dust and sargassum biomass in both study areas. Therefore, the relationship between Saharan dust and biomass warrants further investigation.
Water quality and river pollution Nutrients from various sources, including rivers like the Congo, may stimulate sargassum growth in the Eastern Tropical Atlantic, transported by the Canary and Benguela Currents [26]. Here we explore the anthropogenic interaction and pollution of rivers in the Eastern Tropical Atlantic. West Africa has several water resource policies, including Ghana’s National Water Policy June 2007 which promotes efficient use of fertiliser to reduce water pollution; similar legislation addressing water pollution and use includes the Water Resources Commission Act 1996, and Nigeria’s Water Resources Master Plan 2013. In Ghana, small-scale illegal gold mining (known locally as galamsey) has gained popularity since the gold price increase in 2008, and wastewater from the process discharged back into rivers usually contains mercury, phosphate, lead, copper, and iron pollutants and threatens water quality and aquatic life [48,49,50]. Similarly, Nigeria’s Minerals and Mining Act 2007 allows water use for mining but lacks effective enforcement and regulation, resulting in environmental impacts [48]. Macroalgae such as sargassum sequester large amounts of trace metals and many of these relating to wastewater from mining have been found in sargassum; therefore, there is the potential for the interaction of blooms and water pollution [51,52]. Iron particles can promote the growth of sargassum species (S. vulgare), while phosphate correlates with increased fertility [53,54]. Mercury is associated with dissolved organic matter release from sargassum [55]. Consequently, rivers feeding into the Atlantic may carry pollutants that support sargassum growth.
To explore this, the diffusion attenuation coefficient for downwelling irradiation (The diffusion attenuation coefficient for downwelling irradiation (KD) is a measure of how light dissipates in water, it is an indicator of turbidity and is related to the concentration of scattering particles in the water column.) (KD) is used (Figure 6) as an indicator for water pollution, turbidity, and suspended sediment. The regression indicates a weak positive trend that is not significant for the North study area, and for the South study area, there is a borderline statistically significant increasing trend (p-value = 0.05). This suggests there is likely no co-variance of KD and sargassum biomass for the time period 2011–2022. KD is generally higher in the South study area (where the Congo River joins the Atlantic) peaking in 2015 (KD > 0.159), with a significant biomass in 2017 and 2020; 2017 is the second highest year for biomass indicating potential co-variance, however no co-variance is observed with the other peak years. Comparatively, the North study area has generally lower KD with peaks in 2016 and 2019 which may precede biomass peaks in 2017 and 2020.
Monthly peaks in KD occur most commonly in the north in November and vary in the south, often peaking in August and July, suggesting possible co-variance with sargassum biomass peaks. A source of uncertainty in the data is distance from coast, turbidity and sediment are expected to increase near the coastline and decrease offshore. Studies should compare sargassum biomass and KD close to the coastline verses in the open ocean. Complex nutrient circulation patterns and delays in heavy metal uptake by sargassum mean that co-variance is challenging to confirm from these data; thus, more in-depth research is required to confirm the impact of riverine nutrients on sargassum blooms.

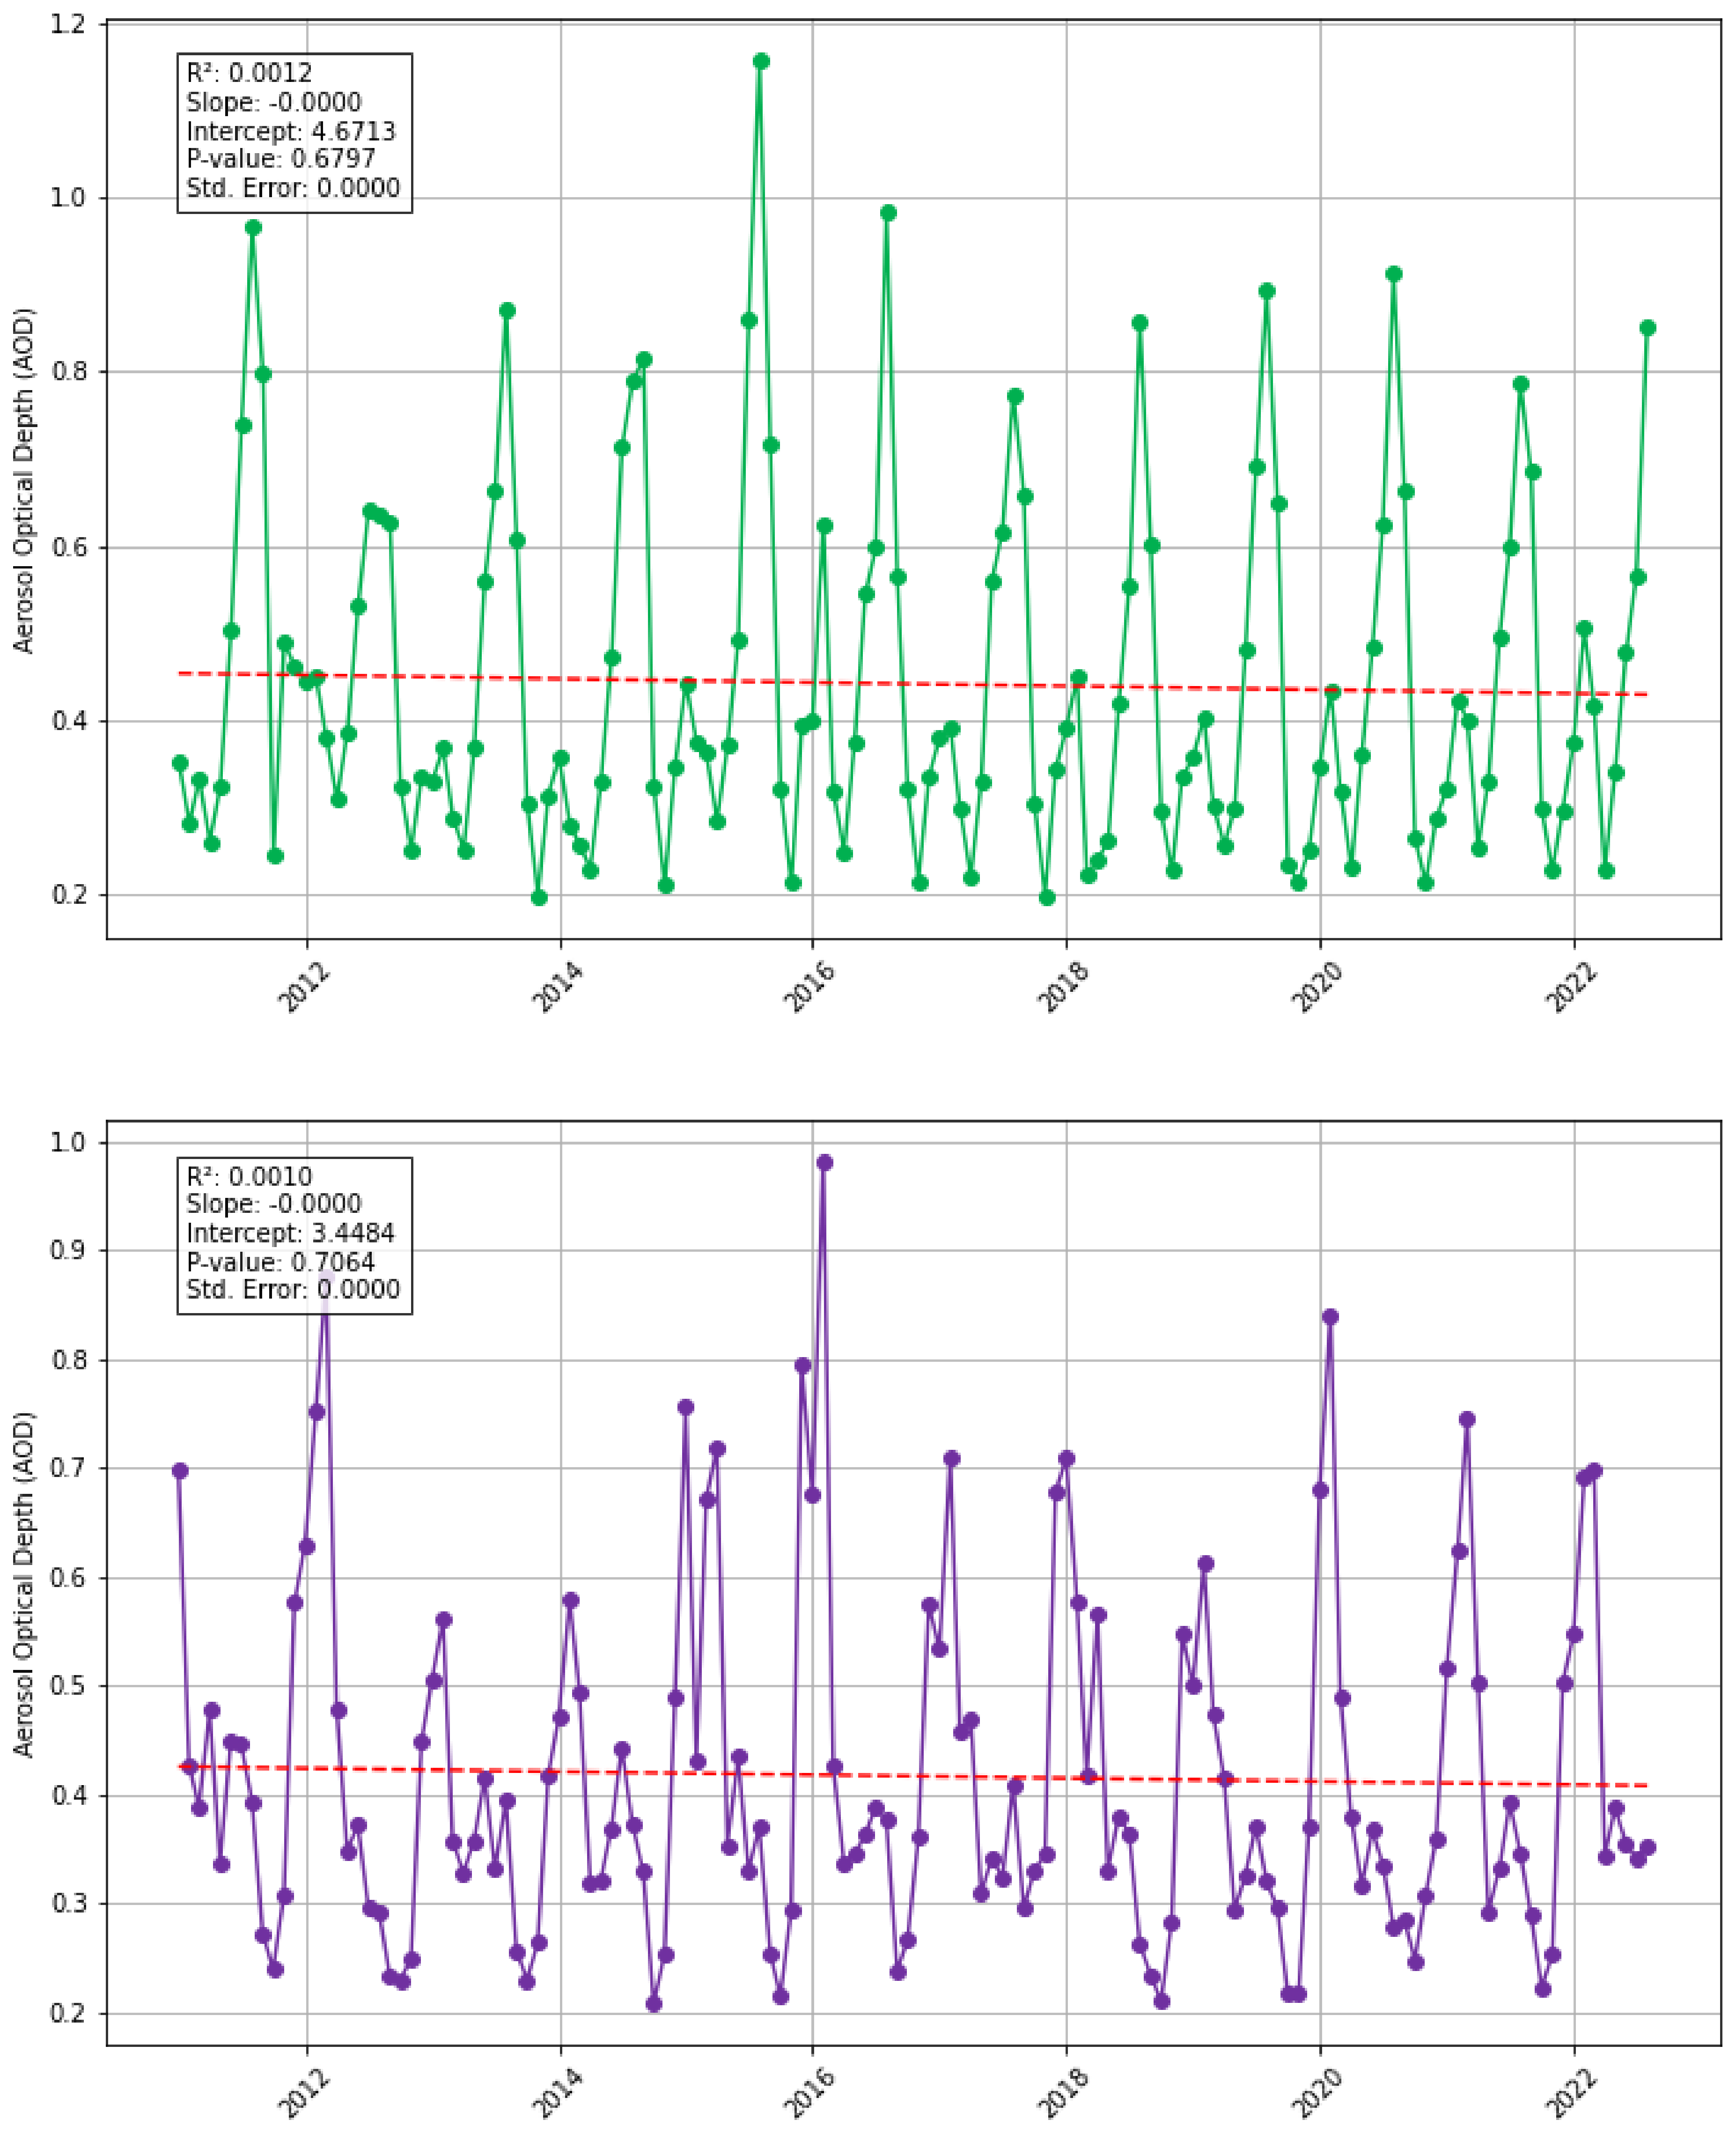
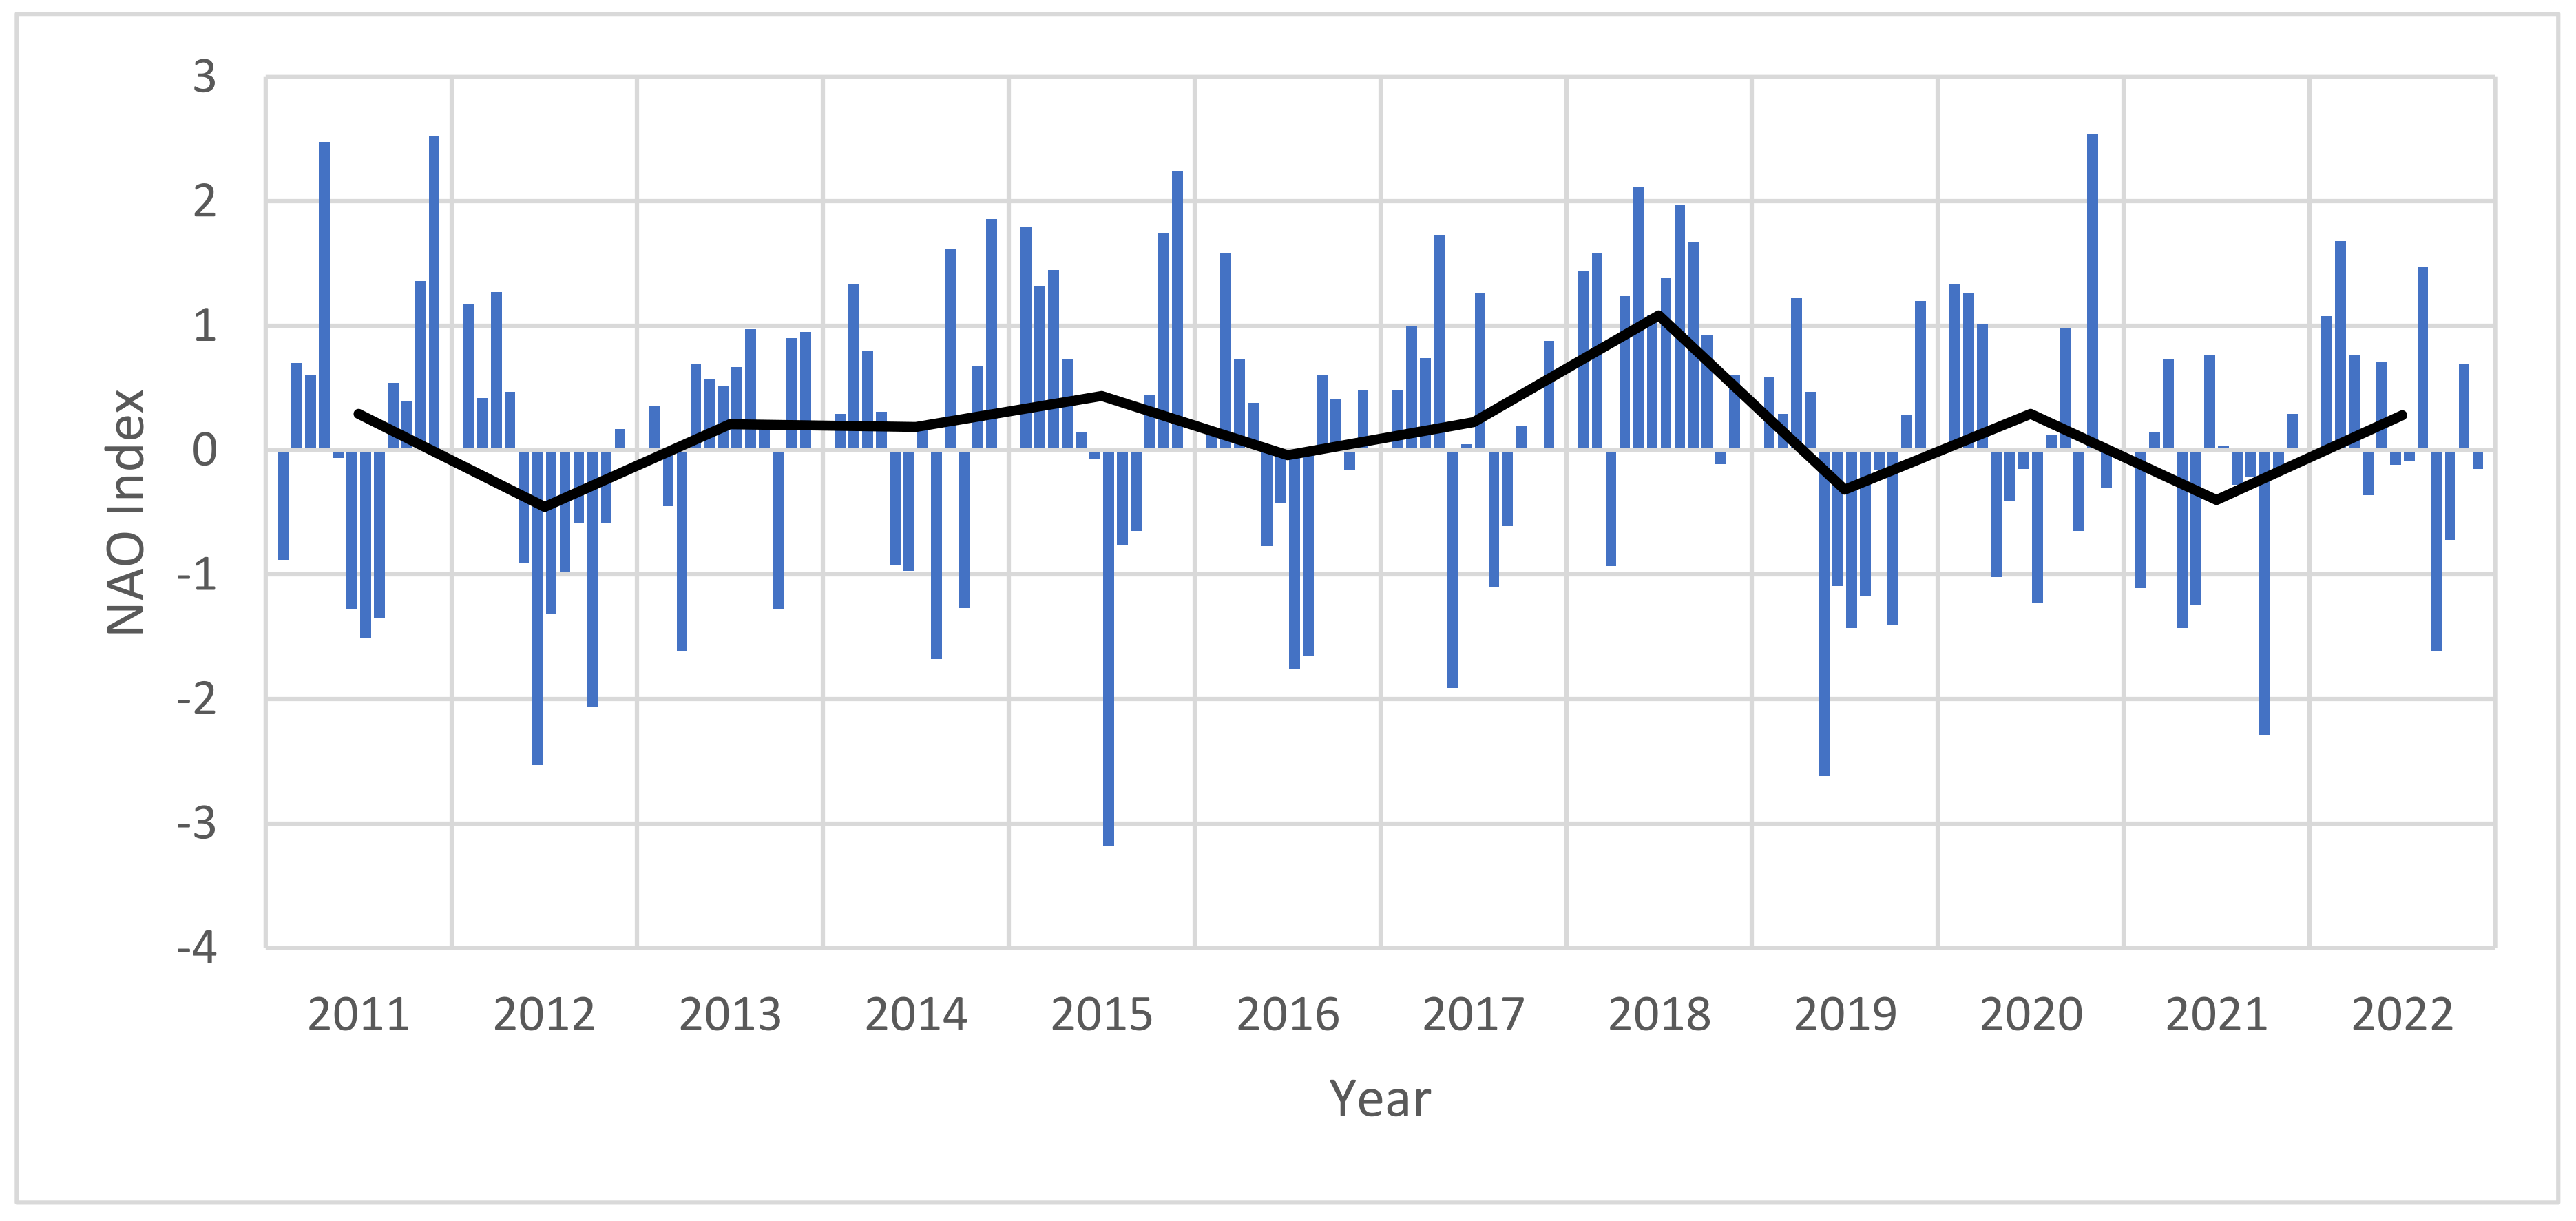
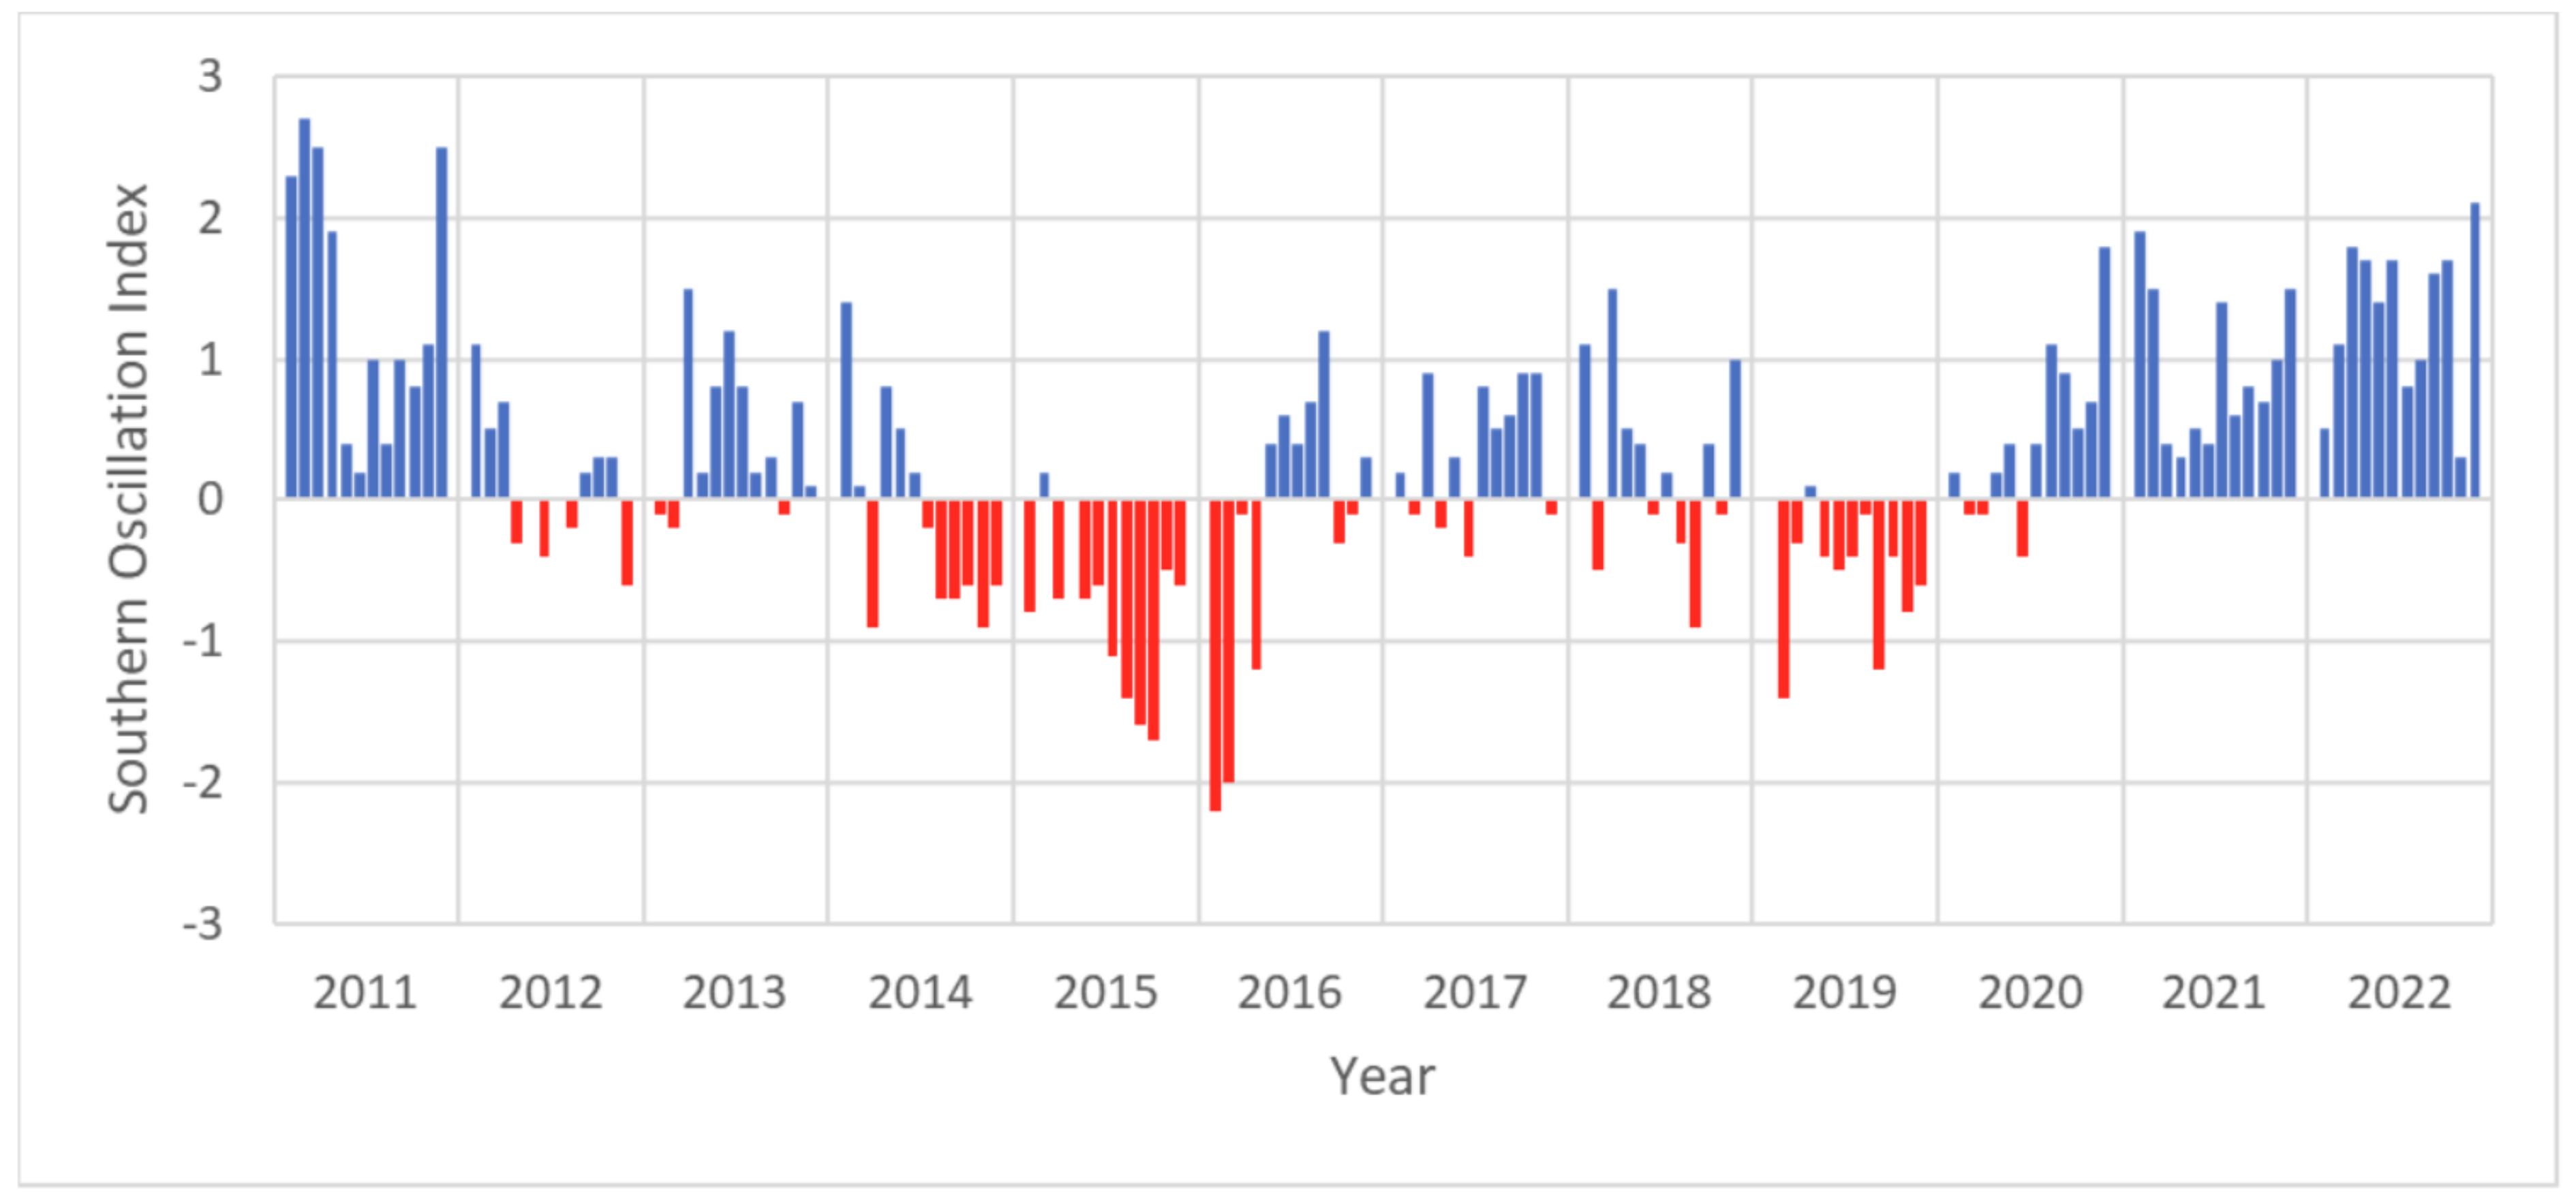
3.4. Are There Any Other Large-Scale Atmospheric, Oceanic, or Other Events That Co-Vary with Sargassum in the Eastern Tropical Atlantic Region Between 2011 and 2022?

In this section we explore events which may co-vary with sargassum biomass in the Eastern Tropical Atlantic, including ocean salinity, NAO, volcanic eruptions, AMOC, ENSO and oil spills. The events explored are motivated by existing hypotheses and suggested areas for further research in academic studies, or they emerge from empirical data documenting perceptions of local communities. The analysis combines quantitative and qualitative assessments which are discussed to draw out preliminary areas for further research, and further explored in the historical timeline (Supplementary Material Section S2). We continue to explore these events in the context of the categories for proximal factors into causal pathways outlined in the UNEP Sargassum White Paper [30]. For these events, it was not possible to access data specific to the North and South study areas separately, highlighting a need for more information and research in these areas.
Salinity: The impacts of salinity on sargassum growth have previously been explored with publications suggesting that low salinity hinders pelagic sargassum growth [56], but Machado et al. (2022) [57] note that this research was based in the Sargasso Sea and may not apply to Atlantic blooms and may vary between morphotypes. Similarly, for S. muticum, another species of sargassum, Steen (2004) [58] found that in low salinity growth and reproduction are slower. Beyond this, there appear to be limited empirical publications on salinity and pelagic sargassum blooms. As such, the co-variance of salinity is explored for the Eastern Tropical Atlantic. Figure 7 shows there is no statistically significant trend. The upper bound or maximum salinity also has no statistically significant trend, but examining the minimum value shows a statistically significant increasing trend (p-value = 0.006). The significant increasing trend of minimum salinity might indicate favourable conditions for sargassum biomass particularly as the trend of sargassum in the North study area also has increasing in biomass; however, the lack of trend in mean and maximum salinity suggests that there are other mitigating factors to consider. We suggest that our analysis indicates that there is potential co-variance of pelagic sargassum and salinity, supporting previous studies, but that further exploration is required.
NAO: Johns et al. (2020) [31] identified that the NAO anomaly of 2009–2010 exported sargassum from the Sargasso Sea to the Tropical Atlantic. The NAO is an oscillation of sea-level pressure between the Icelandic Low and Azores High, resulting in changes in pressure which impacts the location of the jet stream and therefore ocean surface currents and wind fields. In positive phases, there are stronger trade winds, a northerly shift of the westerlies, and milder winters; in negative phases there are weaker trade winds, more southern westerlies, and cooler and wetter winters [31]. Given the established connection between NAO and the initial movement of sargassum blooms in 2011, the NAO between 2011 and 2022 was considered to determine any potential continued influence on the movement of sargassum in the Eastern Tropical Atlantic region (Figure 8). It can be observed that there were major negative NAO events (below −2) in June 2012, October 2012, July 2015, May 2019, and October 2021. There were major positive events (above two) in April 2011, December 2011, December 2015, May 2018, and November 2020. Years with major negative peaks (2012, 2015, 2019, 2021) and years with positive peaks (2011, 2015, 2018, 2020) appear to have no co-variance with wet biomass estimates for either study area. The linear regression indicated no statistically significant trends in NAO across the time period (p-value = 0.9885). To explore this further, a cross-correlation analysis was undertaken (see Supplementary Material Figure S4), and it was found that the North study area had multiple lags at 2, 6 7, 8 and 9 months (7 being most significant) suggesting NAO changes are followed by changes in biomass. However, it also showed some statistically significant negative lags which could either be spurious or reflecting seasonality. Similarly, the South study area only had a –12 month statistically significant lag which could also be spurious, reflective of an annual cycle, due to seasonal autocorrelation, or not meaningful. Given the lack of clear co-variance in both study regions, we suggest that NAO positive and negative phases are likely not a causal pathway of sargassum biomass occurrence in the Eastern Tropical Atlantic, however it is vital to consider that indirect NAO factors such as wind-driven nutrient transport or ocean circulation could still play a role in the causal pathways of sargassum in the regions.
Volcanic eruptions: Iron is an important external input for primary production in surface water areas as it is a limiting factor of algae growth in a wide range of aquatic environments; examples of external inputs include mineral dust and volcanic ash [59,60]. In the North Atlantic, a decrease in surface water dissolved iron with an increase in latitude has been observed due to declining atmospheric inputs, and this has been associated with iron stress [61,62]. Similar to Saharan dust, volcanic aerosols can enter the ocean system and Fe, P and N can facilitate sargassum growth [45]. In the Atlantic region since 2010 there have been five volcanic eruptions with a volcanic explosivity index > 2. These were in 2010, 2011, 2014, and two in 2021 (see historical timeline in Supplementary Materials Table S2). It is hypothesised that these eruptions contribute a nutrient source, particularly supplying iron, and the effects of this on sargassum biomass may not be immediate and could be delayed; for example, we see biomass peaks in 2011, 2015 and 2017, after eruptions. We theorise that the temporal lag is caused by the time it takes for the aerosols to travel and rain episodes to occur, and for the subsequent release and dissolution of the nutrients into the ocean, enabling sargassum growth. More research is needed to explore this mechanism and the long-lasting impacts of eruptions on nutrient cycles and algae growth.
AMOC: The AMOC is a transport mechanism moving heat from low to high latitudes in the Atlantic Ocean, where there is a northward flow of warm water and a colder deeper southward return flow. Multiple reports have shown that Atlantic circulation is likely to change in a warming climate including the 2001 Intergovernmental Panel on Climate Change (IPCC) report showing that AMOC could weaken. Srokosz and Bryden (2015) [39] showed that there was a low AMOC event in 2009–10 where it declined 30%, followed by a general weakening over the next decade. The decline in AMOC was associated with changes in the heat content of the ocean and weather. Sargassum blooms appeared shortly after this decline and have propagated; therefore, there could be co-variance of sargassum biomass increasing as AMOC declines. However, it is challenging to distinguish the effect of AMOC from other ocean and atmospheric factors such as sea surface temperature, currents and wind.
ENSO: The impact of ENSO cycles on sargassum bloom seasons has been established in the Gulf of Mexico, where it has been shown that cold ENSO events supported an increase in the seasonal presence of sargassum, transporting them to the Gulf of Mexico and maintaining them [63]. However, the effect of ENSO on the Eastern Tropical Atlantic has not been established. The Southern Oscillation Index (Figure 9) shows El Nino phases (negative) and La Nina phases (positive); the statistical tests indicate a weak increasing trend suggesting that positive La Nina phases are increasing; however, it is not statistically significant. Particularly strong El Nino phases can be observed in the latter part of 2015 and early 2016, and some co-variation can be seen with the North study area where 2015 was a high biomass year; however, there is no co-variation with the South study area. Strong positive phases can be observed in early 2011 and the end of 2020 into early 2021; 2020 was also a high biomass year for the North study area where it reached its maximum peak. It appears that there is no direct co-variation with ENSO and sargassum biomass in the Eastern Tropical Atlantic, however, studies have suggested that ENSO has a role in the monsoon season in West Africa and that there is a Pacific–Atlantic relationship [64]. The data do not show a consistent or clear co-variance for ENSO and sargassum biomass in the Eastern Tropical Atlantic.
Oil spills: Almeda et al. (2018) [65] demonstrated a connection between oil spills and harmful algal blooms in the Gulf of Mexico, where they found that bloom-forming algae increased in concentration and grazers of phytoplankton decreased. They suggest that oil spills and dispersants disrupt predator–prey controls in plankton food webs creating ‘loopholes’ in the system for other species to thrive. Powers et al. (2013) [66] note that a pool of oil from the Deepwater Horizon spill in the Gulf of Mexico came into contact with large floating sargassum mats causing impacts in three ways: it exposed organisms living in sargassum to high concentrations of oil and contaminants; the application of dispersant caused sargassum to sink, causing oil and dispersant to transport vertically; and it created a low-oxygen environment around the mat potentially impacting and stressing animals using the mat as a habitat. These publications indicate that there are two potential scenarios for sargassum: that they could thrive due to ecosystem alterations where there is a ‘loophole’ after an oil spill, or that they are sunk and removed from the surface due to oil spills. It is possible for both scenarios to co-exist. The Gulf of Guinea is a very active area for oil and gas exploration and the historical timeline established (Supplementary Material Table S2) shows three significant oil spills in 2010, and others in Nigeria in 2011 and 2014. The coincidence of oil spills, commencement of oil extraction from a new oil field in Ghana, and the appearance of sargassum at around the same time has led some communities in Ghana to believe they are connected, but there is no evidence to suggest this perception is true [9]. Many oil spills are unreported in West Africa, hindering our capacity to assess co-variance and establish a holistic timeline [67]. As there is limited evidence for co-variance of oil spills and sargassum, a causal pathway for it cannot be confidently identified. Instead, we propose an additional pathway, as sargassum mats have been shown to sink and move vertically, and there is the potential for oil spills to impact ‘transport within a consolidation region’. More research is needed to understand the relationship between oil spills and sargassum growth and transport.

3.5. Co-Variation Discussion Summary

Nine different factors were assessed for co-variance with sargassum biomass through using numerical qualitative data and descriptive reasoning. The factors were also investigated for their causal pathway based on the UNEP typology [30]; this, along with the outcome of the co-variation assessment, is summarised in Table 2.
From this initial work, it is likely that salinity and AMOC experience co-variance with sargassum biomass in the Eastern Tropical Atlantic. As no co-variance and no causal pathway could be established for NAO, the results suggest that it is not a driver of sargassum for the Eastern Atlantic Region, but its role in triggering the initial entry to the system is acknowledged (as shown by [31]). There is the possibility that salinity, Saharan dust, volcanic eruptions, AMOC, ENSO and water quality/river pollution are supporting the proliferation or transport of sargassum within the Eastern Atlantic region. More work is needed to explore the nature of these relationships to either confirm its presence and to better understand the functional mechanisms, or to resolutely confirm it is not relevant. This is particularly true where variables are contentious, notably water quality/river pollution and oil spills. As oceanic events, atmospheric events, and policy are intertwined and co-exist in the same space and time it is challenging to distinguish their effects from each other. This furthers the need for more exploration on drivers, specifically in the Eastern Tropical Atlantic, including more comprehensive detection of oil spills, exploration of the connectivity between oceanic and atmospheric events and rainfall with sargassum biomass, and water pollution monitoring with biochemical analysis to determine sargassum uptake of nutrients and pollutant metals.

4. Conclusions

For the first time, this paper characterises the seasonal and annual trends of sargassum bloom influxes in West Africa. We have shown that there is a statistically significant increasing trend of sargassum biomass in the northern part of the Eastern Atlantic Region (the coast from Guinea to Gabon), and a non-statistically significant trend in the southern Eastern Atlantic region (from Gabon to Angola). We have also shown that the North and South study regions have varying peak seasons, with the North typically in September and the South most commonly in July or August. Both regions also experience a second smaller peak, which varies in the South but is usually in March-May for the North. For the North region, 2017 had highest biomass accumulation and in the South it was in 2019 (with 2017 s). However, there are challenges with this detection method, particularly associated with cloud cover in the intertropical convergence zone. To enable effective management of sargassum blooms, there is a need for alternative methods to overcome the challenge that cloud cover presents and to address the gaps in the dataset.
This paper has also undertaken novel exploratory work generating hypotheses about the drivers of movement and proliferation of sargassum in Eastern Tropical Atlantic. This research shows that a variety of atmospheric and oceanic events co-vary with sargassum biomass. This does not prove causal relationships, but it highlights areas for future research into the drivers of movement and proliferation of sargassum biomass. We theorise that there is not a single dominating driver or causal pathway of sargassum, but there are many contributing factors and simultaneous compounding events occurring within the system that have created the opportunity for sargassum to be transported across the region and proliferate. This work shows that to better understand the drivers of movement and proliferation of sargassum, research should explore the relative roles of (1) sea surface temperature, (2) sea salinity, and (3) nutrient inputs from natural and anthropogenic sources.

Supplementary Materials

The following supporting information can be downloaded at: https://www.mdpi.com/article/10.3390/phycology5020017/s1, Table S1. Summary detection indices and sensors, with associated publications and noted limitations. Abbreviated sensors: MODIS: Moderate Resolution Imaging Spectroradiometer, Terra (T) and Aqua (A); MERIS: Medium Resolution Imaging Spectrometer; OLCI: Ocean and Land Colour Instrument (OLCI), Sentinel-3 Instrument; VIIRS: Visible Infrared Imager Radiometer Suite; MSI: MultiSpectral Instrument, Sentinel-2 instrument. Table S2. Historical Timeline of Oceanic, Atmospheric and Policy Events. Where entries are categorised by colour: blue represents oceanic events, red volcanic, yellow oil, green atmospheric, grey policy. VEI: Volcanic Explosivity Index; SOI: Southern Oscillation Index; NAO: North Atlantic Oscillation. Figure S1. Biomass of combined study areas. Figure S2: Cross-correlation and Lag Analysis Graphs for North study area (top) and South study area (bottom), between SST and sargassum biomass. Figure S3: Cross-correlation and Lag Analysis Graphs for North study area (left) and South study area (right), between AOD and sargassum biomass. Statistically significant lags (p-value < 0.05) are in red, non-significant lags are in grey. Figure S4: Cross-correlation and Lag Analysis Graphs for North study area (top) and South study area (bottom), between NAO and sargassum biomass. Significant lags noted in red. References [2,15,17,22,23,33,68,69,70,71,72,73,74,75,76,77,78,79,80] are cited in the Supplementary Materials.

Author Contributions

Y.A.F.: investigation, conceptualisation, methodology, data curation, formal analysis, visualisation, writing—original draft. J.D.: supervision, conceptualisation, writing—review and editing. D.Y.A.: writing—review and editing. P.-N.J.-Q.: writing—review and editing. K.A.A.: writing—review and editing. W.N.A.S.: writing—review and editing. E.T.: supervision, conceptualisation, writing—review and editing. All authors have read and agreed to the published version of the manuscript.

Funding

This work was supported by the Economic and Social Research Council GCRF (Grant number: ES/T002964/1), a scholarship from Southampton Marine and Maritime Institute, University of Southampton, and the School of Geography and Environmental Sciences, University of Southampton.

Institutional Review Board Statement

Not applicable.

Informed Consent Statement

Not applicable.

Data Availability Statement

The code to reproduce plots created in this work are shared by authors and available at this Github URL: https://github.com/yfipml/Sargassum_EasternTropicalAtlantic (accessed on 30 April 2024). For data queries please contact the corresponding author, or for biomass data queries please contact the Optical Oceanography Lab at the University of South Florida.

Acknowledgments

We acknowledge the Optical Oceanography Lab at the University of South Florida (https://optics.marine.usf.edu/projects/saws.html, accessed on 30 April 2024) for providing monthly wet biomass data for sargassum for the two study areas in the Eastern Tropical Atlantic for 2011–2022. We would also like to thank Eli Lazarus and Jamie Shutler for their comments and discussion of this work.

Conflicts of Interest

The authors declare no conflict of interest.

References

  1. Wang, M.; Hu, C.; Barnes, B.B.; Mitchum, G.; Lapointe, B.; Montoya, J.P. The great Atlantic Sargassum belt. Science 2019, 365, 83–87. [Google Scholar] [CrossRef] [PubMed]
  2. Ody, A.; Thibaut, T.; Berline, L.; Changeux, T.; Andre, J.M.; Chevalier, C.; Blanfune, A.; Blanchot, J.; Ruitton, S.; Stiger-Pouvreau, V.; et al. From In Situ to satellite observations of pelagic Sargassum distribution and aggregation in the Tropical North Atlantic Ocean. PLoS ONE 2019, 14, e0222584. [Google Scholar] [CrossRef] [PubMed]
  3. Chávez, V.; Uribe-Martínez, A.; Cuevas, E.; Rodríguez-Martínez, R.E.; Van Tussenbroek, B.I.; Francisco, V.; Estévez, M.; Celis, L.B.; Monroy-Velázquez, L.V.; Leal-Bautista, R.; et al. Massive Influx of Pelagic Sargassum spp. on the Coasts of the Mexican Caribbean 2014–2020: Challenges and Opportunities. Water 2020, 12, 2908. [Google Scholar] [CrossRef]
  4. Van Tussenbroek, B.I.; Arana, H.A.H.; Rodríguez-Martínez, R.E.; Espinoza-Avalos, J.; Canizales-Flores, H.M.; González-Godoy, C.E.; Barba-Santos, M.G.; Vega-Zepeda, A.; Collado-Vides, L. Severe impacts of brown tides caused by Sargassum spp. on near-shore Caribbean seagrass communities. Mar. Pollut. Bull. 2017, 122, 272–281. [Google Scholar] [CrossRef]
  5. Rodríguez-Martínez, R.E.; Medina-Valmaseda, A.E.; Blanchon, P.; Monroy-Velázquez, L.V.; Almazán-Becerril, A.; Delgado-Pech, B.; Vásquez-Yeomans, L.; Francisco, V.; García-Rivas, M.C. Faunal mortality associated with massive beaching and decomposition of pelagic Sargassum. Mar. Pollut. Bull. 2019, 146, 201–205. [Google Scholar] [CrossRef]
  6. Ramlogan, N.R.; McConney, P.; Oxenford, H.A. Socio-Economic Impacts of Sargassum Influx Events on the Fishery Sector of Barbados; Centre for Resource Management and Environmental Studies (CERMES), University of the West Indies: Cave Hill, Barbados, 2017; p. 86. [Google Scholar]
  7. Solarin, B.B.; Bolaji, D.A.; Fakayode, O.S.; Akinnigbagbe, R.O. Impacts of an invasive seaweed Sargassum hystrix var. fluitans (Børgesen 1914) on the fisheries and other economic implications for the Nigerian coastal waters. IOSR J. Agric. Vet. Sci. 2014, 7, 1–6. [Google Scholar]
  8. Resiere, D.; Valentino, R.; Nevière, R.; Banydeen, R.; Gueye, P.; Florentin, J.; Cabié, A.; Lebrun, T.; Mégarbane, B.; Guerrier, G.; et al. Sargassum seaweed on Caribbean islands: An international public health concern. Lancet 2018, 392, 2691. [Google Scholar] [CrossRef]
  9. Atiglo, D.Y.; Jayson-Quashigah, P.N.; Sowah, W.; Tompkins, E.L.; Addo, K.A. Misperception of drivers of risk alters willingness to adapt in the case of sargassum influxes in West Africa. Glob. Environ. Change 2024, 84, 102779. [Google Scholar] [CrossRef]
  10. Milledge, J.J.; Nielsen, B.V.; Bailey, D. High-value products from macroalgae: The potential uses of the invasive brown seaweed, Sargassum muticum. Rev. Environ. Sci. Bio/Technol. 2016, 15, 67–88. [Google Scholar] [CrossRef]
  11. Thompson, T.M.; Young, B.R.; Baroutian, S. Pelagic Sargassum for energy and fertiliser production in the Caribbean: A case study on Barbados. Renew. Sustain. Energy Rev. 2020, 118, 109564. [Google Scholar] [CrossRef]
  12. Gray, L.A.; Bisonó León, A.G.; Rojas, F.E.; Veroneau, S.S.; Slocum, A.H. Caribbean-wide, negative emissions solution to Sargassum spp. low-cost collection device and sustainable disposal method. Phycology 2021, 1, 49–75. [Google Scholar] [CrossRef]
  13. Oxenford, H.A.; Cox, S.A.; van Tussenbroek, B.I.; Desrochers, A. Challenges of turning the sargassum crisis into gold: Current constraints and implications for the Caribbean. Phycology 2021, 1, 27–48. [Google Scholar] [CrossRef]
  14. Wang, M.; Hu, C. Predicting Sargassum blooms in the Caribbean Sea from MODIS observations. Geophys. Res. Lett. 2017, 44, 3265–3273. [Google Scholar] [CrossRef]
  15. Gower, J.F.; King, S.A. Distribution of floating Sargassum in the Gulf of Mexico and the Atlantic Ocean mapped using MERIS. Int. J. Remote Sens. 2011, 32, 1917–1929. [Google Scholar] [CrossRef]
  16. Marsh, R.; Addo, K.A.; Jayson-Quashigah, P.-N.; Oxenford, H.A.; Maxam, A.; Anderson, R.; Skliris, N.; Dash, J.; Tompkins, E.L. Seasonal predictions of holopelagic sargassum across the tropical atlantic accounting for uncertainty in drivers and processes: The sartrac ensemble forecast system. Front. Mar. Sci. 2021, 8, 1417. [Google Scholar] [CrossRef]
  17. Maréchal, J.P.; Hellio, C.; Hu, C. A simple, fast, and reliable method to predict Sargassum washing ashore in the Lesser Antilles. Remote. Sens. Appl. Soc. Environ. 2017, 5, 54–63. [Google Scholar] [CrossRef]
  18. Marsh, R.; Oxenford, H.A.; Cox, S.A.L.; Johnson, D.R.; Bellamy, J. Forecasting seasonal sargassum events across the tropical Atlantic: Overview and challenges. Front. Mar. Sci. 2022, 9, 914501. [Google Scholar] [CrossRef]
  19. Fidai, Y.A.; Dash, J.; Tompkins, E.L.; Tonon, T. A systematic review of floating and beach landing records of Sargassum beyond the Sargasso Sea. Environ. Res. Commun. 2020, 2, 122001. [Google Scholar] [CrossRef]
  20. Addico, G.N.D.; deGraft-Johnson, K.A.A. Preliminary investigation into the chemical composition of the invasive brown seaweed Sargassum along the West Coast of Ghana. Afr. J. Biotechnol. 2016, 15, 2184–2191. [Google Scholar]
  21. Oyesiku, O.O.; Egunyomi, A. Identification and chemical studies of pelagic masses of Sargassum natans (Linnaeus) Gaillon and S. fluitans (Borgessen) Borgesen (brown algae), found offshore in Ondo State, Nigeria. Afr. J. Biotechnol. 2014, 13, 1188–1193. [Google Scholar]
  22. Adet, L.; Ragatoa, S.D.; Sanou, C.L.; Meminvegni, G.; Sidibe, M. Mapping Sargassum fluorescence distribution on Nigerian sea. In Unlocking Sub-Sahara African Potentials for Sustainable Development in the 21st Century; Nassarawa State University: Keffi, Nigeria, 2018. [Google Scholar]
  23. Gower, J.; King, S. The distribution of pelagic Sargassum observed with OLCI. Int. J. Remote Sens. 2020, 41, 5669–5679. [Google Scholar] [CrossRef]
  24. Brooks, M.T.; Coles, V.J.; Hood, R.R.; Gower, J.F. Factors controlling the seasonal distribution of pelagic Sargassum. Mar. Ecol. Prog. Ser. 2018, 599, 1–18. [Google Scholar] [CrossRef]
  25. Franks, J.S.; Johnson, D.R.; Ko, D.S. Pelagic Sargassum in the tropical North Atlantic. Gulf Caribb. Res. 2016, 27, SC6–SC11. [Google Scholar] [CrossRef]
  26. Oviatt, C.A.; Huizenga, K.; Rogers, C.S.; Miller, W.J. What nutrient sources support anomalous growth and the recent sargassum mass stranding on Caribbean beaches? A review. Mar. Pollut. Bull. 2019, 145, 517–525. [Google Scholar] [CrossRef]
  27. Skliris, N.; Marsh, R.; Appeaning Addo, K.; Oxenford, H. Physical drivers of pelagic sargassum bloom interannual variability in the Central West Atlantic over 2010–2020. Ocean. Dyn. 2022, 72, 383–404. [Google Scholar] [CrossRef]
  28. Djakouré, S.; Araujo, M.; Hounsou-Gbo, A.; Noriega, C.; Bourlès, B. On the potential causes of the recent Pelagic Sargassum blooms events in the tropical North Atlantic Ocean. Biogeosciences Discuss. 2017, 2017, 1–20. [Google Scholar]
  29. Mendez-Tejeda, R.; Rosado Jiménez, G.A. Influence of climatic factors on Sargassum arrivals to the coasts of the Dominican Republic. J. Oceanogr. Mar. Sci. 2019, 10, 22–32. [Google Scholar] [CrossRef]
  30. UNEP. Sargassum White Paper: Turning the Crisis into an Opportunity. United Nations Environment Programme (UNEP), & Caribbean Environment Programme. 2021. Available online: https://wedocs.unep.org/20.500.11822/36244 (accessed on 1 July 2023).
  31. Johns, E.M.; Lumpkin, R.; Putman, N.F.; Smith, R.H.; Muller-Karger, F.E.; Rueda-Roa, D.T.; Hu, C.; Wang, M.; Brooks, M.T.; Gramer, L.J.; et al. The establishment of a pelagic Sargassum population in the tropical Atlantic: Biological consequences of a basin-scale long distance dispersal event. Prog. Oceanogr. 2020, 182, 102269. [Google Scholar] [CrossRef]
  32. Marsh, R.; Skliris, N.; Tompkins, E.L.; Dash, J.; Dominguez Almela, V.; Tonon, T.; Oxenford, H.A.; Webber, M. Climate-sargassum interactions across scales in the tropical Atlantic. PLOS Clim. 2023, 2, e0000253. [Google Scholar] [CrossRef]
  33. Wang, M.; Hu, C. Mapping and quantifying Sargassum distribution and coverage in the Central West Atlantic using MODIS observations. Remote Sens. Environ. 2016, 183, 350–367. [Google Scholar] [CrossRef]
  34. Wang, M.; Hu, C.; Cannizzaro, J.; English, D.; Han, X.; Naar, D.; Lapointe, B.; Brewton, R.; Hernandez, F. Remote sensing of Sargassum biomass, nutrients, and pigments. Geophys. Res. Lett. 2018, 45, 12–359. [Google Scholar] [CrossRef]
  35. Santer, B.D.; Thorne, P.; Haimberger, L.; Taylor, K.E.; Wigley, T.M.; Lanzante, J.; Solomon, S.; Free, M.; Gleckler, P.J.; Jones, P.D.; et al. Consistency of modelled and observed temperature trends in the tropical troposphere. Int. J. Climatol. 2008, 28, 1703–1722. [Google Scholar] [CrossRef]
  36. Jonsson, B. Brorfred/Ipcc_Oc_Trends: Code Used for the IPPC AR6 Report, version 1.0.0; Zenodo: Genève, Switzerland, 2021. [Google Scholar] [CrossRef]
  37. Barnston, A.G.; Livezey, R.E. Classification, seasonality and persistence of low-frequency atmospheric circulation patterns. Mon. Weather. Rev. 1987, 115, 1083–1126. [Google Scholar] [CrossRef]
  38. Behringer, D.W.; Ji, M.; Leetmaa, A. An improved coupled model for ENSO prediction and implications for ocean initialization. Part I: The ocean data assimilation system. Mon. Weather. Rev. 1998, 126, 1013–1021. [Google Scholar] [CrossRef]
  39. Srokosz, M.A.; Bryden, H.L. Observing the Atlantic Meridional Overturning Circulation yields a decade of inevitable surprises. Science 2015, 348, 1255575. [Google Scholar] [CrossRef]
  40. Ogbuka, J.C.; Nwanmuoh, E.E.; Ogbo, A.I.; Achoru, F.E. Offshore oil spill response base and management of deepwater/offshore oil resources in the Nigerian marine waters: A review. Int. J. Environ. Impacts 2022, 5, 65–81. [Google Scholar] [CrossRef]
  41. Fosu, A.K. Oil and Ghana’s Economy. In The Economy of Ghana Sixty Years after Independence; Aryeetey, E., Kanbur, R., Eds.; Oxford Academic: Oxford, UK, 2017. [Google Scholar] [CrossRef]
  42. Stout, S.A.; Rouhani, S.; Liu, B.; Oehrig, J.; Ricker, R.W.; Baker, G.; Lewis, C. Assessing the footprint and volume of oil deposited in deep-sea sediments following the Deepwater Horizon oil spill. Mar. Pollut. Bull. 2017, 114, 327–342. [Google Scholar] [CrossRef]
  43. Platnick, S.; Hubanks, P.; Meyer, K.; King, M.D. MODIS Atmosphere L3 Monthly Product (08_L3); NASA MODIS Adaptive Processing System, Goddard Space Flight Center: Washington, DC, USA, 2015. [Google Scholar] [CrossRef]
  44. Magaña-Gallegos, E.; Villegas-Muñoz, E.; Salas-Acosta, E.R.; Barba-Santos, M.G.; Silva, R.; van Tussenbroek, B.I. The Effect of Temperature on the Growth of Holopelagic Sargassum Species. Phycology 2023, 3, 138–146. [Google Scholar] [CrossRef]
  45. Leemans, L.; Magaña-Gallegos, E.; van Katwijk, M.M.; Lamers, L.P.; Smolders, A.J.; Bouma, T.J.; Christianen, M.J.; van Tussenbroek, B.I. Iron co-limitation of Sargassum fluitans. Aquat. Bot. 2025, 196, 103807. [Google Scholar] [CrossRef]
  46. Xu-Yang, Y.; Dessert, C.; Losno, R. Atmospheric Deposition over the Caribbean region: Sea salt and Saharan dust are sources of essential elements on the island of Guadeloupe. J. Geophys. Res. Atmos. 2022, 127, e2022JD037175. [Google Scholar] [CrossRef]
  47. Xian, P.; Klotzbach, P.J.; Dunion, J.P.; Janiga, M.A.; Reid, J.S.; Colarco, P.R.; Kipling, Z. Revisiting the relationship between Atlantic dust and tropical cyclone activity using aerosol optical depth reanalyses: 2003–2018. Atmos. Chem. Phys. 2020, 20, 15357–15378. [Google Scholar] [CrossRef]
  48. Kazapoe, R.W.; Amuah, E.E.Y.; Abdiwali, S.A.; Dankwa, P.; Nang, D.B.; Kazapoe, J.P.; Kpiebaya, P. Relationship between small-scale gold mining activities and water use in Ghana: A review of policy documents aimed at protecting water bodies in mining communities. Environ. Chall. 2023, 12, 100727. [Google Scholar] [CrossRef]
  49. Faseyi, C.A.; Miyittah, M.K.; Sowunmi, A.A.; Yafetto, L. Water quality and health risk assessments of illegal gold mining-impacted estuaries in Ghana. Mar. Pollut. Bull. 2022, 185, 114277. [Google Scholar] [CrossRef]
  50. Miyittah, M.K.; Tulashie, S.K.; Tsyawo, F.W.; Sarfo, J.K.; Darko, A.A. Assessment of surface water quality status of the Aby Lagoon System in the Western Region of Ghana. Heliyon 2020, 6, e04466. [Google Scholar] [CrossRef]
  51. Davis, D.; Simister, R.; Campbell, S.; Marston, M.; Bose, S.; McQueen-Mason, S.J.; Gomez, L.D.; Gallimore, W.A.; Tonon, T. Biomass composition of the golden tide pelagic seaweeds Sargassum fluitans and S. natans (morphotypes I and VIII) to inform valorisation pathways. Sci. Total. Environ. 2021, 762, 143134. [Google Scholar] [CrossRef]
  52. Tonon, T.; Machado, C.B.; Webber, M.; Webber, D.; Smith, J.; Pilsbury, A.; Cicéron, F.; Herrera-Rodriguez, L.; Jimenez, E.M.; Suarez, J.V.; et al. Biochemical and elemental composition of pelagic Sargassum biomass harvested across the caribbean. Phycology 2022, 2, 204–215. [Google Scholar] [CrossRef]
  53. Nassar, C.A.; Lavrado, H.P.; Yoneshigue-Valentin, Y.O.C.I.E. Effects of iron-ore particles on propagule release, growth and photosynthetic performance of Sargassum vulgare C. Agardh (Phaeophyta, Fucales). Braz. J. Bot. 2002, 25, 459–468. [Google Scholar] [CrossRef]
  54. Gouvêa, L.P.; Assis, J.; Gurgel, C.F.; Serrão, E.A.; Silveira, T.C.; Santos, R.; Duarte, C.M.; Peres, L.M.; Carvalho, V.F.; Batista, M.; et al. Golden carbon of Sargassum forests revealed as an opportunity for climate change mitigation. Sci. Total Environ. 2020, 729, 138745. [Google Scholar] [CrossRef]
  55. Heyes, A.; Powers, L.; Leonzo, K.; Alvarez, J.P.; Gonsior, M. Mercury and Carbon Linkages in Macroalgae Sargassum Mats: Coastal Stranding Leads to Degradation, Shifts in Dissolved Organic Matter Composition and Mercury Methylation. In Proceedings of the AGU Fall Meeting Abstracts, Washington, DC, USA, 10–14 December 2018; Volume 2018, p. B51K-2101. [Google Scholar]
  56. Hanisak, M.D.; Samuel, M.A. Growth rates in culture of several species of Sargassum from Florida, USA. In Twelfth International Seaweed Symposium, Proceedings of the Twelfth International Seaweed Symposium, Sao Paulo, Brazil, 27 July–1 August 1986; Springer: Dordrecht, The Netherlands, 1987; pp. 399–404. [Google Scholar]
  57. Machado, C.B.; Maddix, G.M.; Francis, P.; Thomas, S.L.; Burton, J.A.; Langer, S.; Larson, T.R.; Marsh, R.; Webber, M.; Tonon, T. Pelagic Sargassum events in Jamaica: Provenance, morphotype abundance, and influence of sample processing on biochemical composition of the biomass. Sci. Total Environ. 2022, 817, 152761. [Google Scholar] [CrossRef]
  58. Steen, H. Effects of reduced salinity on reproduction and germling development in Sargassum muticum (Phaeophyceae, Fucales). Eur. J. Phycol. 2004, 39, 293–299. [Google Scholar] [CrossRef]
  59. Langmann, B.; Zakšek, K.; Hort, M.; Duggen, S. Volcanic ash as fertiliser for the surface ocean. Atmos. Chem. Phys. 2010, 10, 3891–3899. [Google Scholar] [CrossRef]
  60. Natsuike, M.; Endo, Y.; Ito, H.; Miyamoto, M.; Yoshimura, C.; Fujii, M. Iron uptake kinetics by coastal micro- and macro-algae in relation to riverine and coastal organic matter. Estuar. Coast. Shelf Sci. 2020, 235, 106580. [Google Scholar] [CrossRef]
  61. Wu, J.; Boyle, E. Iron in the Sargasso Sea: Implications for the processes controlling dissolved Fe distribution in the ocean. Glob. Biogeochem. Cycles 2002, 16, 33-1–33-8. [Google Scholar] [CrossRef]
  62. Achterberg, E.P.; Steigenberger, S.; Marsay, C.M.; LeMoigne, F.A.; Painter, S.C.; Baker, A.R.; Connelly, D.P.; Moore, C.M.; Tagliabue, A.; Tanhua, T. Iron biogeochemistry in the high latitude North Atlantic Ocean. Sci. Rep. 2018, 8, 1283. [Google Scholar] [CrossRef]
  63. Sanchez-Rubio, G.; Perry, H.; Franks, J.S.; Johnson, D.R. Occurrence of pelagic Sargassum in waters of the US Gulf of Mexico in response to weather-related hydrographic regimes associated with decadal and interannual variability in global climate. Fish. Bull. 2018, 116, 93–106. [Google Scholar]
  64. Joly, M.; Voldoire, A. Role of the Gulf of Guinea in the inter-annual variability of the West African monsoon: What do we learn from CMIP3 coupled simulations? Int. J. Clim. 2010, 30, 1843–1856. [Google Scholar] [CrossRef]
  65. Almeda, R.; Cosgrove, S.; Buskey, E.J. Oil spills and dispersants can cause the initiation of potentially harmful dinoflagellate blooms (“Red Tides”). Environ. Sci. Technol. 2018, 52, 5718–5724. [Google Scholar] [CrossRef]
  66. Powers, S.P.; Hernandez, F.J.; Condon, R.H.; Drymon, J.M.; Free, C.M. Novel pathways for injury from offshore oil spills: Direct, sublethal and indirect effects of the Deepwater Horizon oil spill on pelagic Sargassum communities. PLoS ONE 2013, 8, e74802. [Google Scholar] [CrossRef]
  67. Najoui, Z.; Amoussou, N.; Riazanoff, S.; Aurela, G.; Frappartd, F. Oil slicks in the Gulf of Guinea–10 years of Envisat ASAR observations. Earth Syst. Sci. Data Discuss. 2022, 14, 4569–4588. [Google Scholar] [CrossRef]
  68. Hu, C. A novel ocean color index to detect floating algae in the global oceans. Remote Sens. Environ. 2009, 113, 2118–2129. [Google Scholar] [CrossRef]
  69. Dierssen, H.M.; Chlus, A.; Russell, B. Hyperspectral discrimination of floating mats of seagrass wrack and the macroalgae Sargassum in coastal waters of Greater Florida Bay using airborne remote sensing. Remote Sens. Environ. 2015, 167, 247–258. [Google Scholar] [CrossRef]
  70. Hu, C.; Feng, L.; Hardy, R.F.; Hochberg, E.J. Spectral and spatial requirements of remote measurements of pelagic Sargassum macroalgae. Remote Sens. Environ. 2015, 167, 229–246. [Google Scholar] [CrossRef]
  71. Gower, J.; Hu, C.; Borstad, G.; King, S. Ocean color satellites show extensive lines of floating Sargassum in the Gulf of Mexico. IEEE Trans. Geosci. Remote Sens. 2006, 44, 3619–3625. [Google Scholar] [CrossRef]
  72. Gower, J.; King, S. Satellite images show the movement of floating Sargassum in the Gulf of Mexico and Atlantic Ocean. Nat. Preced. 2008, 1–13. [Google Scholar] [CrossRef]
  73. Gower, J.; Young, E.; King, S. Satellite images suggest a new Sargassum source region in 2011. Remote Sens. Lett. 2013, 4, 764–777. [Google Scholar] [CrossRef]
  74. Hu, C.; Hardy, R.; Ruder, E.; Geggel, A.; Feng, L.; Powers, S.; Hernandez, F.; Graettinger, G.; Bodnar, J.; McDonald, T. Sargassum coverage in the northeastern Gulf of Mexico during 2010 from Landsat and airborne observations: Implications for the Deepwater Horizon oil spill impact assessment. Mar. Pollut. Bull. 2016, 107, 15–21. [Google Scholar] [CrossRef]
  75. McCarthy, S.; Gallegos, S.C.; Armstrong, D. Automated Sargassum Detection for Landsat Imagery. In Proceedings of the American Geophysical Union, The Ocean Sciences Meeting 2016, New Orleans, LA, USA, 21–26 February 2016; p. OD34A-2501. [Google Scholar]
  76. Ped, J.; Scaduto, E.; Accorsi, E.; Torres-Pérez, J. Caribbean Oceans: Utilizing NASA Earth Observations to Detect, Monitor, and Respond to Unprecedented Levels of Sargassum in the Caribbean Sea; NTRS—NASA Technical Reports, report no. NF1676L-24244; NASA: Washington, DC, USA, 2016. [Google Scholar]
  77. Wang, M.; Hu, C. Automatic extraction of Sargassum features from sentinel-2 msi images. IEEE Trans. Geosci. Remote Sens. 2020, 59, 2579–2597. [Google Scholar] [CrossRef]
  78. Wang, M.; Hu, C. On the continuity of quantifying floating algae of the Central West Atlantic between MODIS and VIIRS. Int. J. Remote Sens. 2018, 39, 3852–3869. [Google Scholar] [CrossRef]
  79. Minghelli, A.; Chevalier, C.; Descloitres, J.; Berline, L.; Blanc, P.; Chami, M. Synergy between Low Earth Orbit (LEO)—MODIS and Geostationary Earth Orbit (GEO)—GOES Sensors for Sargassum Monitoring in the Atlantic Ocean. Remote Sens. 2021, 13, 1444. [Google Scholar] [CrossRef]
  80. Sutton, M.; Stum, J.; Hajduch, G.; Dufau, C.; Maréchal, J.P.; Lucas, M. Monitoring a new type of pollution in the Atlantic Ocean: The sargassum algae. In Proceedings of the OCEANS 2019-Marseille 2019, Marseille, France, 17–20 June 2019; IEEE: Marseille, France, 2019; pp. 1–4. [Google Scholar]
Figure 1. Map showing study location, where the ‘North’ study area is highlighted in green and the ‘South’ in purple. The sargassum detection and methods were undertaken in ocean areas only; the boxes are representative of the boundaries of the gridded satellite imagery used for detection. The locations of where the major rivers join the Atlantic are also indicated with red dots.
Phycology 05 00017 g001
Figure 2. Time-series of monthly wet biomass (in metric tons) detected in the North study area (top) and South (bottom) of the Eastern Tropical Atlantic using AFAI and MODIS between January 2011 and August 2022. Including the Santer linear regression trend line (red dashed). Standard deviation is also plotted (shaded areas), with the lower bound set to zero for any negative values (due to a large standard deviation).
Phycology 05 00017 g002
Figure 3. Annual accumulation of wet sargassum biomass for the Eastern Tropical Atlantic North and South study areas, January 2011–August 2022.
Phycology 05 00017 g003
Figure 4. Monthly sea surface temperature for the Eastern Tropical Atlantic for North (green) and South (purple) study areas, and Santer linear regression analysis (red dashed line).
Phycology 05 00017 g004aPhycology 05 00017 g004b
Figure 5. Monthly AOD (2011–2022) for each study area, North (green) and South (purple), with Santer linear regression trend line (red dashed line).
Phycology 05 00017 g005
Figure 6. Monthly KD (2011–2022) for each study area; North (green) and South (purple) with Santer linear regression analysis (red dashed line).
Phycology 05 00017 g006
Figure 7. Annual salinity: mean, minimum and maximum values for the Eastern Tropical Atlantic. Linear regression results: Mean: slope = −1.3781 × 10⁻⁸, R-squared = 0.0479, p-value = 0.4944, Standard Error = 1.9432 × 10⁻⁸, Intercept = 0.0453. Min: slope = 2.7081 × 10⁻⁷, R-squared = 0.5461, p-value = 0.0060, Standard Error = 7.8070 × 10⁻⁸, Intercept = −0.1665. Max: slope = −7.8427 × 10⁻⁹, R-squared = 0.0238, p-value = 0.6320, Standard Error = 1.5877 × 10⁻⁸, Intercept = 0.0421.
Phycology 05 00017 g007
Figure 8. Monthly NAO index 2011–2022 (monthly values in blue, annual average shown in black). Linear regression: slope = −1.09 × 10⁻⁶, R-squared = 1.46 × 10⁻⁶, p-value = 0.9885, Standard error = 7.59 × 10⁻⁵, intercept = 0.9539.
Phycology 05 00017 g008
Figure 9. Monthly Southern Oscillation Index for 2011–2022 El Nino phases (negative, red) and La Nina phases (positive, blue). Linear regression: slope = 7.47 × 10⁻⁵, R-squared = 0.0109, p-value = 0.2127, Standard error = 5.97 × 10⁻⁵, intercept = −54.683.
Phycology 05 00017 g009
Table 1. Summary of factors assessed for co-variance, including a description and data source. All URLs and data were accessed and downloaded in May 2023.
DataDescription/Data Type and ProcessingData Source
Ocean
North Atlantic Oscillation (NAO)Monthly NAO index (calculation based on the Rotated Principle Component Analysis by Barnston and Livezey 1987 [37]).
Downloaded in ASCII format and processed in MS Excel.
National Oceanic and Atmospheric Administration (NOAA)
URL: https://www.cpc.ncep.noaa.gov/products/precip/CWlink/pna/norm.nao.monthly.b5001.current.ascii.table (accessed on 1 July 2023)
Sea surface temperatureDaytime Sea Surface Temperature (measured in Celsius) derived from MODIS Aqua Satellite data.
Downloaded in csv format and processed in MS Excel and Python.
Giovanni NASA Earth Data, Aqua MODIS Global Mapped 11 µm Daytime Sea Surface Temperature (Data Product: MODISA_L3 m_SST_ Monthly_9 km_vR2019.0)
URL: https://giovanni.gsfc.nasa.gov/ (accessed on 1 July 2023)
Sea salinitySalinity, measured as monthly mean, measured in kilograms, for sea surface up to 5.0 mdeep.
Downloaded in netCDF format and processed in ArcGIS Pro and Python.
Behringer and Leetmaa (1998) [38] from NCEP Global Ocean Data Assimilation System (GODAS) data provided by the NOAA Physical Sciences Laboratory, Boulder, Colorado, USA, URL: https://psl.noaa.gov (accessed on 1 July 2023)
Atlantic Meridional Overturning Circulation (AMOC)The AMOC system of ocean currents circulates water within the Atlantic Ocean, moving warm water and nutrients across the globe; it is important for heat transport. Here, trends and anomalies trends are noted and discussed.
Information/data from empirical publications.
Srokosz and Bryden (2015) [39]
El Niño Southern Oscillation (ENSO)Measured by the Southern Oscillation Index (standardised index based on sea level pressure differences between Tahiti (French Polynesia) and Darwin, (Australia)).
Downloaded in csv format and processed in MS Excel and Python.
National Oceanic and Atmospheric Administration (NOAA)
URL: https://www.ncei.noaa.gov/access/monitoring/enso/soi (accessed on 1 July 2023)
Oil spillsMajor events in the Atlantic and West Africa.
Information/data from empirical publications.
Ogbuka et al. (2022) [40]; Fosu (2017) [41]; Stout et al. (2017) [42]
Atmospheric
Saharan DustAerosol Optic Depth (a measure of the aerosols, including dust, distributed within a column of air from the instrument to the earth’s surface) derived from MODIS Terra data.
Downloaded in csv format and processed in MS Excel and Python.
Platnick et al. (2015) [43] from Giovanni NASA Earth Data, (Data Product: MYD08_M3 v6.1)
URL: https://giovanni.gsfc.nasa.gov/ (accessed on 1 July 2023)
Volcanic eruptionsVolcanic eruptions in the Atlantic region, which were also associated with ash, gas clouds or material production.Smithsonian Institution, Global Volcanism Program
URL: https://volcano.si.edu/ (accessed on 1 July 2023)
Nutrient inputs
Volcanic eruptions (see above)
Suspended sedimentDiffuse attenuation coefficient for downwelling irradiance (derived from MODIS Aqua data) measures how light dissipates with depth in water. Additionally, any notable impacts/events on water pollution quality or policies which came into effect 2009 onwards in the West African region were considered.
Downloaded in csv format and processed in MS Excel and Python.
DOI: 10.5067/AQUA/MODIS/L3M/KD/2022 from Giovanni NASA Earth Data
URL: https://giovanni.gsfc.nasa.gov/ (accessed on 1 July 2023)
Table 2. Summary of factors explored for co-variance with sargassum biomass in the Eastern Tropical Atlantic. Confidence in co-variance was established quantitively where possible and qualitatively based on the evidence explored (including regression analysis and existing literature); ‘L’ indicates low confidence, ‘M’ indicates medium confidence, and ‘H’ indicates high confidence. ‘N.O/U’ or ‘N.D/U’ indicate the driver has no observed/determined co-variance/pathway or is unknown. Drivers listed in italics indicate exploration based on quantitative data observations with qualitative judgements; drivers listed in standard font were explored through reanalysing data from literature and qualitative assessments; water quality/river pollution uses both.
DriverCo-VarianceCausal Pathway
Temporal Co-VarianceTemporal DelayNone Observed/UnknownPersistence/Proliferation Transfer to NewTransport Within None Determined/Unknown
Sea surface temperatureHH N.D/U
SalinityM H
NAO N.O/U N.D/U
Saharan DustL H
Volcanic eruptions L H
AMOCH LLL
ENSO N.O/ULL
Oil Spills N.O/U H
Water quality/river pollutionLL L
Disclaimer/Publisher’s Note: The statements, opinions and data contained in all publications are solely those of the individual author(s) and contributor(s) and not of MDPI and/or the editor(s). MDPI and/or the editor(s) disclaim responsibility for any injury to people or property resulting from any ideas, methods, instructions or products referred to in the content.

