Article

Influence of Algal Strain on Permeate Flux Rate in Crossflow Microfiltration

by
Mostafa Khademi
1,2 and
Chandra Theegala
1,2,*
1
Department of Biological and Agricultural Engineering, Louisiana State University, 161 EB Doran Bldg., Baton Rouge, LA 70803, USA
2
Louisiana State University Agriculture Center, Baton Rouge, LA 70894, USA
*
Author to whom correspondence should be addressed.
Phycology 2025, 5(2), 18; https://doi.org/10.3390/phycology5020018
Submission received: 7 November 2024 / Revised: 27 February 2025 / Accepted: 6 March 2025 / Published: 7 May 2025

Abstract

:
The separation of microalgae from a culture medium is a major cost and energy hurdle for the efficient production of algal biomass. Crossflow microfiltration has been found to be promising for the algal cell concentration process. Three algal strains with different cell sizes and morphology, namely Chlorella vulgaris, Nannochloris sp., and Scenedesmus sp., were studied. Analysis of the culture suspensions showed very different particle size distributions for the selected strains due to cell clustering. For a given membrane under the same operational conditions to achieve an equal volumetric reduction factor, Nannochloris sp., with the biggest particles and smallest cells, demonstrated the highest permeation flux, and in the same order of the particle sizes, it was followed by Chlorella vu. and Scenedesmus sp. For all the selected algal species, the highest dewatering rate (176–303 L/m2·h) was obtained by means of the membrane with the smallest pore size of 0.05 µm.

1. Introduction

With major advancements in algal biotechnology, microalgae offers great opportunities for the replacement of traditional products and biomolecules in various industries such as human foods, animal feed, cosmetics, fine chemicals, and pharmaceuticals [1]. Several species of microalgae contain lipid contents ranging from 20–50% by weight of biomass, which makes it a suitable feedstock for biodiesel production [2]. Furthermore, microalgal biomass contains carbohydrates and sugars that can be converted to bioethanol via fermentation [3,4]. The primary interest in renewable algal biofuels is to minimize the detrimental impact of using fossil fuels derived from coal, natural gas, and crude oil [5]. Apart from bioproduct and biofuel applications, microalgae offer inherent advantages in carbon capture, sequestration, and utilization [6].
The global microalgae market was estimated at USD 3.4 billion and is projected to reach USD 4.6 billion by the year 2027, growing at a CAGR (compound annual growth rate) of 4.3% [7]. Despite all the merits and potential of microalgae, its widespread acceptance and large-scale industrial production of biomass is restricted by the high water requirements and high-energy costs associated with harvesting [8,9]. The high harvesting costs stem from the small size of microalgae (2–30 µm), their growth in strongly diluted conditions, and marginal density differences to culture medium [9,10]. Currently, microalgal harvesting accounts for as much as 20–30% of the production costs and has high environmental implications [11,12,13].
The common harvesting methods are sedimentation, coagulation, flocculation, flotation, centrifugation, screening, and membrane filtration. The most efficient harvesting methods that can harvest up to 99% of algal cells involve the physical separation of cells using centrifugation or filtration [14]. Due to the high costs associated with centrifuge-based harvesting, improvements in manufacturing technology, expansion of applications, and a reduction in membrane manufacturing costs, membrane technology is increasingly viewed as a viable alternative for algal harvesting. An advantage of membrane technology is the physical screening of protozoans, bacteria, and viruses while retaining residual nutrients in the culture medium [15,16]. In addition, the membrane filtration process is chemical-free, non-toxic, can achieve high separation efficiencies (up to 100%), and allows both the continuous and discontinuous separation of cells and the reusability of the culture medium [17]. Membrane technology has several inherent advantages, such as high energy efficiency, excellent scalability, a small footprint, low maintenance, and easy operation [18,19,20,21].
However, membrane-based cell harvesting is not without its limitations. The biggest challenge encountered is the membrane surface fouling by microalgae and other organic matter [22,23,24]. The fouling is partly addressed with crossflow microfiltration, where the feeding fluid flows tangentially to the membrane surface and continuously removes the larger particles that might cause blocking [25]. A study on centrifugation [26] concluded that the cost of harvesting could be lowered significantly by increasing the culture densities and lipid content of the algal cells. Thus, to improve the cost-effectiveness of centrifugation, membranes can be utilized as an upstream process to increase the culture density. The objective of this research was to study the species dependency of crossflow microfiltration of three algal strains by means of tubular membranes of different pore sizes.

2. Materials and Methods

2.1. Algal Cultures Characteristics

Algae from the Chlorophyceae class of three strains, including Chlorella vulgaris, Nannochloris sp., and Scenedesmus sp., were purchased from UTEX The Culture Collection of Algae and grown in batch mode in Guillard’s F/2 media. Cultures (a 200 mL liquid volume) were grown in 1 L Erlenmeyer flasks placed on an incubator/orbital shaker (Model C25KC, New Brunswick Scientific Co., Edison, NJ, USA) under continuous artificial lighting at 25 °C and an orbital shaking rate of 100 RPM. The cultures grew in an exponential phase up to day 5, when additional substrate was supplied to maintain the growth of the algae. Substrate addition was repeated on the 10th day to keep the culture growing up to day 15. Samples were taken on the 5th and 15th days of the growth period. The batch algal cultures grown under continuous lighting (fluorescent bulbs with a 5000 K filament temperature) were in the active log growth phase on day 5. However, the cells usually entered the stationary phase and declining growth phases by days 10–14, depending on the species. As cells die, fragments are formed, and cellular components are released into the water. To observe healthy cells in a log growth phase and to identify cell clustering and particle size changes in older cultures, samples were collected on day 5 and day 15. To study and compare the algal cell sizes and shapes, the images captured by a LEICA confocal laser scanning microscope were analyzed by ImageJ software 1.47v. The algal suspension contained intact algal cells as well as particles (cell fragments, microparticles, macromolecules, and cell clusters). In addition to cell microscopy, particle size distribution analysis was carried out with a Beckman Coulter LS 200 that could characterize particles within the 0.375 µm–2000 µm range.
For the algal filtration experiments, 2 L of indoor cultures with a cell concentration of around 200 mg-dry/L were transferred to outdoor columns with 90 L of sterile culture water. Compressed air was pumped through air stones to provide the necessary culture agitation, carbon dioxide, and degassing. Cultures were grown under sunlight for 5 days until the algal cell concentration was above 150 mg/L. These cultures were used for filtration experiments.

2.2. Filtration Setup

Three Polyvinylidene Fluoride (PVDF) tubular microfiltration modules with nominal pore sizes of 0.05 µm, 0.1 µm, and 0.5 µm were provided by Porex® (Model CBK70A, Adam Equipment, Oxford, MS, USA). Each 1.829 m long module had one membrane tube with a 12.7 mm nominal ID and 0.07 m2 total active surface area. Figure 1 shows the schematic of the filtration setup. To evaluate the influence of the membrane pore size on the filtration of a specific strain, all crossflow microfiltration experiments were performed under a constant transmembrane pressure (TMP) of 103.4 kPa and a crossflow velocity (CFV) of 2.63 m/s by regulating the flows through the gate valves. Algal cultures of the same age on the 5th day were tested. Initial concentrations of the suspensions were diluted to result in an algal density of 134 ± 2.4 mg/L using DI water. The permeate was collected and weighed by an Adam® CBK70A digital scale, and the retentate was recycled to the 20 L feed tank. The algal suspension was continuously concentrated until 15 L of permeate was accumulated. The permeation flow rate was computed over one-minute intervals using the DASYLAB data acquisition program. The permeation flux (J) was simply calculated by dividing the flow rates by the membrane area.
The volumetric reduction factor (VRF) and concentration factor (CF) are given by Equations (1) and (2):
V R F = V 0 V f
C F = C f C 0
where V0 and C0 are the initial volumes, and Vf and Cf are the final volumes and concentrations, respectively. For all the experiments, the VRF was set at 4 (meaning a culture concentrated by 4×). Since the optical density (OD) observations demonstrated that no biomass existed in the samples taken from the permeation flow, the concentration factor was equal to the volumetric reduction factor.
After each run, the filters were cleaned with backwashing and soaking in an NaClO solution for 12 h. DI water was used to ensure the restoration of the permeation flux prior to the subsequent experiment.

3. Results and Discussion

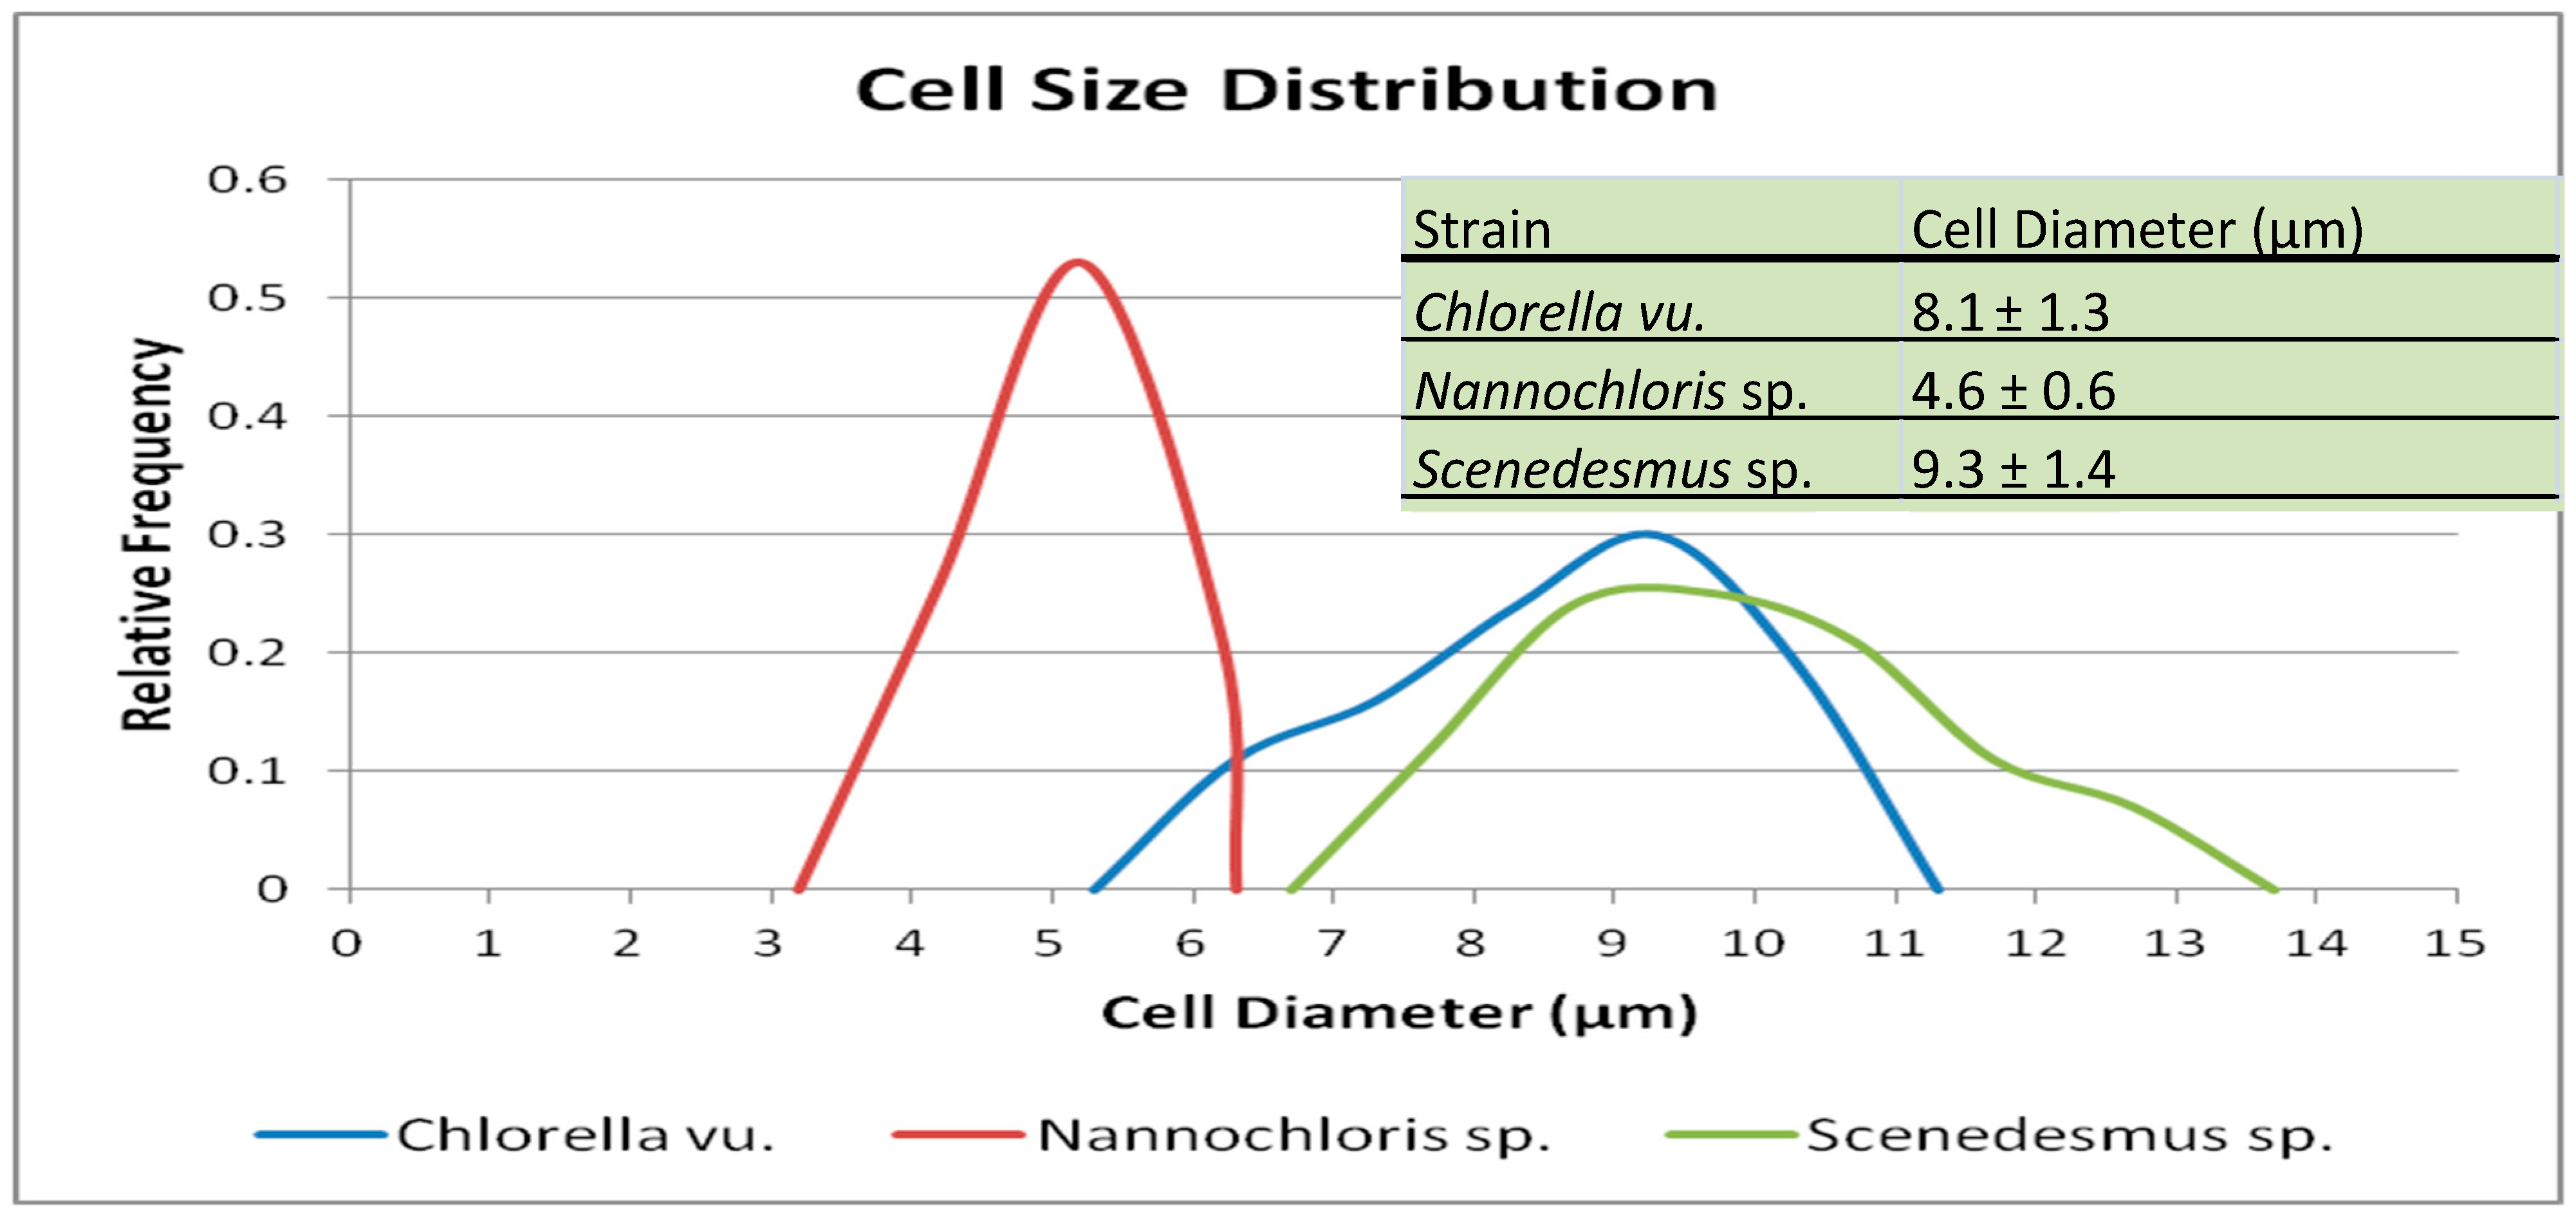
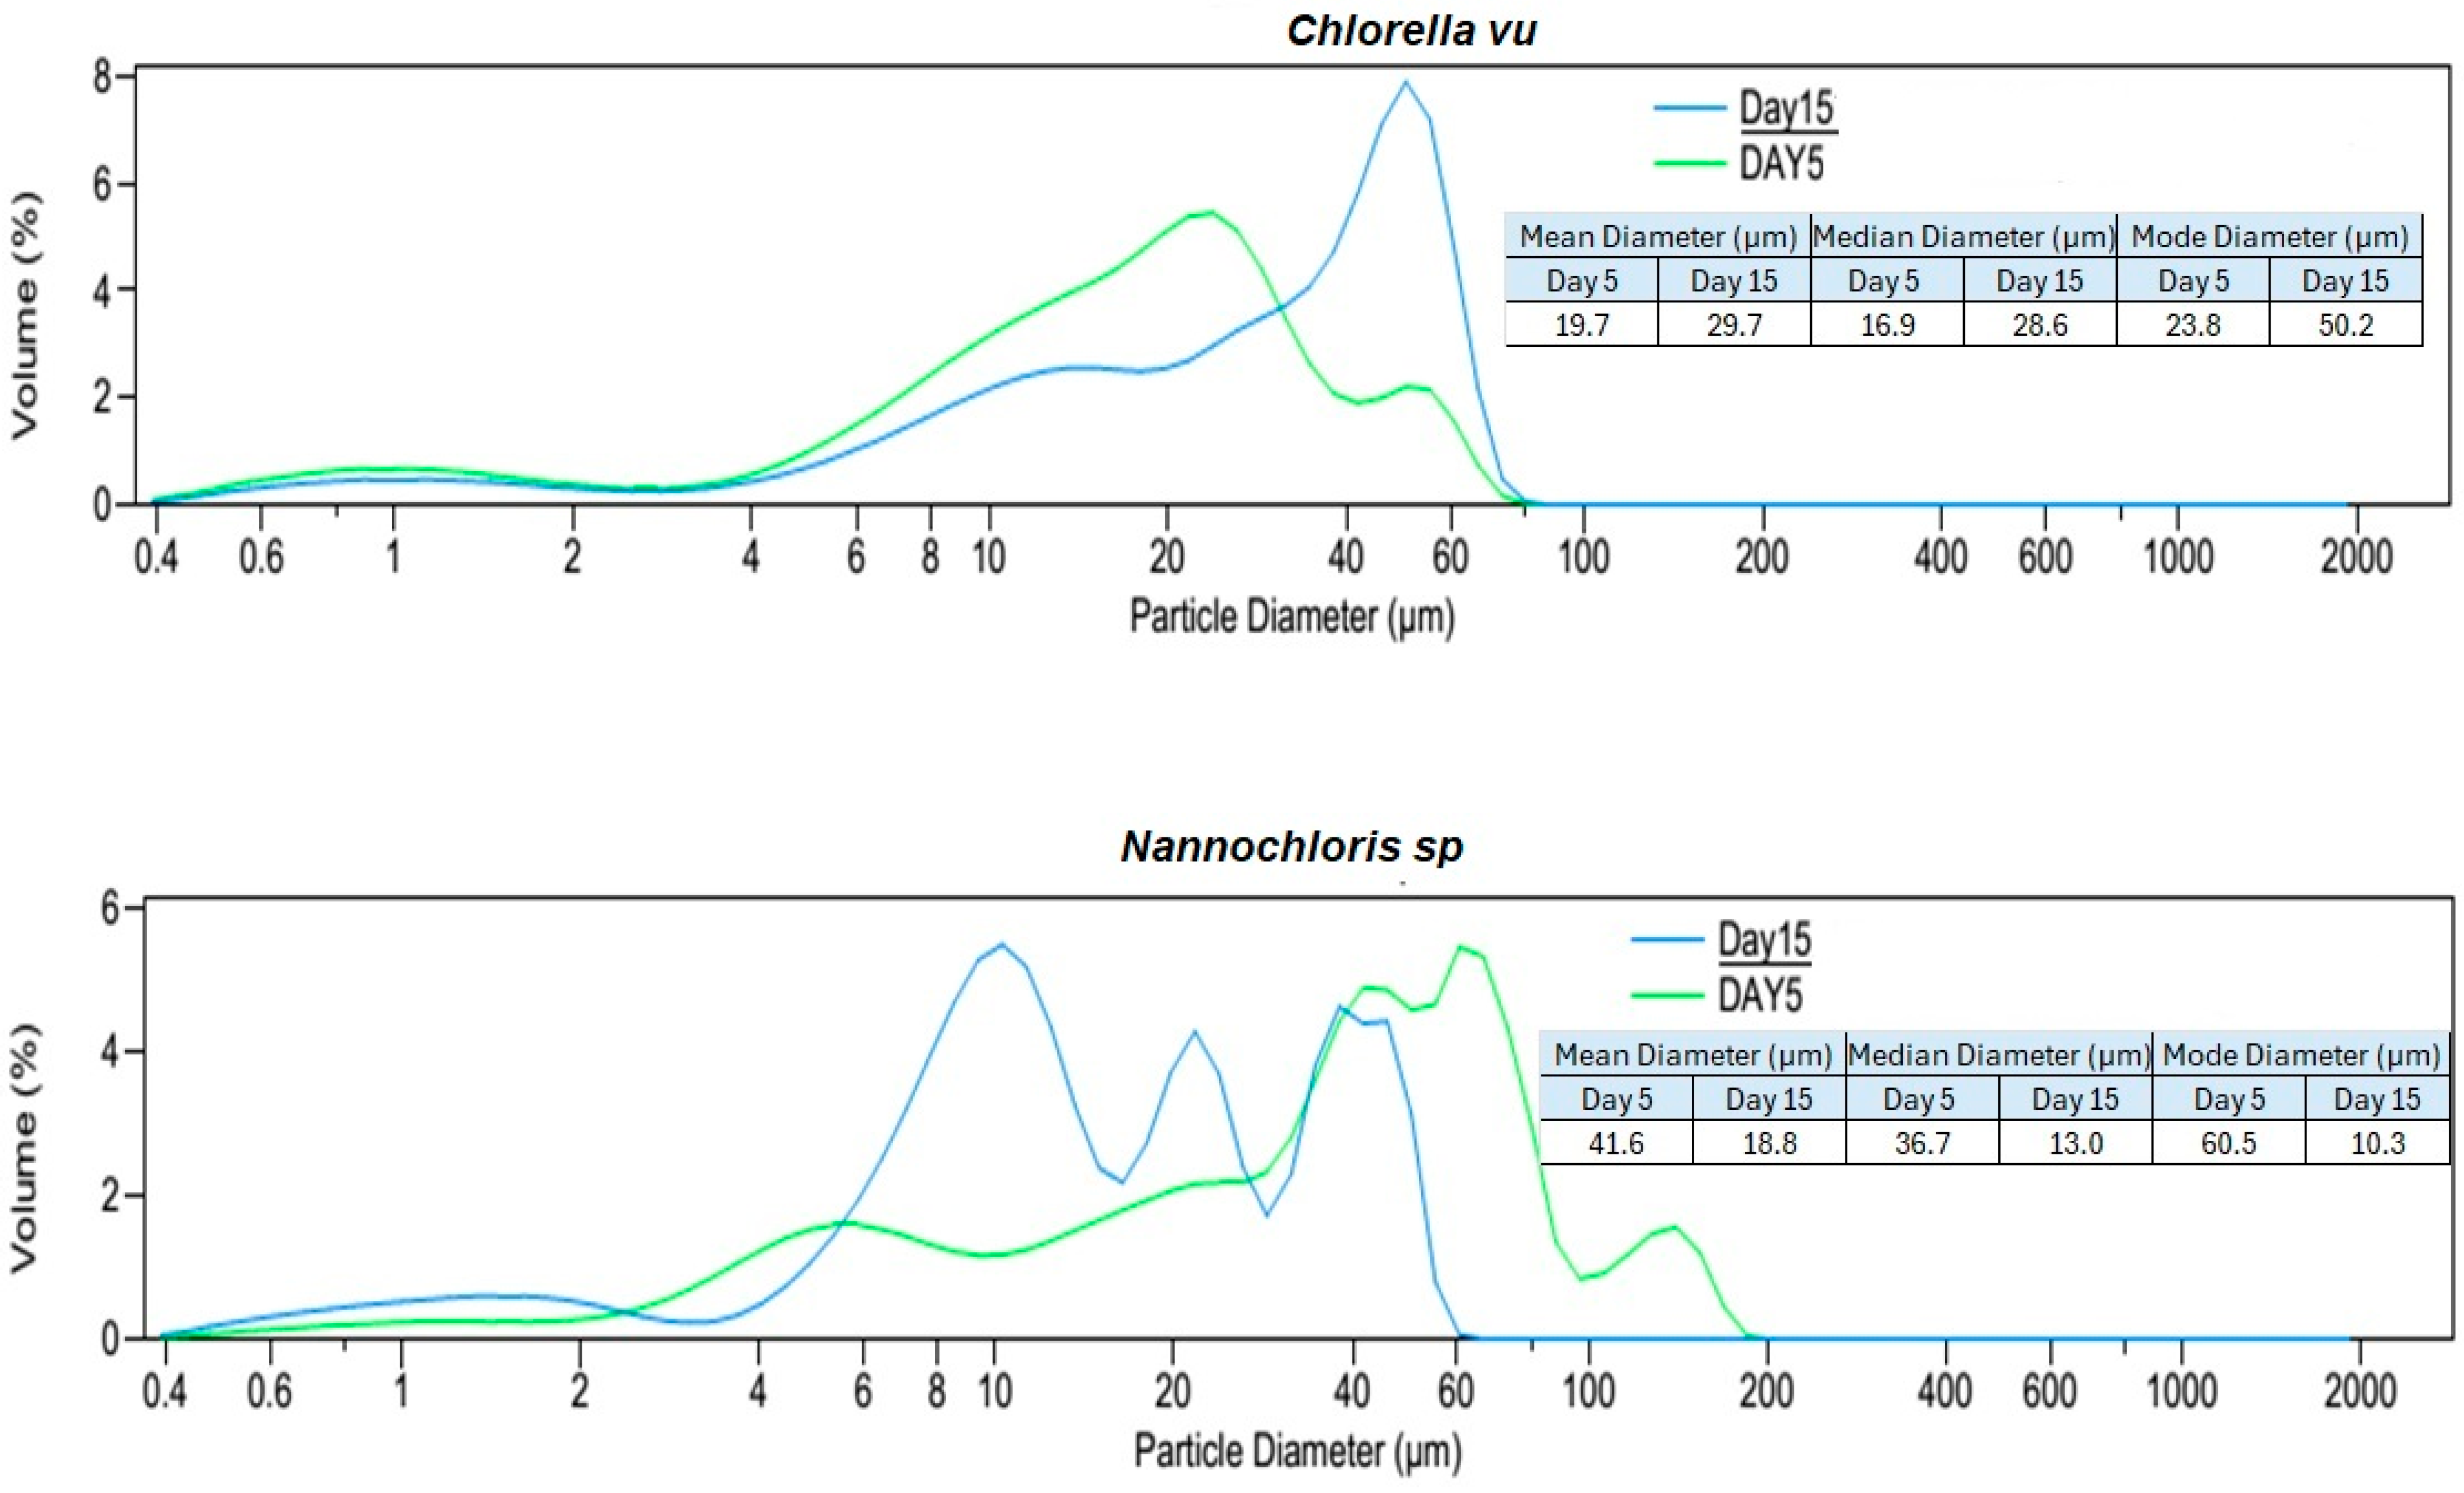
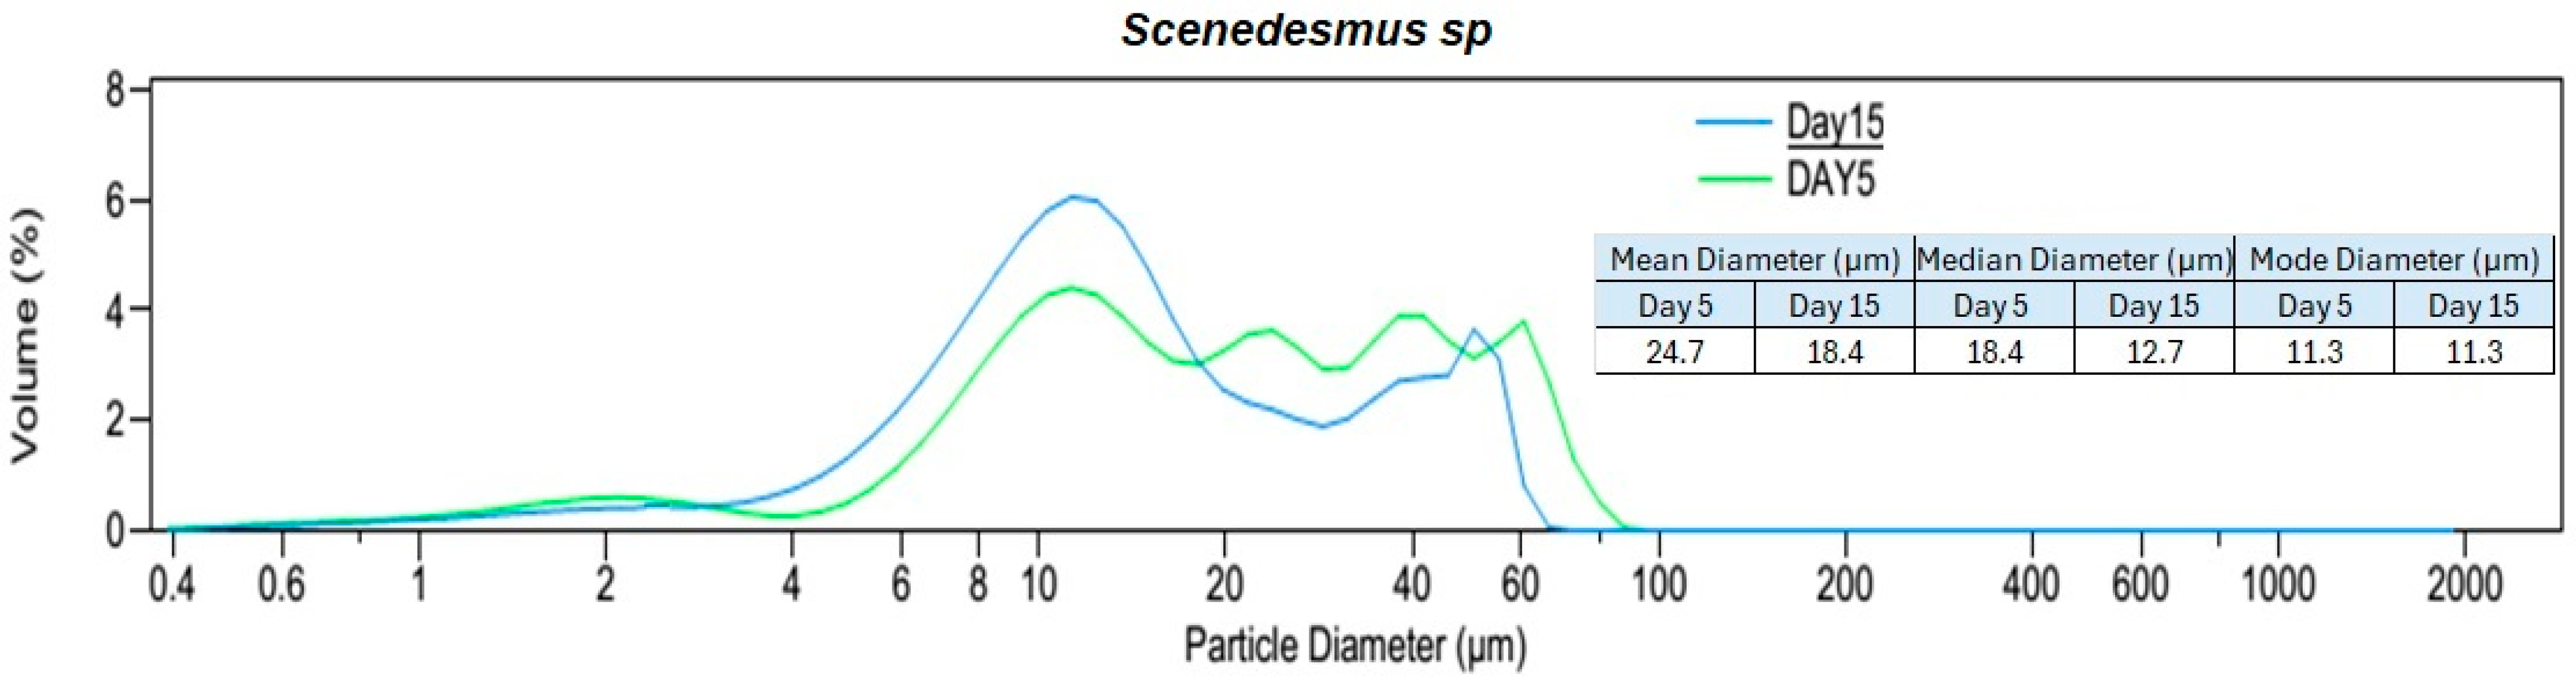
3.1. Algal Suspension Characterization
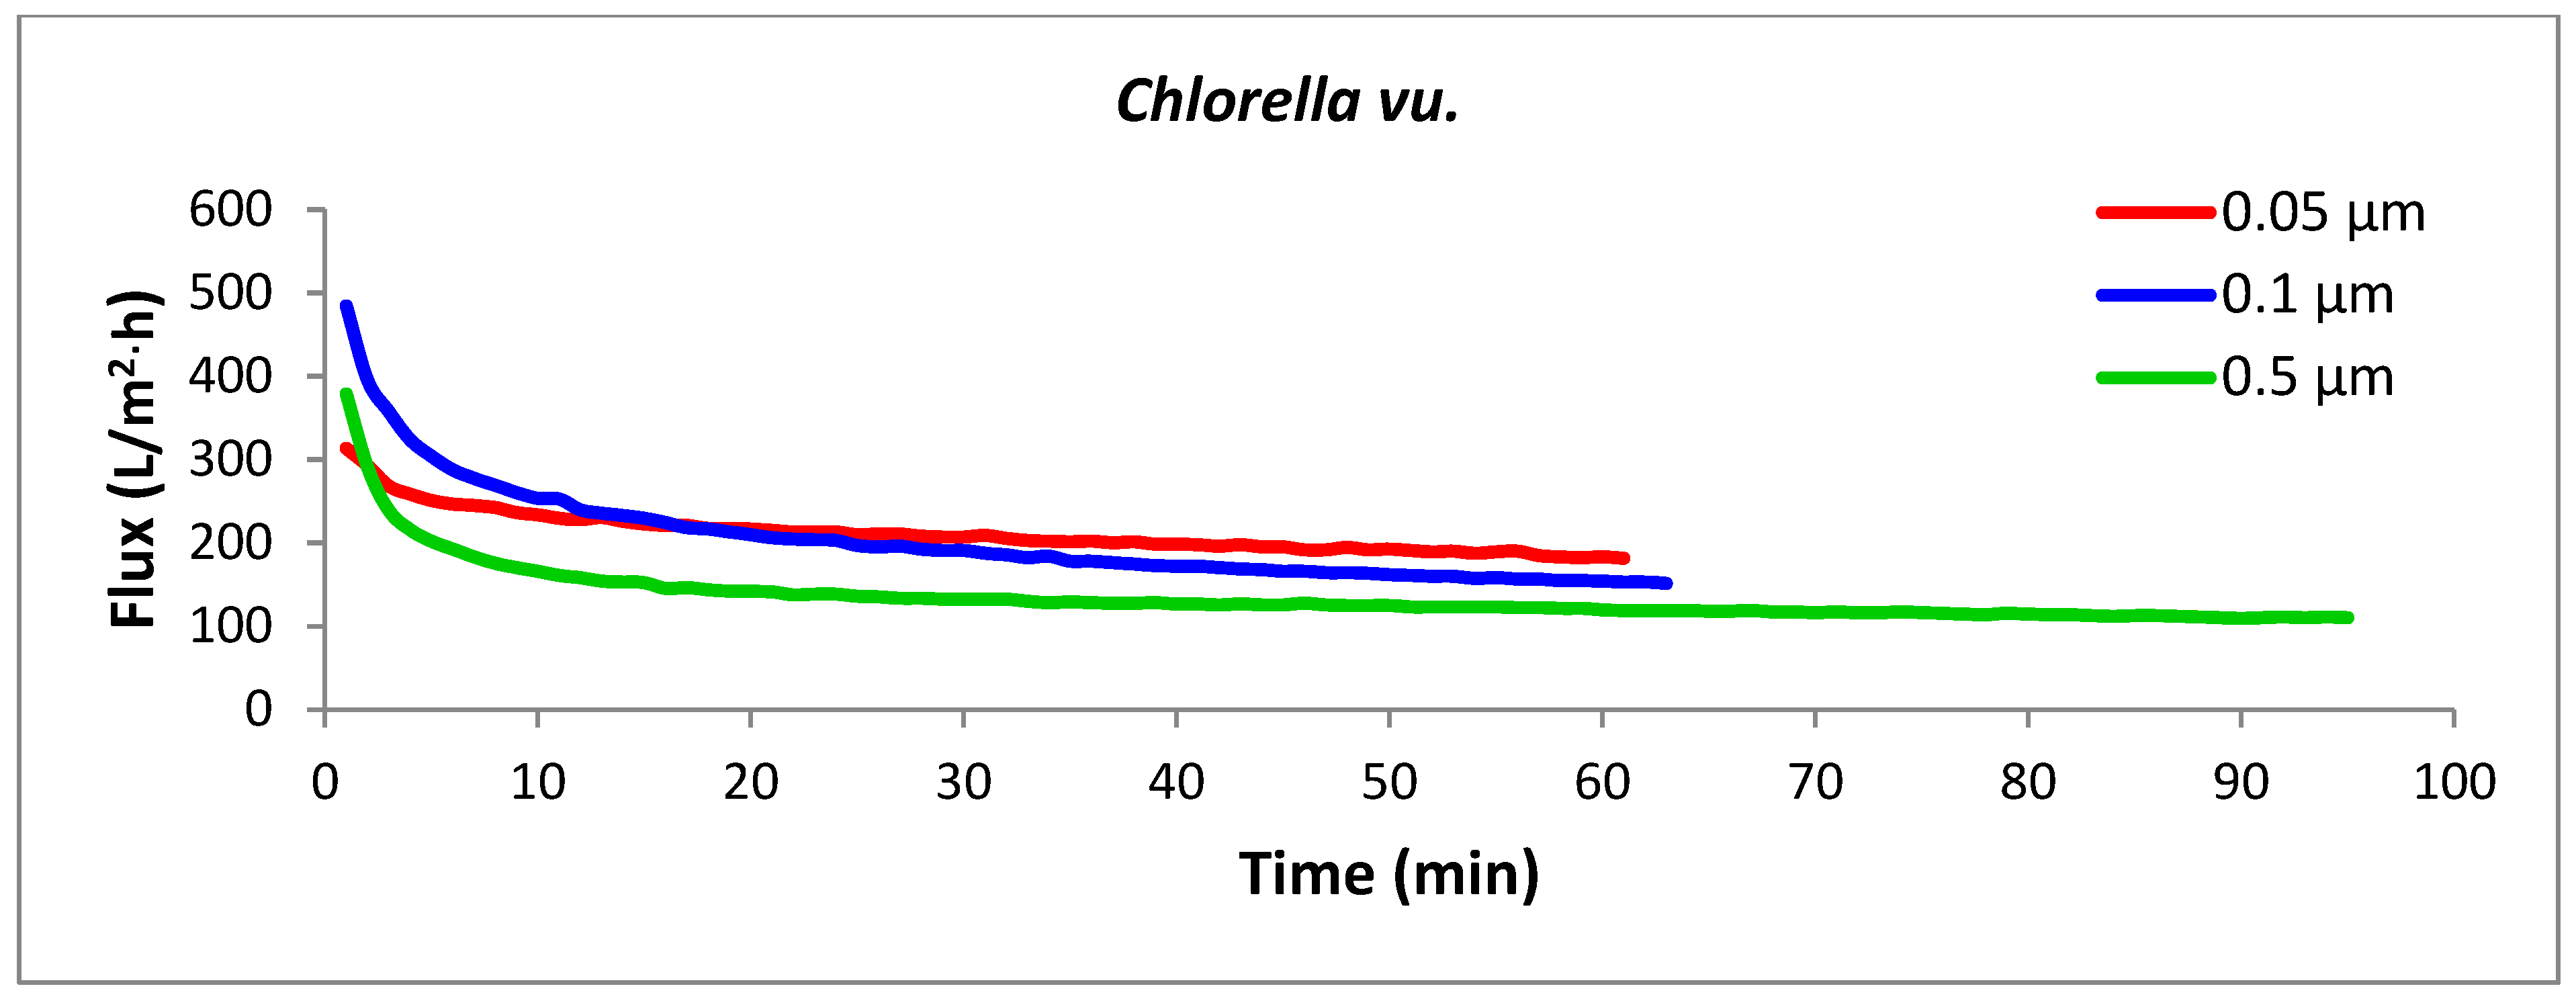
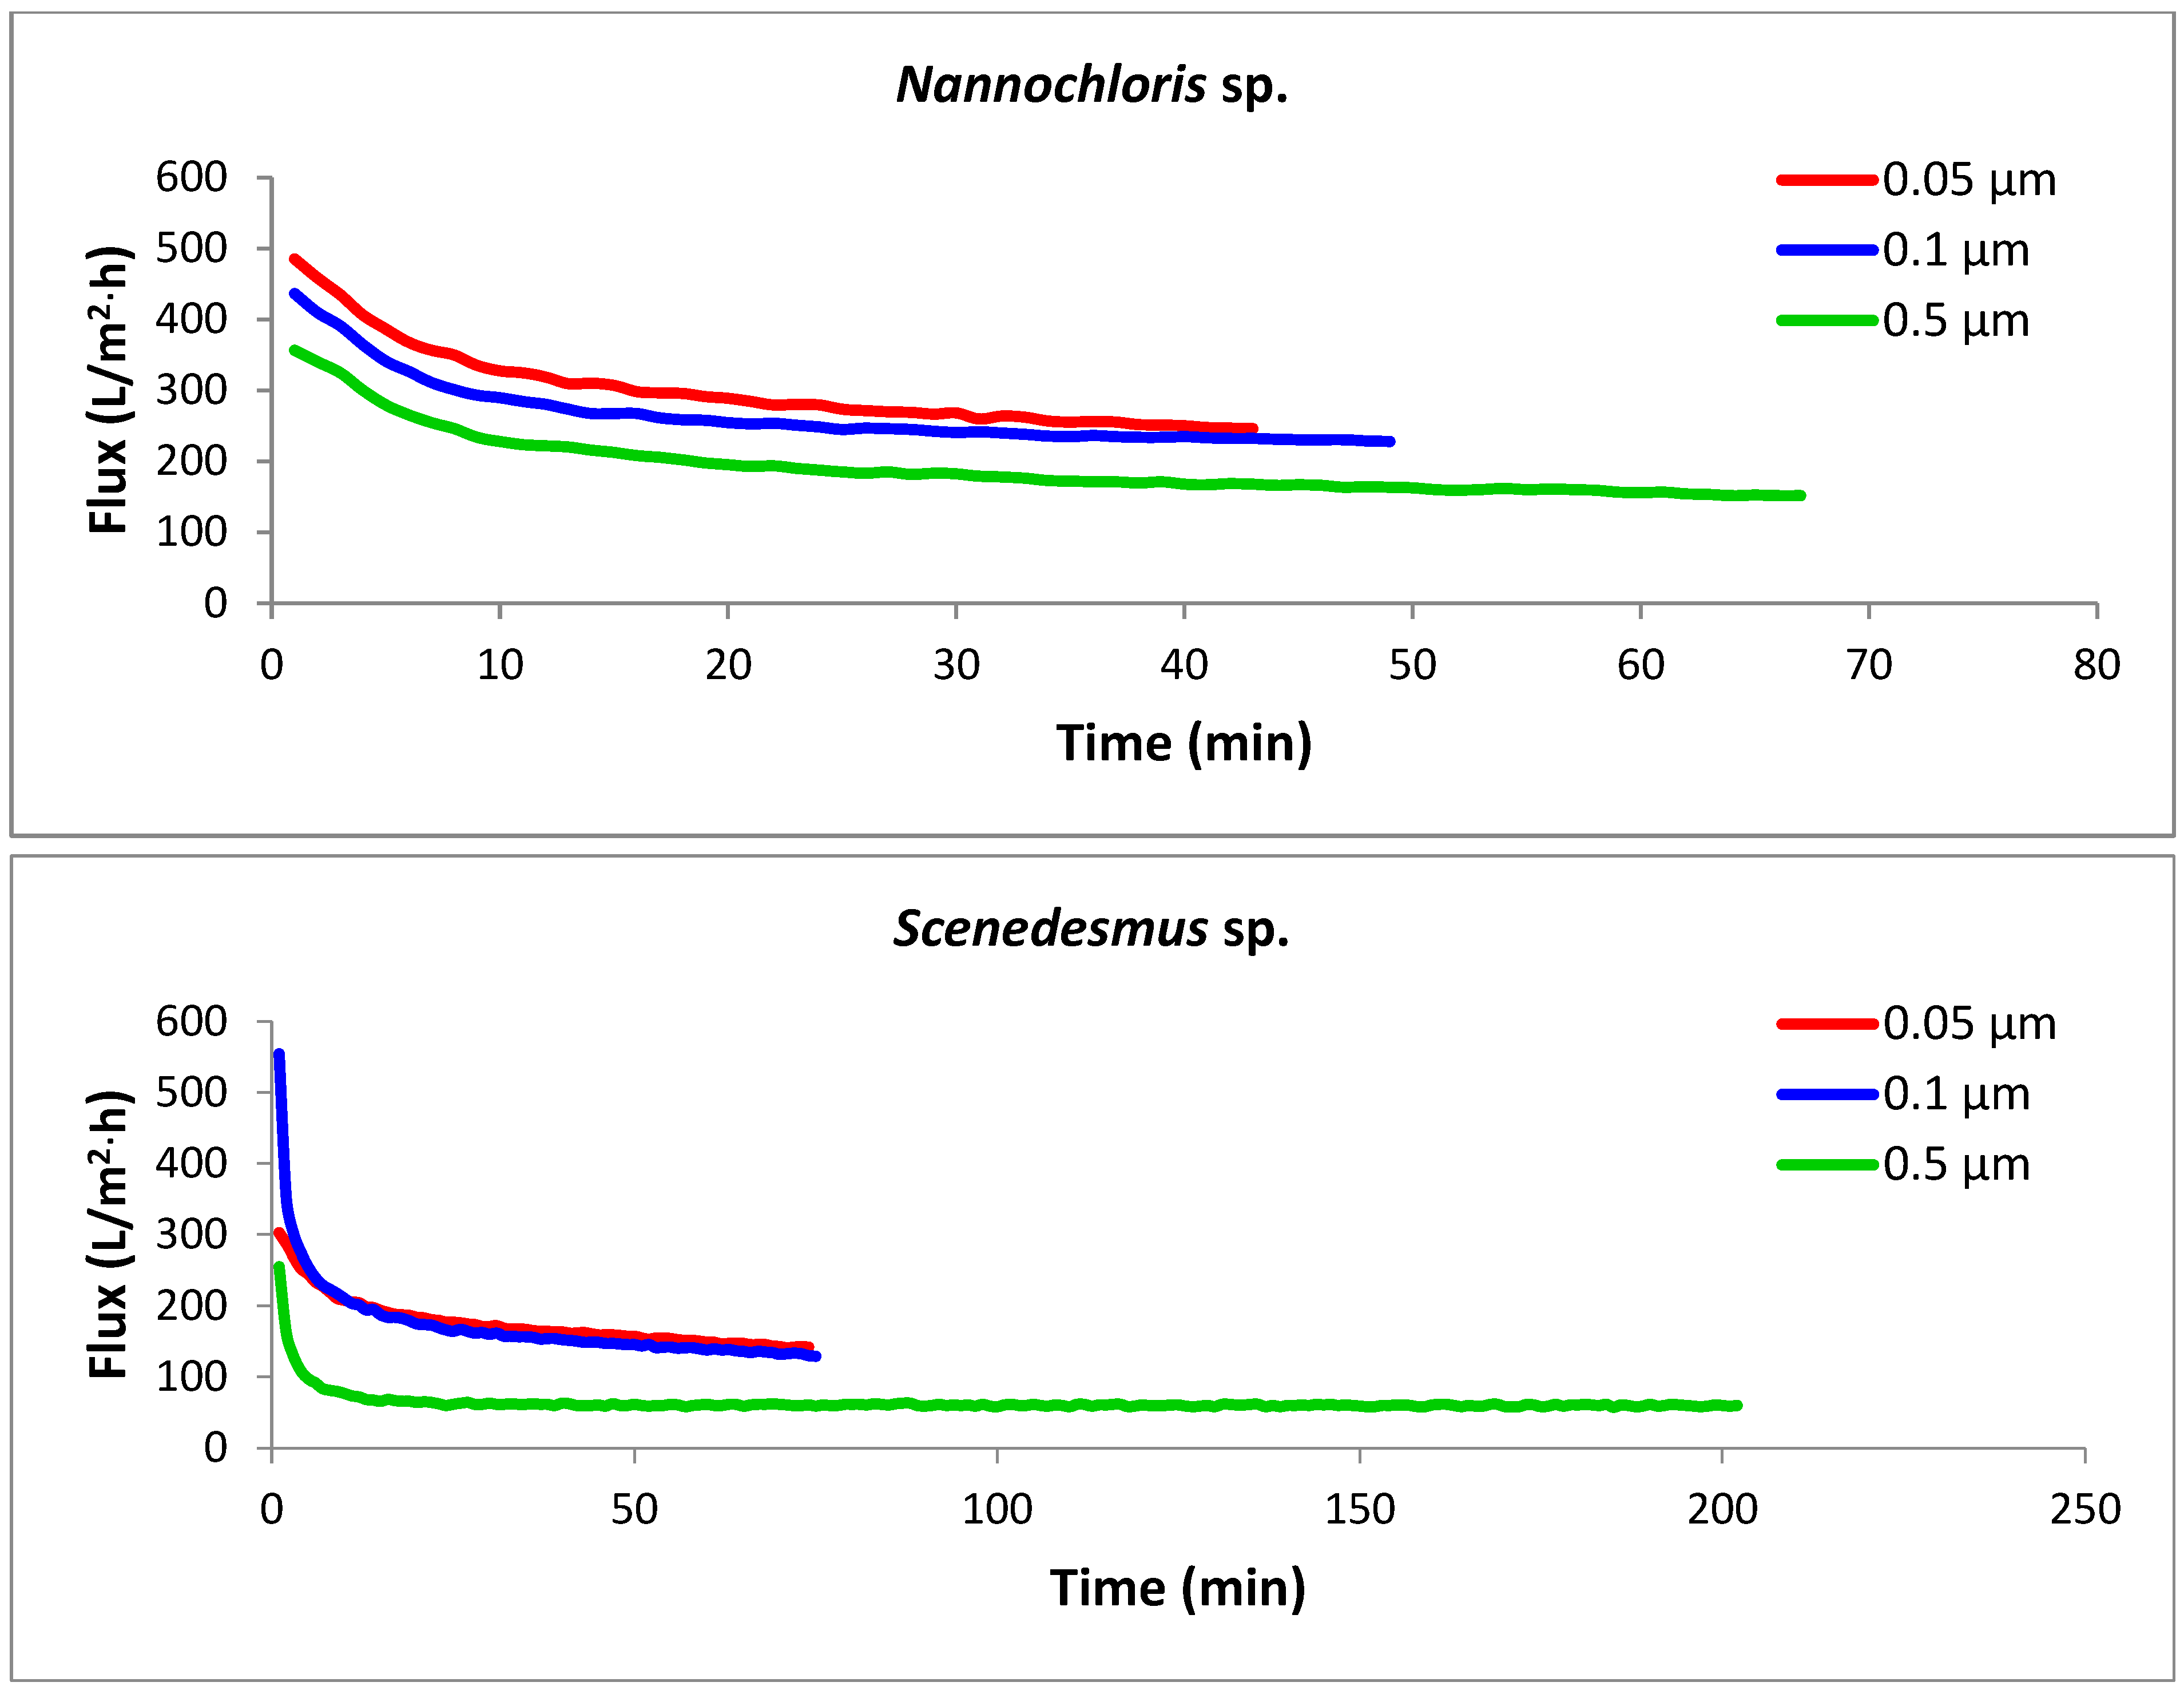
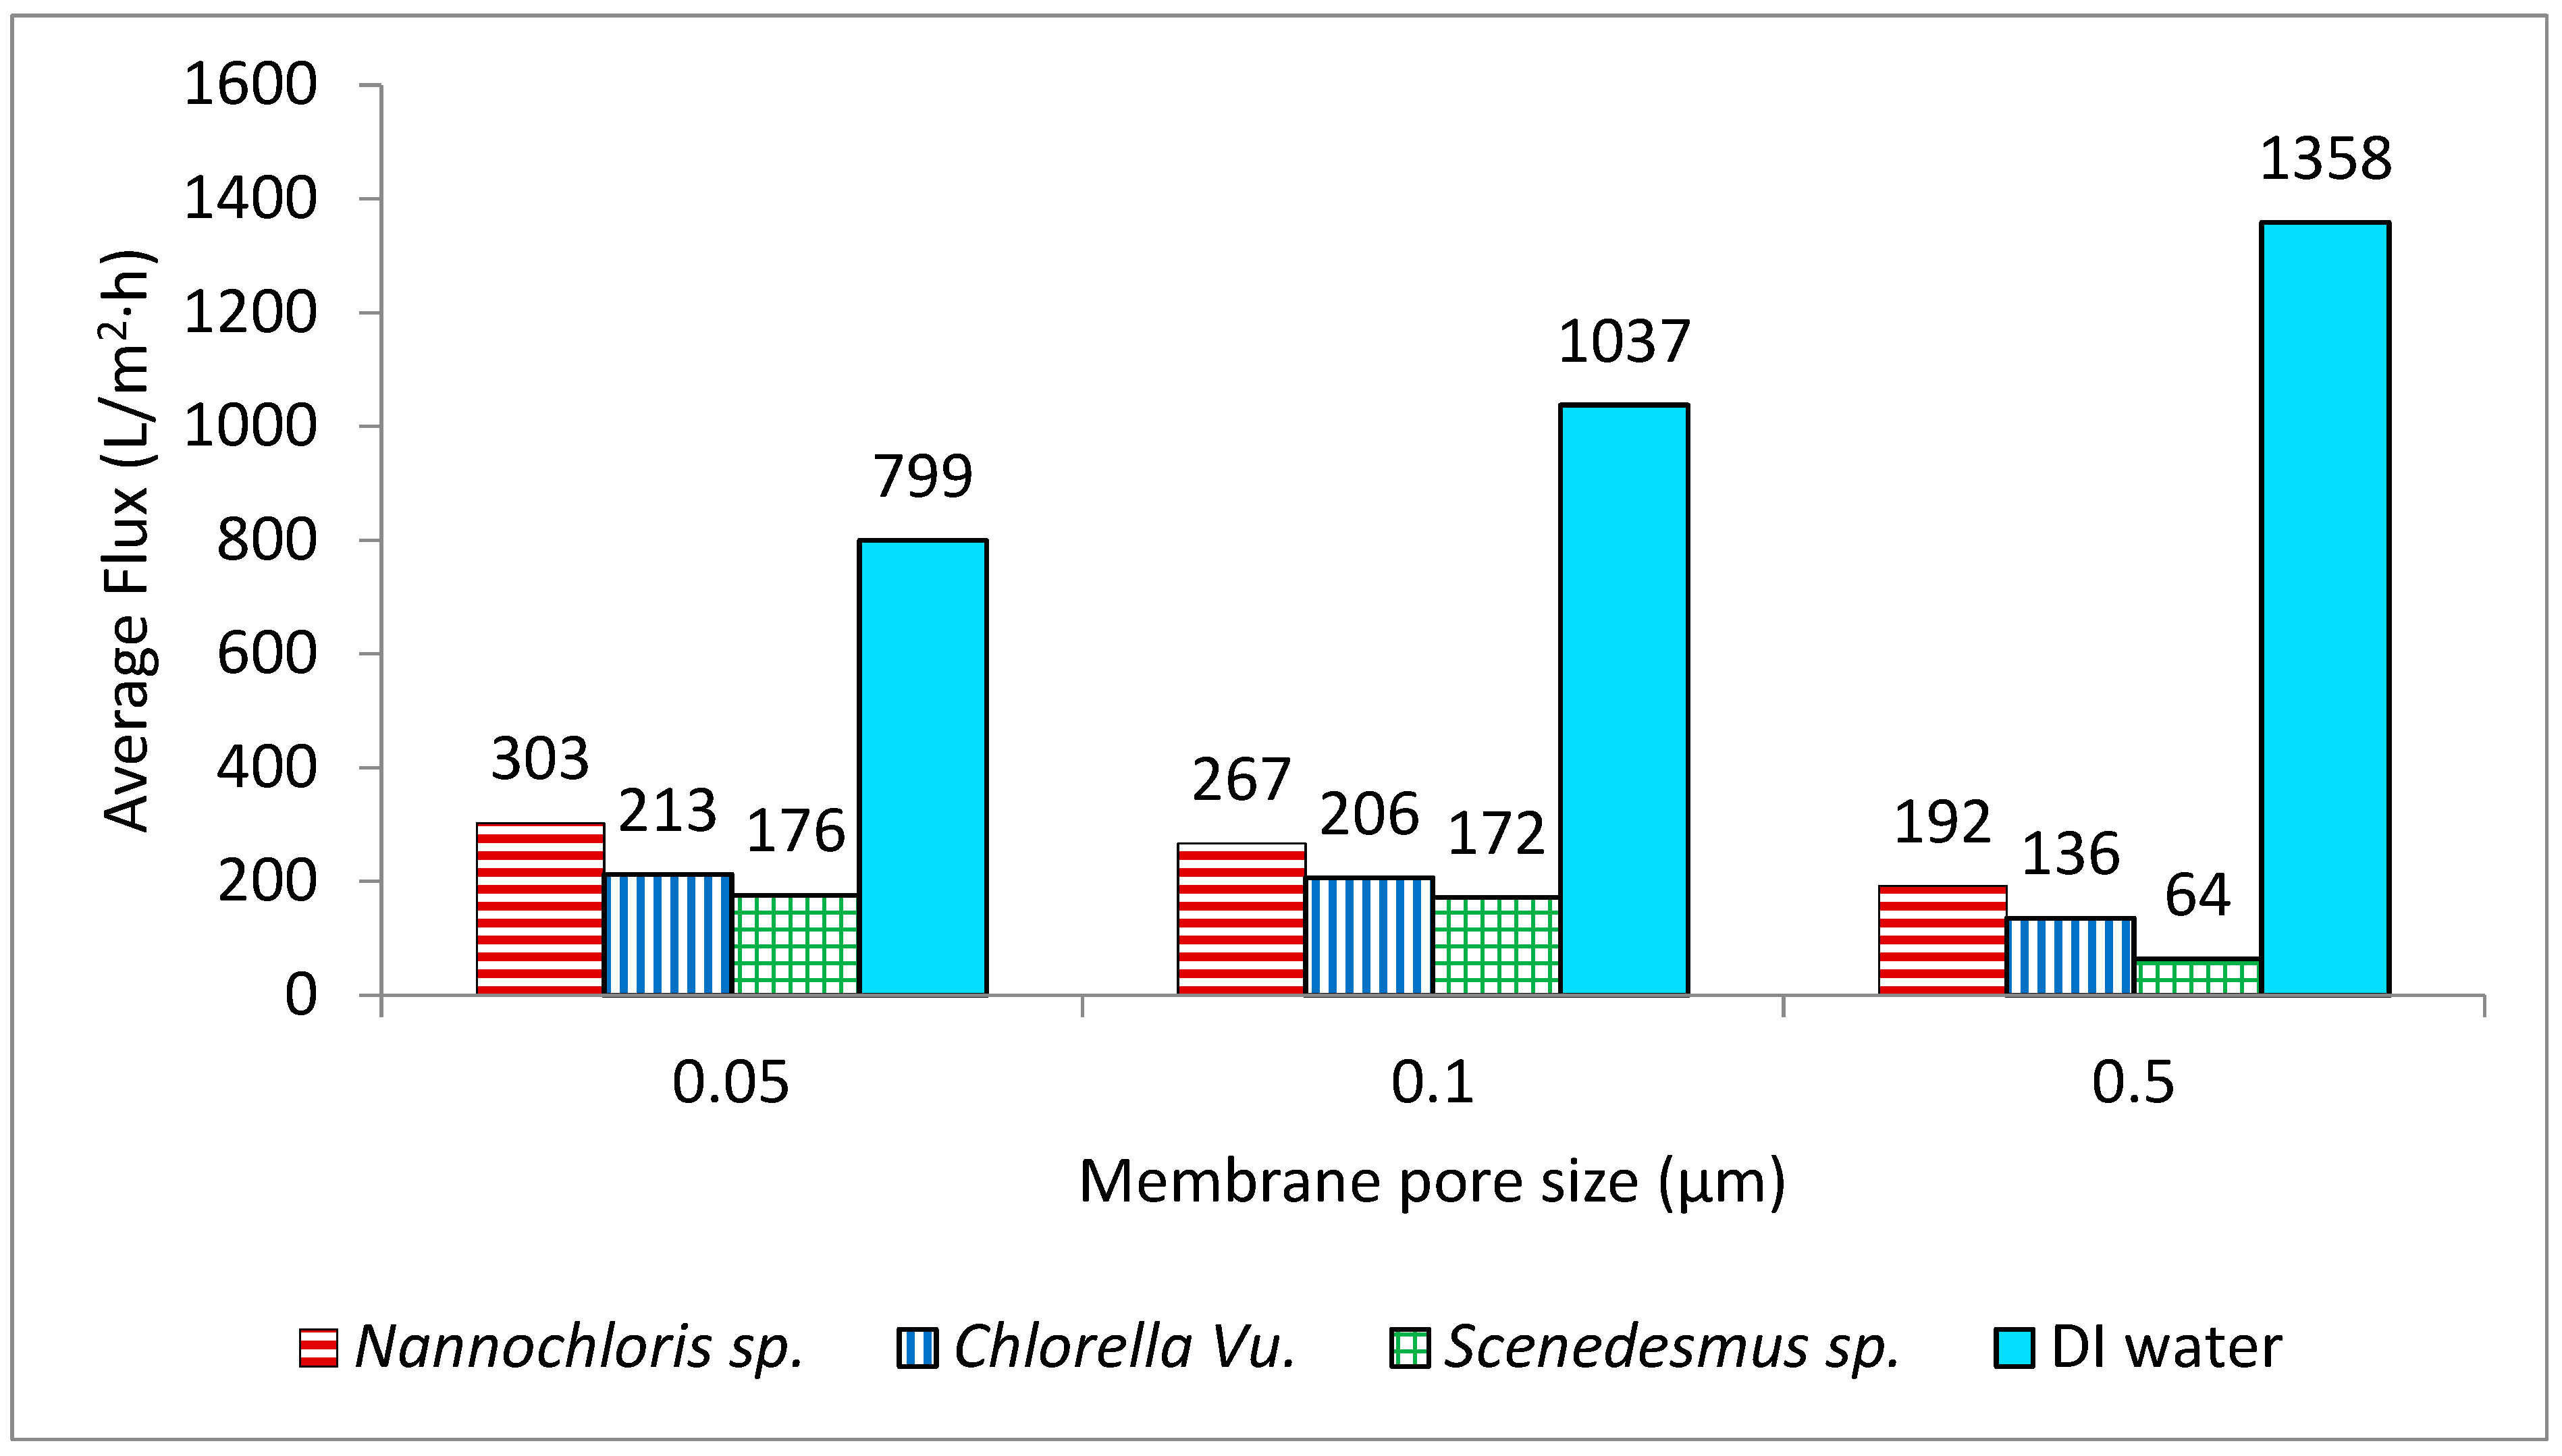
Microscopic images were used to study the morphology of the three selected species (Figure 2). The cell size distribution plots, along with the mean diameters, are presented in Figure 3. The spherical Chlorella vu. cells had an average diameter of 8.1 ± 1.3 µm, which was close to the diameter of individual Scenedesmus sp. cells, but the latter were fusiform, mostly in clusters of 3 to 10 cells. Round-shaped Nannochloris sp. cells were the smallest, but the cells formed flocs that could function as a single particle in the filtration process.
Based on the particle size distribution analysis (PSDA) of the culture suspensions on the fifth day (with cultures in the exponential growth phase) and the volume% diagrams (Figure 4), Nannochloris sp. had the biggest particles with a mode of 60.5 µm and a maximum size of approximately 200 µm. On the fifth day, the modes for Chlorella vu. and Scenedesmus sp. were 23.8 µm and 11.3 µm, respectively, neither of which had particles bigger than 100 µm, although the former had a more normal distribution.
An additional PSDA was performed on day 15 to investigate the influence of the culture age on the size of the particles (Figure 4). Scenedesmus sp. showed a minor change in its particles’ diameters, as could be inferred from the consistent mode of 11.3 µm for both fresh and old cultures. Although Nannochloris sp. had the biggest particles on day 5, its distribution shifted to the left and attained a smaller mode of 10.3 µm. On the contrary, the particles in Chlorella vu. grew and reached a mode at 50.2 µm on the 15th day. The expansion of Chlorella vu. particles on day 15, when the culture was in a lower growth rate phase, is in agreement with the results by Danquah [27], but the inverse transition of the Nannochloris sp. and Scenedesmus sp. particle sizes disagree with them. However, it is important to note that aeration, culture agitation, shear forces experienced by the cells, algal species, and water quality had a significant impact on cell clustering.

3.2. Filtration

The key design parameter for assessing the performance of a membrane filtration system is the flux (J), which is the filtrate flow rate per unit of membrane area, usually measured in liters per hour per square meter (L/h·m2). Flux is influenced by membrane chemistry and pore size, membrane resistance, operating conditions (transmembrane pressure, crossflow velocity, and temperature), and the characteristics of the feed suspension [28]. The permeation flux versus time graphs for crossflow microfiltration of the three algal strains with tubular microfilters of three different pore sizes are presented in Figure 5. Among the nine combinations of strains and pore sizes, the most efficient performance was noticed with the Nannochloris sp. filtered with a 0.05 µm membrane (the uppermost red line), in which the target concentration factor (4×) was accomplished in 43 min with an average permeate flux of 303 L/h·m2. In contrast, concentrating Scenedesmus sp. with a 0.5 µm membrane (the lowermost green line), which was completed in 201 min with an average flux of 64 L/h·m2, was found to be the most energy-intensive process.
For all the strains, the smaller pore size corresponded with the highest flux rate; thus, the membrane with the smallest pore size (0.05 µm) generated the highest fluxes and consequently required the lowest amount of energy for the concentration process. The three strains showed dissimilar filtration performances through the same membrane pore size, as was anticipated from their different cell morphologies and size distributions of the particles in their culture suspension. Nannochloris sp. had the highest flux, followed by Chlorella vu. and Scenedesmus sp., respectively. An identical order was observed for the pores of different sizes, as illustrated in Figure 6. In another study, Kawakatsu and coworkers [29] observed an increase in the steady-state flux of crossflow filtration of Saccharomyces cerevisiae yeast when the diameter of the membrane’s pores was smaller than one-tenth of the particles’ diameter. In such a case, the hydraulic resistance of the membrane (Rm) was found to be too large to form a thick cake layer and did not allow the resistance by cake (Rc) to grow significantly. A similar justification could be applied to the high flux of the 0.05 µm membrane, which had pores approximately one-tenth of the diameter of the most frequently observed particles in the algal suspensions (0.520 µm in number% distributions). In contrast, in the crossflow filtration of non-biological particles, decreasing the membrane pore size an order of magnitude below the particle diameter decreased the steady-state flux and increased the resistance of the deposited particles [30].
Deposition of materials in tangential filtration for a given constant transmembrane pressure (TMP) and crossflow velocity (CFV) is size-dependent, and only particles smaller than a critical size will be deposited [31,32,33]. This can possibly explain the reason for the lower flux of the Scenedesmus sp., which had the largest fraction of small particles. In addition, supporting the conclusions by Mota and colleagues [34], elongated cells like Scenedesmus form a cake layer with higher resistance compared to spherical cells like Chlorella and Nannochloris. In other words, as the Scenedesmus cells were more affected by shear-induced arrangement, they formed a dense brick-like cake layer with higher tortuosity, which resulted in higher cake resistance.
Fouling in the dead-end flow can be due to internal fouling, pore blocking, and cake layer formation. However, in tangential flow filtration (or crossflow filtration), fouling potential by cake formation and surface deposition is reduced by the passing liquid shearing the membrane. As all three membrane pore sizes are significantly smaller than the diameter of the intact algal cells used in this study, the intact cells were likely sheared off from the membrane surface. Algal excretions (including extracellular polymeric substances, polysaccharides, and organic matter) and smaller cell fragments were likely responsible for the observed drop in the flux rate. However, further studies with imaging of the dissected membrane are needed to identify the cause of flux drop definitively.

4. Conclusions

An analysis of the culture suspension of three algal strains showed that the particle size distribution was strain-dependent and influenced by the culture’s age. The particle size distribution did not directly correlate to the cell size distribution. For example, the culture of the Scenedesmus sp. with the biggest cells had the smallest particles among the selected strains with an equal culture age. Provided the same initial concentration and volumetric reduction factor for a given membrane pore size under the same operational conditions, the permeation flux of the tubular crossflow microfiltration of fresh cultures was highest for the Nannochloris sp., with the biggest particles and smallest cells. For a given strain, the concentration process made the highest dewatering rate through the membrane with the smallest pore size, which was 0.05 µm.

Author Contributions

Conceptualization, C.T.; methodology, M.K.; validation, M.K. and C.T.; formal analysis, M.K. and C.T.; investigation, M.K. and C.T.; resources, C.T.; writing—original draft preparation, M.K.; writing—review and editing, C.T.; visualization, C.T.; supervision, C.T.; project administration, C.T.; funding acquisition, C.T. All authors have read and agreed to the published version of the manuscript.

Funding

This research received no external grant funding.

Institutional Review Board Statement

Not applicable as no humans or animals were involved in this study.

Informed Consent Statement

Not applicable.

Data Availability Statement

Can be provided by the corresponding author upon request.

Acknowledgments

The authors wish to acknowledge and greatly appreciate the contribution of Porex Corporation. Porex provided the three Polyvinylidene Fluoride (PVDF) tubular microfiltration modules used in this study.

Conflicts of Interest

The authors declare no conflicts of interest. The funders had no role in the design of the study, in the collection, analyses, or interpretation of data, in the writing of the manuscript, or in the decision to publish the results.

References

  1. Chen, C.; Zhao, Z.; Ma, S.; Rasool, M.A.; Wang, L.; Zhang, J. Optimization of ultrasonic-assisted extraction, refinement and characterization of water-soluble polysaccharide from Dictyosphaerium sp. and evaluation of antioxidant activity in vitro. J. Food Meas. Charact. 2020, 14, 963–977. [Google Scholar] [CrossRef]
  2. Ahmad, A.L.; Yasin, N.M.; Derek, C.J.C.; Lim, J.K. Microalgae as a sustainable energy source for biodiesel production: A review. Renew. Sust. Energy Rev. 2011, 15, 584–593. [Google Scholar] [CrossRef]
  3. Kang, A.; Lee, T.S. Converting sugars to biofuels: Ethanol and beyond. Bioengineering 2015, 2, 184–203. [Google Scholar] [CrossRef] [PubMed]
  4. Castro-Muñoz, R.; García-Depraect, O. Membrane-based harvesting processes for microalgae and their valuable-related molecules: A review. Membranes 2021, 11, 585. [Google Scholar] [CrossRef] [PubMed]
  5. Bhushan, S.; Kalra, A.; Simsek, H.; Kumar, G.; Prajapati, S.K. Current trends and prospects in microalgae-based bioenergy production. J. Environ. Chem. Eng. 2020, 8, 104025. [Google Scholar] [CrossRef]
  6. Hu, Q. Progress and perspectives on microalgal mass culture. Algal Res. 2014, 4, 1–122. [Google Scholar] [CrossRef]
  7. Markets, R.M. $4.6 Billion Worldwide Microalgae Industry to 2027—Impact of COVID-19 on the Market. 2020. Available online: https://www.globenewswire.com/news-release/2020/09/18/2095854/28124/en/4-6-Billion-Worldwide-Microalgae-Industry-to-2027-Impact-of-COVID-19-on-the-Market.html (accessed on 28 April 2024).
  8. Zhao, Z.; Muylaert, K.; Vankelecom, I.F. Combining patterned membrane filtration and flocculation for economical microalgae harvesting. Water Res. 2021, 198, 117181. [Google Scholar] [CrossRef]
  9. Zhao, Z.; Ilyas, A.; Muylaert, K.; Vankelecom, I.F. Optimization of patterned polysulfone membranes for microalgae harvesting. Bioresour. Technol. 2020, 309, 123367. [Google Scholar] [CrossRef]
  10. Bilad, M.R.; Arafat, H.A.; Vankelecom, I.F. Membrane technology in microalgae cultivation and harvesting: A review. Biotechnol. Adv. 2014, 32, 1283–1300. [Google Scholar] [CrossRef]
  11. Fasaei, F.; Bitter, J.H.; Slegers, P.M.; van Boxtel, A.J.B. Technoeconomic evaluation of microalgae harvesting and dewatering systems. Algal Res. 2018, 31, 347–362. [Google Scholar] [CrossRef]
  12. Li, S.; Hu, T.; Xu, Y.; Wang, J.; Chu, R.; Yin, Z.; Mo, F.; Zhu, L. A review on flocculation as an efficient method to harvest energy microalgae: Mechanisms, performances, influencing factors and perspectives. Renew. Sustain. Energy Rev. 2020, 131, 110005. [Google Scholar] [CrossRef]
  13. Muhammad, G.; Alam, A.; Mofjur, M.; Jahirul, M.I.; Lv, Y.; Xiong, W.; Ong, H.C.; Xu, J. Modern developmental aspects in the field of economical harvesting and biodiesel production from microalgae biomass. Renew. Sustain. Energy Rev. 2021, 135, 110209. [Google Scholar] [CrossRef]
  14. Bansfield, D.; Spilling, K.; Mikola, A.; Piiparinen, J. Bioflocculation of Euglena gracilis via direct application of fungal filaments: A rapid harvesting method. J. Appl. Phycol. 2022, 34, 321–334. [Google Scholar] [CrossRef]
  15. Drexler, I.L.; Yeh, D.H. Membrane applications for microalgae cultivation and harvesting: A review. Rev. Environ. Sci. Bio-Technol. 2014, 13, 487–504. [Google Scholar] [CrossRef]
  16. Zhao, F.; Chu, H.; Yu, Z.; Jiang, S.; Zhao, X.; Zhou, X.; Zhang, Y. The filtration and fouling performance of membranes with different pore sizes in algae harvesting. Sci. Total Environ. 2017, 587, 87–93. [Google Scholar] [CrossRef] [PubMed]
  17. Roy, M.; Mohanty, K.A. Comprehensive review on microalgal harvesting strategies: Current status and future prospects. Algal Res. 2019, 44, 101683. [Google Scholar] [CrossRef]
  18. Mo, W.; Soh, L.; Werber, J.R.; Elimelech, M.; Zimmerman, J.B. Application of membrane dewatering for algal biofuel. Algal Res. 2015, 11, 1–12. [Google Scholar] [CrossRef]
  19. Landsman, M.R.; Sujanani, R.; Brodfuehrer, S.H.; Cooper, C.M.; Darr, A.G.; Davis, R.J.; Kim, K.; Kum, S.; Nalley, L.K.; Nomaan, S.M.; et al. Water treatment: Are membranes the panacea? Annu. Rev. Chem. Biomol. Eng. 2020, 11, 559–585. [Google Scholar] [CrossRef]
  20. Yazdanabad, S.K.; Samimi, A.; Shokrollahzadeh, S.; Kalhori, D.M.; Moazami, N.; González, M.J.; Sobczuk, T.M.; Grima, E.M. Microalgae biomass dewatering by forward osmosis: Review and critical challenges. Algal Res. 2021, 56, 102323. [Google Scholar] [CrossRef]
  21. Zhang, Y.; Fu, Q. Algal fouling of microfiltration and ultrafiltration membranes and control strategies: A review. Sep. Purif. Technol. 2018, 203, 193–208. [Google Scholar] [CrossRef]
  22. Miller, D.J.; Dreyer, D.R.; Bielawski, C.W.; Paul, D.R.; Freeman, B.D. Surface modification of water purification membranes. Angew. Chem. Int. Ed. 2017, 56, 4662–4711. [Google Scholar] [CrossRef] [PubMed]
  23. Jiang, H.; Zhao, Q.; Wang, P.; Chen, M.; Wang, Z.; Ma, J. Inhibition of algae-induced membrane fouling by in-situ formed hydrophilic micropillars on ultrafiltration membrane surface. J. Membr. Sci. 2021, 638, 119648. [Google Scholar] [CrossRef]
  24. Zhang, R.; Liu, Y.; He, M.; Su, Y.; Zhao, X.; Elimelech, M.; Jiang, Z. Antifouling membranes for sustainable water purification: Strategies and mechanisms. Chem. Soc. Rev. 2016, 45, 5888–5924. [Google Scholar] [CrossRef] [PubMed]
  25. Abdelaziz, A.E.; Leite, G.B.; Hallenbeck, P.C. Addressing the challenges for sustainable production of algal biofuels: II. Harvesting and conversion to biofuels. Environ. Technol. 2013, 34, 1807–1836. [Google Scholar] [CrossRef]
  26. Dassey, A.J.; Theegala, C.S. Harvesting economics and strategies using centrifugation for cost effective separation of microalgae cells for biodiesel applications. Bioresour. Technol. 2013, 128, 241–245. [Google Scholar] [CrossRef]
  27. Danquah, M.K.; Gladman, B.; Moheimani, N.; Forde, G.M. Microalgal growth characteristics and subsequent influence on dewatering efficiency. Chem. Eng. J. 2009, 151, 73–78. [Google Scholar] [CrossRef]
  28. Baerdemaeker, T.; Lemmens, B.; Dotremont, C.; Fret, J.; Roef, L.; Goiris, K.; Diels, L. Benchmark study on algae harvesting with backwashable submerged flat panel membranes. Bioresour. Technol. 2013, 129, 582–591. [Google Scholar] [CrossRef]
  29. Kawakatsu, T.; Nakao, S.; Kimura, S. Effects of size and compressibility of suspended particles and surface pore size of membrane on flux in crossflow filtration. J. Membr. Sci. 1993, 81, 173–190. [Google Scholar] [CrossRef]
  30. Connell, H.; Zhu, J.; Bassi, A. Effect of particle shape on crossflow filtration flux. J. Membr. Sci. 1999, 153, 121–139. [Google Scholar] [CrossRef]
  31. Lu, W.M.; Ju, S.C. Selective Particle Deposition in Crossflow Filtration. Sep. Sci. Technol. 1989, 24, 517–540. [Google Scholar] [CrossRef]
  32. Foley, G.; MacLoughlin, P.F.; Malone, D.M. Preferential deposition of smaller cells during crossflow microfiltration of a yeast suspension. Biotechnol. Tech. 1992, 6, 115–120. [Google Scholar] [CrossRef]
  33. McCarthy, A.; Walsh, P.; Foley, G. Experimental techniques for quantifying the cake mass, the cake and membrane resistances and the specific cake resistance during crossflow filtration of microbial suspensions. J. Membr. Sci. 2002, 201, 31–45. [Google Scholar] [CrossRef]
  34. Mota, M.; Teixeira, J.; Yelshin, A. Influence of cell-shape on the cake resistance in dead-end and crossflow filtrations. Sep. Purif. Technol. 2002, 27, 137–144. [Google Scholar] [CrossRef]
Figure 1. Schematic of the crossflow microfilter setup. The system consists of a pump, adjustable valves (V), an adjustable flow meter, Polyvinylidene Fluoride (PVDF) tubular modules, a sampling port (SP), an algal concentration tank, and a digital scale connected to a computer.
Phycology 05 00018 g001
Figure 2. Scanning electron microscope images of the three algal species. Apart from the cell size and shape, the clustering of the algal cells has a major bearing on the efficiency of membrane-based microfiltration.
Phycology 05 00018 g002
Figure 3. Plot showing the cell size distribution of the three selected algal species, along with the mean diameters and standard deviations. For each species, the lower diameters represent individual cells, while the larger diameters represent various degrees of cell clumping.
Phycology 05 00018 g003
Figure 4. Particle size distribution analysis (PSDA) of the three algal species on day 5 and day 15. Two different time periods were selected to identify the changes in particle size distribution with the age of the culture and species. The mean, median, and modal diameters are also shown.
Phycology 05 00018 g004aPhycology 05 00018 g004b
Figure 5. Permeation flux rates for the selected algal species using membranes with three different pore sizes. Each experimental run was terminated once the target concentration factor of 4× was achieved. All crossflow microfiltration experiments were performed under a constant transmembrane pressure (TMP) of 103.4 kPa and crossflow velocity (CFV) of 2.63 m/s.
Phycology 05 00018 g005aPhycology 05 00018 g005b
Figure 6. Average flux rates of the three algal cultures through membranes with three different pore sizes. All the flux rates are compared with the flux rates using deionized water (DI).
Phycology 05 00018 g006
Disclaimer/Publisher’s Note: The statements, opinions and data contained in all publications are solely those of the individual author(s) and contributor(s) and not of MDPI and/or the editor(s). MDPI and/or the editor(s) disclaim responsibility for any injury to people or property resulting from any ideas, methods, instructions or products referred to in the content.

