Article

Rapidly Deployable Algae Cleaning System for Applications in Freshwater Reservoirs and Water Bodies

1
Department of Applied Biology and Chemical Technology, The Hong Kong Polytechnic University, Hung Hom, Hong Kong
2
Research Centre for Resources Engineering towards Carbon Neutrality, The Hong Kong Polytechnic University, Hung Hom, Hong Kong
*
Author to whom correspondence should be addressed.
Phycology 2022, 2(1), 60-75; https://doi.org/10.3390/phycology2010004
Submission received: 13 December 2021 / Revised: 30 December 2021 / Accepted: 6 January 2022 / Published: 10 January 2022
(This article belongs to the Collection Harmful Microalgae)

Abstract

:
Occurrence of large-scale harmful algal blooms (HABs) in our reservoirs and water bodies threaten both quality of our drinking water and economy of aquaculture immensely. Hence, rapid removal of HAB biomass during and after a bloom is crucial in protecting the quality of our drinking water and preserve our water resources. We reported here a rapidly deployable algae cleaning system based on a high-capacity high-throughput (HCHT) spiral blade continuous centrifuge connected with inlet and effluent water tanks and a series of feed-in and feed-out pumps as well as piping, all fitted into a standard 20 feet metal shipping container. The system separates algal biomass from algae-laden water with a maximum flow rate of 4000 L/h and a centrifugal force of 4500× g. Cells collected by the system are still intact due to the low centrifugal force used. We showed that after HCHT centrifugation, cellular contents of HAB biomass were not found in the effluent water, and hence, could be discharged directly back to the water body. Furthermore, the addition of flocculants and chemicals prior to the separation process is not required. The system could operate continuously with proper programmed procedures. Taken overall, this system offered a much better alternative than the traditional flocculation- and sonication-based methods of HAB removal in a freshwater environment. This deployable system is the first of its kind being built and had been field-tested successfully.

1. Introduction

Occurrence of large-scale harmful algal blooms (HAB) in freshwater and marine environments is a worldwide problem that threatens water quality, as well as aquatic and human life. Freshwater algal blooms caused by cyanobacteria (sometimes denoted as “cyanoHAB” [1]) occur worldwide, including in China [2], Africa [3], North America [4], Middle East [5], Australia [6,7] and Europe [8]. These large-scale cyanoHAB have caused economic losses. Furthermore, cyanoHAB-causative agents, in particular Microcystis aeruginosa, produce hepatotoxic microcystins [9]. If these toxic cyanoHAB occur in reservoirs and lagoons that are designated to provide water for drinking purposes, the effects can be catastrophic. For example, in May 2007 in WuXi city on the Northern shore of the Lake Taihu, a massive cyanoHAB occurred. Millions of residents in Taihu had to scramble for bottled drinking water [2]. The Chinese military had to transport millions of water bottles from neighboring cities to alleviate the shortage of drinking water. In February 1996, 116/131 (89%) of patients in a dialysis clinic in Caruaru, Brazil, were believed to had been “poisoned” by cyanotoxins presented in their drinking water and 52 died eventually [10]. Autopsy analysis led authorities to conclude that the major contributing factor to death of the dialysis patients was intravenous exposure to microcystins, specifically microcystin-YR, -LR and -AR [10].
Apart from cyanoHAB, HAB occurrence in marine environment also constitutes a health risk. Regular blooming events of the toxic dinoflagellate Karenia brevis in Florida, USA [11,12,13] are a public health issue, with an estimated yearly US $0.5–4 million of marginal cost for the treatment of respiratory illnesses due to breathing in of toxin-contaminated seawater aerosol [14]. Frequent blooms of toxin-producing Alexandrium species and Pseudochattonella verruculosa from 2012 to 2017 in Tasmania, Australia also caused toxin contaminations of valuable shellfish cultures, with an estimated loss of US$800 million [15]. A Karenia digitata bloom in Hong Kong coastal area in 1998 had caused an estimate loss of HK $250 million in fish farms [16]. Despite devastating economic and health impacts caused by both freshwater and marine HAB, the occurrence of HAB is a natural event and it is difficult to forecast its occurrence, especially for irregular events. Therefore, technology for rapid removal of both HAB and cyanoHAB biomass without breaking the cells is urgently required to minimize the damage and associated health risk.
Over the years, researchers had developed several types of methods to remove HAB biomass from the affected region. (1) Flocculation and sedimentation of surface biomass using clay, chitosan and modified soil particles were examined extensively in different locations and circumstances, targeting different species of HAB-causative agents. It was estimated that these methods had overall flocculation rates of 40–80% on the microalgal cells [17,18,19,20,21]. In laboratory settings, microalgae biomass sank after flocculation can be retrieved easily from the bottom of the container. However, in field practice, microalgae that sank to the bottom of the water body would die rapidly owing to insufficient light supply, and eventually rupture simultaneously with concomitant release of its cellular contents into the water in a massive scale. (2) Ultrasonication was also studied [22,23,24]. A dramatic increase of microcystin presented in ultrasonicated algae-laden water was detected after merely 5 min of ultrasonication of M. aeruginosa suspension [22]. This rapid release of harmful microcystin suggested the high risk of direct contamination on drinking water from CyanoHAB, despite removal of the presumably ruptured cyanobacteria by ultrasonication. (3) Chemical flocculation methods were also studied using cationic polymers, metallic flocculants [25,26,27], as well as chemical algicides such as hydrogen peroxide [19]. These methods achieved 50–90% microalgal removal efficiencies [28,29,30], but adding chemicals into lagoons or reservoirs with water intended for house-hold use is highly controversial. Even in marine environment with more dilution effect, risks of seafood contamination still exist when applying these methods onto blooming and bloomed sites closed to commercial aquaculture zones. (4) Electro-flocculation was also designed for harvesting biomass for commercial microalgae cultivation plants [31] and for wastewater treatments [32,33,34]. Different from chemical flocculation, aggregated biomass floats after electro-flocculation and are scratched off from the water surface, and thus, reduced the risks of water contamination by harmful cellular contents. However, costs due to rapid deterioration of electrodes and the risk of chemical contamination of water body by the release of electrode chemicals prevented the method to come into standard operation. Lastly, the uncertainty on where the HAB will occur hinder installation of any algal biomass removal device permanently.
In Hong Kong, regular and persisting cyanobacteria blooms occurred in certain embayment areas of the Plover Cove Reservoir every spring-to-summer period (Figure 1).
The presence of these cyanoHAB will increase health risk in our drinking water and induce extra cost of cleaning with regular filters, not mentioning the unpleasant smells and decayed biomass produced. As Plover Cove Reservoir is the second largest drinking water staging point in Hong Kong, the addition of chemical flocculants is strictly prohibited. To tackle this problem, we fabricated a self-contained algal cell cleaning system using a high-capacity high-throughput (HCHT) centrifuge with spiral blade technology (Evodos Dynamic Settlers, Raamsdonksveer, The Netherlands) as its central piece and put it as well as all the supporting accessories in a 20-feet metal shipping container. The system, being self-contained in the shipping container, can be deployed rapidly when needed and we reported the results of its performance here. To the best of our knowledge, our cleaning system has overcome all inadequacies of the other methodologies described above. It requires no addition of chemicals into the algae-laden bloom water and the process was so gentle that no significant amount of algal cell breakage was observed. In other words, no harmful substances from the algal biomass were released into the clean water during and after the cleaning process. Because of the spiral blade technology, algae cells inside the centrifuge have a very short settling path (5–7 mm) and can be harvested quickly. This technology is immensely more superior to traditional centrifugation technology.

2. Materials and Methods

Unless specified otherwise, solvents and chemicals used in laboratory experiments were all purchased from Sigma Aldrich (St. Louis, MO, USA) and were all at least analytical grade. Water used for laboratory experiments were all distilled and deionized. Statistical tests were performed using SPSS Statistics 26 (IBM, New York City, NY, USA). A Shapiro–Wilk Test (SW-test) was performed for the test of normality. Student’s t-test was performed for datasets with normality assumed (SW-test P value ≥ 0.05), whereas otherwise, a Mann–Whitney U test was used for the non-parametric test. For all tests described, null hypothesis was rejected when the P value of the tests <0.05.

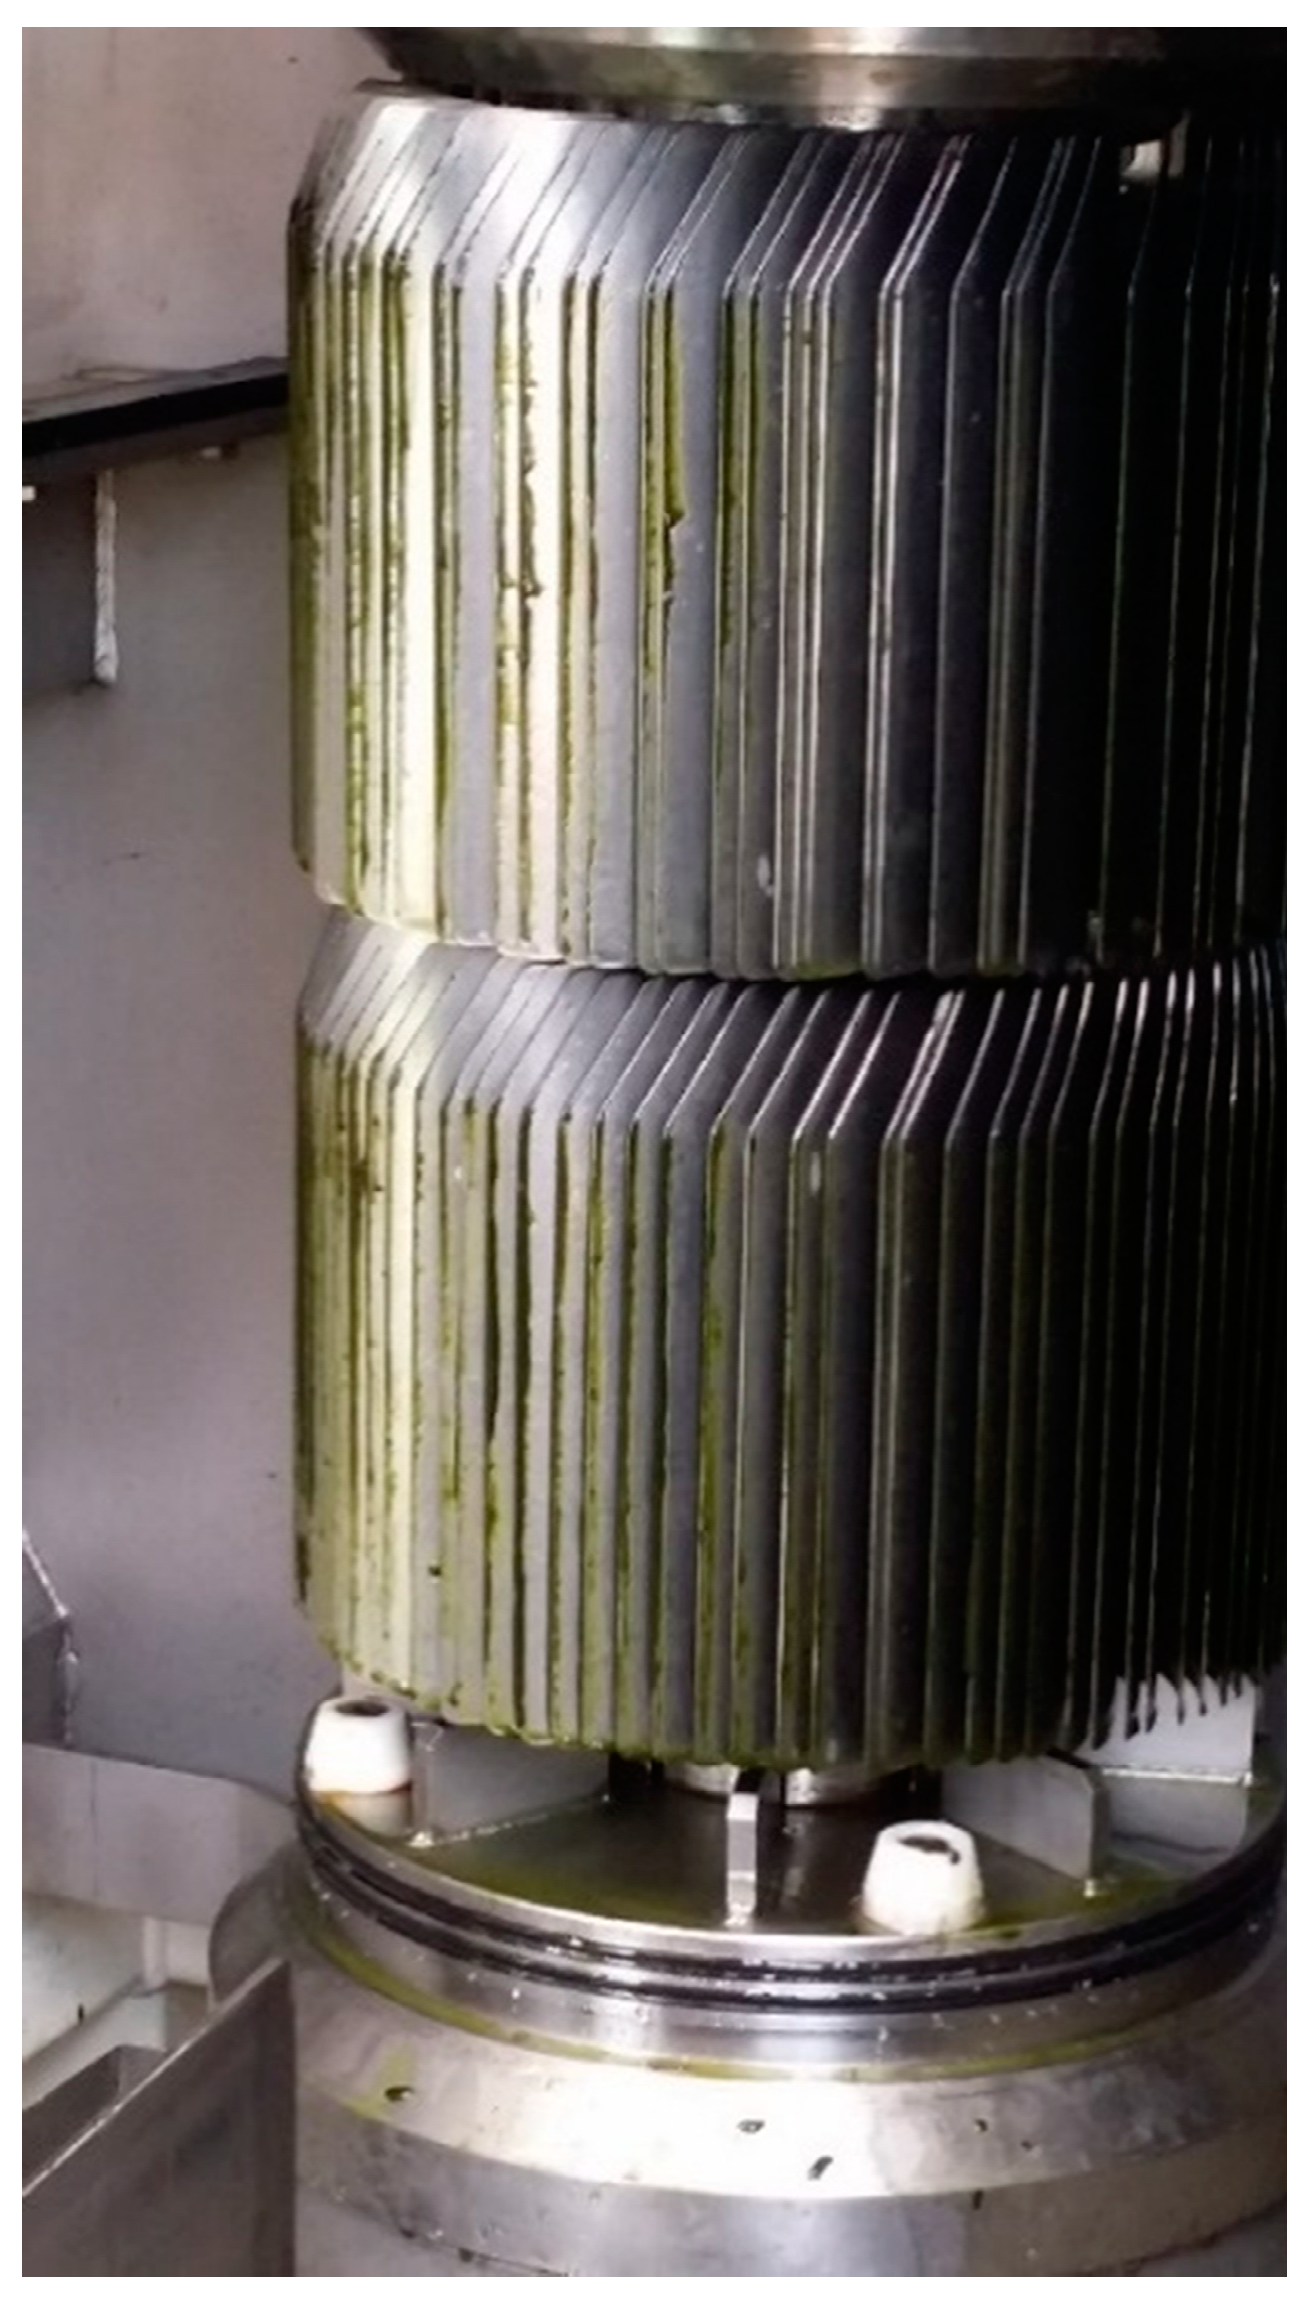
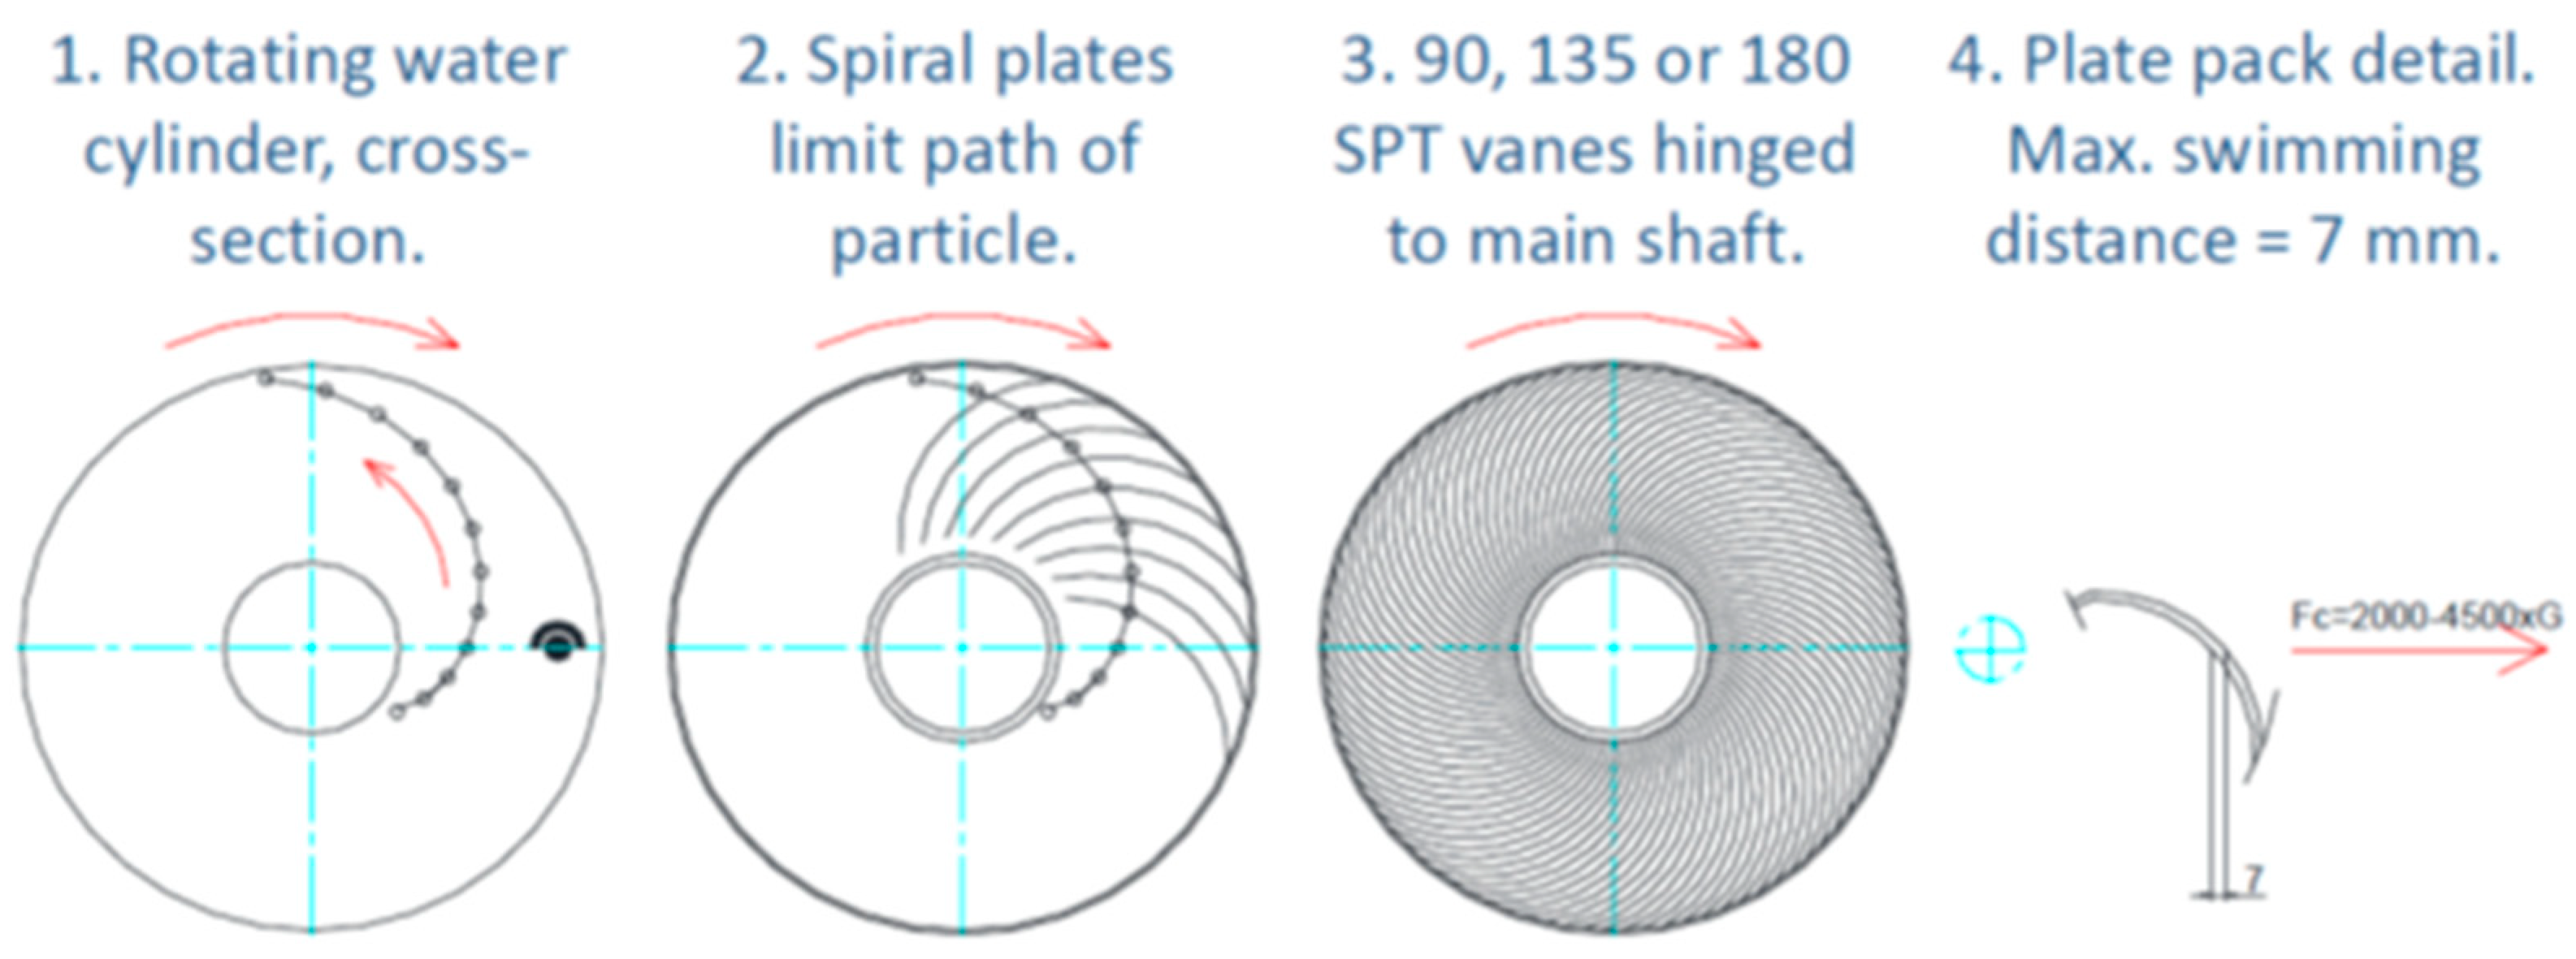
2.1. Design and Flow of the Algae Cleaning System

The overall design of the algae cleaning system is illustrated in Figure 2 below.
In brief, the inlet flow of algae-laden water started with a water collection submerged pump linked outside the metal container. Surface water of the sampling site (around one meter depth) was collected by the pump and was directed to the inlet tank for temporary storage. The water collection pump was protected by a metal grid box to prevent it from being blocked or damaged by larger items of garbage, such as branches, leaves or ruminants of dead creatures in the water body. Two sets of buoys were connected to the water collection pump to provide buoyancy. Inlet water stored in the inlet tank was then directed into a feed pump with maximum 4000 L/h pumping capacity, before being fed into the T-25 HCHT centrifuge. Separations of phytoplankton from the water body took place in the centrifuge using the spiral blade technology from Evodos. The microalgae have a short settling distance and, hence, quickly accumulated on the inside of the drum that encloses the blades (Figure 3 and Figure 4) [35].
Cleansed water after the centrifugation process (i.e., effluent water) was then directed to an effluent tank before being pumped back into the reservoir by a submerged pump in the effluent tank. Two water level sensors were installed in both the inlet and effluent tanks to prevent overflow from the tanks. In the inlet tank, when the water level reached the higher limit sensor, the system would force-stop the first submerged water collection pump until the water level inside the inlet tank dropped below the lower limit sensor. In contrast, in the effluent tank, when the water level reached the high limit sensor, the submerged pump in the effluent tank will increase its flow rate (higher than that of the centrifuge system) so as to reduce the amount of effluent water in the tank and until the water level inside dropped below the lower limit sensor. Microalgal biomass collected in the inside of the drum (which enclosed the spiral blades) were scrapped off from the inside of the drum by an in-built scrapper and was collected on a drawer, as illustrated in Figure 2.

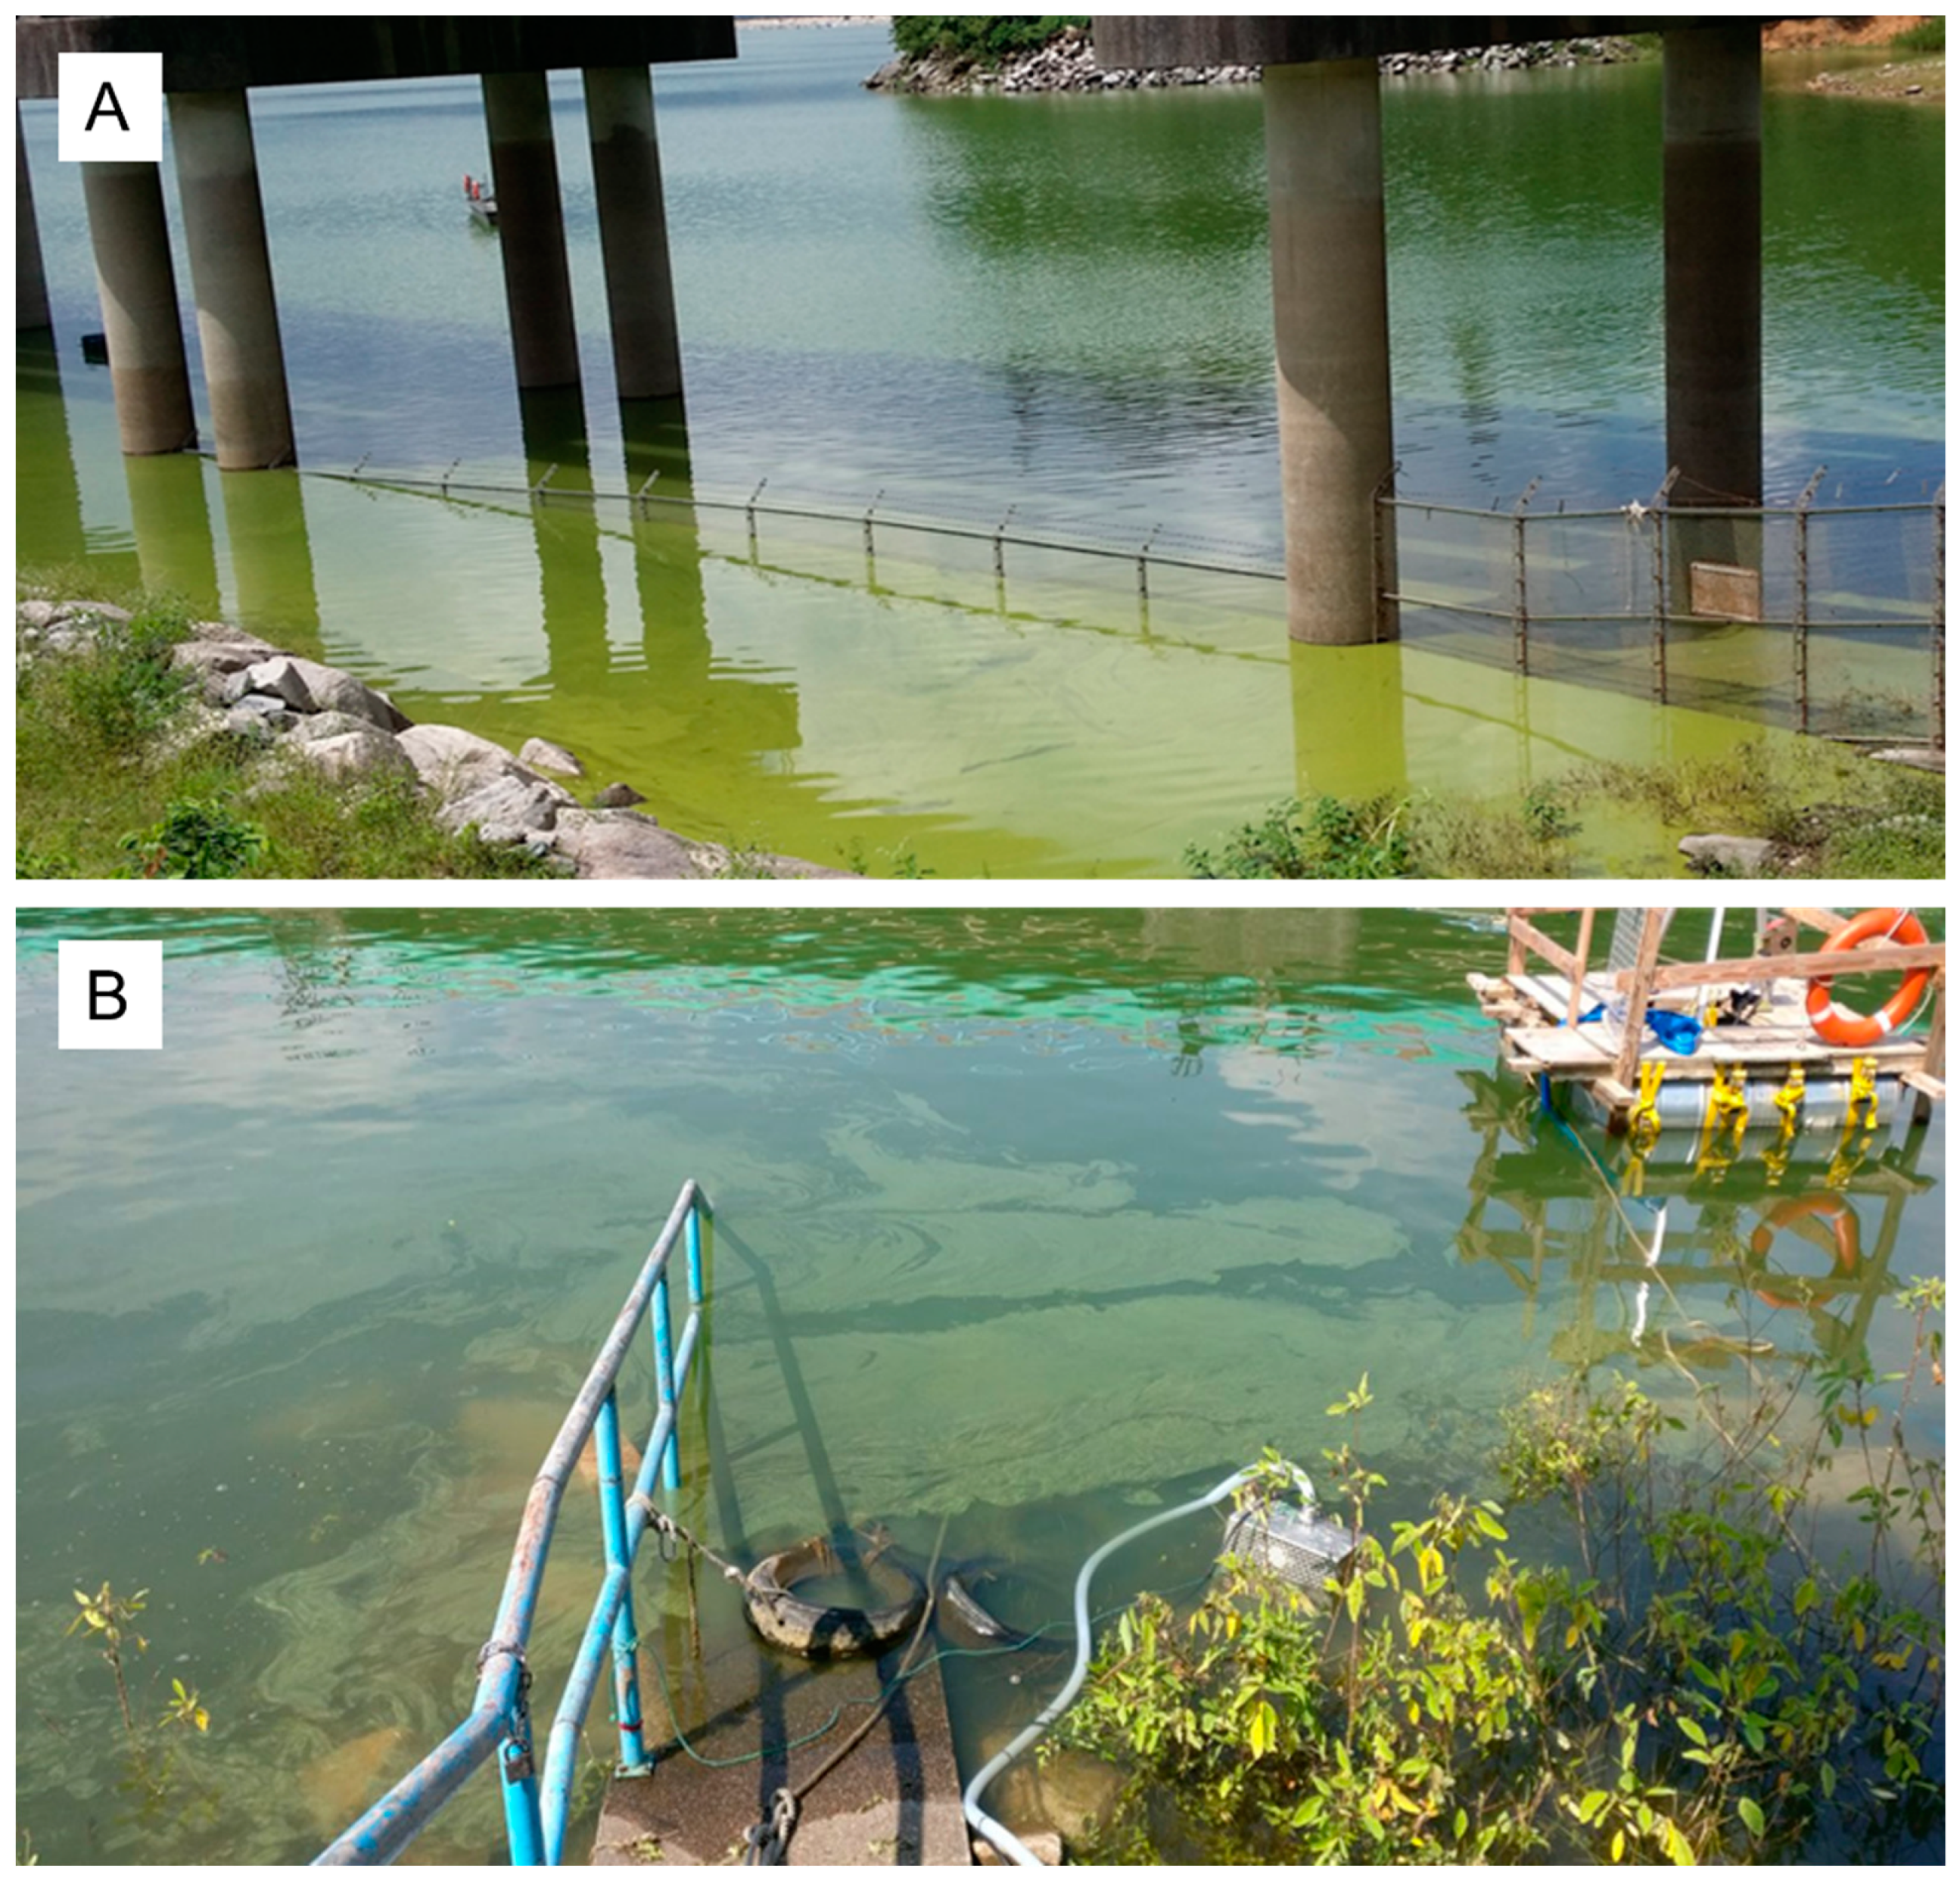
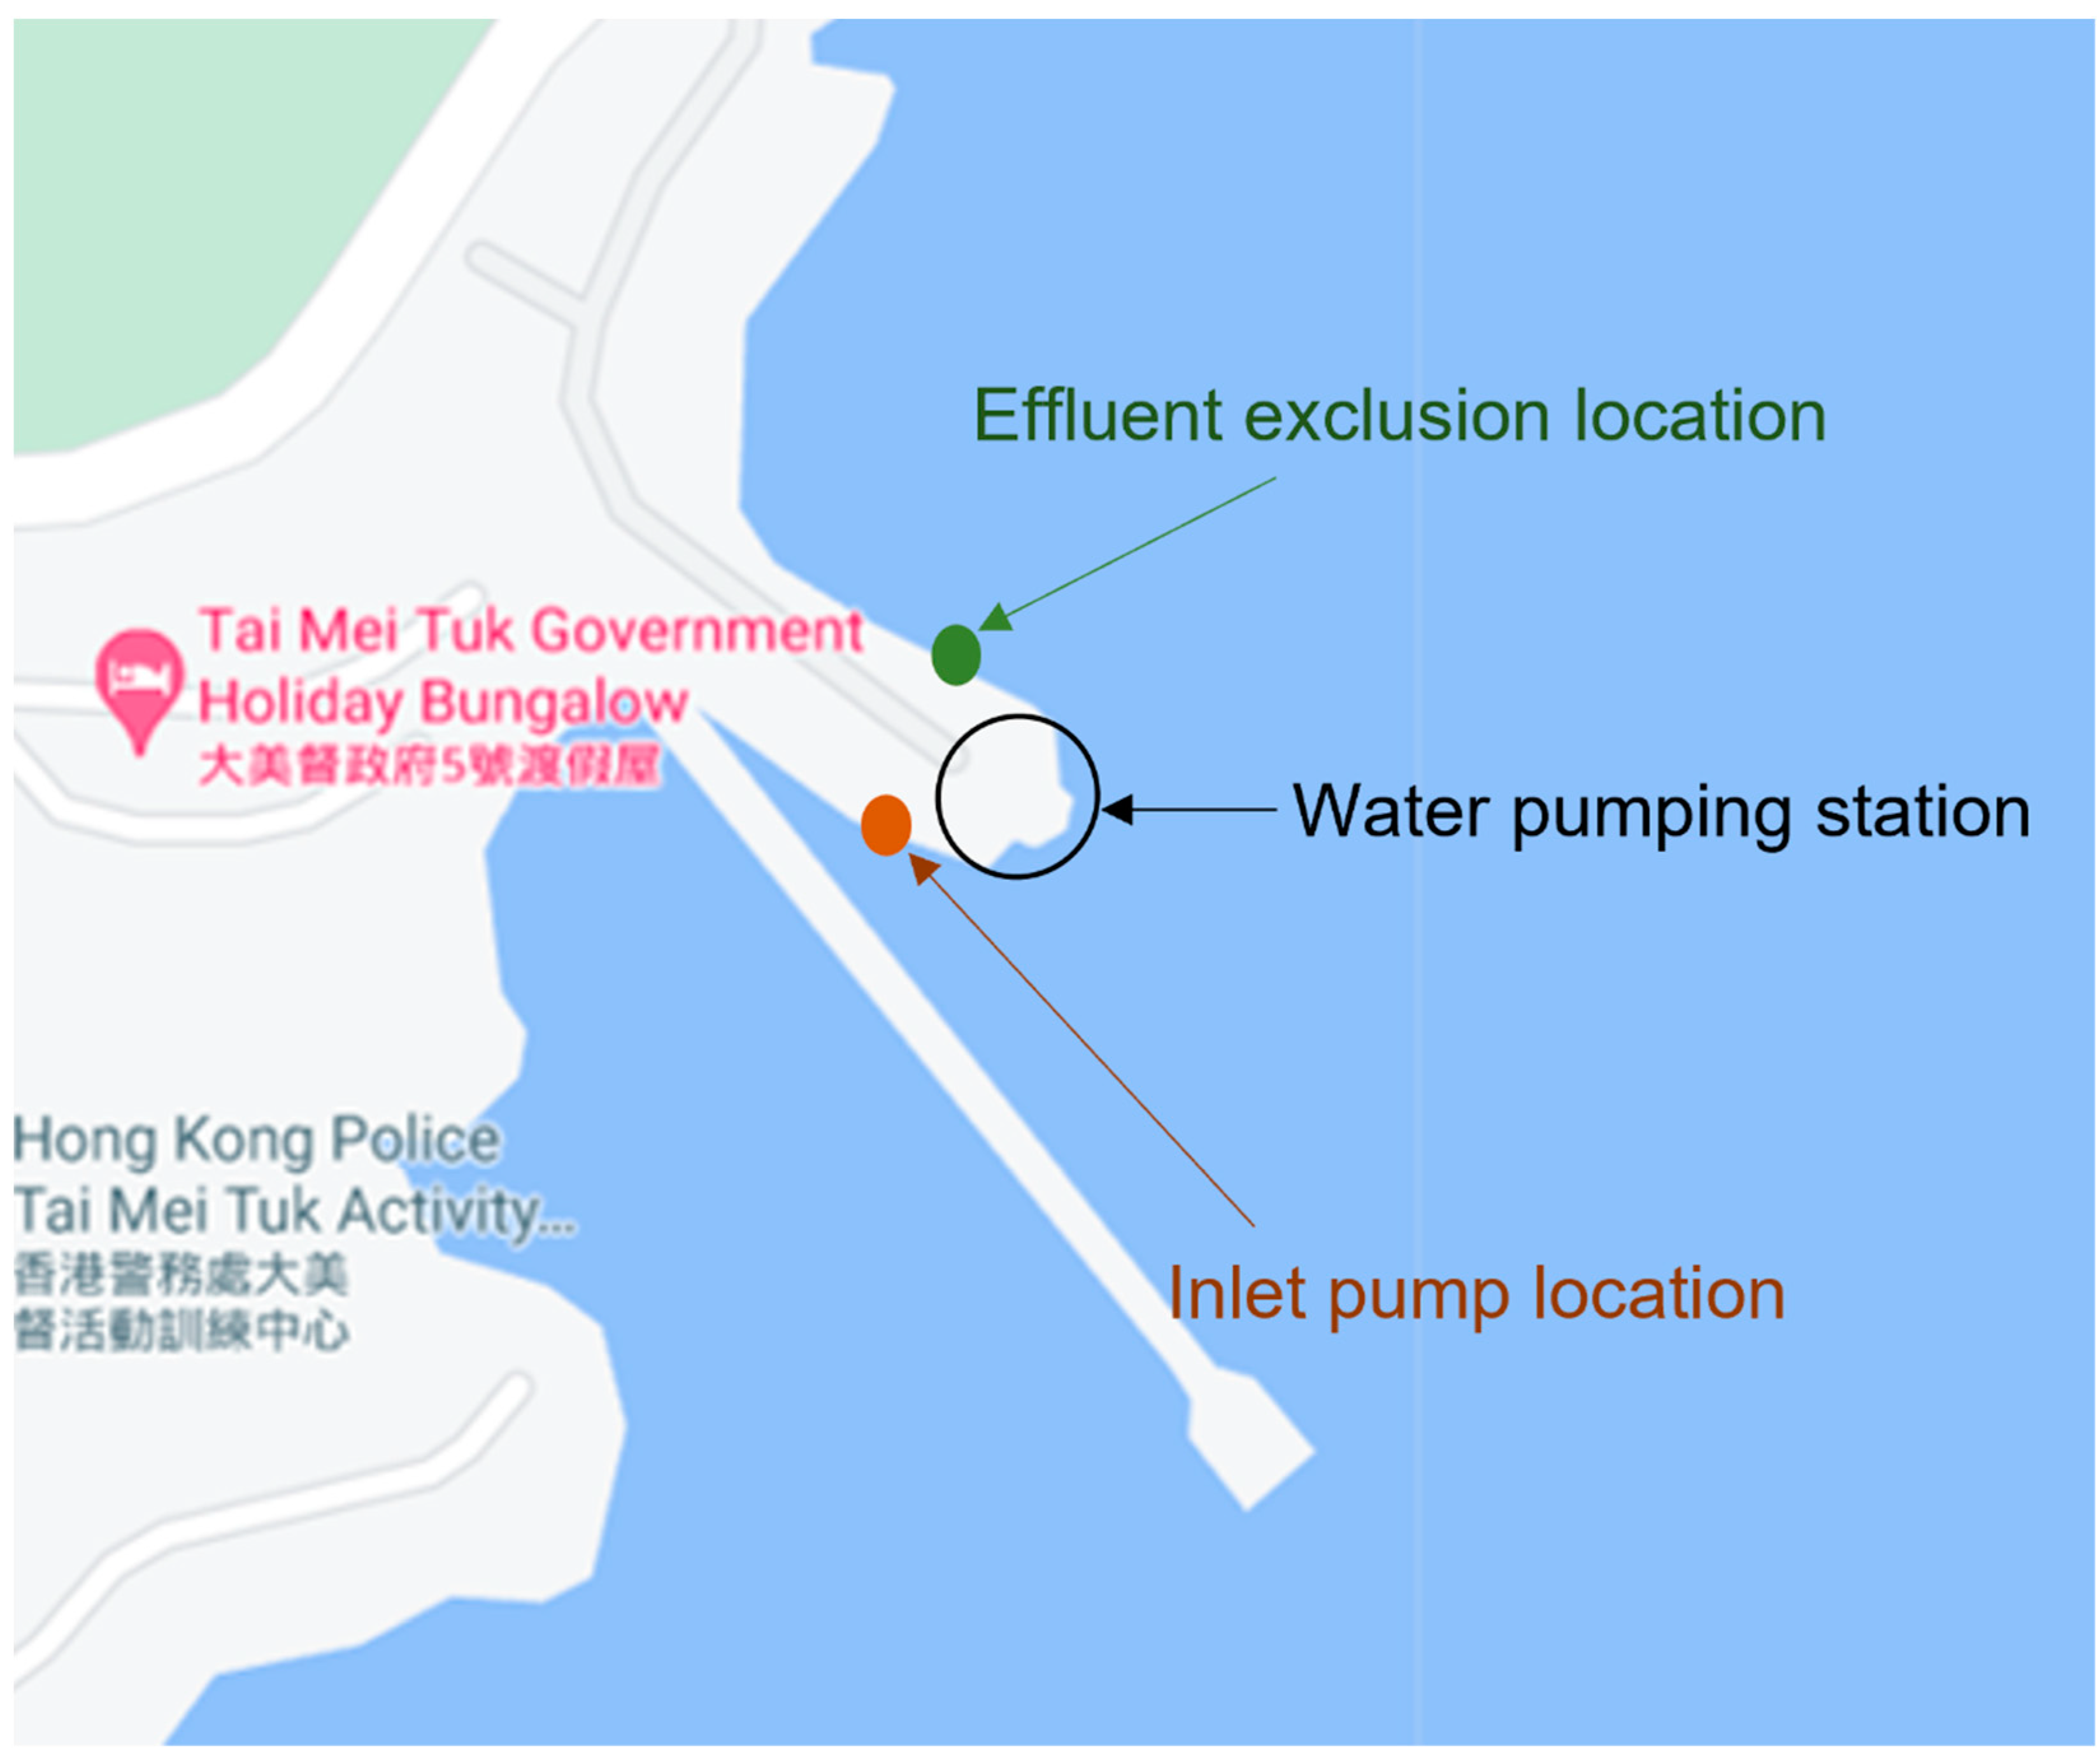
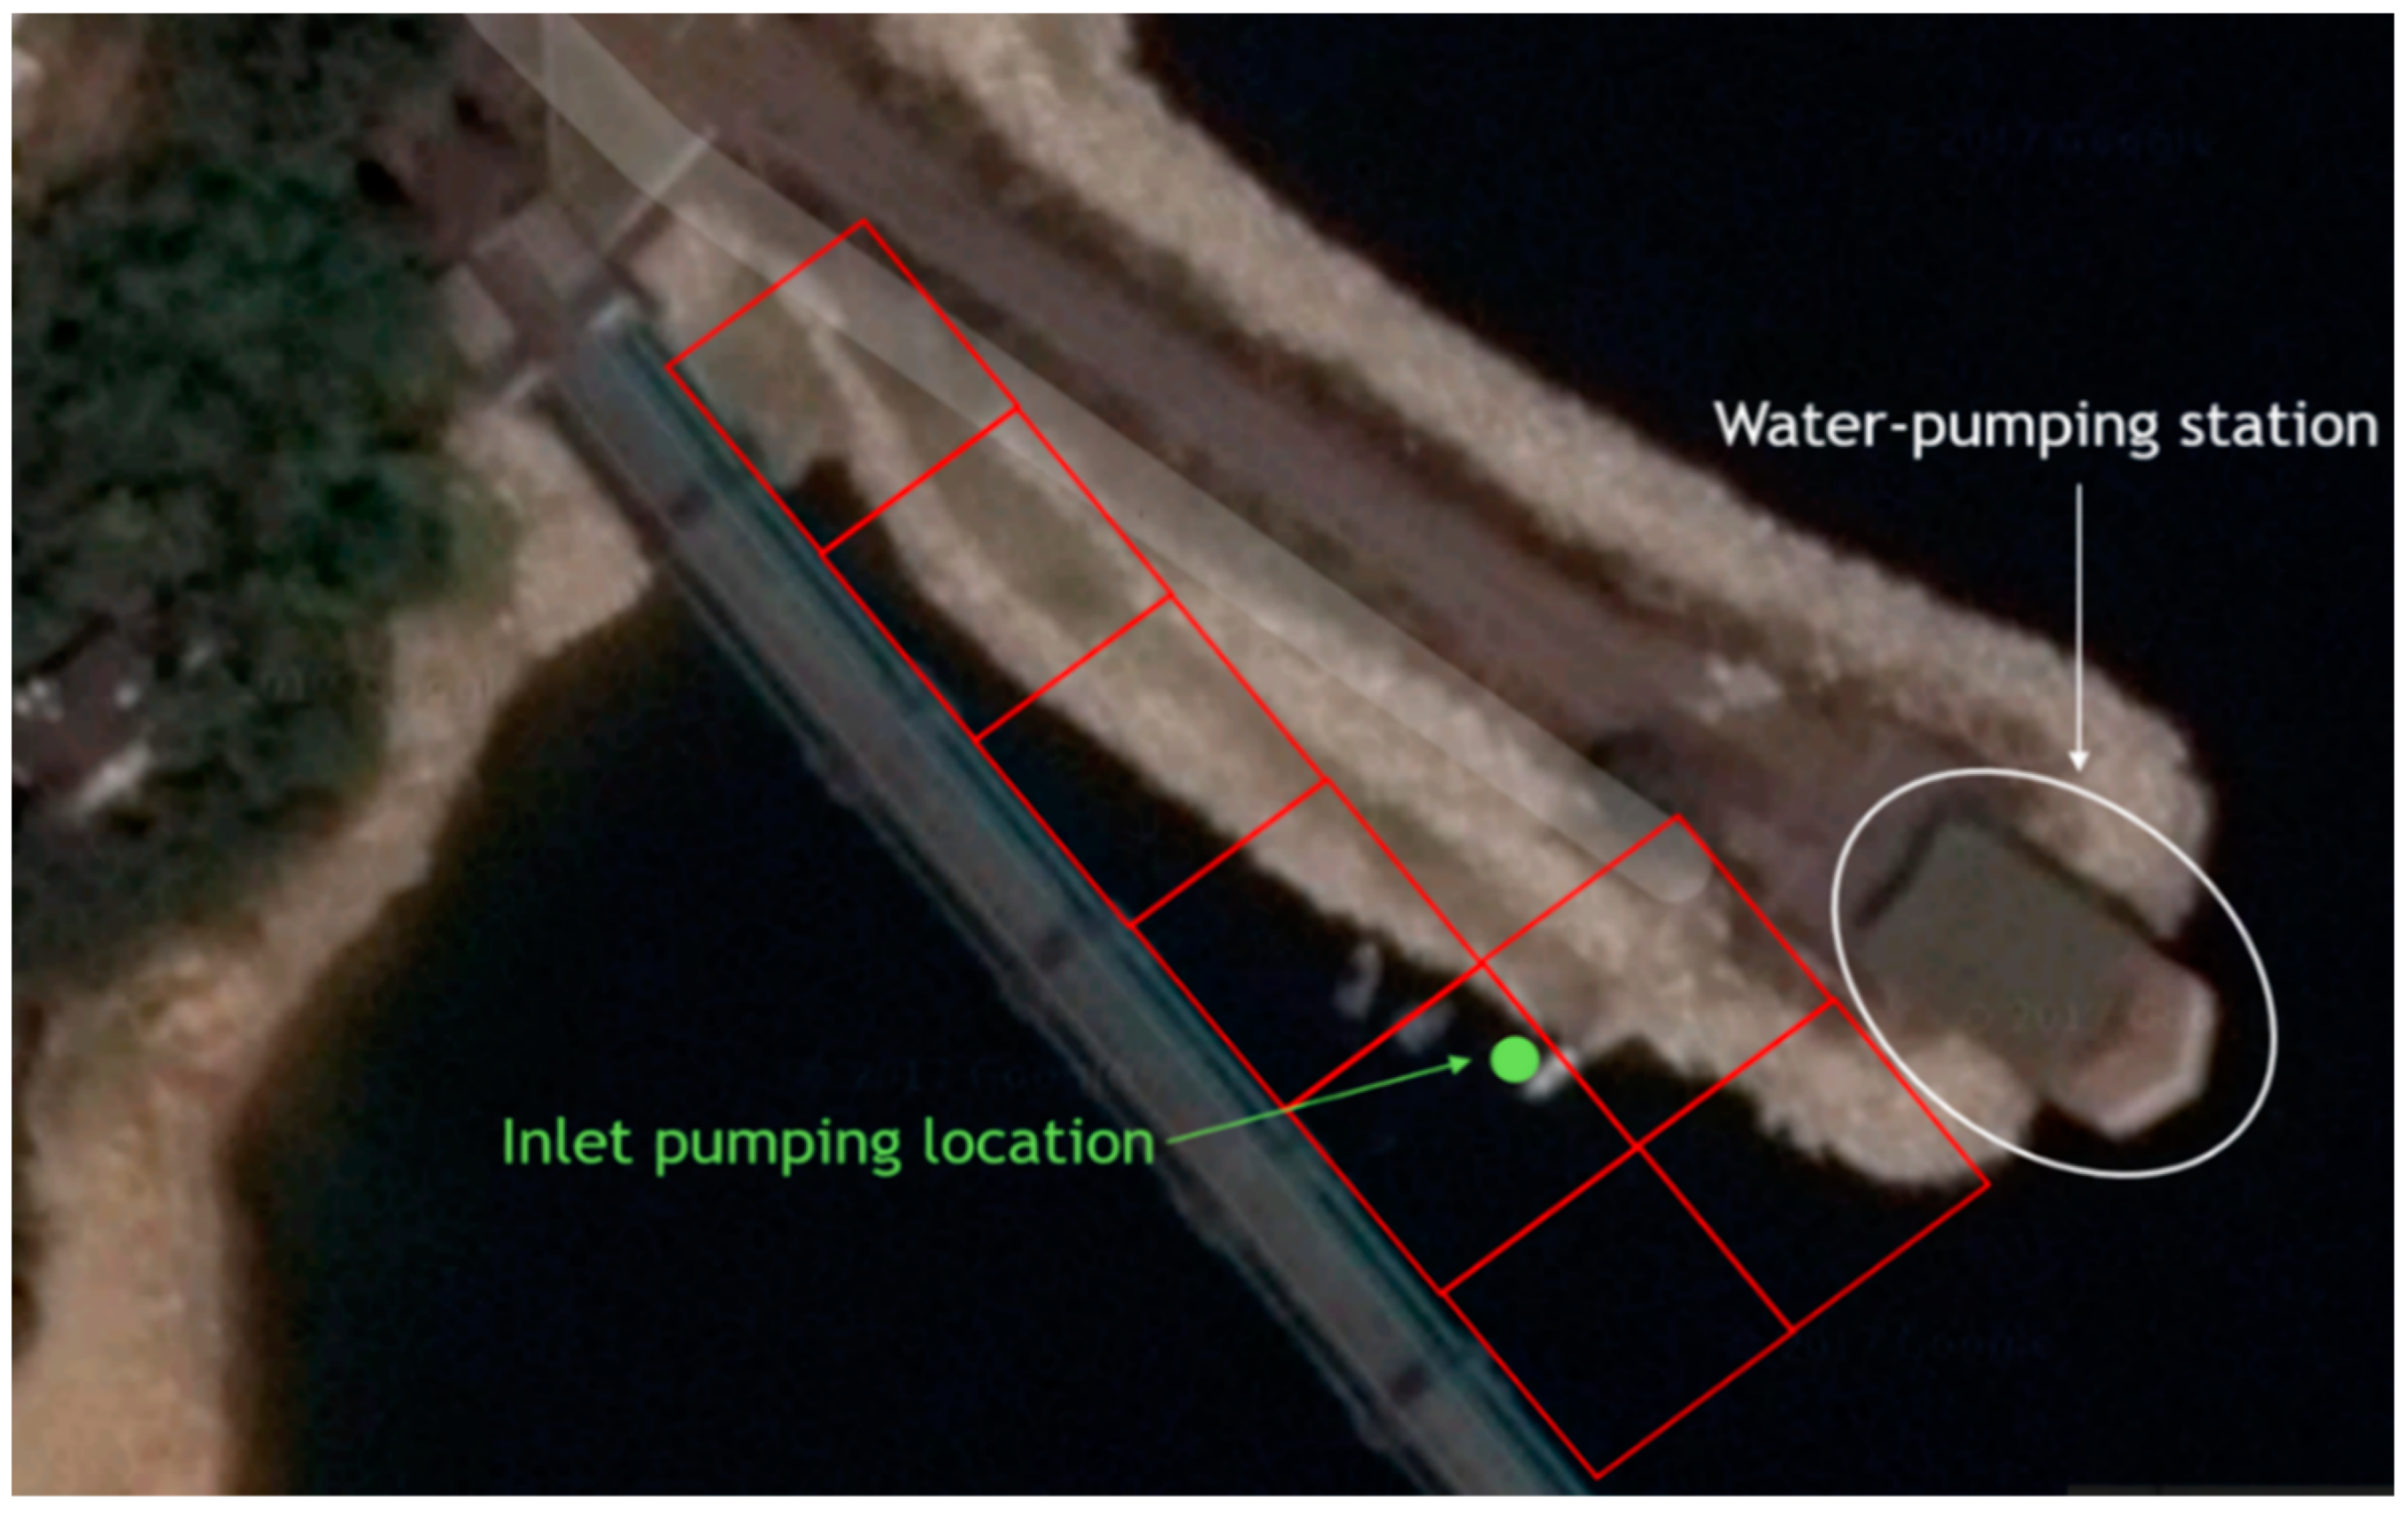
2.2. Field Site Operation

A site near the Water Pumping Station of the Plover Cove Reservoir (22°28’37.2” N 114°14’24.4” E, Figure 5) was chosen as the operation site. The whole system was built and fitted inside a 20-feet metal shipping container (Figure 6). Our microalgae cleaning system was powered by three-phase electricity provided by the Water Pumping Station of the Water Supplies Department, Hong Kong SAR Government, China. The embayment near the pumping station was one of the most severe cyanoHAB spots (Figure 1) and had affected the cleaning efficiency and maintenance of the pumping systems of the station for decades. To avoid dilution of inlet water (from inside the reservoir), the effluent water was directed and excluded in another side of the embankment (Figure 5).
The system was operated every 2–3 days per week from 13 July to 31 August 2017. Starting from 1 September to 13 October 2017, the system was operated once per week. Total continuous runtime of a water cleaning process was 4 h, starting from 10:30 am to 2:30 pm (GMT+8). Although the cleaning system can operate for a longer duration, normal operation of the Water Pumping Station with trespasser restriction entry protocols would not allow our research team to run the cleaning system for more than 4 h each day. When operating, the HCHT centrifuge was operated at its highest flow rate, i.e., 4000 L water per hour, with a centrifugal force of 4500× g during the process. This centrifugal force was known not to break any microalgae and cyanobacteria cells, as verified in our laboratory. The spiral blade parts of the centrifuge were washed with tap water after each operation. The unloaded algal biomass was allowed to air dry overnight.

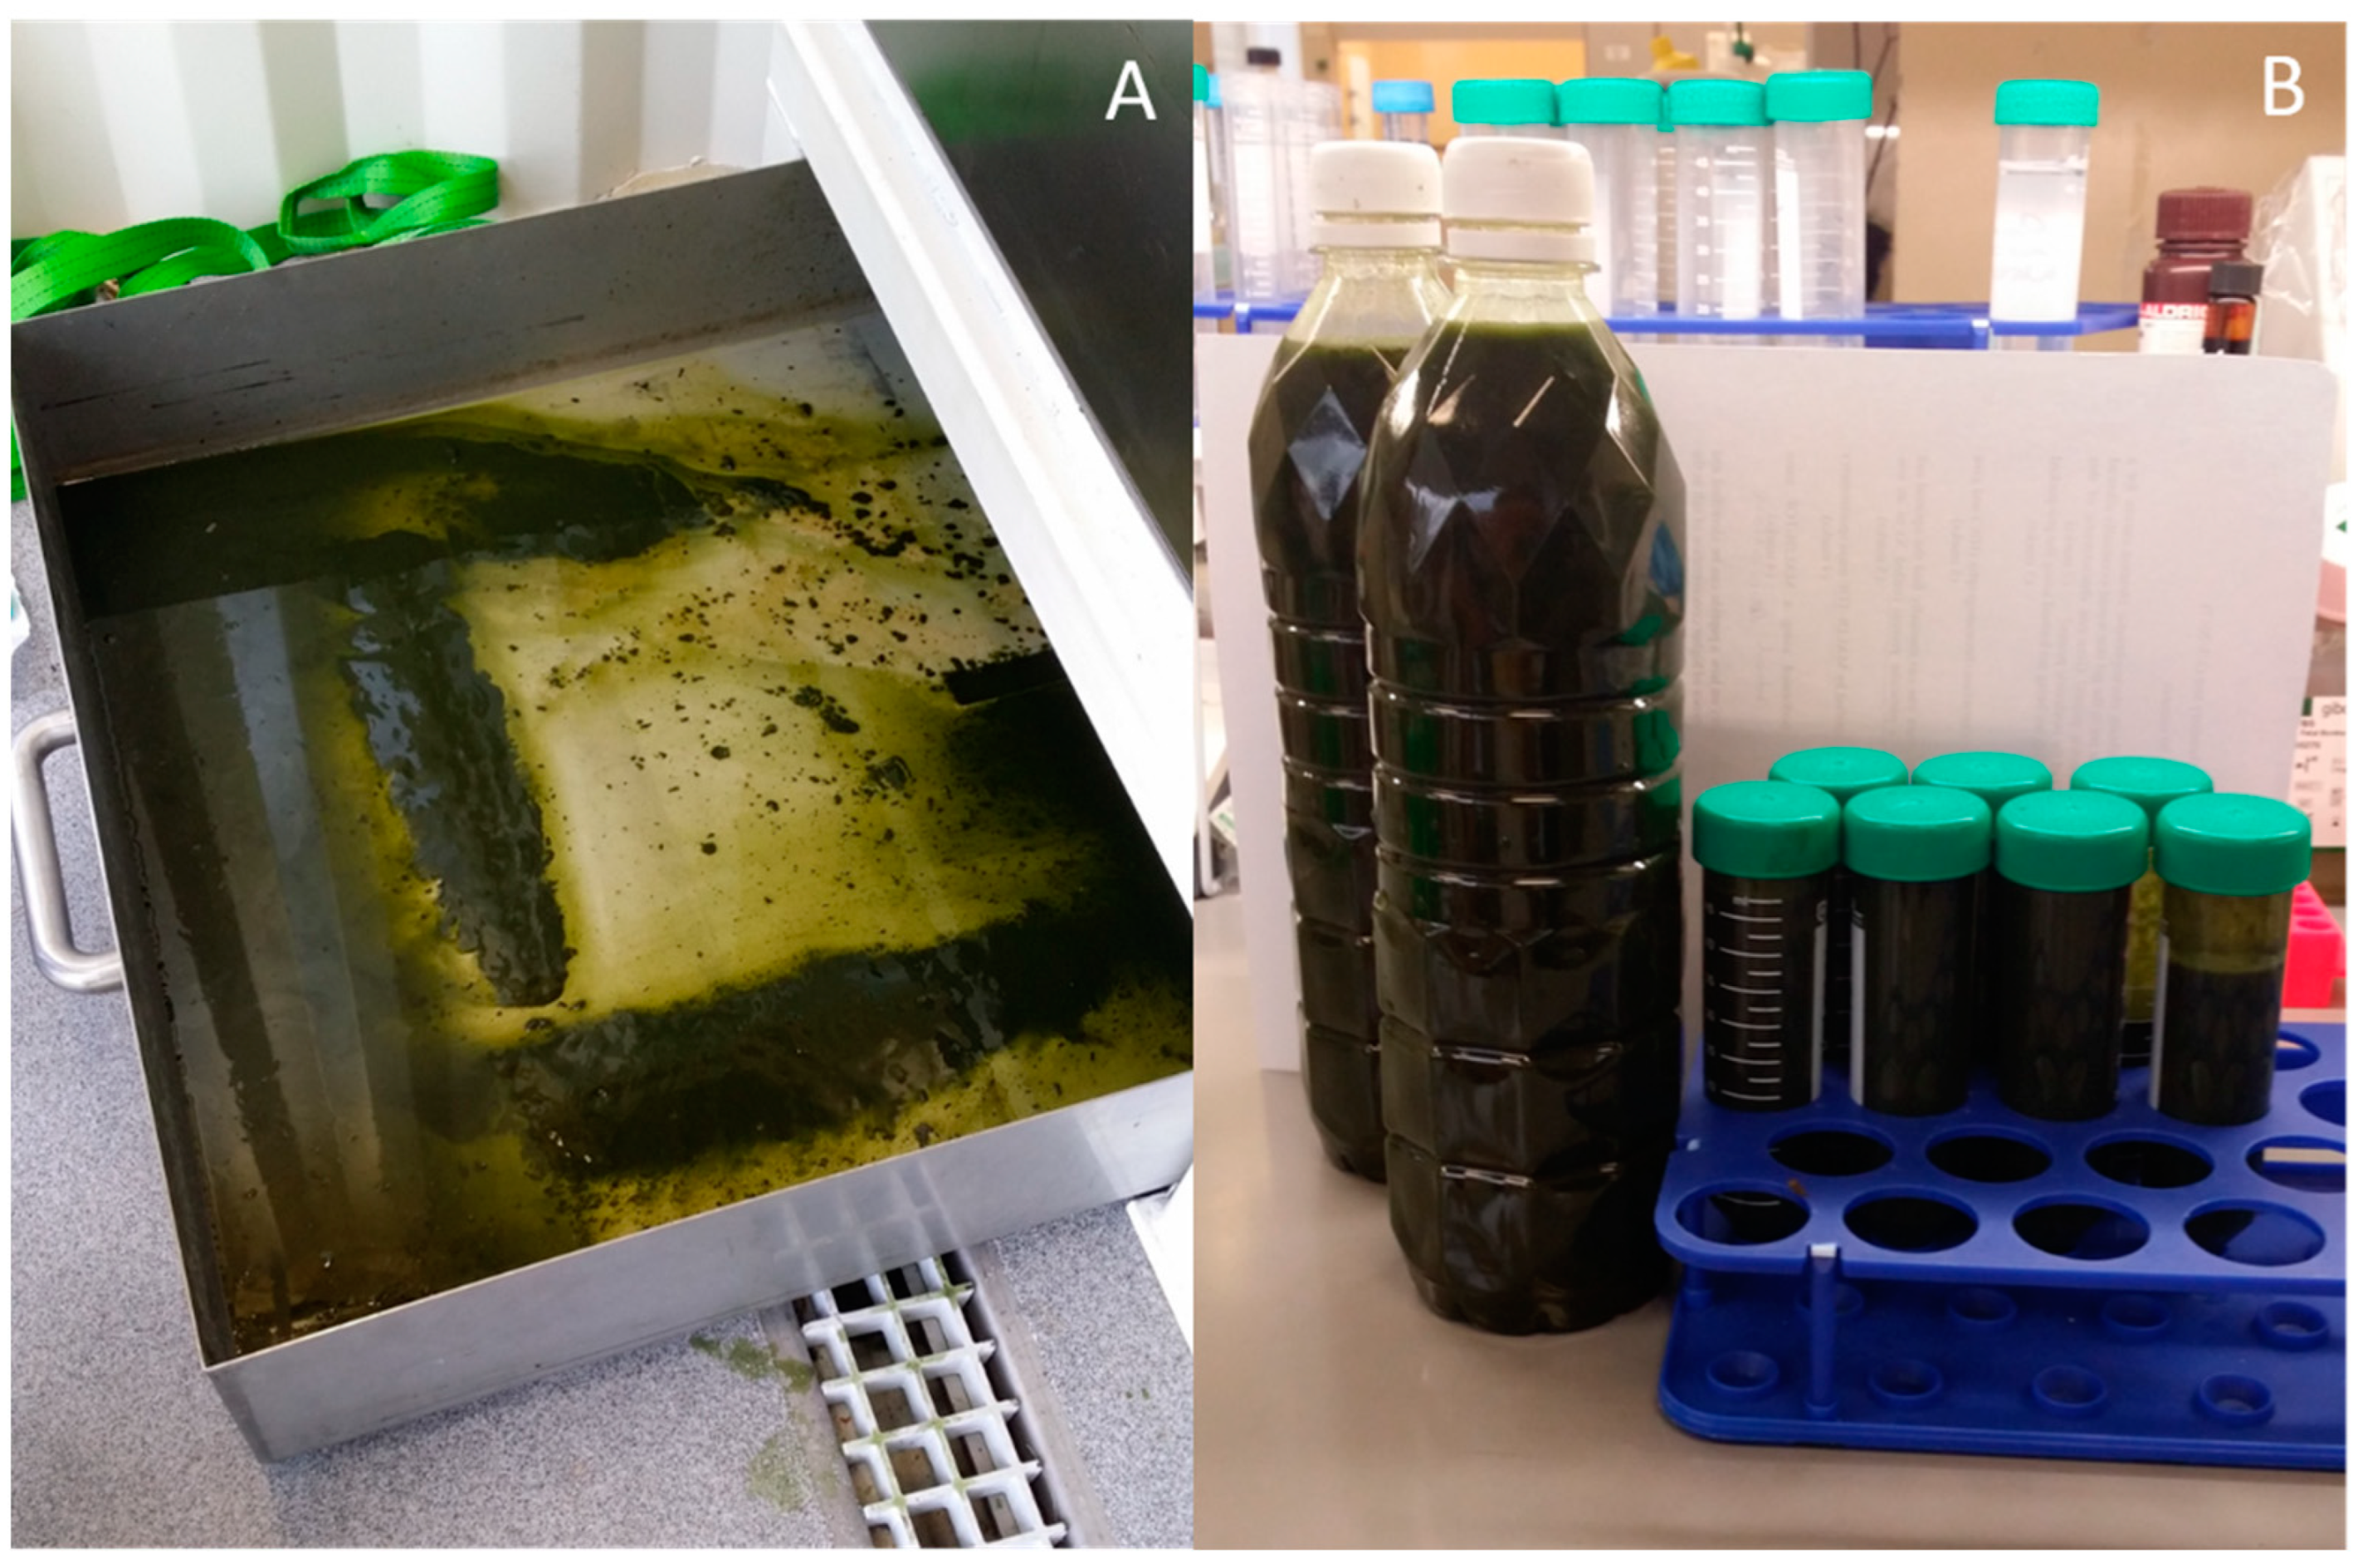
2.3. Measurement of Biomass and Photosynthetic Pigments

Overnight air-dried biomass collected from each operation was spread into a thin layer on an aluminum tray and was then dried using an oven in 80 °C overnight. Weight of the dried biomass collected was recorded. Chlorophyll a and carotenoid concentrations of inlet and effluent water were measured as described previously [36]. In brief, organisms in the 100 mL of fresh water sample were concentrated by 15,000× g for 7 min in dark. Chlorophyll a and carotenoid were then extracted using ice-cold methanol for 20 min in 4 °C. Supernatants were collected using another 15,000× g of centrifugation and the absorbances of samples in 470 nm, 665 nm and 720 nm were measured using a 7315 spectrophotometer (Jenway, Staffordshire, United Kingdom). Chlorophyll a content (Chla) was calculated using the equation [37]:
Chl a [ μ g   mL 1 ] = 12.9447 ( A 665 A 720 )  
Whereas that of carotenoid was calculated by [38]:
C a r o t e n i o d [ μ g   mL 1 ] = [ 1000 ( A 665 A 720 ) 2.86 ( Chl a [ μ g   mL 1 ] ) ] / 221

2.4. Measurement of Water Temperature, pH and Chemical Oxygen Demand (COD)

Water temperature and pH of the samples were measured by a SDL100 pH meter (Extech Instruments, Waltham, MA, USA) on-site at 12:00 pm. Water samples were then transferred to the laboratory as soon as the cleaning operation ended. Chemical oxygen demand (COD) was measured using COD Digestion Kit with 3–150 mg/L range (Hach, Loveland, CO, USA) following the manufacturer’s protocol (Hach method 8000). In brief, 2 mL of sample was added into the COD digestion vial. The mixture was mixed carefully before being heated at 150 °C for 120 min. The vials were then cooled to room temperature. Contents in the vial were mixed before being allowed to settle. Absorbance of the suspended matter were measured at 420 nm using a DR 2800 spectrophotometer (Hach, CO, USA) with potassium acid phthalate being used as standard.

2.5. Investigation of Species Community Using Metagenomic Sequencing

At least 20 L of reservoir water on 4 August 2017 (where both chlorophyll a and carotenoid concentration were the highest) near the sample collection pump as well as the effluent water collected after the cleaning process were collected and were transferred immediately back to the laboratory. The effluent water was first filtered using a sterile 5 µm filter membrane (Advantec, Tokyo, Japan). The filtrate was then further filtered with a sterile 0.2 µm filter membrane. Crude reservoir water (inlet water) was filtered using 0.2 µm filter only. All filter membranes were allowed to filter the samples until they were totally clogged.
Total DNA content on the membranes were extracted using DNeasy PowerWater Kit (Qiagen, Hilden, Germany). Extracted DNA were then transferred to Groken Bioscience (Hong Kong, China) for metagenomic sequencing. In brief, DNA samples were fragmented to around 300 bp using sonication (Covaris, Woburn, MA, USA). After the A-tail repairing and PCR amplification, DNA fragments were then sequenced using HiSeq PE150 platform (Illumina, San Diego, CA, USA). Low quality reads were filtered and clean data were assembled by MEGAHIT [39] to generate scaffolds and then scaftigs (i.e., continuous sequences within scaffolds). Genes were predicted using MetaGeneMark [40] from scaftigs larger than 500 bp. After dereplication using CD-HIT [41], all unique genes were mapped by SoapAligner [42] to construct a gene catalogue. Taxonomies were then identified against NCBI non-redundant database (version 2016-11-05) to generate annotation information of the gene catalogue using the Blast algorithm via DIAMOND [43]. Blast results with an E-value within 10-fold of the minimum E-value found in the total annotation pool were selected for further analysis. Taxonomic annotation of each identified gene was then assigned by lowest common ancestor (LCA) algorithm via MEGAN [44]. Taxonomies of the community were then visualized by Krona [45], and further presented in a bar chart. Only species names of the first 10 abundant taxonomy in the taxonomies were shown.

3. Results and Discussions

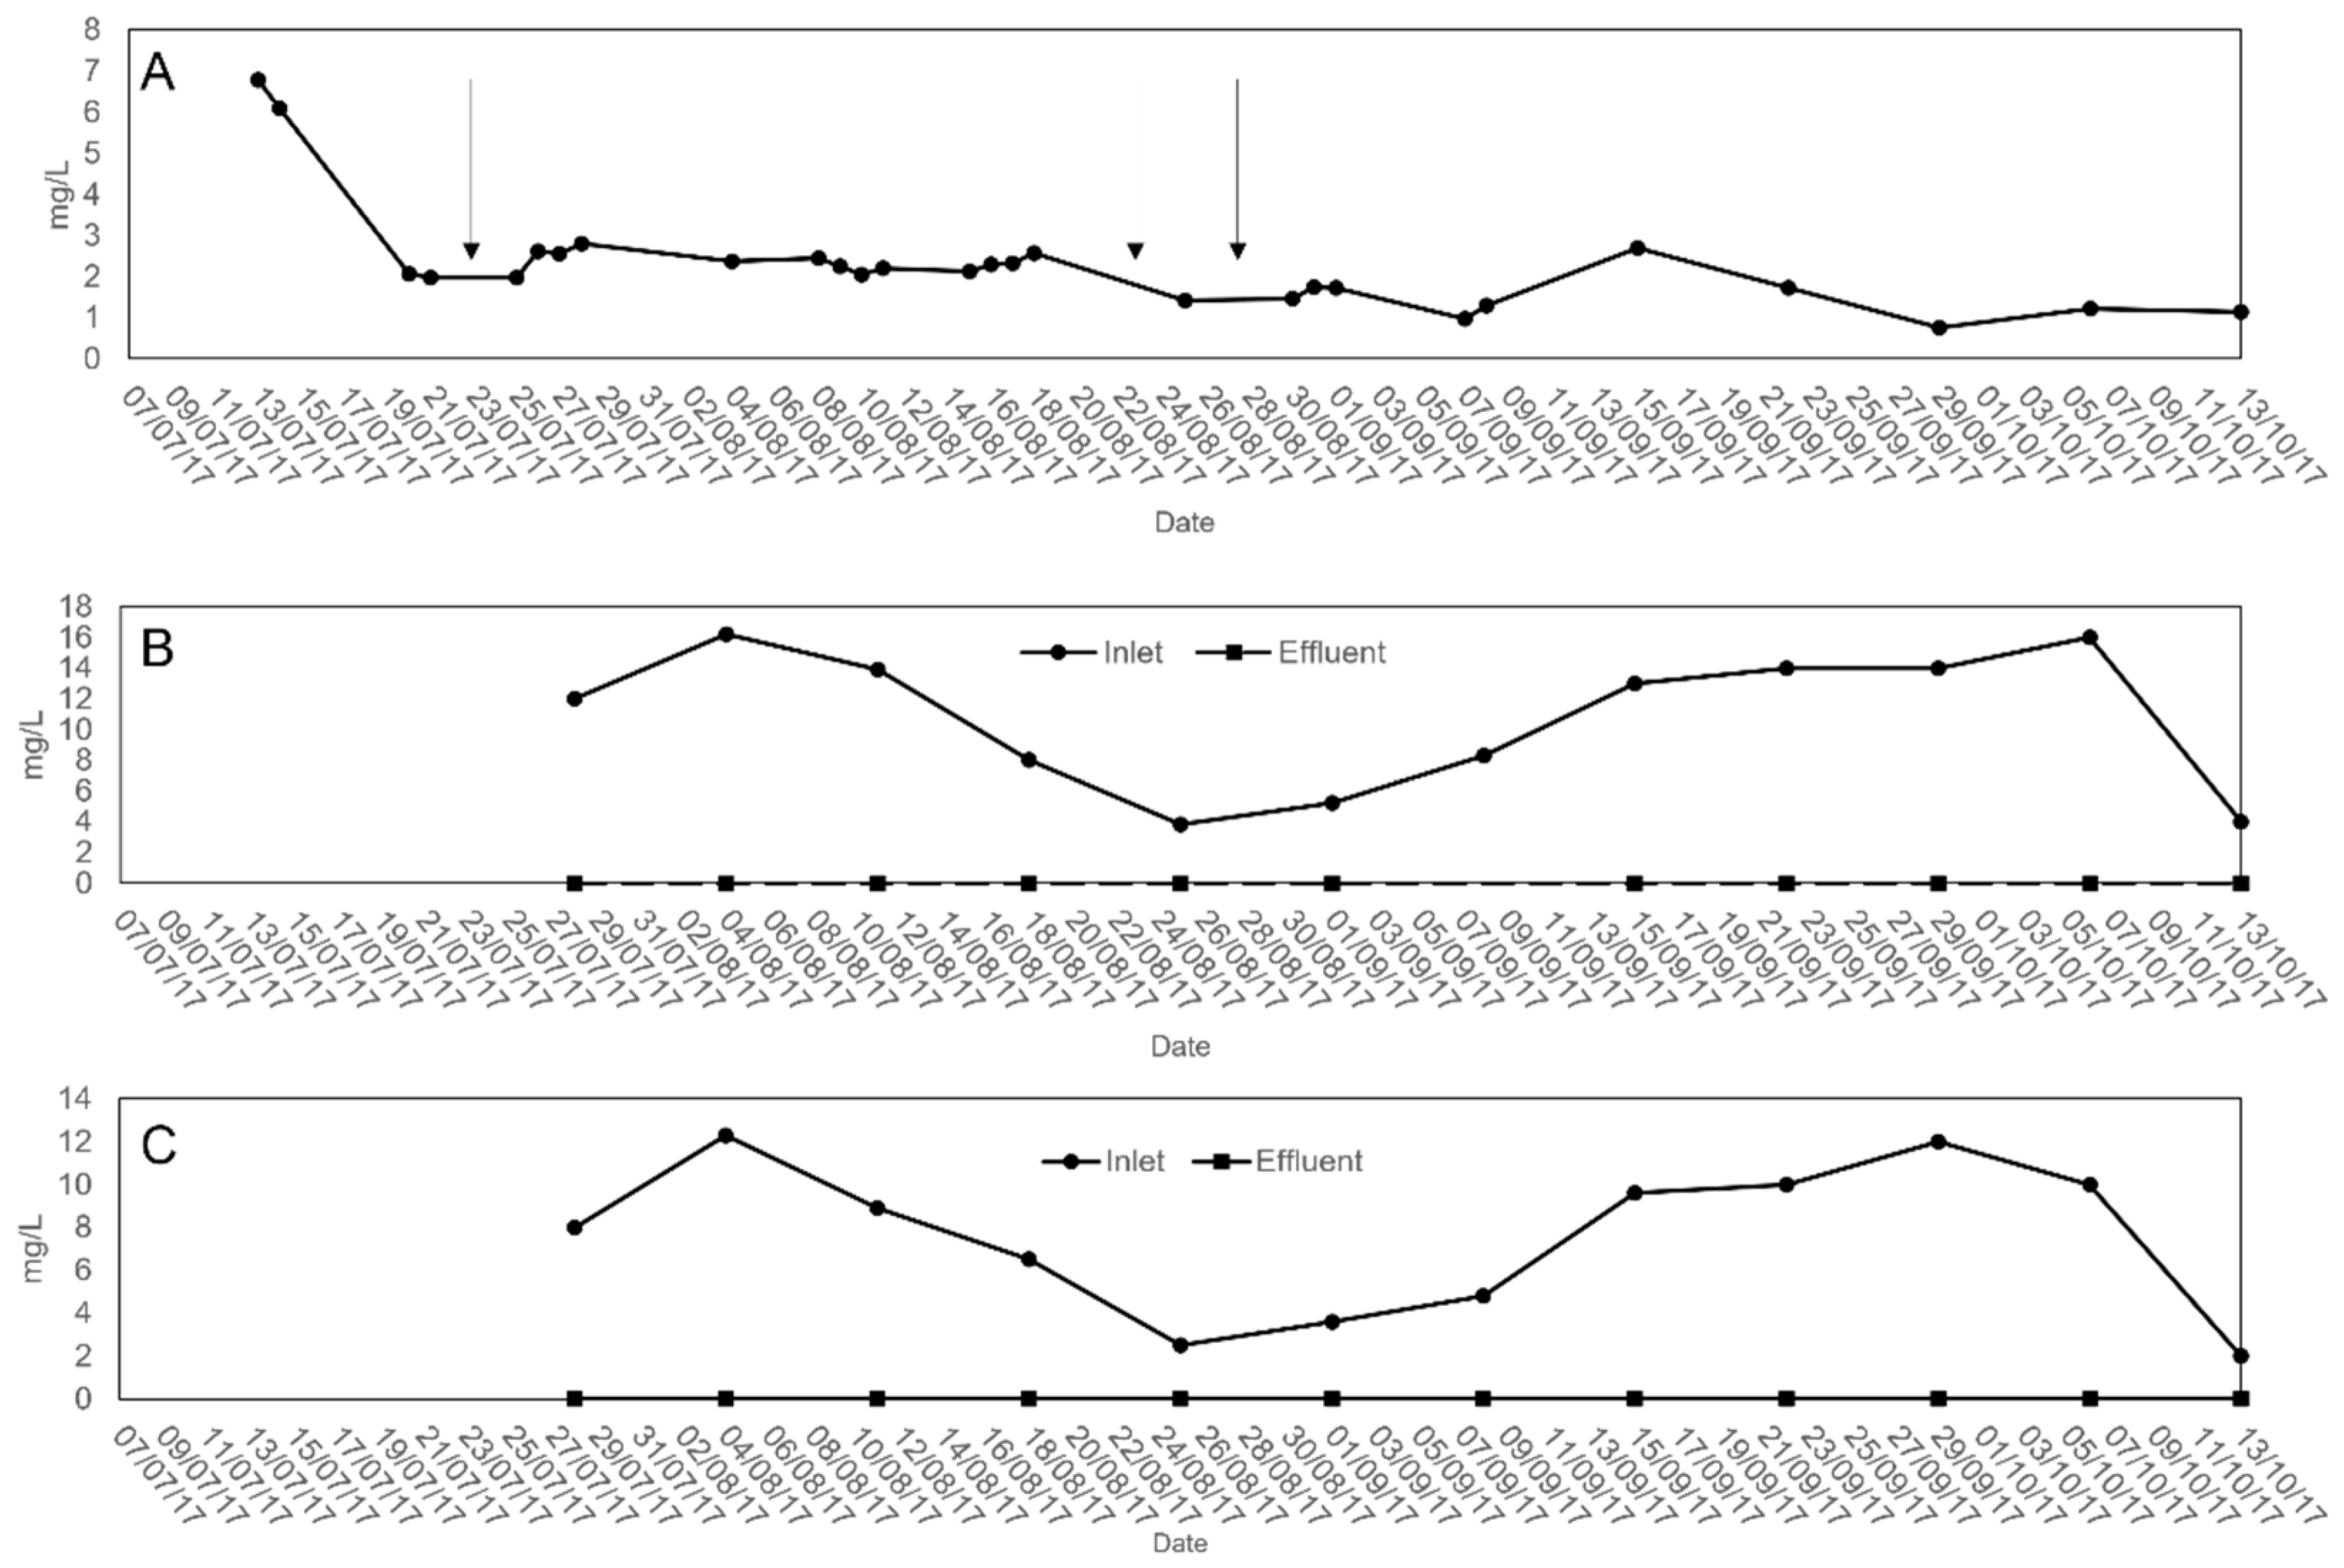
3.1. Performance of the Algae Cleaning System on Removing Cyanobacterial Biomass and Its Consequent Effects on Water Quality

We had commissioned a company in the Netherlands called Evodos Dynamic Settlers to build our deployable rapid cleaning system with their HCHT centrifuge system (model T-25) as a center piece and put all the essential accessories inside a 20-feet (60.9 m long) metal shipping container (please see Materials and Methods as well as Figure 2 for a brief description of the setup). After commissioning of the algae cleaning system on 13 July 2017, we started to operate the system every 2–3 days until late August 2017. During that period, three tropical typhoons hit Hong Kong, and hence, affected our data collection (Table 1).
Due to safety reasons, operation of our system was suspended on the day where typhoon warnings were enforced by The Hong Kong Observatory. The operation was resumed usually one to two days after the cancelation of all typhoon warnings. Starting from the beginning of September and until the middle of October 2017, the algae cleaning system was operated for at least once per week, aiming to investigate the performance of the system when the cyanobacteria densities were considered not high. As shown in the results below, our algae cleaning system could operate efficiently under various conditions, including hot ambient temperature, as well as highly fluctuating algal densities. Figure 7 demonstrated the biomass harvested by the algae cleaning system from the embayment area of the Plover Cove Reservoir.
Amounts of dried biomass obtained per liter of inlet algae-laden water from 13 July 2017 onwards followed a decreasing trend from 6.8 mg/L to the lowest 0.8–1.2 mg/L on 13 October 2017 (Figure 8A). Chlorophyll a concentration in inlet algae-laden water, which is an indicator of the population of phytoplankton in water [46,47], in contrast, dropped from the highest 16.2 mg/L on 4 August 2017 to the lowest 3.8 mg/L on 25 August 2017, then subsequently increased back to near 14–16 mg/L during September to early October 2017 (Figure 8B). Carotenoid concentration in the algae-laden inlet water followed a similar pattern, with only 2.5 mg/L detected on 25 August, compared to that over 10 mg/L in July and early October (Figure 8C). Effects of the typhoons, both the concomitant extreme weather as well as rainfall, especially on the decreasing phytoplankton levels in the inlet water from 25th August onwards, had complicated growth patterns of algae and biomasses in the reservoir. Nonetheless, both chlorophyll a and carotenoid were not detectable in the effluent water samples (i.e., water after the cleaning process), suggesting that an over 90% (by weight) removal rate of phytoplankton from the inlet water was achieved.
To further investigate the performance of our algae cleaning system, microorganisms in inlet water and effluent water from 4 August 2017 with the highest chlorophyll a concentration in inlet water were recorded and collected and the metagenome was sequenced for species community analysis. From Figure 9, over 30% (by relative abundance) of microbial population in inlet water (inlet) belongs to the cyanoHAB-causative agent M. aeruginosa. After the harvesting process of our algae cleaning system (the sample named eff50), less than 3% (by relative abundance) of M. aeruginosa was identified in the metagenome, suggesting an overall 90% (by relative abundance) of M. aeruginosa removal efficiency. In addition, population of another cyanobacterium Limnothrix sp. [48] also reduced by more than 50% (by relative abundance) after the cleaning process (Figure 9). Both M. aeruginosa and Limnothrix sp. were not presented in the effluent water samples after passing the 5 µm membrane filters (eff02). In contrast, other species identified in the metagenomic analysis were all non-photosynthetic bacteria [49,50,51,52,53]. As they were all found in eff02 (i.e., samples collected on the 0.2 µm membrane filters), they may be too small to be collected by the mobile cleaning system, and hence, were retained in the effluent water (Figure 9). These results further suggested that our mobile cleaning system was capable of removing over 90% (by relative abundance) of the freshwater phytoplankton biomass.
Apart from the efficiency of phytoplankton removal, it is also important to investigate if the quality of the effluent water had been changed after the cleaning process. The HCHT centrifuge (model T-25 of Evodos Dynamic Settlers) employed the spiral blade technology® [35] that could collect the microalgae biomass with low centrifugal and shear forces. This technology is being used for biomass harvesting on massive microalgae planting sites [54,55], as it ensured cellular integrity and even ensured the living status of the harvested microalgae cells [56]. In this connection, water temperatures of the inlet water samples, as well as chemical oxygen demand (COD) and pH of the inlet and effluent water (Figure 10), were measured to access if there were changes of qualities of water after the harvesting process. It was found that water temperatures fluctuated between 25–35 °C from July to October. This range of fluctuation is normal in Hong Kong as a subtropical region during summer and early autumn. Values of pH of both inlet and effluent water samples ranged from 7–9.7 during the process (Figure 10A). The average pH of inlet water was 8.5 ± 0.7, whereas that of effluent water was 8.4 ± 0.7. It is unclear why there was such a fluctuation in such a large water body. It may occur just around the embayment region where we conducted our experiment instead of the whole reservoir. Nonetheless, it should be stressed that pH values of the water samples generally did not change before (inlet water) and after the process (effluent water) (Mann–Whitney U test P value = 0.248), indicating that the cleaning process did not introduce any factors that alter pH of the water body. COD values of effluent water samples ranged from 3.7 to 18.1 mg/L with a mean value of 9.54 ± 4.9, which fell within the recommended range of COD of unpolluted surface water (20 mg/L or less) by the World Health Organization (WHO) [57]. Furthermore, COD values of effluent water samples shown in Figure 10B were always lower than that of the inlet water (mean of COD of inlet water: 15.54 ± 5.4, df: 14, P value: 0.035), further indicating that the cleaning process did not add oxygen demand into the water body, but generally removed the oxygen demand from it. As a result, our algae cleaning system would not bring any impact on the quality of water except the removal of cyanobacterial biomass during the process.

3.2. Estimated Energy Requirement and Cleaning Efficiency

Traditionally, the use of centrifugation to harvest microalgae biomass was deemed inefficient and energy demanding. In a traditional swing-out laboratory centrifuge setup, we needed >30 h to harvest the algal biomass in 10 L of dinoflagellate culture (unpublished results). On the contrary, the HCHT centrifuge system is very efficient and has low energy demand. One 4-h operation of the HCHT system would process 16 m3 water, according to the maximum processing rate of 4000 L/h. A laboratory centrifuge would need 48,000 h to process the same amount of algae-laden water. The theoretical energy requirement of our cleaning system in a 4-h operation could be calculated as follow. According to the official description from Evodos, the manufacturer of the T-25 HCHT centrifuge, the energy requirement is 1.2 kW per m3 of water (0.95 kW/m3 of liquid for separation and 0.25 kW/m3 for pumping, respectively). Altogether with the calculation of other accessories (feed-in and feed-out pumps, diving pump for water collection and the air-compressor), total energy requirement to drive the whole cleaning unit for 4 h would be about 24 kWh. In field practice, when the current and voltage required for the main power that drives the whole system (HCHT centrifuge, pumps and air compressor included) was monitored, we found that energy consumption boosted up to 23 A and 380 V while the system was initiated, then gradually decreased in 15 sec, and maintained at 9 A and 380 V during the 4-h operation. As a result, the actual energy consumption of a 4-h operation of the algae cleaning system would be approximately 23.8 kWh, which was closed to the theoretical energy requirement. The HCHT system is deemed very effective with a correspondingly low energy demand.
Figure 11 illustrated the area of the embayment near the water pumping station of Plover Cover Reservoir. Each red box in Figure 11 indicates the area of the embayment of the pumping station is 400 m2, i.e., there are approximately four boxes in total in the area, the area of the embayment would be approximately 1600 m2. Given that the inlet water collection pump of our system could collect algae-laden water on the top one meter of water surface, where the algal biomass is mostly found during a cyanoHAB, there would be 1600 m3 of water to be cleaned in a 4-h operation. The throughput of our algae cleaning system is 4000 L/h, which indicated that 400 h are needed to clean the surface water of the entire embayment, and 2420 kWh of power would be consumed. As a result, given that if the target is to clean up 1600 m2 of this embayment area in 24 h, 16 machines would be needed. Of course, there are inadequacies of our calculation, such as that the unit cannot operate 7 × 24 h and algal biomass will only surface in the top 1 m of surface water when the sun is out. Furthermore, utilization of the system to completely remove cyanobacteria (and other microorganisms shown in Figure 9) within a short time is unrealistic and also might not be optimal for the inherent ecosystem and subsequently the water quality of the reservoir. Nonetheless, our calculation indicated that if there are sufficient units of the HCHT harvest system that worked continuously during the peak season of cyanoHAB, population of cyanobacteria in the embayment could be significantly reduced.

3.3. Further Applications of Our Algae Cleaning System

The results described above show that our algae cleaning system was able to collect cyanobacteria cells bloomed near the pumping station of Plover Cove Reservoir. In fact, the design of fitting all the components of the system in a standard 20-feet metal shipping container was an attempt to make it rapidly deployable or even mobile if put on a container truck. With a diesel electric generator and a suitable damping system to ensure a steady horizontal platform for the HCHT centrifuge to process, our algae cleaning system could work in most sites where algal bloom happened, including any spots near a lagoon or reservoir or any coastal area in a continuous operation mode. Furthermore, this system could also be put on a boat or a badge with proper damping and stabilization system such that harmful algal blooms nearing fish culture zones that are located with a distance from the coast could also be cleaned. This part of application still needs to be tested in the future.
Lastly, the algae biomass harvested could be used for various applications. Microalgae and cyanobacteria have been seen as the feedstock of third-generation biofuels [58] as well as for the application of cosmetics [59], animal feeds [60,61,62] and valuable fatty acid production [63]. While mass cultivation of microalgae and cyanobacteria had been studied for decades [64,65,66], occurrence of HAB was random but naturally occurring “mass cultivation” of microalgal or cyanobacterial biomass. HAB researchers often predicted that the occurrence of HAB would get more frequent as times go on, owing to a progressive increase of the concentration of carbon dioxide in the atmosphere and the subsequent global warming [67,68], especially for cyanobacteria, which often have higher tolerance to high water temperature [69]. Algal bloom removing methods, such as chemical flocculation, clay and soil, as well as ultra-sonication and algicides described by others, only removed the bloomed biomass at best but failed to retrieve them. These methods also cannot prevent massive simultaneous release of toxic cellular contents from these HAB during the treatment procedures. On the other hand, our algae cleaning system could collect intact microalgae and cyanobacteria from natural bloom such that these potentially valuable biomass could be used constructively. Microalgae and cyanobacteria captured CO2 from the atmosphere for growth and the biomass produced could then be utilized for biofuel or animal feeds to reduce the overall carbon footprint.

4. Conclusions

To conclude, this algae cleaning system is rapidly deployable, capable to collect over 90% (by relative abundance) of microalgae or cyanobacteria biomass from naturally occurring HAB in lagoons and reservoir. The cyanobacteria collected was kept intact, such that there is no alteration of freshwater quality in terms of oxygen demand and acidity. The cleaning system could operate in robust environment with wide range of temperatures and weather conditions. The algal biomass collected could be of beneficial use for mankind.

Author Contributions

Conceptualization and methodology, S.P.-K.T., K.-F.Y., W.-T.W. and S.C.-L.L.; investigation, S.P.-K.T., P.-Y.L., T.-W.C. and C.-K.L.; resources, W.-T.W. and S.C.-L.L.; data curation, S.P.-K.T., P.-Y.L., T.-W.C. and C.-K.L.; writing—original draft preparation, S.P.-K.T.; writing—review and editing, S.C.-L.L.; supervision, S.C.-L.L.; project administration, S.C.-L.L.; funding acquisition, W.-T.W. and S.C.-L.L. All authors have read and agreed to the published version of the manuscript.

Funding

This study was supported by the Environmental Conservation Fund (ECF 52/2015), Hong Kong SAR, China.

Institutional Review Board Statement

Not applicable.

Informed Consent Statement

Not applicable.

Data Availability Statement

All of the data is contained within the article.

Acknowledgments

The authors would like to thank Eric Ka-Wai Cheng from the Department of Electrical Engineering, The Hong Kong Polytechnic University, for his technical advice during the project. The authors also like to thank the Water Supplies Department for allowing us to test our system in the Plover Cove Reservoir Pump Station as well as the officials there for providing help whenever we needed it. The technical support by the University Research Facility in Life Science (ULS) as well as the University Research Facility in Chemical and Environmental Analysis (UCEA) are very much appreciated.

Conflicts of Interest

The authors declare no conflict of interest.

References

  1. Carmichael, W.W. Health effects of toxin-producing cyanobacteria: “The CyanoHABs”. Hum. Ecol. Risk Assess. Int. J. 2001, 7, 1393–1407. [Google Scholar] [CrossRef]
  2. Qin, B.; Zhu, G.; Gao, G.; Zhang, Y.; Li, W.; Paerl, H.W.; Carmichael, W.W. A drinking water crisis in Lake Taihu, China: Linkage to climatic variability and lake management. Environ. Manag. 2010, 45, 105–112. [Google Scholar] [CrossRef]
  3. Sitoki, L.; Kurmayer, R.; Rott, E. Spatial variation of phytoplankton composition, biovolume, and resulting microcystin concentrations in the Nyanza Gulf (Lake Victoria, Kenya). Hydrobiologiz 2012, 691, 109–122. [Google Scholar] [CrossRef] [Green Version]
  4. Michalak, A.M.; Anderson, E.J.; Beletsky, D.; Boland, S.; Bosch, N.S.; Bridgeman, T.B.; Chaffin, J.D.; Cho, K.; Confesor, R.; Daloğlu, I.; et al. Record-setting algal bloom in Lake Erie caused by agricultural and meteorological trends consistent with expected future conditions. Proc. Natl. Acad. Sci. USA 2013, 110, 6448–6452. [Google Scholar] [CrossRef] [PubMed] [Green Version]
  5. Zafrir, E.; Carmeli, S. Micropeptins from an israeli fishpond water bloom of the cyanobacterium Microcystis sp. J. Nat. Prod. 2009, 73, 352–358. [Google Scholar] [CrossRef] [PubMed]
  6. Bowling, L.; Baker, P. Major cyanobacterial bloom in the Barwon-Darling River, Australia, in 1991, and underlying limnological conditions. Mar. Freshw. Res. 1996, 47, 643–657. [Google Scholar] [CrossRef]
  7. Falconer, I.R. Toxic cyanobacterial bloom problems in Australian waters: Risks and impacts on human health. Phycologia 2001, 40, 228–233. [Google Scholar] [CrossRef]
  8. Joehnk, K.D.; Huisman, J.; Sharples, J.; Sommeijer, B.; Visser, P.M.; Stroom, J.M. Summer heatwaves promote blooms of harmful cyanobacteria. Glob. Chang. Biol. 2008, 14, 495–512. [Google Scholar] [CrossRef] [Green Version]
  9. McElhiney, J.; Lawton, L.A. Detection of the cyanobacterial hepatotoxins microcystins. Toxicol. Appl. Pharmacol. 2005, 203, 219–230. [Google Scholar] [CrossRef]
  10. Pouria, S.; de Andrade, A.; Barbosa, J.; Cavalcanti, R.; Barreto, V.; Ward, C.; Preiser, W.; Poon, G.K.; Neild, G.; Codd, G. Fatal microcystin intoxication in haemodialysis unit in Caruaru, Brazil. Lancet 1998, 352, 21–26. [Google Scholar] [CrossRef]
  11. Brand, L.E.; Compton, A. Long-term increase in Karenia brevis abundance along the Southwest Florida Coast. Harmful Algae 2007, 6, 232–252. [Google Scholar] [CrossRef] [Green Version]
  12. Vargo, G.A.; Heil, C.A.; Fanning, K.A.; Dixon, L.K.; Neely, M.B.; Lester, K.; Ault, D.; Murasko, S.; Havens, J.; Walsh, J. Nutrient availability in support of Karenia brevis blooms on the central West Florida Shelf: What keeps Karenia blooming? Cont. Shelf Res. 2008, 28, 73–98. [Google Scholar] [CrossRef]
  13. Vargo, G.A. A brief summary of the physiology and ecology of Karenia brevis Davis (G. Hansen and Moestrup comb. nov.) red tides on the West Florida Shelf and of hypotheses posed for their initiation, growth, maintenance, and termination. Harmful Algae 2009, 8, 573–584. [Google Scholar] [CrossRef]
  14. Hoagland, P.; Jin, D.; Polansky, L.Y.; Kirkpatrick, B.; Kirkpatrick, G.; Fleming, L.E.; Reich, A.; Watkins, S.M.; Ullmann, S.G.; Backer, L.C. The costs of respiratory illnesses arising from Florida Gulf Coast Karenia brevis blooms. Environ. Health Perspect. 2009, 117, 1239–1243. [Google Scholar] [CrossRef] [PubMed] [Green Version]
  15. Trainer, V.L.; Moore, S.K.; Hallegraeff, G.; Kudela, R.M.; Clement, A.; Mardones, J.I.; Cochlan, W.P. Pelagic harmful algal blooms and climate change: Lessons from nature’s experiments with extremes. Harmful Algae 2019, 1–14. [Google Scholar] [CrossRef]
  16. Yang, Z.; Hodgkiss, I. Hong Kong’s worst “red tide”—Causative factors reflected in a phytoplankton study at Port Shelter station in 1998. Harmful Algae 2004, 3, 149–161. [Google Scholar] [CrossRef]
  17. Sengco, M.R.; Li, A.; Tugend, K.; Kulis, D.; Anderson, D.M. Removal of red-and brown-tide cells using clay flocculation. I. Laboratory culture experiments with Gymnodinium breve and Aureococcus anophagefferens. Mar. Ecol. Prog. Ser. 2001, 210, 41–53. [Google Scholar] [CrossRef]
  18. Ni, J.; Yu, Y.; Feng, W.; Yan, Q.; Pan, G.; Yang, B.; Zhang, X.; Li, X. Impacts of algal blooms removal by chitosan-modified soils on zooplankton community in Taihu Lake, China. J. Environ. Sci. 2010, 22, 1500–1507. [Google Scholar] [CrossRef]
  19. Wang, Z.; Li, D.; Qin, H.; Li, Y. An integrated method for removal of harmful cyanobacterial blooms in eutrophic lakes. Environ. Pollut. 2012, 160, 34–41. [Google Scholar] [CrossRef]
  20. Na, G.-H.; Choi, W.-J.; Chun, Y.-Y. A study on red tide control with loess suspension. J. Aquac. 1996, 9, 239–245. [Google Scholar]
  21. Song, Y.-C.; Sivakumar, S.; Woo, J.-H.; Ko, S.-J.; Hwang, E.-J.; Jo, Q. Removal of Cochlodinium polykrikoides by dredged sediment: A field study. Harmful Algae 2010, 9, 227–232. [Google Scholar] [CrossRef]
  22. Rajasekhar, P.; Fan, L.; Nguyen, T.; Roddick, F.A. Impact of sonication at 20 kHz on Microcystis aeruginosa, Anabaena circinalis and Chlorella sp. Water Res. 2012, 46, 1473–1481. [Google Scholar] [CrossRef]
  23. Tang, J.W.; Wu, Q.Y.; Hao, H.W.; Chen, Y.; Wu, M. Effect of 1.7 MHz ultrasound on a gas-vacuolate cyanobacterium and a gas-vacuole negative cyanobacterium. Colloids Surf. B Biointerfaces 2004, 36, 115–121. [Google Scholar] [CrossRef] [PubMed]
  24. Zhang, G.; Zhang, P.; Wang, B.; Liu, H. Ultrasonic frequency effects on the removal of Microcystis aeruginosa. Ultrason. Sonochem. 2006, 13, 446–450. [Google Scholar] [CrossRef] [PubMed]
  25. Molina Grima, E.; Belarbi, E.-H.; Acién Fernández, F.; Robles Medina, A.; Chisti, Y. Recovery of microalgal biomass and metabolites: Process options and economics. Biotechnol. Adv. 2003, 20, 491–515. [Google Scholar] [CrossRef]
  26. Tilton, R.; Murphy, J.; Dixon, J. The flocculation of algae with synthetic polymeric flocculants. Water Res. 1972, 6, 155–164. [Google Scholar] [CrossRef]
  27. Arrington, S.A.; Zeleznik, M.J.; Ott, D.W.; Ju, L.-K. Effects of polyethyleneimine on cyanobacterium Anabaena flos-aquae during cell flocculation and flotation. Enzym. Microb. Technol. 2003, 32, 290–293. [Google Scholar] [CrossRef]
  28. Drábková, M.; Admiraal, W.; Maršálek, B. Combined exposure to hydrogen peroxide and light selective effects on cyanobacteria, green algae, and diatoms. Emviron. Sci. Technol. 2007, 41, 309–314. [Google Scholar] [CrossRef]
  29. Burson, A.; Matthijs, H.C.; de Bruijne, W.; Talens, R.; Hoogenboom, R.; Gerssen, A.; Visser, P.M.; Stomp, M.; Steur, K.; van Scheppingen, Y.; et al. Termination of a toxic Alexandrium bloom with hydrogen peroxide. Harmful Algae 2014, 31, 125–135. [Google Scholar] [CrossRef]
  30. Matthijs, H.C.; Visser, P.M.; Reeze, B.; Meeuse, J.; Slot, P.C.; Wijn, G.; Talens, R.; Huisman, J. Selective suppression of harmful cyanobacteria in an entire lake with hydrogen peroxide. Water Res. 2012, 46, 1460–1472. [Google Scholar] [CrossRef]
  31. Vandamme, D.; Pontes, S.C.V.; Goiris, K.; Foubert, I.; Pinoy, L.J.J.; Muylaert, K. Evaluation of electro-coagulation–flocculation for harvesting marine and freshwater microalgae. Biotechnol. Bioeng. 2011, 108, 2320–2329. [Google Scholar] [CrossRef] [PubMed] [Green Version]
  32. Alfafara, C.G.; Nakano, K.; Nomura, N.; Igarashi, T.; Matsumura, M. Operating and scale-up factors for the electrolytic removal of algae from eutrophied lakewater. J. Chem. Technol. Biotechnol. 2002, 77, 871–876. [Google Scholar] [CrossRef]
  33. Azarian, G.; Mesdaghinia, A.; Vaezi, F.; Nabizadeh, R.; Nematollahi, D. Algae removal by electro-coagulation process, application for treatment of the effluent from an industrial wastewater treatment plant. Iran. J. Public Health 2007, 36, 57–64. [Google Scholar]
  34. Xu, L.; Wang, F.; Li, H.Z.; Hu, Z.M.; Guo, C.; Liu, C.Z. Development of an efficient electroflocculation technology integrated with dispersed-air flotation for harvesting microalgae. J. Chem. Technol. Biotechnol. 2010, 85, 1504–1507. [Google Scholar] [CrossRef]
  35. Boele, H.A. Separating Device and Method. U.S. Patent 8,511,475, 20 August 2013. [Google Scholar]
  36. Sinetova, M.A.; Červený, J.; Zavřel, T.; Nedbal, L. On the dynamics and constraints of batch culture growth of the cyanobacterium Cyanothece sp. ATCC 51142. J. Biotechnol. 2012, 162, 148–155. [Google Scholar] [CrossRef]
  37. Ritchie, R.J. Consistent sets of spectrophotometric chlorophyll equations for acetone, methanol and ethanol solvents. Photosynth. Res. 2006, 89, 27–41. [Google Scholar] [CrossRef]
  38. Wellburn, A.R. The spectral determination of chlorophylls a and b, as well as total carotenoids, using various solvents with spectrophotometers of different resolution. J. Plant Physiol. 1994, 144, 307–313. [Google Scholar] [CrossRef]
  39. Li, D.; Liu, C.-M.; Luo, R.; Sadakane, K.; Lam, T.-W. MEGAHIT: An ultra-fast single-node solution for large and complex metagenomics assembly via succinct de Bruijn graph. Bioinformatics 2015, 31, 1674–1676. [Google Scholar] [CrossRef] [PubMed] [Green Version]
  40. Zhu, W.; Lomsadze, A.; Borodovsky, M. Ab initio gene identification in metagenomic sequences. Nucleic Acids Res. 2010, 38, e132. [Google Scholar] [CrossRef] [Green Version]
  41. Li, W.; Jaroszewski, L.; Godzik, A. Clustering of highly homologous sequences to reduce the size of large protein databases. Bioinformatics 2001, 17, 282–283. [Google Scholar] [CrossRef] [PubMed]
  42. Gu, S.; Fang, L.; Xu, X. Using SOAPaligner for short reads alignment. Curr. Protoc. Bioinform. 2013, 44, 11.11.1–11.11.17. [Google Scholar] [CrossRef] [PubMed]
  43. Buchfink, B.; Xie, C.; Huson, D.H. Fast and sensitive protein alignment using DIAMOND. Nat. Methods 2015, 12, 59–60. [Google Scholar] [CrossRef] [PubMed]
  44. Huson, D.H.; Mitra, S.; Ruscheweyh, H.-J.; Weber, N.; Schuster, S.C. Integrative analysis of environmental sequences using MEGAN4. Genome Res. 2011, 21, 1552–1560. [Google Scholar] [CrossRef] [Green Version]
  45. Ondov, B.D.; Bergman, N.H.; Phillippy, A.M. Interactive metagenomic visualization in a Web browser. BMC Bioinform. 2011, 12, 385. [Google Scholar] [CrossRef] [PubMed] [Green Version]
  46. Barlow, R.; Mantoura, R.; Gough, M.; Fileman, T. Pigment signatures of the phytoplankton composition in the northeastern Atlantic during the 1990 spring bloom. Deep Sea Res. Part II Top. Stud. Oceanogr. 1993, 40, 459–477. [Google Scholar] [CrossRef]
  47. Letelier, R.M.; Bidigare, R.R.; Hebel, D.V.; Ondrusek, M.; Winn, C.; Karl, D.M. Temporal variability of phytoplankton community structure based on pigment analysis. Limnol. Oceanogr. 1993, 38, 1420–1437. [Google Scholar] [CrossRef]
  48. Tan, B.F.; Te, S.H.; Gin, K.Y.-H.; Thompson, J.R. Draft genome sequence of a tropical freshwater cyanobacterium, Limnothrix sp. Strain P13C2. Genome Announc. 2016, 4, e01117-16. [Google Scholar] [CrossRef] [PubMed] [Green Version]
  49. Qiu, Y.-L.; Kuang, X.-Z.; Shi, X.-S.; Yuan, X.-Z.; Guo, R.-B. Terrimicrobium sacchariphilum gen. nov., sp. nov., an anaerobic bacterium of the class ‘Spartobacteria’in the phylum Verrucomicrobia, isolated from a rice paddy field. Int. J. Syst. Evol. Microbiol. 2014, 64, 1718–1723. [Google Scholar] [CrossRef]
  50. Butler, M.K.; Wang, J.; Webb, R.I.; Fuerst, J.A. Molecular and ultrastructural confirmation of classification of ATCC 35122 as a strain of Pirellula staleyi. Int. J. Syst. Evol. Microbiol. 2002, 52, 1663–1667. [Google Scholar]
  51. Clark, D.A.; Norris, P.R. Acidimicrobium ferrooxidans gen. nov., sp. nov.: Mixed-culture ferrous iron oxidation with Sulfobacillus species. Microbiology 1996, 142, 785–790. [Google Scholar] [CrossRef] [Green Version]
  52. Mohr, K.I.; Garcia, R.O.; Gerth, K.; Irschik, H.; Müller, R. Sandaracinus amylolyticus gen. nov., sp. nov., a starch-degrading soil myxobacterium, and description of Sandaracinaceae fam. nov. Int. J. Syst. Evol. Microbiol. 2012, 62, 1191–1198. [Google Scholar] [CrossRef] [PubMed] [Green Version]
  53. Sekiguchi, Y.; Yamada, T.; Hanada, S.; Ohashi, A.; Harada, H.; Kamagata, Y. Anaerolinea thermophila gen. nov., sp. nov. and Caldilinea aerophila gen. nov., sp. nov., novel filamentous thermophiles that represent a previously uncultured lineage of the domain Bacteria at the subphylum level. Int. J. Syst. Evol. Microbiol. 2003, 53, 1843–1851. [Google Scholar] [CrossRef] [PubMed]
  54. Christenson, L.; Sims, R. Production and harvesting of microalgae for wastewater treatment, biofuels, and bioproducts. Biotechnol. Adv. 2011, 29, 686–702. [Google Scholar] [CrossRef] [PubMed]
  55. de Souza Schneider, R.d.C.; de Moura Lima, M.; Hoeltz, M.; de Farias Neves, F.; John, D.K.; de Azevedo, A. Life cycle assessment of microalgae production in a raceway pond with alternative culture media. Algal Res. 2018, 32, 280–292. [Google Scholar] [CrossRef]
  56. Posten, C.; Walter, C. (Eds.) Case Study: Spiral plate technology for totally dewatering algae alive. In Microalgal Biotechnology: Potential and Production; Walter de Gruyter: Berlin, Germany, 2012; pp. 253–258. [Google Scholar]
  57. Chapman, D.V.; World Health Organization; UNESCO; UN Environment Programme London. Water Quality Assessments: A Guide to the Use of Biota, Sediments and Water in Environmental Monitoring, 2nd ed.; Chapman, D.V., Ed.; E & FN Spon: New York, NY, USA, 1996. [Google Scholar]
  58. Demirbas, M.F. Biofuels from algae for sustainable development. Appl. Energy 2011, 88, 3473–3480. [Google Scholar] [CrossRef]
  59. Mourelle, M.L.; Gómez, C.P.; Legido, J.L. The potential use of marine microalgae and cyanobacteria in cosmetics and thalassotherapy. Cosmetics 2017, 4, 46. [Google Scholar] [CrossRef] [Green Version]
  60. Molino, A.; Iovine, A.; Casella, P.; Mehariya, S.; Chianese, S.; Cerbone, A.; Rimauro, J.; Musmarra, D. Microalgae characterization for consolidated and new application in human food, animal feed and nutraceuticals. Int. J. Environ. Res. Public Health 2018, 15, 2436. [Google Scholar] [CrossRef] [PubMed] [Green Version]
  61. Austic, R.E.; Mustafa, A.; Jung, B.; Gatrell, S.; Lei, X.G. Potential and limitation of a new defatted diatom microalgal biomass in replacing soybean meal and corn in diets for broiler chickens. J. Agric. Food Chem. 2013, 61, 7341–7348. [Google Scholar] [CrossRef]
  62. Duong, V.T.; Ahmed, F.; Thomas-Hall, S.R.; Quigley, S.; Nowak, E.; Schenk, P.M. High protein-and high lipid-producing microalgae from northern Australia as potential feedstock for animal feed and biodiesel. Front. Bioeng. Biotechnol. 2015, 3, 53. [Google Scholar] [CrossRef] [PubMed] [Green Version]
  63. Zhou, W.; Hu, B.; Li, Y.; Min, M.; Mohr, M.; Du, Z.; Chen, P.; Ruan, R. Mass cultivation of microalgae on animal wastewater: A sequential two-stage cultivation process for energy crop and omega-3-rich animal feed production. Appl. Biochem. Biotechnol. 2012, 168, 348–363. [Google Scholar] [CrossRef]
  64. Rodolfi, L.; Chini Zittelli, G.; Bassi, N.; Padovani, G.; Biondi, N.; Bonini, G.; Tredici, M.R. Microalgae for oil: Strain selection, induction of lipid synthesis and outdoor mass cultivation in a low-cost photobioreactor. Biotechnol. Bioeng. 2009, 102, 100–112. [Google Scholar] [CrossRef]
  65. Tredici, M.; Carlozzi, P.; Zittelli, G.C.; Materassi, R. A vertical alveolar panel (VAP) for outdoor mass cultivation of microalgae and cyanobacteria. Bioresour. Technol. 1991, 38, 153–159. [Google Scholar] [CrossRef]
  66. Guo, X.; Yao, L.; Huang, Q. Aeration and mass transfer optimization in a rectangular airlift loop photobioreactor for the production of microalgae. Bioresour. Technol. 2015, 190, 189–195. [Google Scholar] [CrossRef]
  67. Gobler, C.J. Climate change and harmful algal blooms: Insights and perspective. Harmful Algae 2020, 91, 101731. [Google Scholar] [CrossRef] [PubMed]
  68. Wells, M.L.; Trainer, V.L.; Smayda, T.J.; Karlson, B.S.; Trick, C.G.; Kudela, R.M.; Ishikawa, A.; Bernard, S.; Wulff, A.; Anderson, D.M. Harmful algal blooms and climate change: Learning from the past and present to forecast the future. Harmful Algae 2015, 49, 68–93. [Google Scholar] [CrossRef] [PubMed] [Green Version]
  69. Visser, P.M.; Verspagen, J.M.; Sandrini, G.; Stal, L.J.; Matthijs, H.C.; Davis, T.W.; Paerl, H.W.; Huisman, J. How rising CO2 and global warming may stimulate harmful cyanobacterial blooms. Harmful Algae 2016, 54, 145–159. [Google Scholar] [CrossRef] [PubMed] [Green Version]
Figure 1. (A,B). A cyanoHAB occurred in a certain embayment region of the Plover Cove Reservoir of Hong Kong.
Phycology 02 00004 g001
Figure 2. Interior design of our algae cleaning system.
Phycology 02 00004 g002
Figure 3. Two layers of 96 spiral blades were constructed along a central shaft for rotation during the centrifugation process. With a centrifugal force of up to 4500× g, the curved blades allow a short 5–7 mm settling distances of the microalgae to the blades, which eventually accumulated on the wall of the centrifuge (not shown in this Figure). Because of copyright issues, the readers are referred to the website of Evodos (https://www.evodos.eu/technology/, accessed on 12 December 2021) to obtain detailed information of the spiral blade technology.
Phycology 02 00004 g003
Figure 4. This Figure diagrammatically shows that through the 96 spiral blades arranged in a tight circle, the microalgae in the algae-laden water have a short settling distance and, hence, they were quickly collected (Courtesy of Evodos Dynamic Settlers, The Netherlands).
Phycology 02 00004 g004
Figure 5. Picture from Google Map showing location of the water pumping station in the Plover Cove Reservoir where the HCHT centrifuge was deployed.
Phycology 02 00004 g005
Figure 6. The deployed algae cleaning system on the location of operation. It can be easily hoisted to other locations by an appropriate container truck with associated crane facilities.
Phycology 02 00004 g006
Figure 7. (A) Cyanobacterial biomass collected from the inlet water that were unloaded into a drawer in the bottom of the centrifuge after the harvesting steps. (B) Some wet biomass collected after an operation on 13 July 2017.
Phycology 02 00004 g007
Figure 8. (A) Dried biomass collected on a 4-h operation, (B) chlorophyll a concentration and (C) carotenoid concentration in the inlet water (Inlet) and effluent water (Effluent) from July to October 2017. The three arrows indicated the occurrence of the three typhoons in Hong Kong.
Phycology 02 00004 g008
Figure 9. Clustered bar chart showing the community ratio of major microbial species collected from raw inlet water after 0.2 µm membrane filtration (inlet), from effluent water after a 5 µm membrane filtration (eff50) and followed by another 0.2 µm membrane filtration (eff02).
Phycology 02 00004 g009
Figure 10. (A) The pH of inlet water (pH(inlet)) and effluent water samples (pH(effluent)), water temperature of inlet water (on the right axis). (B) COD of inlet water (Inlet) and effluent water (Effluent).
Phycology 02 00004 g010
Figure 11. Overview satellite image of the pumping station where the HCHT centrifuge was deployed. The area of each red box on the Figure is 400 m2.
Phycology 02 00004 g011
Table 1. List of the three typhoons that hit Hong Kong during July–August 2017. * Hato is the second strongest typhoons that hit Hong Kong in the past 50 years.
Name of TyphoonDate That Hit Hong KongMax. Sustained Winds Speed (km/h)Max. Gusts Speed (km/h)
T1707 Roke23 July 20174473
T1713 Hato *23 August 2017185240
T1714 Pakhar27 August 201790150
Publisher’s Note: MDPI stays neutral with regard to jurisdictional claims in published maps and institutional affiliations.

