Simple Summary
Quantifying the economic implications of different reproductive management strategies, including various lambing intervals, requires robust analytical tools capable of accounting for stochasticity and individual variability. A stochastic simulation model was developed to determine the economic impact of two lambing intervals in Lacaune ewes in Greece. Decreasing the lambing interval decreased milk production and income over feed cost per lactation. However, due to increased lambing frequency, milk production and income over feed cost per year were increased.
Abstract
The objective of this study was to develop a stochastic simulation model to evaluate the impact of accelerated lambing on income over feed cost (IOFC) in Lacaune ewes managed under an intensive production system in Greece. The economic comparison of two lambing intervals (LI) was performed by varying the voluntary waiting period to allow for an 8-month LI (3 lambings in 2 years) versus a 12-month LI (1 lambing per year). Milk production per year was greater (p < 0.01) for the 8-month compared to the 12-month LI (777.4 ± 2.8 kg vs. 661.9 ± 2.1 kg, respectively), and the income from the sale of milk was greater for the 8-month compared to the 12-month LI (EUR 1166.0 ± 4.1 vs. EUR 992.9 ± 3.1, respectively). Feed cost per year was greater for the 8-month compared to the 12-month LI (EUR 255.9 ± 0.5 vs. EUR 227.8 ± 0.5, respectively). Therefore, IOFC per year was greater for the 8-month compared to the 12-month LI (EUR 989.4 ± 3.2 vs. EUR 817.1 ± 2.1, respectively). The cost per additional day open in the 12-month LI was estimated at EUR 1.08 ± 0.06 and demonstrates the importance of reproductive performance in the profitability of dairy sheep production. Therefore, reproductive management strategies that result in reduced LI are expected to increase IOFC in Lacaune dairy ewes. Future research is needed to develop practical strategies to successfully reduce the lambing interval in Lacaune ewes.
1. Introduction
Reproductive efficiency of dairy sheep is a key determinant of flock profitability because it dictates milk yield, replacement rate, and lamb production [1,2]. One important parameter is lambing interval (LI), the period between two successive lambings, which affects both the biological and economic performance of the flock.
One of the most popular and productive dairy sheep breeds is the French Lacaune breed. Its popularity stems from its genetic potential for high milk yield with high fat and protein content as well as its adaptability to various farming systems [3]. In Greece, most intensive dairy sheep farms raise purebred animals of Lacaune breed or their crosses with local breeds. It is estimated that those animals represent up to 50% of dairy ewes in the national flock, supporting numerous farms and rural economy, especially the cheese making industry. The objective of reproduction management in most dairy sheep farms in Greece is having one lambing per year. However, several studies have suggested that reducing the LI can increase the productivity and profitability of dairy sheep farms [4,5]. Shorter LI have been associated with increased lifetime productivity and improved economic returns in intensively managed dairy sheep systems [5,6,7]. However, frequent lambing may also lead to decreased reproductive efficiency, increased health costs, and greater management complexity [8,9], requiring a careful balance between the genetic potential of animals and economic feasibility.
Quantifying the economic implications of different reproductive management strategies, including various LI, requires robust analytical tools capable of accounting for stochasticity and individual variability. Because farm production systems are highly dynamic with market conditions changing constantly, economic predictions of management practices are better determined by computer simulation. In this regard, stochastic simulation models offer a powerful framework to evaluate the economic impact of complex management decisions under uncertainty [10,11]. Markov chain models with Monte Carlo simulation techniques have been extensively applied in livestock production systems, particularly in dairy cows, to simulate reproductive events and economic outcomes based on probabilistic transitions and prior biological knowledge [12,13,14]. These models allow for the integration of multiple sources of variability, including seasonality, parity, milk production potential, nutrition, disease incidence, which are essential for accurately projecting herd-level outcomes [15,16].
Despite the potential of Markov chain models with Monte Carlo simulation techniques in modeling reproductive dynamics, its application to dairy sheep production has not been performed. Existing studies in sheep production have focused on deterministic models, often lacking the flexibility to capture the full range of reproductive and economic variability [2,17,18]. Therefore, the objective of the present study was to develop a Markov chain model with Monte Carlo simulation to evaluate the economic impact of accelerated LI (8-month vs. 12-month) in dairy sheep, integrating individual animal variability, and milk production data. By doing so, we aim to provide evidence-based recommendations for consultants and farmers for optimizing reproductive management strategies in dairy sheep flocks.
2. Materials and Methods
A flock with 1000 milking ewes was simulated in Excel for Windows (version 2018, Microsoft, Redmond, WA, USA) through monthly Markov chains following the states of after lambing, month in pregnancy, using predefined transition probabilities regarding reproduction and culling. First, the Markov chain model was run until it reached a steady state [10] assuming that all ewes followed the same 12-month LI. At that time, the transition probabilities for reproductive performance were defined as part of the objective of the present study. Animals in the 8-month LI became eligible for insemination and mating at 80 days after lambing and animals in the 12-month LI became eligible for insemination and mating at 205 days after lambing. Reproductive events continued until the ewe became pregnant or missed the opportunity to become pregnant (approximately 4 estrous cycles).
The structure of the flock was defined by transition probabilities of culling due to non-reproductive reasons, death, and reproductive performance. To incorporate uncertainty, the stochastic simulation accounted for differences in income over feed cost (IOFC) and income over feed and replacement cost (IOFRC) between ewes in the two LI management systems under varying conditions for the most relevant inputs (Table 1).

Table 1.
Input parameters used to determine the economic impact of lambing interval (8-month vs. 12-month) of Lacaune ewes by stochastic simulation.
Stochasticity was incorporated into the milk production and associated feed cost, ewes culled and replaced, reproductive performance, and lambs born alive. A total of 5000 iterations were performed and for each iteration, milk production and milk sales, lambs sold, ewes culled and replaced, feed cost, days open, lambing interval, lactation length, IOFC and IOFRC, and the cost of days open were determined.
2.1. Simulation Variables and Prices
All prices used were in effect in the market during the time period of 2024/2025 in which this study was performed. These prices can be changed based on different market conditions.
2.1.1. Milk Production and Milk Sales
Monthly milk production records from 700 ewes housed in 3 commercial farms near Thessaloniki, Greece, were used to model farm-observed lactation curves. These 3 commercial flocks were selected because of their convenient proximity and the accuracy of lambing dates and milk production data. Ewes were managed under an intensive production system, in confined barns bedded with straw and milked twice daily. Once a month, the daily milk production was recorded as part of the genetic selection and breeding program of the farms. The Milkbot model was used to predict milk production based on 4 parameters: scale, ramp, offset, and decay [19], which were considered specific for each parity (primiparous and multiparous ewes). The parameter scale is a multiplier that determines the total amount of milk yield and is expressed in L/d, and must be a positive number; parameter ramp controls the rate of increase in milk production in early lactation and is expressed in days; parameter offset represents the offset in time between parturition and the time when the highest rate of increase in milk production occurs, and is expressed in days; finally, parameter decay controls the loss of productive capacity and is expressed as day−1. The parameter estimates for lactation follow its own normal distribution with a mean and standard variation. The lactation curve parameters were subsequently randomly assigned to each ewe at the beginning of each lactation based on the distribution of these parameters. Each ewe retained its assigned parameters until the end of its current lactation and was assigned a new and independent set of parameters after entering a new lactation. Therefore, each ewe within the same parity group in a single simulation had a different lactation parameter [15,16]. Price of milk was 1.5 EUR/L, and the income from the sales of milk was obtained by multiplying the price of milk with milk production.
2.1.2. Feeding
Standard feeding rations were elaborated for production, maintenance, and reproduction following the guidelines of the INRA [20] and the cost of feeding was determined as previously described [18]. The prices of the various feedstuffs used were in effect in the market during the time period of 2024/2025 in which this study was performed. We assumed primiparous and multiparous ewes weighed 70 kg and 80 kg, respectively, based on records from the 3 commercial flocks. For each production and maintenance level, the daily amount of net energy, measured in forage units for lactation (UFL; 1700 kcal) was calculated. The price per UFL was calculated as the total expense in feedstuff divided by the UFL concentration of the ration. This procedure provided different costs per UFL for lactating and non-lactating dry ewes. Each unit of UFL for lactating and non-lactating dry ewes was EUR 0.27 and EUR 0.26, respectively.
2.1.3. Lamb Value, Ewe Lamb Replacement Value, and Culled Ewe Value
For simplicity of the model, it was assumed that all lambs were sold as a day-old at EUR 15/lamb (3 kg body weight at EUR 5/kg). Replacement pregnant ewe-lambs were purchased, when necessary, at the value of EUR 350/female. Culled ewe, when sold for meat production, were assumed to have a sale value EUR 160/female. These prices were in effect in the market during the time period of 2024/2025 in which this study was performed.
2.1.4. Reproductive Program
The reproductive management program initiated with all females being inseminated on the first day of the breeding period and a 50% conception rate was achieved [21]. Following the first AI, ewes were moved into pens with rams for a period of 50 days (approximately 3 estrous cycles), thus, allowing for 4 opportunities of mating and conception. For each estrous cycle a 50% conception rate was assumed. Although the current scenarios considered the reproductive performance to be similar between the two groups, the flexibility was built in the model to account for different reproductive performance between groups and between parities.
2.1.5. Income over Feed Cost
The IOFC for each ewe was calculated by subtracting the cost of feeding from the sales of milk, lambs, and culled ewes.
2.1.6. Income over Feed and Replacement Cost
The IOFRC was calculated by subtracting the cost of feeding and the replacement cost from the sales of milk, lambs, and culled ewes.
2.1.7. Cost per Day Open
The cost of each additional day open was calculated by dividing the difference in IOFRC by the difference in days open between the 2 groups.
2.2. Statistical Analysis
Continuous variables such as milk production (kg per lactation and per year), milk sales, feed cost, lamb sales, and IOFC were analyzed by ANOVA using the MIXED procedure of SAS (version 9.4 for Windows, SAS Institute Inc., Cary, NC, USA). Iteration was the experimental units used in the statistical analysis. Parameters of the lactation curve for primiparous and multiparous ewes were obtained using the NLMIXED procedure of SAS fitting the Milkbot model [19] and including ewe within flock as random effect [22]. Significance was determined when p < 0.05 and data are presented as Means ± SD.
3. Results
A random sample of 20 lactation curves for primiparous and multiparous ewes is presented in Figure 1 (Panel A and B, respectively).
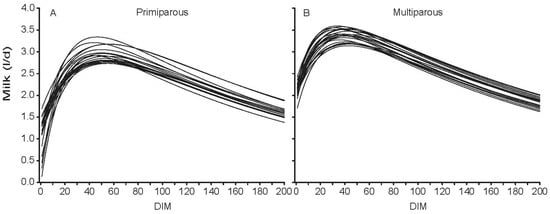
Figure 1.
Predicted lactation curves for 20 primiparous (panel (A)) and 20 multiparous (panel (B)) Lacaune ewes. Monthly milk production records from 700 ewes housed in 3 commercial farms near Thessaloniki, Greece, were used to fit and model farm-observed lactation curves. Parameter estimates (mean ± SD) were obtained by fitting the Milkbot model. DIM—days in milk after lambing.
In addition, the 4 parameter estimates and respective standard deviation of the lactation curve for the Milkbot model for primiparous and multiparous ewes are presented in Table 2. The average milk production between 1 and 50 DIM, 51 and 100 DIM, 101 and 150 DIM, and 151 and 200 DIM was 2.44 L/d, 2.77 L/d, 2.30 L/d, and 1.82 L/d for primiparous ewes and 3.12 L/d, 3.13 L/d, 2.57 L/d, and 2.07 L/d for multiparous ewes. Milk production in the first 150 DIM averaged 2.50 and 2.94 L/day for primiparous and multiparous ewes, respectively. In addition, total milk production in the first 150 DIM was 375.1 L and 441.0 L for primiparous and multiparous ewes, respectively. The average DIM at peak was 53 and 40 for primiparous and multiparous ewes, respectively. Furthermore, average milk production at peak was 2.89 L/d and 3.40 L/d for primiparous and multiparous ewes, respectively.
Table 2.
Parameter estimates (mean ± SD) of the lactation curve of Lacaune ewes 1.
Total milk production per lactation and per year is reported in Table 3. When production was evaluated for the lactation, milk production was less (p < 0.01) for the 8-month LI compared to the 12-month LI (Table 3). However, when production was evaluated on an annual basis, total milk production was more (p < 0.01) for the 8-month LI compared to the 12-month LI. These results were expected because, by design, the 8-month LI group have fewer milking days per lactation; however, this group has more lambings per year, more peaks of milk production, and consequently more time in early lactation when milk production is higher. The average number of lambs born per year was greater for the 8-month LI compared to the 12-month LI (Table 3).
Table 3.
Revenue, expenses, income over feed cost (IOFC), and income over feed and replacement cost (IOFRC) per lactation, and per year, for Lacaune ewes submitted to a reproductive management program to target 8-month lambing interval (LI) or 12-month LI by varying the voluntary waiting period.
The annual milk sales were greater for the 8-month LI compared to the 12-month LI (Table 3). These are a direct reflection of the total annual milk production multiplied by the milk price. In addition, the total feed cost was also greater for the 8-month LI compared to the 12-month LI (Table 3).
The percentage of ewes culled per lactation did not differ between groups; however, the percentage of ewes culled annually was greater for the 8-month LI compared to the 12-month LI (Table 3). Therefore, the replacement cost followed a similar pattern and was greater for the 8-month LI compared to the 12-month LI on an annual basis (Table 3).
Although the IOFC and IOFRC per ewe were less when evaluated per lactation, both were greater for the 8-month LI compared to the 12-month LI when the evaluation was performed on an annual basis (Table 3). The mean difference in IOFC between ewes in the 8-month LI and those in the 12-month LI was EUR 135.2, with 95% of the scenarios between EUR 119.2 and EUR 151.1 (Figure 2, panel A). The minimum and maximum values of difference in IOFC between ewes in the 8-month LI and those in the 12-month LI was EUR 108.1 and EUR 164.8 (Figure 2, panel A). The mean cost per additional day open in the 12-month LI was EUR 1.08, with 95% of the scenarios between EUR 0.95 and EUR 1.21 (Figure 2, panel B). The minimum and maximum values per each additional day open was EUR 0.86 and EUR 1.33 (Figure 2, panel B).
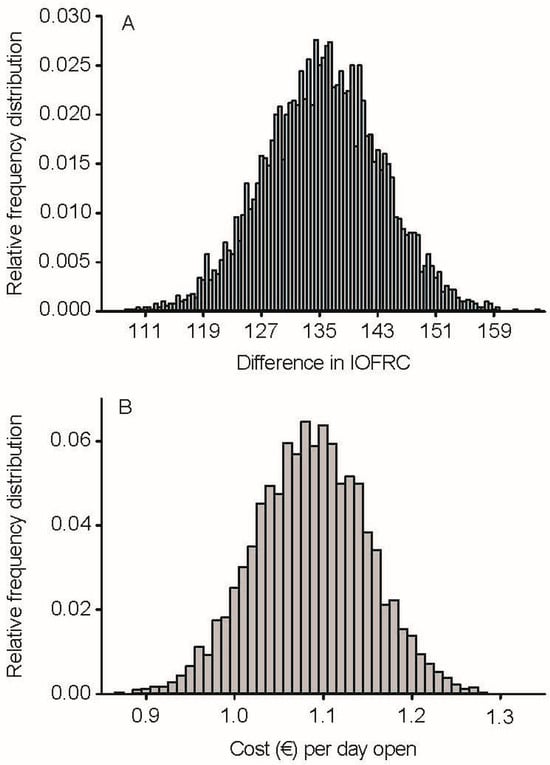
Figure 2.
Relative frequency distribution for difference in income over feed and replacement cost (IOFRC, panel (A)) and cost per additional day open (panel (B)) for Lacaune ewes submitted to a reproductive management program to target 8-month lambing interval (LI) or 12-month LI by varying the voluntary waiting period. IOFRC—income over feed and replacement cost. The IOFRC was calculated by subtracting the cost of feeding and the replacement cost from the sales of milk, lambs, and culled ewes. The cost of each additional day open was calculated by dividing the difference in IOFRC by the difference in days open between the 2 groups. Stochastic simulations were run and recorded for 5000 iterations. Monthly milk production records from 700 ewes housed in 3 commercial farms near Thessaloniki, Greece, were used to fit and model farm-observed lactation curves. Parameter estimates (mean ± SD) were obtained by fitting the Milkbot model. Nutritional requirements were determined following the guidelines of the INRA [20]. All prices used were in effect in the market during the time period of 2024/2025 in which this study was performed.
The differences in LI, lactation length, and days open for each group are presented in Table 4, and were all less for the 8-month LI group than for the 12-month LI group. Because the same fertility (50% per estrous cycle) was assumed for the 2 groups, the differences in the LI, lactation length, and days open between the 2 groups are due to differences in voluntary waiting period (80 vs. 205 days for the 8-month and 12-month LI groups, respectively, Table 1).
Table 4.
Lambing interval, lactation length, and days open for Lacaune ewes submitted to a reproductive management program to target 8-month lambing interval (LI) or 12-month LI by varying the voluntary waiting period.
Figure 3 shows the milk sales and feed cost per day for an ewe sampled from the 8-month LI group (panel A) and an ewe sampled from the 12-month LI group (panel B). These ewes were chosen based on their productive life of 731 days in the flock after the first lambing. Lifetime milk sales and lifetime feed cost after the first lambing were EUR 2319 and EUR 499 for the ewe in the 8-month LI, and EUR 1799 and EUR 410 for the ewe in the 12-month LI.
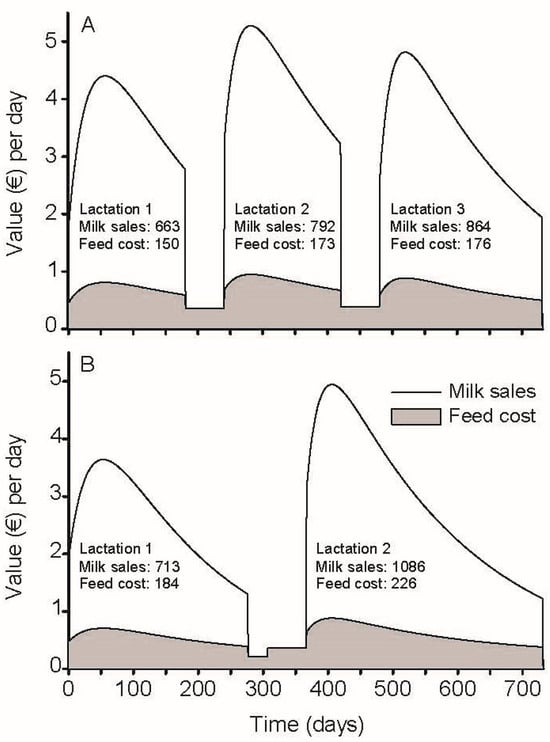
Figure 3.
Milk sales and feed cost for one ewe in the group of 8-month lambing interval (LI, panel (A)) and one ewe in the 12-month LI (panel (B)). Ewes were chosen based on the same productive life of 731 days after first lambing. Monthly milk production records from 700 ewes housed in 3 commercial farms near Thessaloniki, Greece, were used to fit and model farm-observed lactation curves. Parameter estimates (mean ± SD) were obtained by fitting the Milkbot model. Nutritional requirements were determined following the guidelines of the INRA [20]. All prices used were in effect in the market during the time period of 2024/2025 in which this study was performed.
4. Discussion
The present study evaluated the economic impact of accelerated lambing in intensively reared Lacaune dairy ewes using a Markov Chain model with Monte Carlo simulation. Stochastic simulation of management and reproductive strategies has been extensively used in dairy cattle but not in dairy sheep. In the present study, we aimed to evaluate the impact of two lambing intervals. Further research is needed to evaluate how the different management practices and their impact on reproductive performance affect the economic outcome. For instance, cervical vs. laparoscopic insemination yield different reproductive performances and have different costs; therefore, their economic impact might also differ. It should also be noted that ewes are seasonally polyestrous, and the implementation of breeding periods around the year to allow the 8 month-LI could be challenging.
Dairy cattle farms have extensively adopted precision management assisted with the use of computer software and large volumes of data are accurately collected daily. This contrasts with dairy sheep flocks where the use of computer software and accurate data collection is limited. We used milk production records from 3 intensive flocks with accurate lambing dates and milk production recorded on a monthly basis to derive lactation curves. A key finding of the present analysis is that, although decreasing the LI decreased milk production per lactation, it increased total milk production per year as well as IOFC and IOFRC. These results are of importance to veterinarians and nutritionists providing support to dairy sheep farmers, and to dairy sheep farmers to increase profitability of the dairy flocks.
Three elements were deliberately excluded from the model as they were considered the same for both groups and did not affect the main outcome of the study, the IOFC. The three variables were as follows: cost of hormonal synchronization, cost of semen, and cost of labor. Dairy sheep flocks are labor-intensive operations and labor cost can, in addition to feed cost, represent a significant portion of the total operation cost [23,24]. In addition, using artificial insemination is an important factor for the success of the genetic improvement program for sheep milk production [25], a long term investment with positive economic returns [17], and extensively adopted by sheep farmers in Greece milking Lacaune ewes [21]. Nonetheless, most Lacaune ewes in Greece are managed with the objective of 1 lambing per year with an approximately 9-month lactation and 3-month dry period. However, improving reproductive performance to reduce the LI by reducing the number of days open and reducing the dry period optimizes economic outcomes in intensive dairy sheep farms [4].
The main source of income for dairy sheep farms is the sale of milk [23,24,26] which are directly affected by the total milk available for sale and the price of milk. It is well established in the literature that animals in the second and greater lactation produce more milk and have higher milk peak production compared to animals in their first lactation [27] and the milk production decreases after reaching the peak as lactation progresses [3,28]. For instance, Morrissey et al. [29] reported that East Friesian crossbred multiparous ewes produced 24.4 more liters of milk in the first 120 days of lactation compared to primiparous ewes (107.1 vs. 82.4 L, respectively). Furthermore, multiparous Lacaune ewes milked twice a day after weaning the lambs produced 1.58 kg/day compared to 1.25 kg/day in primiparous ewes [30]. Gootwine and Pollott [31], analyzing the production of Awassi ewes, also reported an average of 3.44 L/d at peak and a maximum of 3.9 L/d. In addition, in a study by Hassoun et al. [3], multiparous Lacaune ewes produced 3.24 L/d at approximately 40 DIM, and in a study by Elhadi et al. [32], multiparous Lacaune ewes milked after a 28 d suckling period also produced 3.24 L/d at approximately 37 DIM. In a recent large study in Greece and France with Lacaune ewes milked after 35–55 d of suckling period, milk production was 330–363 kg in approximately 169 d of milking period 1.95 to 2.14kg/d [33]. Therefore, the predicted milk production obtained in the present study is in range with the values previously reported for high-producing Lacaune ewes. In addition, the milk production records used in the present study were obtained from flocks with established genetic breeding programs aimed at increasing milk production and using artificial insemination with semen from proven Lacaune rams. Moreover, lambs were not allowed to suckle, and ewes were milked immediately after lambing. Therefore, differences in milk production among studies may reflect differences among breeds, different genetic selection and breeding programs, as well as different management, housing, and feeding systems [17,18,21,33]. Furthermore, the stochastic model developed in the present study is flexible and allows for the incorporation of different lactation curves and feeding regimes, which could accommodate the economic simulation of different breeds and production systems.
The results of an increased number of lambs and milk production in ewes under accelerated lambing are in agreement with previous studies comparing accelerated lambing with traditional lambing once a year. Chios ewes managed for accelerated lambing had more lambs weaned (4.54 vs. 3.26), and produced more milk per day (1.12 vs. 1.08 L/day) than Chios ewes managed for lambing once a year [9]. In addition, Churra ewes managed for accelerated lambing also produced more milk per day of productive life (0.53 vs. 0.51 L/day), and produced more lambs (7.3 vs. 5.7) which resulted in more revenue from total sales of milk and lambs (789 vs. 652) compared to Churra ewes managed for once a year lambing [5]. Similarly, the study by Hidalgo-González et al. [4] also reported that decreasing the LI in Assaf ewes for less than 300 days can improve milk production and number of lambs sold.
Feed cost is a major cost in intensive dairy sheep production. We used a methodology similar to the study by Legarra et al. [18] to determine energy requirement and respective feed cost for dry and milking animals. Although, for pastoral sheep farms, feed cost does not exceed 40% of all expenses [23], under intensive management feed cost can represent between 56 and 67% of the total cost of production [2,24]. In addition, the estimated annual feed cost in the present study is within the range of EUR 225-EUR 288 per ewe recently reported in Greece [2]. Dairy ewes are normally housed in large groups and fed ad libitum with concentrate supplementation in the milking parlor, and 2–3% of feed refusal might be discarded. Therefore, it is possible that the methodology used in the present study to estimate daily feed cost may slightly underestimate the real feed cost observed in dairy flocks. The knowledge of the real feed cost depending on the location of the flock and the respective production system is of extreme importance for the extrapolation of the proposed model to other breeds and production systems. Nonetheless, the use of automatic feeding systems is increasing, therefore allowing for precision feeding based on the energy and protein requirements of individual animals for maintenance, production and reproduction.
In the present study, it was assumed that similar reproductive performance would be achieved in both groups. Reproductive performance in milking ewes is likely affected by several factors, with reduced fertility associated with high milk production [1,34], nutritional status of the ewes [35,36], and lambing to insemination interval [37,38]. Nonetheless, using an 8-month LI allowing for 3 lambings in 2 years is achievable. For instance, Hidalgo-González et al. [4] evaluated the performance of 2474 lambings in Assaf ewes and the average LI was 248.8 (8.3 months) with an average dry period of 59 days, and a LI less than 300 days optimized the performance of the ewes. Furthermore, Anel et al. [38] evaluated 44,448 inseminations performed over an 8-year period in 31 farms milking Churra ewes aiming at 3 lambings in 2 years and achieving 1.34 lambings per ewe per year. Although fertility varied among participating farms, year and season, the greatest impact on fertility was the type of insemination, with ewes receiving laparoscopic insemination having greater fertility than ewes receiving cervical insemination. Nonetheless, ewes inseminated before 10 weeks (70 days) after lambing had reduced fertility compared with ewes receiving insemination after 10 weeks after lambing. However, ewes inseminated between 10 and 22 weeks (70 to 154 days) after lambing had similar fertility compared to ewes inseminated after 22 weeks (154 days) after lambing [38]. In contrast, Pineda-Quiroga et al. [39] evaluated 135,351 AI records in Latxa ewes and reported greater fertility when the ewes were inseminated after 150 days after lambing (44%) compared to ewes inseminated between 90 and 150 days after lambing (38%). Therefore, reproductive and nutrition management programs to effectively and consistently return acceptable fertility results independent of the season and lambing to AI interval to allow for the successful implementation of an 8-month LI in high-producing Lacaune ewes will need to be developed and implemented in practice. In addition, future work is warranted to develop a user-friendly application using the model developed for easier use by veterinarians and consultants around the world working with dairy sheep farmers and to account for seasonality.
5. Conclusions
In conclusion, we developed a stochastic simulation model to evaluate the economic impact of different lambing intervals. The inputs can be adjusted and modified based on different breeds and production systems. The predicted milk production and feed cost were in line with previous economic on-farm evaluations. Therefore, the model developed in the present study was found appropriate to simulate and compare the economic impact of the two LI in Lacaune ewes and is suitable for the evaluation of the economic impact of different reproductive, productive, and management strategies in dairy sheep farms. Although the accelerated lambing management strategy decreased milk production per lactation, it increased the number of lambings per year, increased the number of lambs sold, increased total milk production per year which increased IOFC as IOFRC. The cost per each additional day open was estimated at EUR 1.08 per day. Future studies are needed to successfully develop nutritional and reproductive management strategies to allow for the implementation of an accelerated lambing interval during all months of the year.
Author Contributions
Conceptualization, P.D.C. and V.G.S.; methodology, P.D.C., V.G.S., E.C. and S.P.; validation, J.A.L.C. and S.P.; formal analysis, P.D.C.; investigation, P.D.C. and J.A.L.C.; data curation, P.D.C., V.G.S. and E.C.; writing—original draft preparation, P.D.C. and V.G.S.; writing—review and editing, P.D.C., V.G.S., P.J.R. and G.A.; supervision, P.J.R. All authors have read and agreed to the published version of the manuscript.
Funding
This research received no external funding.
Institutional Review Board Statement
Not applicable. No animals were used for this study.
Informed Consent Statement
Not applicable.
Data Availability Statement
The data is available upon request to the corresponding author.
Conflicts of Interest
P.D.C. and P.J.R. are employees of Sexing Technologies, a company specialized in Bovine Genetics. The authors declare no other conflicts of interest. In addition, the authors declare no relevant financial or non-financial competing interests.
References
- Pollott, G.E.; Gootwine, E. Reproductive Performance and Milk Production of Assaf Sheep in an Intensive Management System. J. Dairy Sci. 2004, 87, 3690–3703. [Google Scholar] [CrossRef]
- Liagka, D.V.; Politis, A.P.; Spilioti, M.; Nellas, E.; Simitzis, P.; Tsiboukas, K. A Comparative Economic Analysis of Different Reproductive Management Strategies in Two Dairy Sheep Farms in Greece. Agriculture 2025, 15, 719. [Google Scholar] [CrossRef]
- Hassoun, P.; Cordoba, M.A.; Parisot, S.; Portes, D.; Pradel, J.; Bocquier, F. Effects of different supplement amounts on dry matter intake, milk production and milk composition of high-producing Lacaune dairy ewes. Livest. Sci. 2021, 251, 104664. [Google Scholar] [CrossRef]
- Hidalgo-González, C.; Rodríguez-Fernández, M.P.; Nieto, J.; Pérez-García, M.E.; Plaza, J.; Palacios, C. Optimizing lambing efficiency: Alternative management strategies for Assaf ewe flocks. Livest. Sci. 2025, 299, 105763. [Google Scholar] [CrossRef]
- El-Saied, U.M.; de la Fuente, L.F.; Primitivo, F.S. Lifetime traits comparison between annual and accelerated lambing systems for dairy ewes. Livest. Sci. 2006, 101, 180–190. [Google Scholar] [CrossRef]
- Pesantez-Pacheco, J.L.; Torres-Rovira, L.; Hernandez, F.; Sanz-Fernandez, M.V.; Villalobos, N.P.; Heras-Molina, A.; Garcia-Contreras, C.; Vazquez-Gomez, M.; Martinez-Ros, P.; Gonzalez-Martin, J.V.; et al. Efficiency and demographics of a high-yield dairy ewe farm with two managing systems involving five or 10 lambings per year. Animal 2018, 12, 2181–2190. [Google Scholar] [CrossRef]
- Eyal, E.; Lawi, A.; Folman, Y.; Morag, M. Lamb and milk production of a flock of dairy ewes under an accelerated breeding regime. J. Agric. Sci. 1978, 91, 69–79. [Google Scholar] [CrossRef]
- Menegatos, J.; Goulas, C.; Kalogiannis, D. The productivity, ovarian and thyroid activity of ewes in an accelerated lambing system in Greece. Small Rumin. Res. 2006, 65, 209–216. [Google Scholar] [CrossRef]
- Mavrogenis, A.P.; Chimonides, I. Reproductive and production efficiency of Chios ewes under an accelerated breeding system. Small Rumin. Res. 1992, 7, 353–360. [Google Scholar] [CrossRef]
- Cabrera, V.E. A simple formulation and solution to the replacement problem: A practical tool to assess the economic cow value, the value of a new pregnancy, and the cost of a pregnancy loss. J. Dairy Sci. 2012, 95, 4683–4698. [Google Scholar] [CrossRef]
- Giordano, J.O.; Kalantari, A.S.; Fricke, P.M.; Wiltbank, M.C.; Cabrera, V.E. A daily herd Markov-chain model to study the reproductive and economic impact of reproductive programs combining timed artificial insemination and estrus detection. J. Dairy Sci. 2012, 95, 5442–5460. [Google Scholar] [CrossRef]
- Giordano, J.O.; Fricke, P.M.; Cabrera, V.E. Economics of resynchronization strategies including chemical tests to identify nonpregnant cows. J. Dairy Sci. 2013, 96, 949–961. [Google Scholar] [CrossRef]
- Cabrera, V.E. Economics of fertility in high-yielding dairy cows on confined TMR systems. Animal 2014, 8, 211–221. [Google Scholar] [CrossRef] [PubMed]
- Cabrera, V.E. Economics of using beef semen on dairy herds. JDS Commun. 2022, 3, 147–151. [Google Scholar] [CrossRef] [PubMed]
- Hansen, T.L.; Li, M.; Li, J.; Vankerhove, C.J.; Sotirova, M.A.; Tricarico, J.M.; Cabrera, V.E.; Kebreab, E.; Reed, K.F. The Ruminant Farm Systems Animal Module: A Biophysical Description of Animal Management. Animals 2021, 11, 1373. [Google Scholar] [CrossRef] [PubMed]
- Li, M.; Reed, K.F.; Lauber, M.R.; Fricke, P.M.; Cabrera, V.E. A stochastic animal life cycle simulation model for a whole dairy farm system model: Assessing the value of combined heifer and lactating dairy cow reproductive management programs. J. Dairy Sci. 2023, 106, 3246–3267. [Google Scholar] [CrossRef]
- Valergakis, G.E.; Gelasakis, A.I.; Oikonomou, G.; Arsenos, G.; Fortomaris, P.; Banos, G. Profitability of a dairy sheep genetic improvement program using artificial insemination. Animal 2010, 4, 1628–1633. [Google Scholar] [CrossRef]
- Legarra, A.; Ramón, M.; Ugarte, E.; Pérez-Guzmán, M.D. Economic weights of fertility, prolificacy, milk yield and longevity in dairy sheep. Animal 2007, 1, 193–203. [Google Scholar] [CrossRef]
- Ehrlich, J.L. Quantifying shape of lactation curves, and benchmark curves for common dairy breeds and parities. Bov. Pract. 2010, 45, 88–95. [Google Scholar] [CrossRef]
- INRA. Alimentation des Ruminants; Éditions Quae: Versailles, France, 2018. [Google Scholar]
- Priskas, S.; Valergakis, G.; Tsakmakidis, I.; Vouraki, S.; Papanikolopoulou, V.; Theodoridis, A.; Arsenos, G. The Role of Housing Conditions on the Success of Artificial Insemination in Intensively Reared Dairy Ewes in Greece. Animals 2022, 12, 2693. [Google Scholar] [CrossRef]
- Piccardi, M.; Macchiavelli, R.; Funes, A.C.; Bó, G.A.; Balzarini, M. Fitting milk production curves through nonlinear mixed models. J. Dairy Res. 2017, 84, 146–153. [Google Scholar] [CrossRef]
- Skordos, D.; Koutouzidou, G.; Arca, P.; Altana, G.; Francioni, M.; Bianchini, M.; Dar Ali, M.; Sintori, A.; Sokratous, S.; Ivankovic, A.; et al. The economic performance of sheep pastoral systems in the Mediterranean: An analysis based on typologies. Livest. Sci. 2025, 298, 105738. [Google Scholar] [CrossRef]
- Sokratous, S.; Ragkos, A.; Arsenos, G.; Theodoridis, A. Efficiency Analysis of Sheep Farms in Cyprus. Agriculture 2025, 15, 1555. [Google Scholar] [CrossRef]
- Fatet, A.; Leboeuf, B.; Fréret, S.; Druart, X.; Bodin, L.; Caillat, H.; David, I.; Palhière, I.; Boué, P.; Lagriffoul, G. L’insémination dans les filières ovines et caprines. Renc. Rech. Rum. 2008, 355–358. [Google Scholar]
- Barillet, F.; Marie, C.; Jacquin, M.; Lagriffoul, G.; Astruc, J.M. The French Lacaune dairy sheep breed: Use in France and abroad in the last 40 years. Livest. Prod. Sci. 2001, 71, 17–29. [Google Scholar] [CrossRef]
- Oravcova, M.; Margetin, M.; Peskovicova, D.; Dano, J.; Milerski, M.; Hetenyi, L.; Polak, P. Factors affecting milk yield and ewe’s lactation curves estimated with test-day models. Czech J. Anim. Sci. 2006, 51, 483–490. [Google Scholar] [CrossRef]
- Morrissey, A.D.; Cameron, A.W.N.; Tilbrook, A.J. Pregnancy does not affect commercial milk yield in dairy ewes managed to lamb at 9-month intervals. Small Rumin. Res. 2008, 76, 211–214. [Google Scholar] [CrossRef]
- Morrissey, A.D.; Cameron, A.W.N.; Caddy, D.J.; Tilbrook, A.J. Predicting Milk Yield in Sheep Used for Dairying in Australia. J. Dairy Sci. 2007, 90, 5056–5061. [Google Scholar] [CrossRef] [PubMed]
- González-García, E.; Tesniere, A.; Camous, S.; Bocquier, F.; Barillet, F.; Hassoun, P. The effects of parity, litter size, physiological state, and milking frequency on the metabolic profile of Lacaune dairy ewes. Domest. Anim. Endocrinol. 2015, 50, 32–44. [Google Scholar] [CrossRef]
- Gootwine, E.; Pollott, G.E. Factors affecting milk production in Improved Awassi dairy ewes. Anim. Sci. 2000, 71, 607–615. [Google Scholar] [CrossRef]
- Elhadi, A.; Calsamiglia, S.; Rodríguez-Prado, M.E.; Belaid, M.A.; Such, X.; Bahloul, L.; Caja, G. Lactational and digestive responses of reducing dietary protein level and supplementing rumen-protected methionine in early-lactation dairy ewes. J. Dairy Sci. 2025, 108, 7074–7090. [Google Scholar] [CrossRef]
- Vouraki, S.; Astruc, J.-M.; Lagriffoul, G.; Rupp, R.; Banos, G.; Arsenos, G. Genotype-by-Environment Interactions and Response to Selection for Milk Production Traits in Lacaune Sheep from Greece and France. Vet. Sci. 2025, 12, 194. [Google Scholar] [CrossRef]
- Alvarez, M.; Anel-Lopez, L.; Boixo, J.C.; Chamorro, C.; Neila-Montero, M.; Montes-Garrido, R.; de Paz, P.; Anel, L. Current challenges in sheep artificial insemination: A particular insight. Reprod. Domest. Anim. 2019, 54, 32–40. [Google Scholar] [CrossRef]
- Abecia, J.-A.; Sosa, C.; Forcada, F.; Meikle, A. The effect of undernutrition on the establishment of pregnancy in the ewe. Reprod. Nutr. Dev. 2006, 46, 367–378. [Google Scholar] [CrossRef]
- Debus, N.; Laclef, E.; Lurette, A.; Alhamada, M.; Tesniere, A.; González-García, E.; Menassol, J.B.; Bocquier, F. High body condition score combined with a reduced lambing to ram introduction interval improves the short-term ovarian response of milking Lacaune ewes to the male effect. Animal 2022, 16, 100519. [Google Scholar] [CrossRef]
- David, I.; Robert-Granié, C.; Manfredi, E.; Lagriffoul, G.; Bodin, L. Environmental and genetic variation factors of artificial insemination success in French dairy sheep. Animal 2008, 2, 979–986. [Google Scholar] [CrossRef] [PubMed]
- Anel, L.; Kaabi, M.; Abroug, B.; Alvarez, M.; Anel, E.; Boixo, J.C.; de la Fuente, L.; de Paz, P. Factors influencing the success of vaginal and laparoscopic artificial insemination in churra ewes: A field assay. Theriogenology 2005, 63, 1235–1247. [Google Scholar] [CrossRef]
- Pineda-Quiroga, C.; Granado-Tajada, I.; Basterra-García, A.; Ugarte, E. Environmental and additive genetic factors that affect artificial insemination success in Latxa dairy sheep breed. Livest. Sci. 2024, 289, 105580. [Google Scholar] [CrossRef]
Disclaimer/Publisher’s Note: The statements, opinions and data contained in all publications are solely those of the individual author(s) and contributor(s) and not of MDPI and/or the editor(s). MDPI and/or the editor(s) disclaim responsibility for any injury to people or property resulting from any ideas, methods, instructions or products referred to in the content. |
© 2025 by the authors. Licensee MDPI, Basel, Switzerland. This article is an open access article distributed under the terms and conditions of the Creative Commons Attribution (CC BY) license (https://creativecommons.org/licenses/by/4.0/).