Article

Impact of Lameness on Brush Use in a Loose-Housed Dairy System

Pathobiology and Population Sciences, Animal Welfare Science and Ethics Group, Royal Veterinary College, Hatfield AL9 7TA, UK
*
Author to whom correspondence should be addressed.
Ruminants 2024, 4(3), 375-386; https://doi.org/10.3390/ruminants4030027
Submission received: 2 July 2024 / Revised: 29 July 2024 / Accepted: 30 July 2024 / Published: 2 August 2024
(This article belongs to the Special Issue Dairy Cow Husbandry, Behaviour and Welfare)

Abstract

:

Simple Summary

Lameness is a big issue within UK dairy herds that can lead to significant welfare and financial implications. Early detection and treatment can result in a better cure of this painful condition. Cows enjoy grooming each other and will use automatic brushes to groom themselves. However, grooming is a luxury behaviour that is performed if everything else is fine with the cow. Lame cows may use brushes less because it could be painful to be on their feet. This study aimed to assess if the possibility of monitoring automated brush use within a loose-housed dairy herd could aid in the early identification of lameness. This study found that if accurate monitoring of individuals’ brush use (duration per visit to a brush) could be collected, then this could act as an indicator for lameness. This information could then be utilised on the farm to allow prompt identification of the individual(s) for direct assessment, which in turn allows for prompt action to be taken with the aim of improved outcomes for the cow(s) and the farm.

Abstract

This study focused on a group of 49 high-yielding dairy cows (primarily Holstein Friesians) and how their interactions with wall-mounted automated brushes correlated to their mobility (also described as lameness) score (AHDB 0–3 system. Of the 49 animals in the study, 48 were mobility scored with a sample lameness prevalence of 14.6% (n = 22 score 0, n = 19 score 1, n = 6 score 2 and n = 1 score 3 (score 2 and 3 combined due to low numbers identified)). There was no statistical difference in the number of visits between the lame (score 2 and 3) and sound cows (score 0 and 1); however, there was a statistically relevant decrease in the duration that the lame cows spent brushing per visit (sound 91.7 ± 6.06 s compared to lame 63.0 ± 9.22 s, p = 0.0097). No significant difference was identified in how the lame cows interacted with the brushes (i.e., which body part) when compared to the group. The group, in general, showed a significant preference towards interacting with the brush with their head area (63.95% of interactions observed over the 72 h involved the head). In conclusion, monitoring brush use (duration of use per visit) could aid with the identification of clinically lame animals.

1. Introduction

Lameness can be defined as a painful condition or abnormality that impacts the animal’s ability to move in a normal manner [1,2,3,4]. Lameness is commonly identified via mobility scoring, for the purpose of this study the AHDB 0–3 system was utilised [5]. Lameness has been linked to a variety of foot and leg issues caused by many factors including disease, injury, management and environmental factors and, less commonly, neurological issues [1,2,4,6]. A majority of the cases detected are linked to hind limb issues, and estimates put hind limb involvement as high as 92% [7,8,9]. Currently, lameness prevalence is estimated to be between 25% and 31.6% in UK dairy herds [10,11,12], with a single incident of lameness potentially costing the farm between GBP 110 and GBP 520 [13,14]. As there are currently approximately 1.9 million dairy cattle in the UK [13] and across a year, a farm will potentially see a 55% incident rate of lameness [10], it could be estimated that lameness is costing the UK dairy industry up to GBP 543,400,000 per year. With this in mind, early identification and treatment of lameness is key to maintaining a healthy, productive and profitable herd [4,15].
In the mid-1980s, the first automatically activated rotating cow brushes were developed [16]. These automatic brushes have become increasingly common, especially in free stall/loose-housed barns, and may now potentially be considered standard equipment [17]. A variety of benefits have been documented in the literature related to their use, including the ability to exhibit normal grooming behaviour [16,18,19,20], remove parasites [19,21,22], improve skin health [19,21,22], reduce disease [19,21,22], reduce stress [16,18], reduce frustration [16,18], relieve boredom [16,18] and increase milk yield [23,24]. Indeed, cows are highly motivated to use mechanical brushes whereby they push equal weight on a gate for access to fresh feed and brushes [25]. It has also been suggested that monitoring brush use could potentially be utilised as an indicator of herd health [19,20,26]. This is due to brush use being classified as a low-resilience/luxury behaviour [27] and, as a result, is more likely to decrease sooner than core behaviours (e.g., time spent eating/at the food source or drinking) when the perceived cost of the behaviour increases [28,29,30]. A decrease in low-resilience behaviours has been reported in cows during heat stress [24], after an intrusive medical procedure [24], during episodes of metritis [31] and on the peak day of bovine respiratory disease in calves (BRD) [32].
Two recent studies carried out by Foris et al. recorded brush use in dairy cattle. One study found that brush use (at a group level) was observed at between 2.6 and 10.1 h/day depending on the group size (mean ± SD of daily brush use for different group sizes was 24 cows, 3.8 ± 0.6 h; 36 cows, 5.5 ± 1.3 h; 48 cows, 5.6 ± 1.4 h; 60 cows, 7.6 ± 1.8 h). This resulted in an average brush use of 8.5 ± 2.0 min/day/cow [19]. The other study identified that, on average, cows used the brush for 27.4 min/day but with considerable variability observed between individuals (SD 21 min, range 0–101.9 min) [33]. A further study carried out recently reported a range of between 59 and 1610 s brush use/individual/day [34].
One study [27] directly investigated brush use to detect lameness. This study found that brushes placed further from feed bunks (where perceived cost to the animal was higher) were utilised less by lame/severely lame cows, whereas brushes located near feed bunks were still utilised even by lame/severely lame cows [27].
Given the potential applications of brush use monitoring to detect lameness, this paper aimed to investigate further if the link between how cows interact with a brush could be utilised to detect lameness. This study looked at how cows in a loose-housed environment interacted with brushes and if these interactions could aid the previously described detection methods to identify lameness. Furthermore, this study looked at if specific types of interaction could identify specific limb(s) involvement with lameness. It was hypothesised that brush use would significantly decrease with lameness. It was further hypothesised that the data would suggest which limb was affected by an increase in the time the affected limb was in contact with the brush (i.e., utilising the brush to remove some of the load from the affected limb). There is also limited information on how often the brush is used by individual cows and which part of the body cows use to interact with brushes, leading to a further aim of this study.

2. Materials and Methods

2.1. Ethical Approval

This project was approved by the Clinical Research Ethical Review Board (CRERB) at the Royal Veterinary College (RVC), London, England. Reference number CR-2023-014-2.

2.2. Animals and Management

The study was carried out on a loose-housed dairy farm in the East of England consisting of three separate areas as follows: one for high yielders, one for low yielders and another for dry cows. The herd primarily comprises Holstein Friesians totalling 80 adults, made up of 49 high yielders, 19 low yielders and 12 dry cows. The bedding was sawdust over a chalk base with concrete by the feeding rails. Cows were fed a TMR (total mixed ration) tailored to each group’s lactation stage daily, available upon return from morning milking. The ration was robotically pushed up every hour. Additional concentrate feed was given in the milking parlour. Milking occurred twice a day at approximately 5 am and 3 pm. Cows were mobility scored regularly (approximately every 2 weeks) by trained observers (from the register of mobility scorers (ROMS)) using the 0–3 Agriculture and Horticulture Development Boards (AHDB) scoring system [5]. All cows assessed had their cow ID and score recorded (regardless of score). Where specific limb(s) involvement was identified, this was additionally recorded.
The cows selected for this study consisted solely of high yielders (n = 49). Observations were recorded over a continuous 72 h period from 0:00:00 on 21 February 2023 until 23:59:59 on 23 February 2023. This date window was selected to cover the day prior to, of and post lameness scoring (which occurred post afternoon milking on 22 February 2023). During this time, the high yielders were housed primarily in a larger pen with access to two Kerbl Happycow (model 18690) mechanical brushes (brush one was non-functional (did not rotate) and brush two was fully functional). They were also housed in the smaller low yielder pen during mucking out (22 February 2023 from return from morning milking (06:30) until approximately 12:30). During this period, the cows had access to a single non-functional mechanical brush of the same type (brush three). Figure 1 details the layout. Brushes utilised for this study were pre-existing in the environment and, as such, were not directly selected for the study. They do, however, share many similarities with other brushes on the market. The use of these brushes was also deemed appropriate because the cows are used to their current positions within the environment, which could alleviate the potential impact that environmental alterations could have had on the results gathered.

2.3. Data Collection

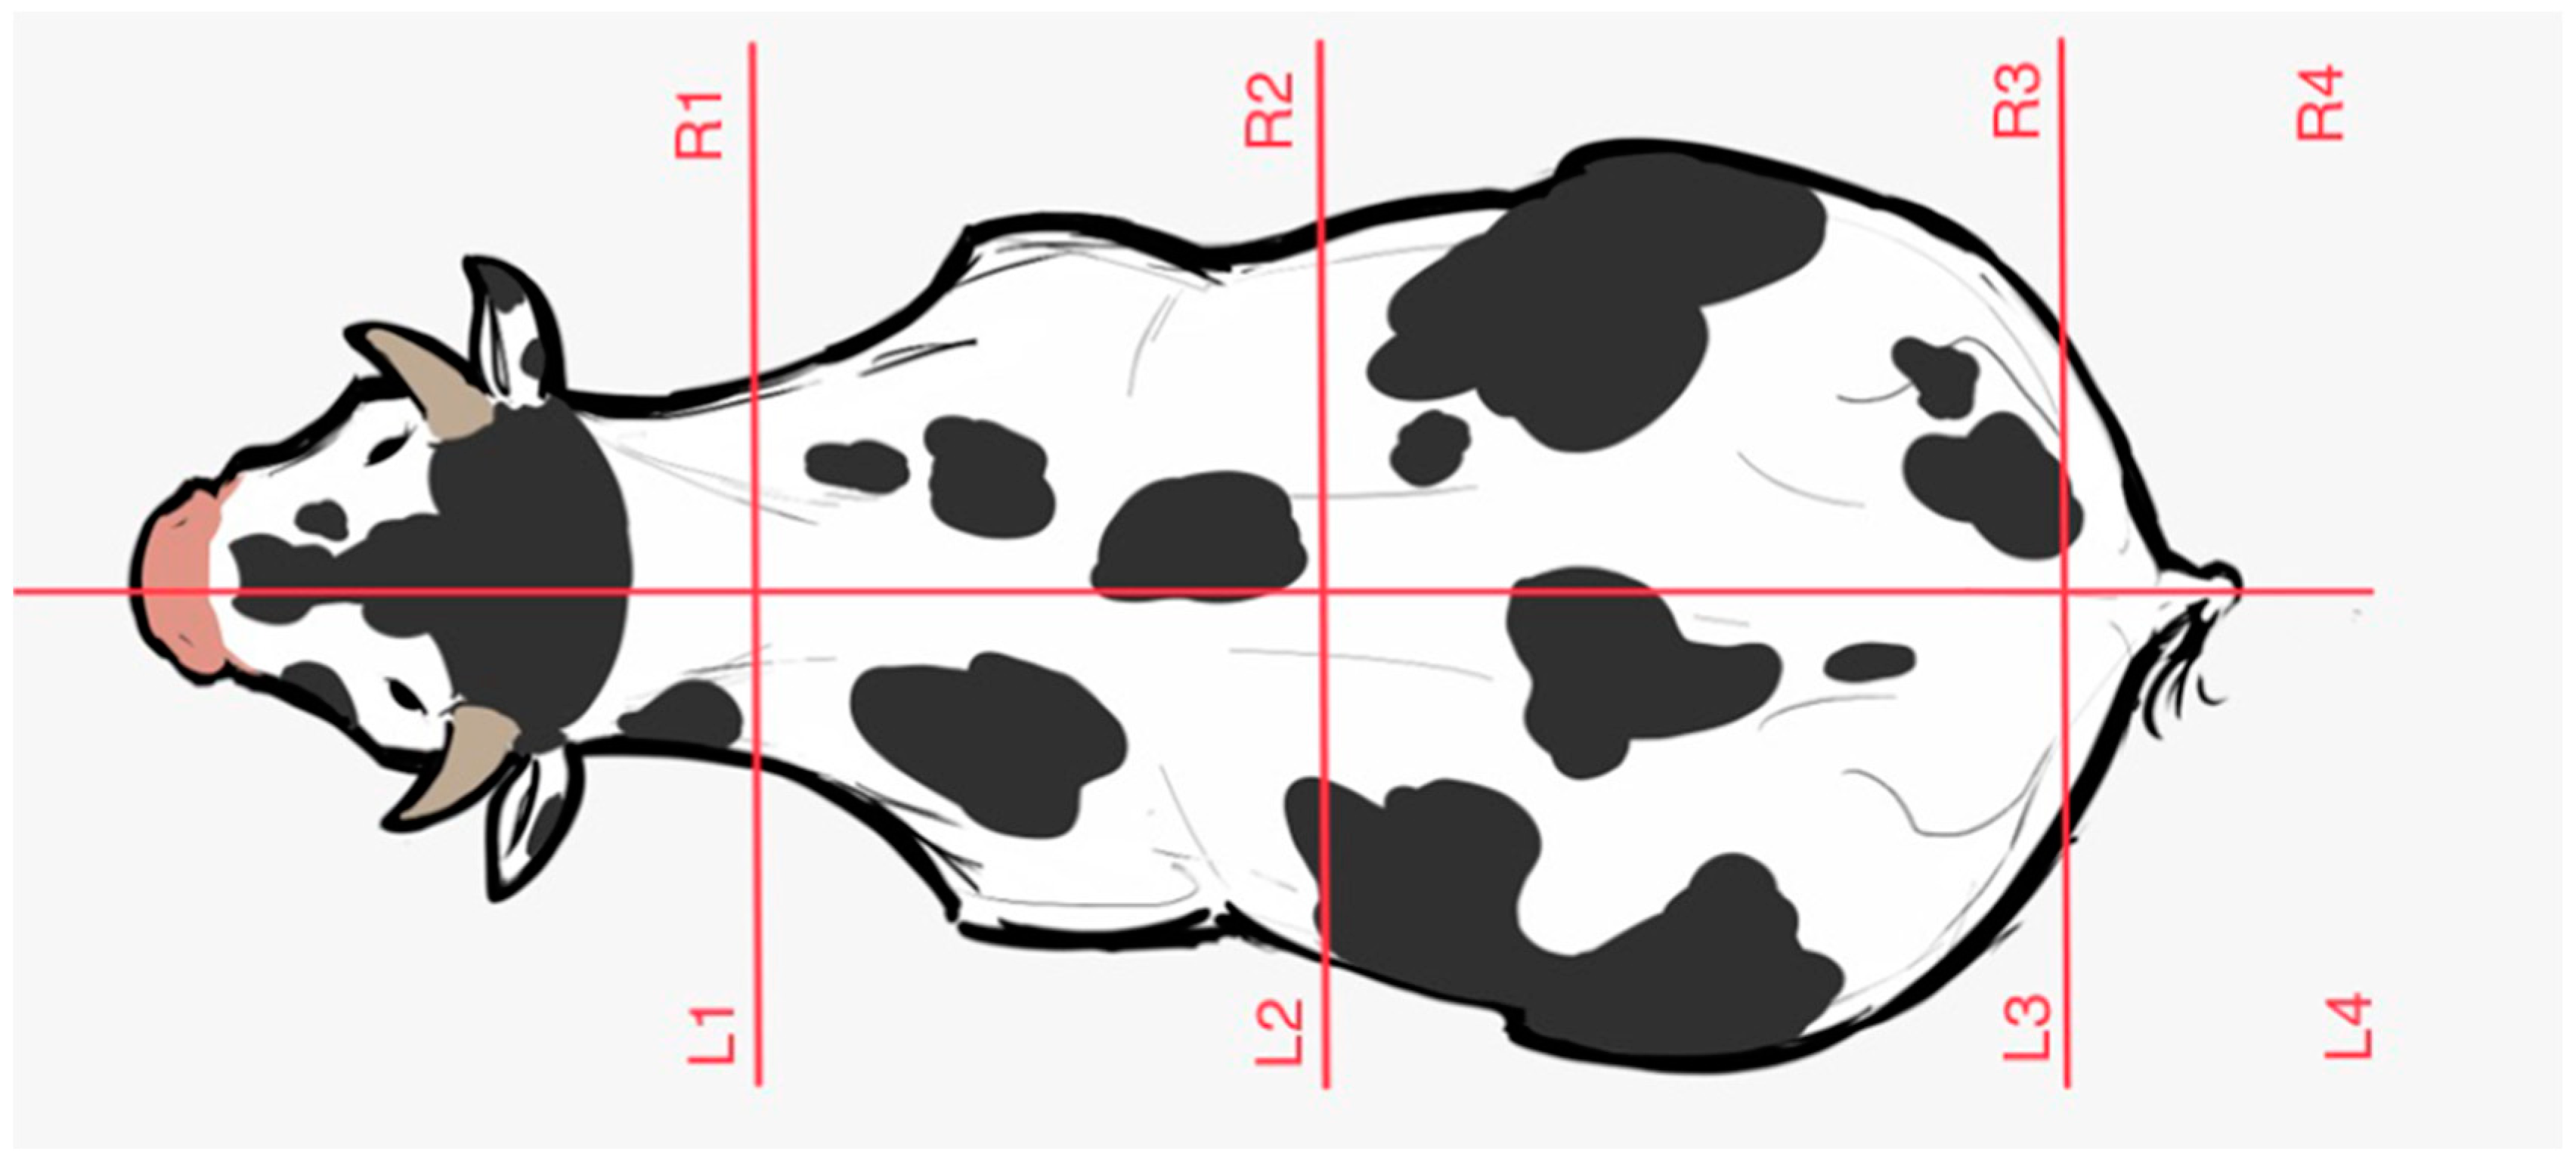
To allow a direct comparison between in person and CCTV-collected data, 12 h observation periods were allocated to each observation method per 24 h. From 7 am to 7 pm each day, in person observations were utilised to study the samples’ brush interactions. This was manually recorded on an observation sheet, then digitally inputted into Excel (Microsoft Excel for Mac 2011, version 14.7.3). Brush attendance, date, cow number, brush number, area brushed and start and finish time were recorded. For the date, start and finish time recordings on an internet-calibrated watch (Garmin Vivioactive 3 set to UK (GMT) time) were utilised (recorded to the nearest second). Cow numbers were visually identified via freeze branding/numbered collars. Figure 2 illustrates how the area brushed was assessed. There were eight areas identified and a ninth that covered repeated changing from each side of the head. Each time a different area was brushed, a new entry was recorded, later described as an interaction. When the same individual had multiple interactions without departing, this was recorded separately as a single attendance/visit.
To record which part of the body the cow used to interact with the brush, the cow was divided into eight areas shown in Figure 2. In addition to the illustrated eight areas (Figure 2), there was a ninth record available of L1/R1, which indicated that the cow would frequently swap between brushing the right and left side of their head and cranial neck area.
Overnight from 7 pm to 7 am, closed-circuit television (CCTV) recordings from a single camera covering both brushes (1 and 2) within the high yielders’ pen were utilised to record brush interactions. Due to the quality of the recording, it was not possible to positively identify all individuals, so no cow numbers were recorded, but all other data were recorded as per the day observations. An additional response was available for area brushed, that of obscured view, which represented when it was not possible to identify the area interacting, but brush interaction was positively identified. Lameness scores for both 22 February 2023 and the subsequent scoring event on 6 March 2023 (12 days later) were acquired from farm records.

2.4. Data Analysis

Sample data were utilised to their fullest potential during this study. All 49 cows were included in the interaction data, where 48 of the high yielders were mobility scored within the observation window; thus, when comparing lameness to brush use, the relevant individual(s) data were excluded/included as necessary. For any analysis requiring cow identification, only data collected from 7 am to 7 pm was utilised. Where follow-up lameness data are utilised, only samples that appeared in all relevant data fields were utilised (n = 40). When the data were collected, a start time and finish time were recorded. A total time was extrapolated from this and recorded in minutes and seconds. These values were then used during Excel calculations. The total time was then converted into seconds prior to being imported into Graph Pad (Graph Pad Prism—version 9.5.1). Basic data compilation and analysis were carried out using Excel, and the raw data were transferred to Graph Pad software for further analysis. The various data groups were checked for Gaussian (normal) distribution via a Shapiro–Wilks or D’Agostino and Pearson test [35]. If Gaussian, then either a one-way ANOVA [36] or unpaired t-test [35] were utilised. Post hoc tests were carried out via Tukey’s multiple comparison test [36]. If the values did not have Gaussian distribution, then a non-parametric Kruskal–Wallis test was utilised [37], with post hoc analysis via either Dunn’s multiple comparison test or the Mann–Whitney test. Any analysis returning a p-value < 0.05 was considered statistically significant and any result with a p-value of 0.05–0.10 was said to indicate a statistical tendency towards a difference.

3. Results

3.1. General Brush Interaction

Across the 72 h observation window, a total of 784 individual brush interactions were observed across 442 separate visits. This amounted to a total of 10 h, 49 min and 24 s (38,964 s) of brush contact (15.03% of the total time observed) equating to a mean time spent interacting with a brush of 4.42 min/cow/24 h (265.06 s/cow/24 h). The mean visit time was 88 s and the mean interaction time was 50 s. This equated to a mean visits/cow of 9.02 and a mean interactions/cow of 16.00 across the observation period, or a mean visits/cow of 3.01/24 h and a mean interactions/cow of 5.33/24 h. Over the three 7 am–7 pm observation windows, 100% (n = 49) of the cows were observed to have utilised one of the brushes at least once with a visit range of 1–13. Those visits resulted in a range of between 2 and 33 individual interactions (Table 1). Over the three 7 pm–7 am observation windows, some individuals could not be identified (a value of n = 49 was assumed). See Table 1 for a breakdown. The live and video observational data were assessed via a Mann–Whitney test and found to have no significant difference (p = 0.9819).

3.2. Lameness Data

Herd lameness data were gathered on 22 February 2023and 6 March 2023 (Table 2). Data from 22 February 2023 showed a herd lameness prevalence of 11.8% (n = 68) and a prevalence of 14.6% (n = 48) within the sample population. On 6/3/23, herd lameness increased slightly to 14.1% (n = 64) but lameness prevalence within the sample animals remained stable at 14.6% (n = 41) (fewer sample animals were observed on this occasion). Of the 49 sample animals, only 40 appeared in both lameness assessments (n = 40). Of these, 9 showed a reduction in lameness, 14 showed no change and 17 showed an increase in lameness score between the two scoring events. These changes were assessed against the total time that each individual spent interacting with a brush but no statistically significant relationship was identified (p = 0.2360).

3.3. Brush Use Data

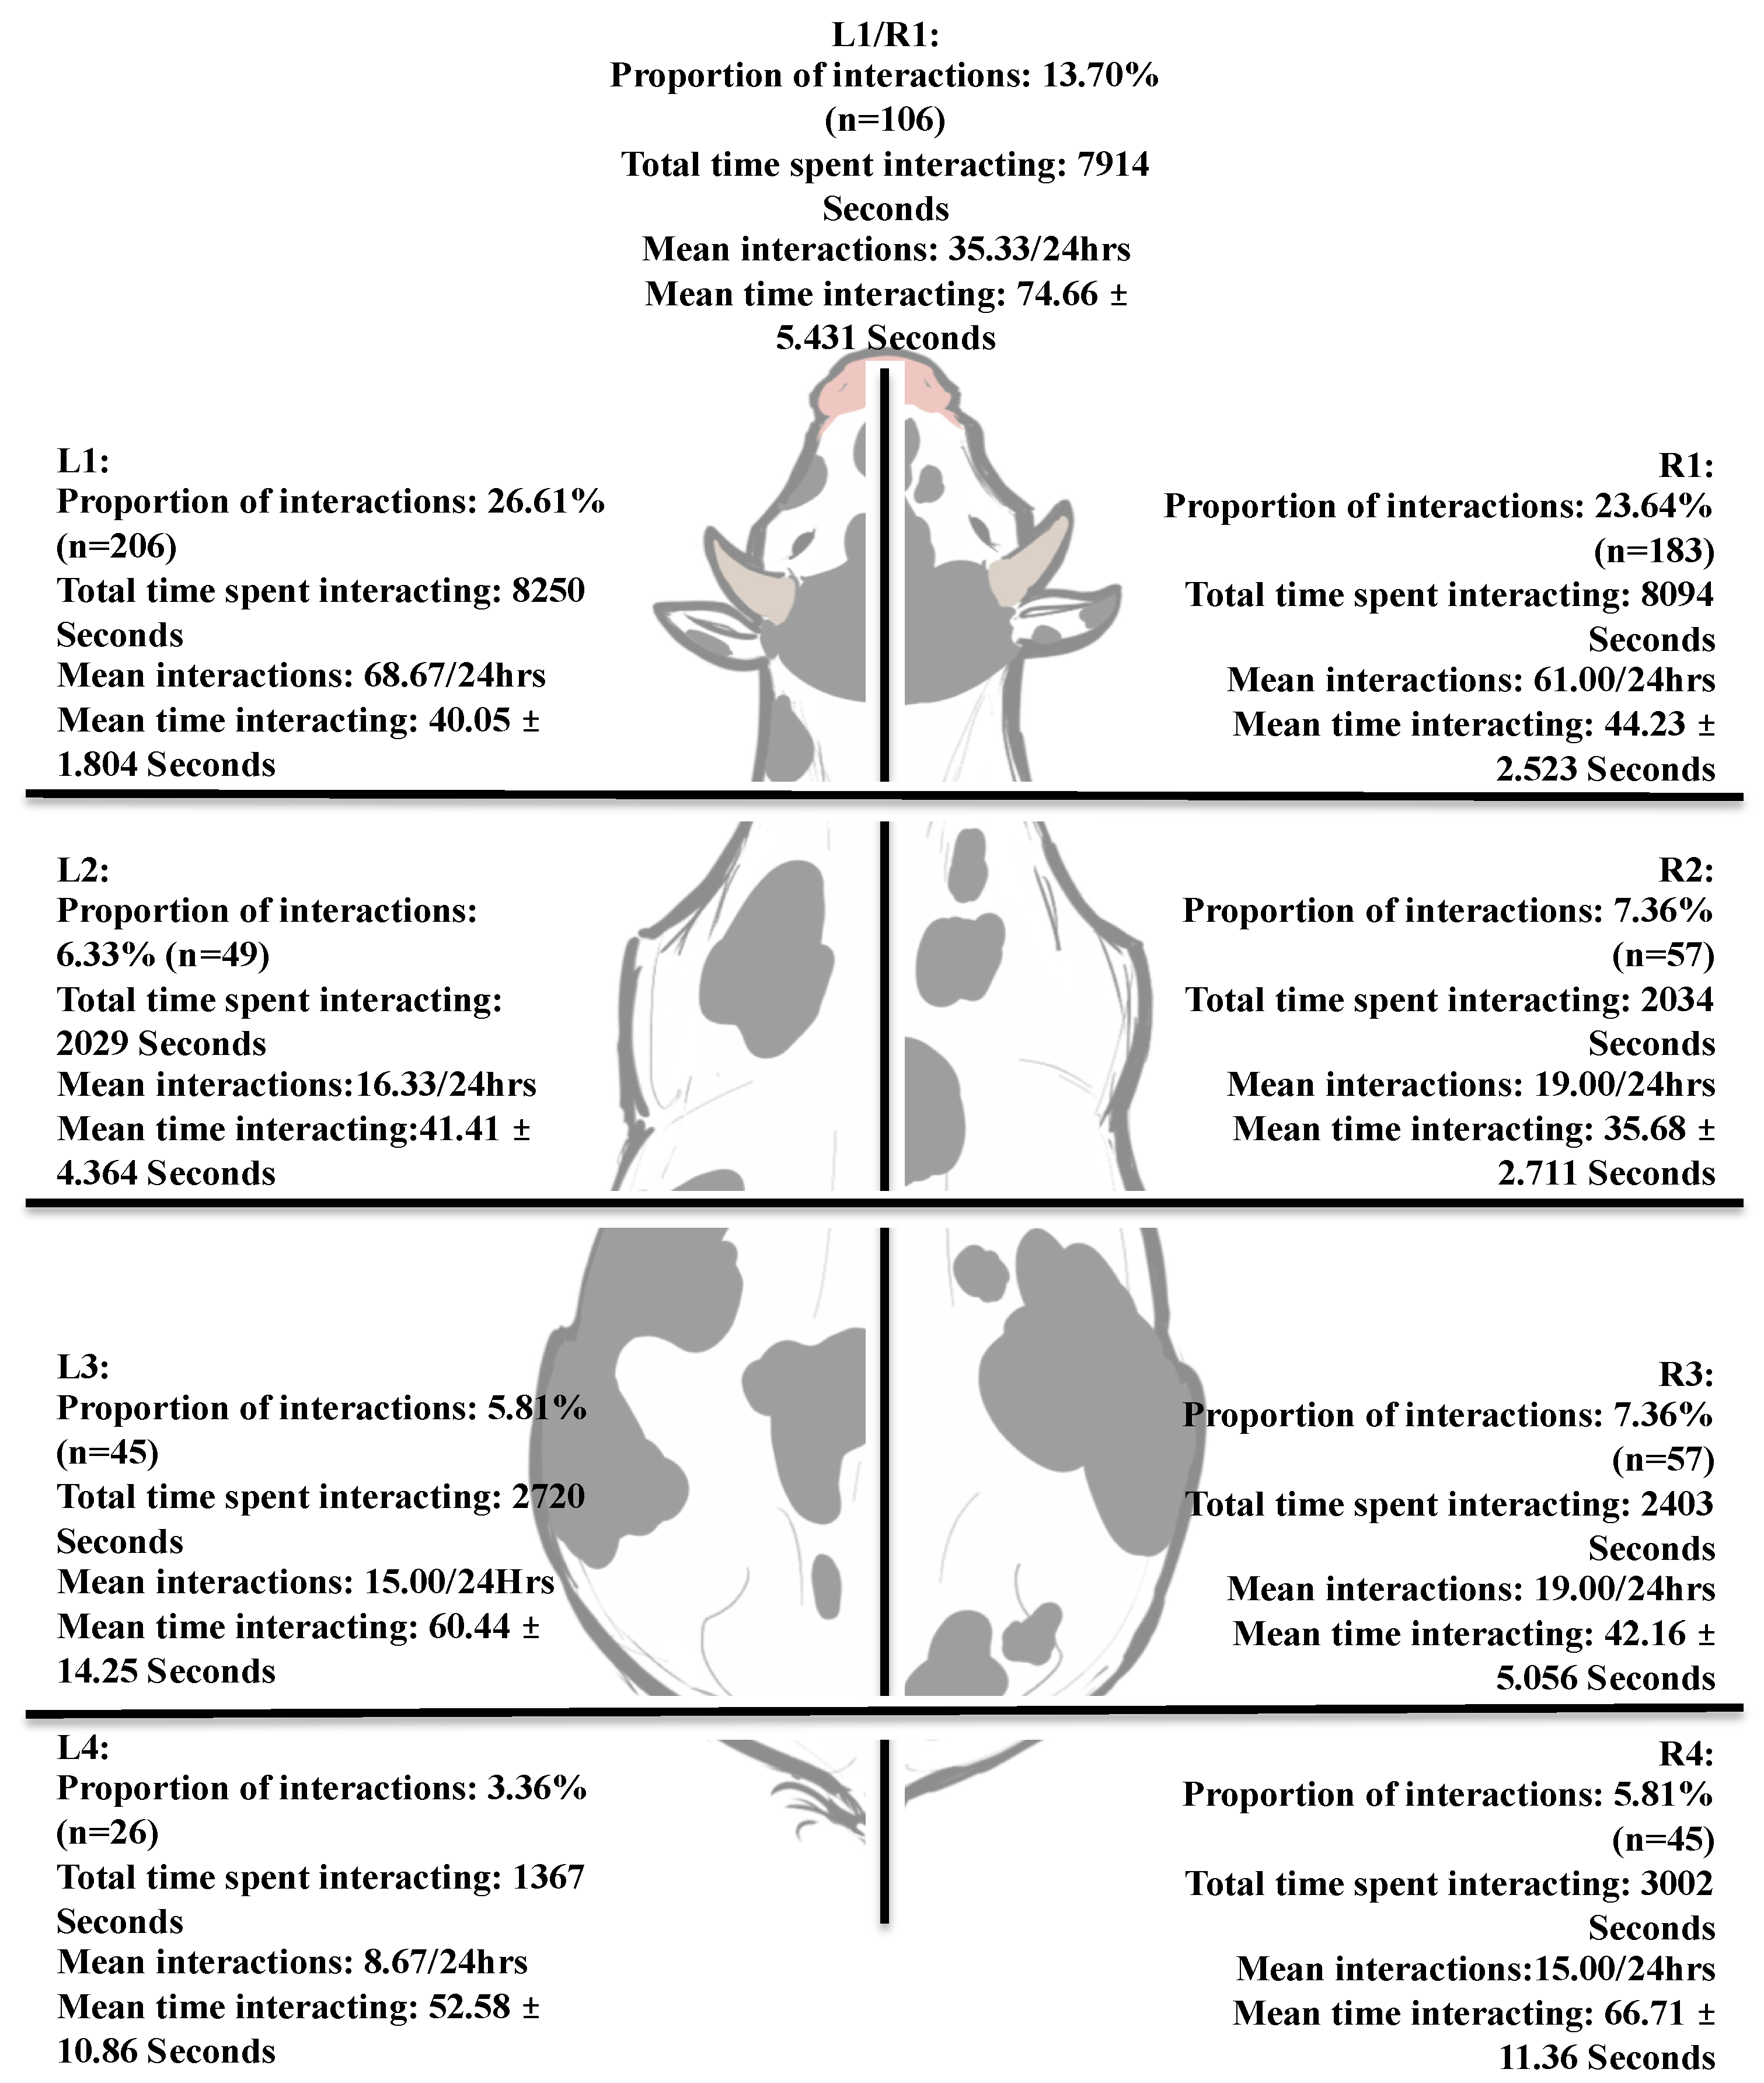
The sampled cows showed a tendency towards a difference for interacting with the brush with their front quarter (all results in area 1, n = 495) when compared to the rest of the body (n = 279) p = 0.0532, equating to a total time of 6 h, 44 min and 18 s (24,258 s) spent interacting with the brush front (head) on and only 3 h, 45 min and 55 s (13,555 s) interacting with the rest of their body. The interaction data (n = 774) across the 72 h was analysed further (Figure 3). Interaction time per area was compared via a Kruskal–Wallis test and found to have a high statistical significance (p = <0.0001). Post hoc analysis of this data using Dunn’s multiple comparison test showed a statistically significant increase in the time spent per interaction with L1/R1 when compared to L1, R1, L2, R2, L3 and R3 (p = <0.0001—p = 0.0203) (Table 3).
Table 3 shows a statistically relevant preference to interact with L1/R1 over L1, R1, L2, R2, L3 and R3. Following on from these results, a further comparison between interactions between the head area and the rest of the body was carried out (Table 4), which showed a tendency towards a difference in interaction duration favouring the head area (p = 0.0532). (Italic results are not significant but included for completeness).
There were statistically significant increases in the interaction time with L1/R1 (74.66 ± 5.431 s) when analysed against L1 (40.95 ± 4.346 s p = <0.0001), R1 (44.23 ± 2.523 s p = <0.0001), L2 (41.41 ± 4.364 s p = <0.0001), R2 (35.68 ± 2.711 s p = <0.0001), L3 (60.44 ± 14.25 s p = 0.0203) and R3 (42.16 ± 5.056 s p = <0.0001).

3.4. Brush Use in Relation to Lameness

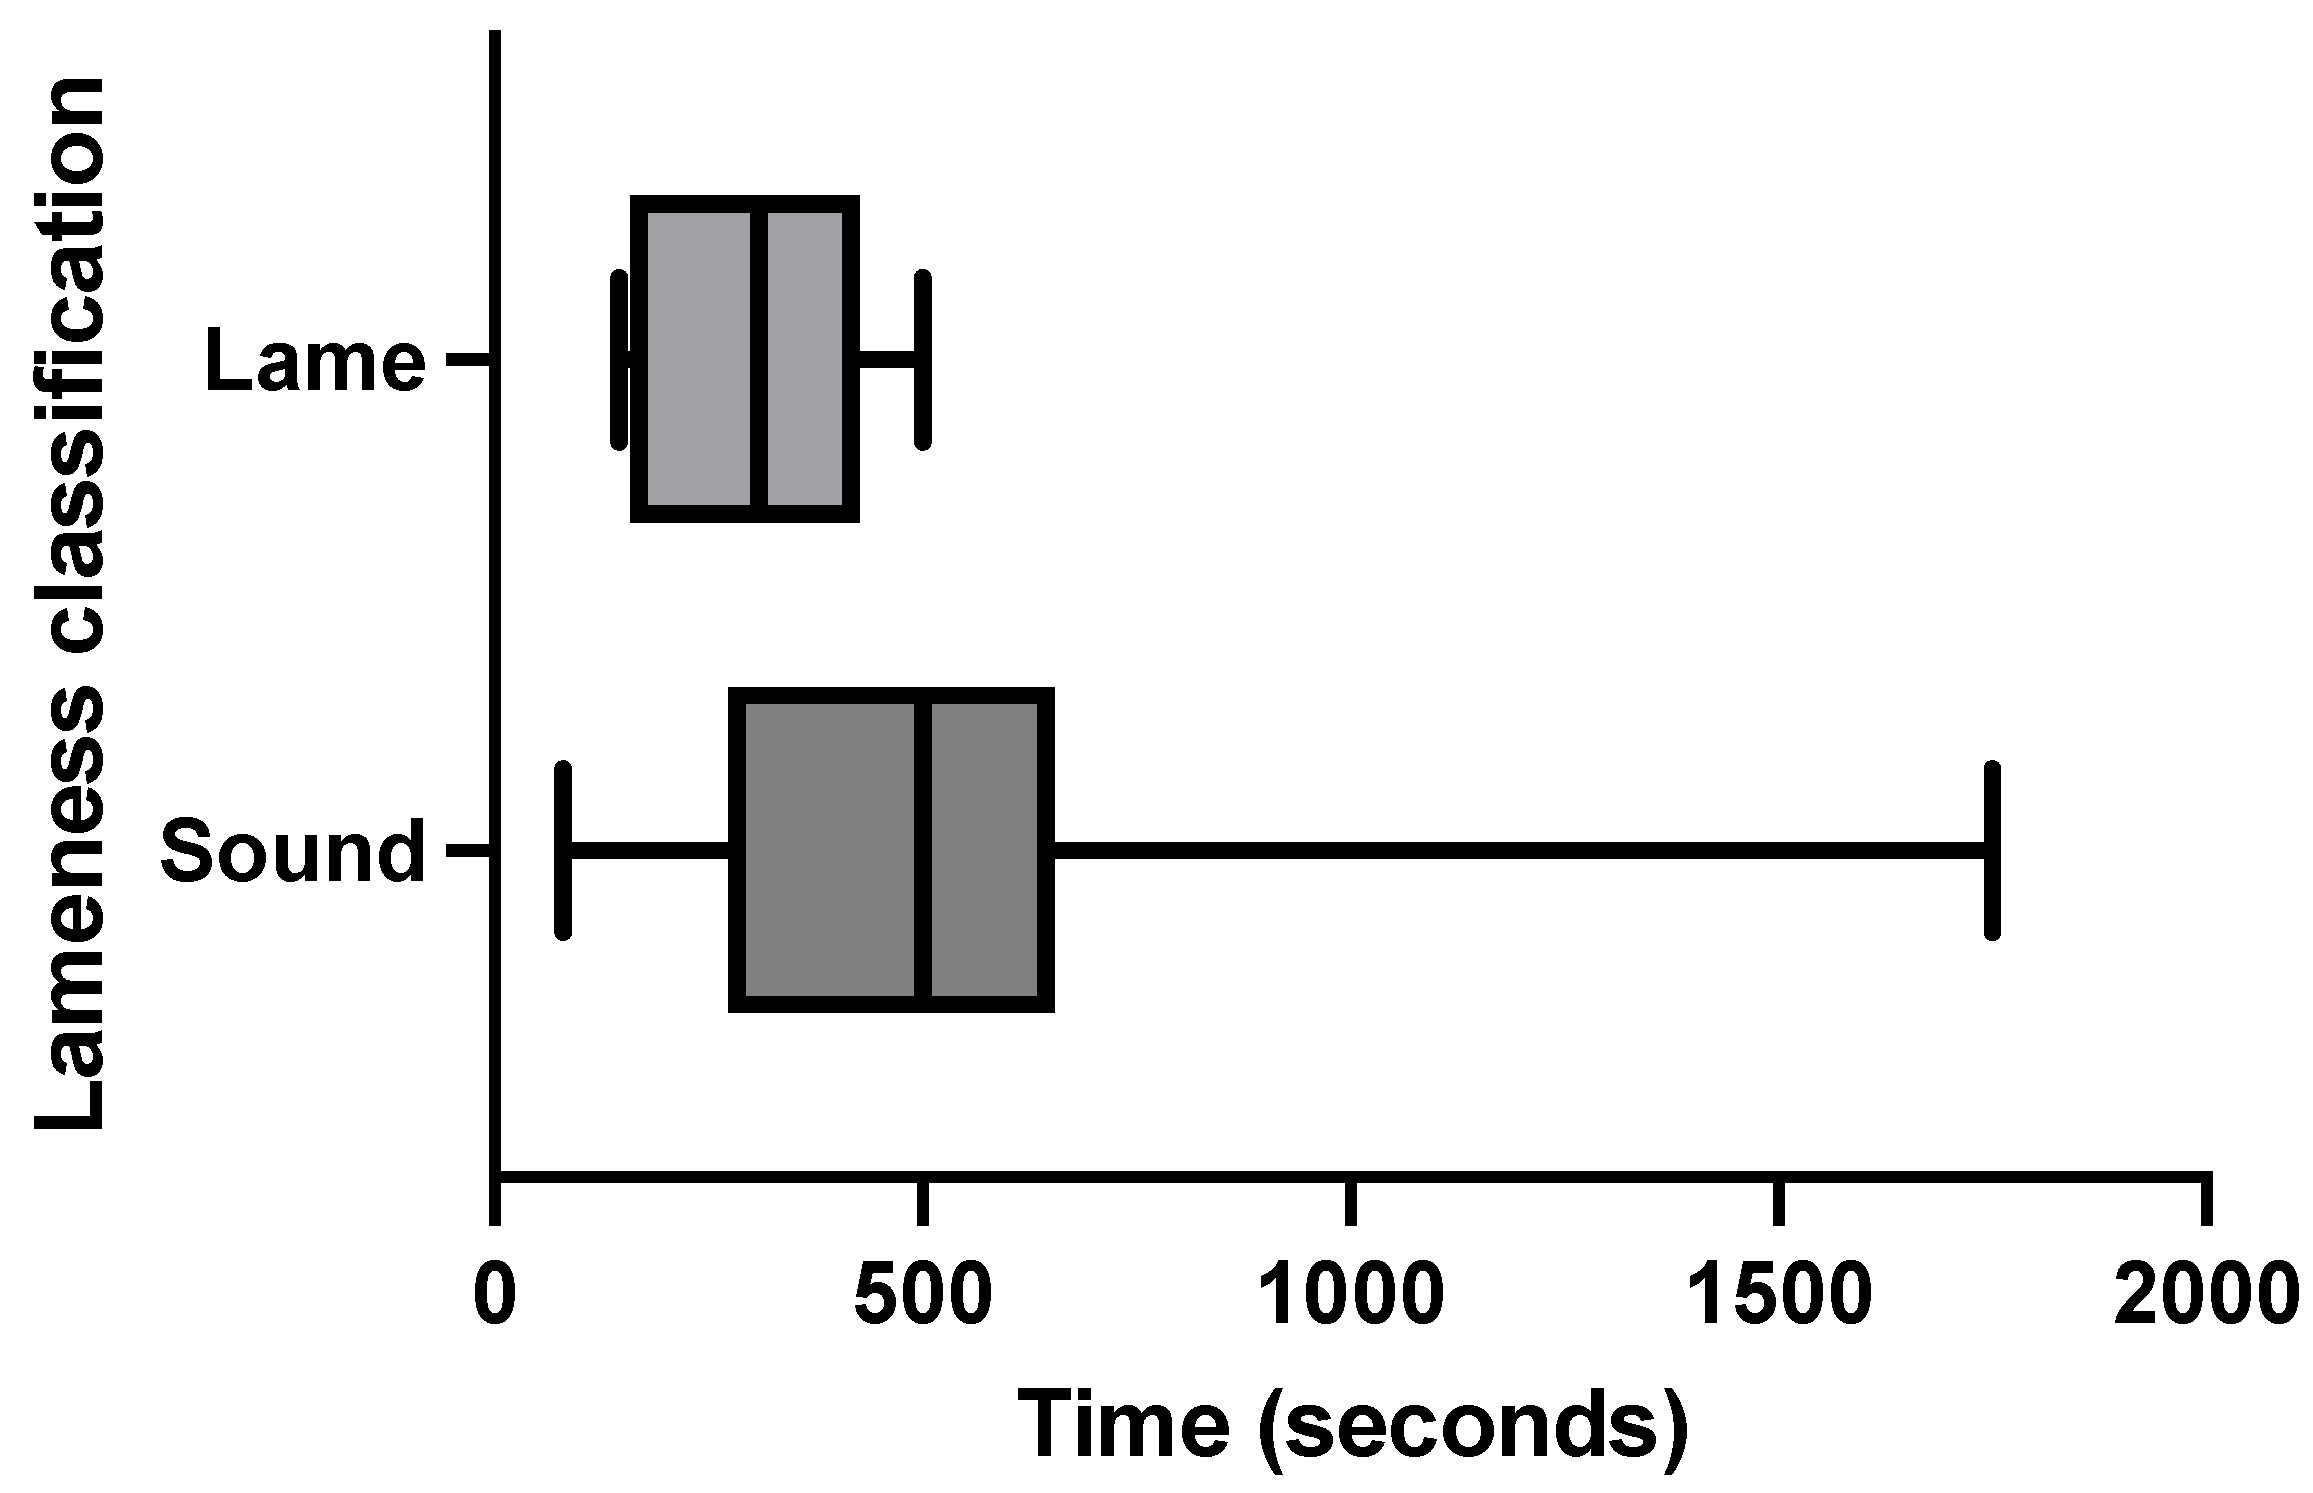
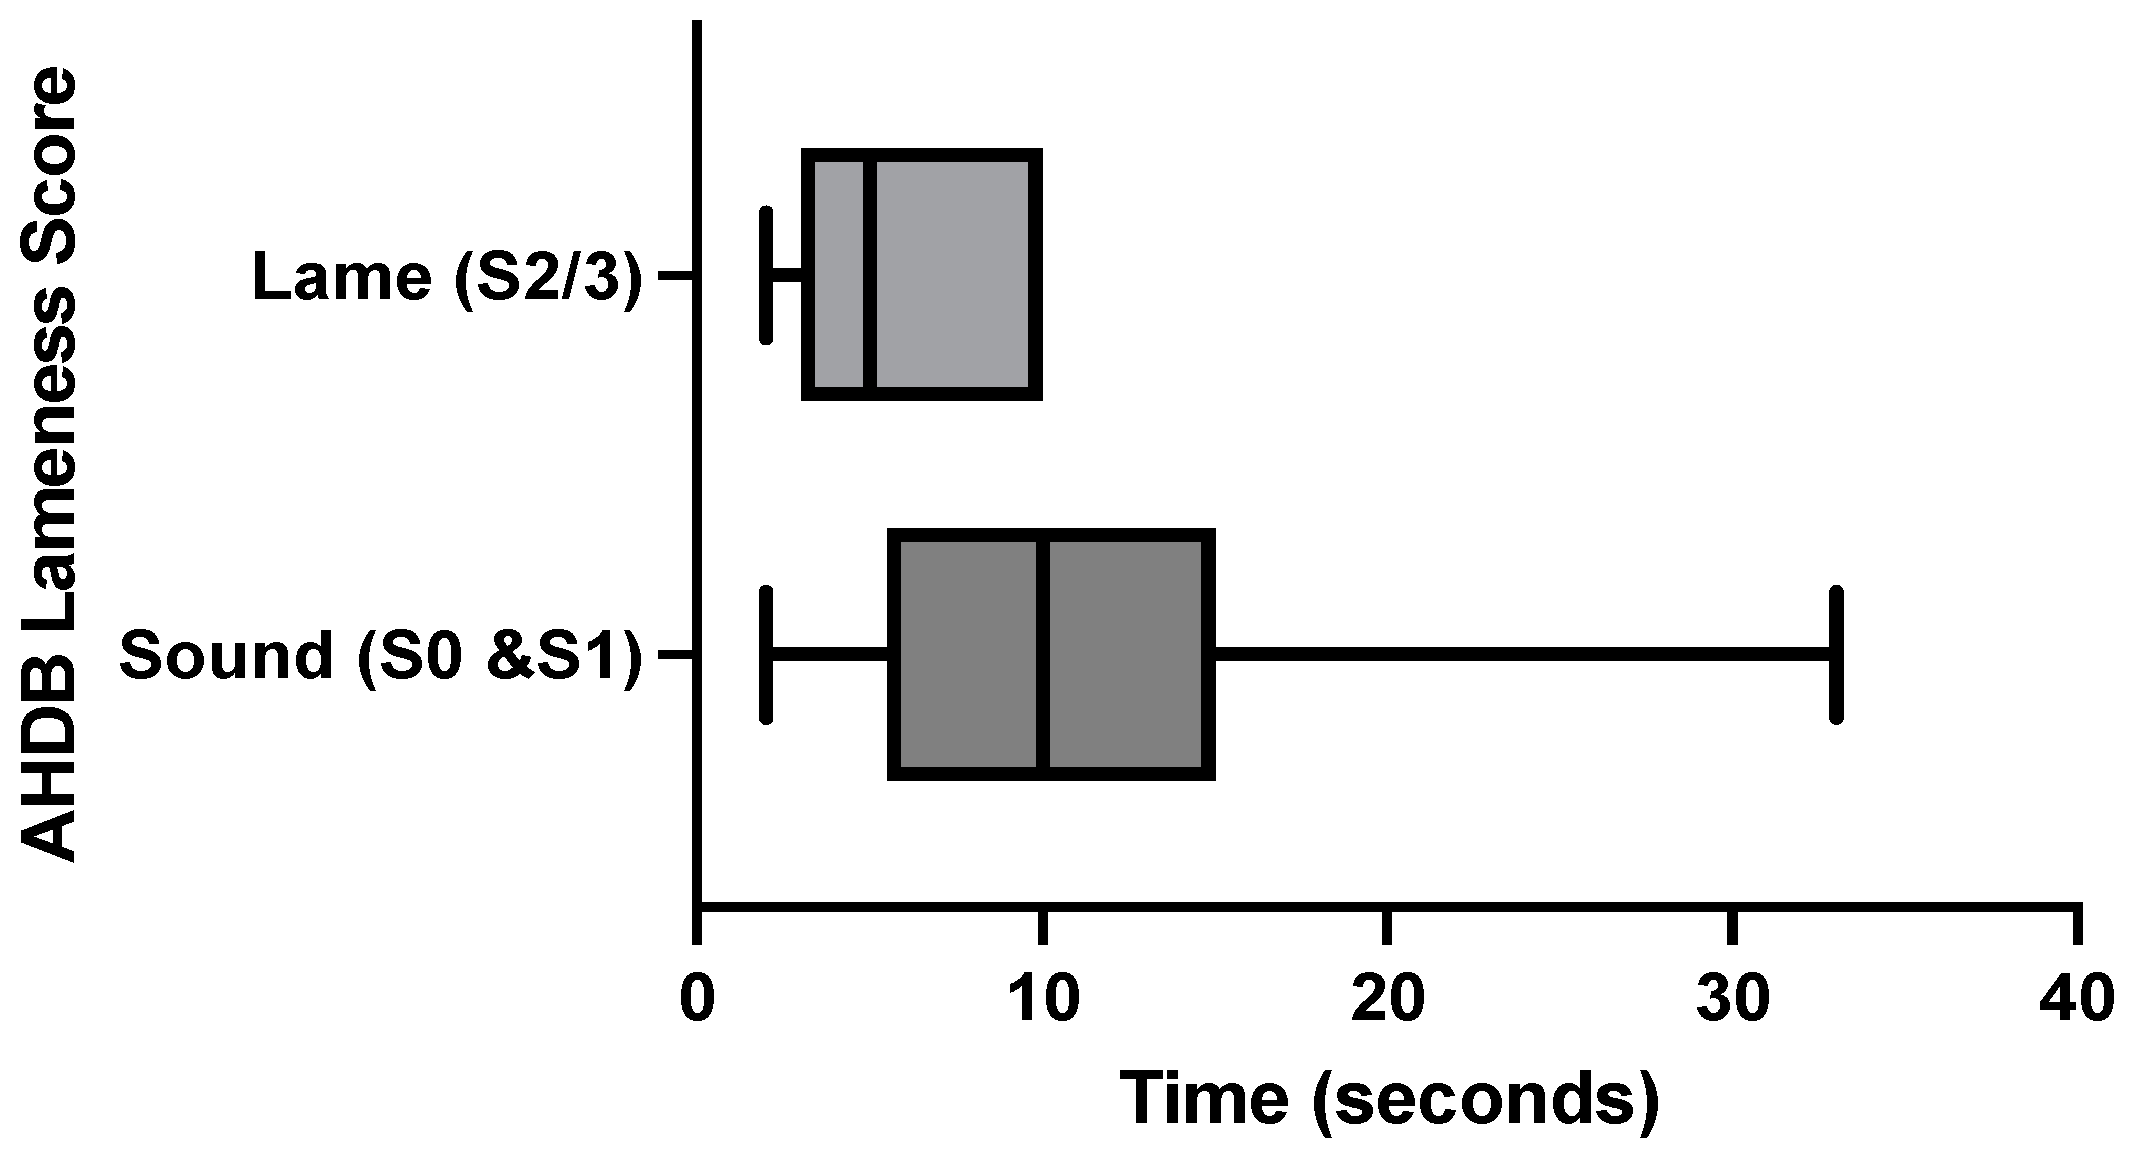
Due to low levels of lameness identified on the farm (n = 6), the only statistically feasible evaluation was between hind limb lameness (n = 5) and the quarter interacting with the brush (areas 1, 2, 3 and 4). No statistically relevant data were identified between any of the areas (p = 0.6954). A further assessment of the front (areas 1 and 2) vs. rear (areas 3 and 4) interactions for the hind limb lame animals were also analysed, and no statistically significant variation was found (p = 0.3566). This was also the case when the front quarter (area 1) interaction was compared with interactions made with the rest of the body (areas 2, 3 and 4) (p = 0.4414). On a general level, the total time per individual (n = 48) spent brushing was assessed against their lameness score (Figure 4). There were no statistically relevant differences when all groups (S0, S1 and S2/3) were assessed together (p = 0.1575). However, when the total time per individual was divided by sound (S0 and S1) and lame (S2/3) animals, a tendency towards a difference was noted (p = 0.0689) in favour of the sound animals (Table 4). There was no statistically relevant difference between the numbers of visits per individual when compared against the lameness score (n = 48). But the time spent per visit did yield a significant result (p = 0.0358) when all three groups were compared (S0 = 95.86 ± 9.228 s, S1 = 104 ± 7.086 s and S2/3 = 63.03 ± 9.220 s). Additionally, significant result indicated a notably reduced time per visit for S2/3 animals (Table 4). This was further confirmed by the comparison of sound (S0 and S1 (91.66 ± 6.060 s) to lame (S2/3 (63.03 ± 9.220 s) animals (p = 0.0097) (Table 4). The number of individual interactions that each individual carried out was assessed against all lameness scores (from 22 February 2023), and no statistically relevant result was gained (p = 0.1474). When separated into sound and lame animals, a tendency towards a difference (p = 0.0509) (Table 4) was identified, pointing towards higher numbers of individual interactions being carried out by the sound cows (Figure 5).
A statistical tendency (p = 0.0689) was identified between the time that the sound (S0 and S1) cows spent brushing and the time that the lame (S2/3) cows spent brushing over the 36 h observation period.
A tendency towards a difference (p = 0.0509) was identified pointing towards higher numbers of individual interactions being carried out by the sound cows.

4. Discussion

Utilising the AHDB classification of lameness [5], an animal is not referred to as lame until they are an S2 or S3. Meaning that at the time of observation, the herd lameness level on the farm was 11.8%. The sample lameness prevalence was slightly higher at 14.6% but still well below the reported UK average of between 25% and 31.6% [10,11,12]. This indicates that at this point in time, the on-farm protocol for lameness prevention, detection and treatment is performing well. This included routine lameness scoring by ROMS-trained staff and prompt action on reported issues, regular foot trimming and regular foot bathing (carried out upon exit from the parlour). Although this is below the national average of 14.6% of animals, it still represents a significant cost/loss of earnings to the farm of between GBP 770 and GBP 3640 [13,14]. The animals identified as lame were identified as having a statically significant reduction in the time that they spent utilising the brush per visit when compared to the sound animals (63.03 ± 9.220 s for the lame cows compared to 91.66 ± 6.060 s for the sound cows). Also, a statistical tendency (reduction) was identified with respect to the number of interactions and the total time spent interacting with a brush over a given period for the lame cows compared to the sound cows, which supports previous research that indicated that a reduction in brush use occurred when an animal became lame [20,27] or sick [20,27,31]. Despite the aforementioned significant difference in time spent brushing per visit, there was no identifiable relationship between the regions brushed and the location of the lameness.
Due to the statistical significance and tendencies towards a difference identified between the data sets (number and duration of visits for both sound (S0 and S1) and lame (S2/3)) the hypothesis that the reduction in brush use and location brushed could be used to aid with identification of potential lameness and the location associated with the lameness has been partially upheld. Brush use can be used to identify lame animals, but not to localise the lameness. The small sample size and below average lameness prevalence may have impacted the findings. However, as this study represents only a snapshot in time, future studies that encompass multiple herds covering a prolonged time period may elaborate further on the relationship between lameness status and brush use. The literature suggests that an increase in group size reduces brush use on a per cow level (570 ± 90 s/cow/24 h for 24 cows, 550 ± 130 s/cow/24 h, 420 ± 105 s/cow/24 h for 48 cows (most comparable to this study of 265.06 s/cow/24 h for 49 cows) and 456 ± 60 s/cow/24 h for 60 cows) [19], brush-to-cow ratio (mean times as for preceding group size data with ratios of 1 brush to 12 cows (1:12), 1:18, 1:24 and 1:30, respectively) [19] and brush position both within the pen and in relation to other high value items (e.g., feed or water). The further from the high-value items, the less likely the brush is to be utilised (decrease of 1.4 ± 0.5 min/day/cow) to the point that lame animals (S2/3) may choose to only use brushes located near other high value items (3 m vs. 16 m from the feed stall) [19,27], which may affect the frequency and duration of brush use [19,27]. Thus, any further study should ensure that multilocation data are comparable by accounting for the above. Additionally, further studies may also wish to incorporate pre-existing automated lameness detection methods such as lying time, standing time, gait assessment and feeding behaviour [3,38]. Future longitudinal studies may also wish to consider the impact of dominance on individual cows’ brush interactions [33] and, as such, individual cow data covering a prolonged period of soundness and then a period of lameness may be required to identify specific boundaries for automated monitoring. Future studies may also wish to assess variables such as lactation number and stage as well as previous disease to assess the potential impact this may have on brush use.
Despite the hypothesis not being fully upheld, the data gathered in this study appears in general terms comparable to previous literature, with no significant difference found between day and night brush use [19]. The mean time spent interacting with the brush/individual/day of 265 s falls within a similar range to previous studies. Other studies have observed a brush interaction of 138 s [31], 342 s [18] and 420 (±105) seconds [19], the latter being most comparable as a similar-sized herd (n = 48) was observed [19].
Further interpretation of the data could indicate that although a tendency towards a difference was identified with the number of interactions, the lack of significant difference between the sound and lame cows with respect to the number of visits to a brush suggests that cows place a high value on brush use. This supports other findings that indicate that cows are willing to push as much weight into accessing brushes as they are to accessing feed [19]. The literature also states that frequency of displacement at automatic brushes was up to six times higher than displacement at feeders [24,39]. Displacement was not directly monitored but was anecdotally observed and noted on multiple occasions.
As a result, it could be tentatively inferred that cows are willing to prioritise brush use (grooming behaviour) over mild discomfort from lameness. This, however, is contradicted by some literature that suggests that luxury behaviours (e.g., brush use) will be reduced even with small drops in welfare (e.g., the day of minor medical procedures, when small reductions in milk yield are detected or when minor routine changes occur in a day resulting in a reduction of available time for eating/ruminating occur) [20,26]. Further research focused on cows where lameness is later identified or where change in the lameness score is tracked could provide clarity on the value placed on brush use.
Although this study did not find a statistical link between the area brushed and lameness, it did identify a statistical difference between the areas of the cow that interacted with the brush. There was a clear preference for head and neck interaction, partially supporting previous research that identified preferences for head, neck, trunk and posterior interaction [20]. This interaction distribution also supports research that indicated a preference for brush use on harder-to-reach areas (back of the head and posterior) [24]. Further interrogation of the localisation of interactions data did not yield significant results; however, further investigation over a prolonged period of time may allow for the identification of a more localised preference. This could then be used to inform recommendations on brush height and location placement to aid with optimal cow/brush interactions.
Another anecdotal observation noted was a perceived preference for the motorised brush (brush 2) over the inoperable brush (brush 1). This supports previous research that indicated that the presence of a mechanical brush over a static brush can increase grooming behaviour up to five times [18,23]. This was especially evident after mucking out. Mucking out notably increased the height of both brushes, in particular the mechanical brush (brush 2). The pivot point for brush 1 increased from 85 cm to 115 cm and brush 2 from 85 cm to 145 cm. This appeared to make some interactions impossible. Animals were anecdotally observed approaching brush 2 and appeared to attempt to/begin to interact with it but only briefly because as they attempted to position themselves, contact with the brush was lost. In these cases, individuals often proceeded directly to brush 1 and interacted with that brush to fulfil their grooming need. Some studies have looked at the impact that brush position has on use and found that brush use increased with a reduction in group size as well as increasing when positioned closer to water and feed sources [19,24,27], and some studies looked at brush quantity, which found an increase in duration time but not the total time spent brushing [40]. The author was unable to locate any research indicating the effect of brush height on use. The manufacturer’s guidelines state that for the brush type in the study, the front lower edge of the brush should be positioned at the herd’s average withers height (providing there is no more than 20 cm variation within the herd). This recommendation appears to refer to minimising brush wear/maximising unit life rather than optimal interaction for the cow. There also appears to be no scientific research quoted on the data sheet backing up these recommendations [41]. Based on the anecdotal observations, further research in this area is likely to yield significant data and offer ways to increase a cow’s ability to access brushes, thus reducing the cost to the cow of performing luxury behaviours and, in turn, increase welfare.

5. Conclusions

Although brush use is a luxury behaviour, cows are highly motivated to carry it out. There is evidence that monitoring trends in the duration of use per visit to a brush could act as an additional aid to monitor and detect lameness/cow comfort levels on a herd basis. This is also true on an individual basis. If a system utilising brush rotation data and computer vision–based cow identification were put into place on a farm (as it is not practical or financially viable to carry out the amount of direct observations required to gain useful data on a commercial farm), then data collected could be correlated with other on-farm data-logging devices to improve the efficiency and accuracy of lameness detection/cow comfort evaluation.

Author Contributions

Conceptualization, Y.I.B. and N.B.; data curation, Y.I.B.; formal analysis, Y.I.B.; investigation, Y.I.B.; methodology, Y.I.B. and N.B.; supervision, N.B.; writing—original draft, Y.I.B.; writing—review and editing, Y.I.B. and N.B. All authors have read and agreed to the published version of the manuscript.

Funding

This research received no external funding.

Institutional Review Board Statement

The study was conducted in accordance with the Declaration of Helsinki, and approved by the Clinical Research Ethical Review Board (CRERB) of the Royal Veterinary College (CR-2023-014-2, approved 3 February 2023).

Data Availability Statement

Data are available on request from the corresponding author.

Acknowledgments

We acknowledge and thank the farm staff involved in the project.

Conflicts of Interest

The authors declare no conflicts of interest.

References

  1. Cramer, G.; Solano, L. Overview of Lameness in Cattle. 2023. Available online: https://www.msdvetmanual.com/musculoskeletal-system/lameness-in-cattle/overview-of-lameness-in-cattle#:~:text=Lameness%20is%20a%20painful%20condition,traumatic%20injuries%2C%20and%20neurologic%20disease (accessed on 25 June 2024).
  2. AHDB. Lameness and Foot Trimming. Available online: https://www.fas.scot/downloads/foot-trimming-cattle/ (accessed on 25 June 2024).
  3. Alsaaod, M.; Fadul, M.; Steiner, A. Automatic lameness detection in cattle. Vet. J. 2019, 246, 35–44. [Google Scholar] [CrossRef] [PubMed]
  4. Remnant, J.G.; Wilson, J.P. Lameness in Cattle Nick J. Bell, Sara IL Pedersen, Laura V. Randall. In Production Diseases in Farm Animals: Pathophysiology, Prophylaxis and Health Management; Springer: Cham, Switzerland, 2024; p. 377. [Google Scholar]
  5. AHDB. Mobility Score. 2020. Available online: https://projectblue.blob.core.windows.net/media/Default/Dairy/Publications/Dairy%20Mobility%20Scoresheet_200427_WEB.pdf (accessed on 12 May 2023).
  6. Shearer, J. Lameness of dairy cattle: Consequences and causes. Bov. Pract. 1998, 1998, 79–85. [Google Scholar] [CrossRef]
  7. Jubb, T.F.; Malmo, J. Lesions causing lameness requiring veterinary treatment in pasture-fed dairy cows in east Gippsland. Aust. Vet. J. 1991, 68, 21–24. [Google Scholar] [CrossRef] [PubMed]
  8. Blowey, R. Factors associated with lameness in dairy cattle. Practice 2005, 27, 154–162. [Google Scholar] [CrossRef]
  9. Murray, R.D.; Downham, D.Y.; Clarkson, M.J.; Faull, W.B.; Hughes, J.W.; Manson, F.J.; Merritt, J.B.; Russell, W.B.; Sutherst, J.E.; Ward, W.R. Epidemiology of lameness in dairy cattle: Description and analysis of foot lesions. Vet. Rec. 1996, 138, 586–591. [Google Scholar] [CrossRef] [PubMed]
  10. UFAW. Lameness in Dairy Cattle. 2023. Available online: https://www.ufaw.org.uk/why-ufaws-work-is-important/lameness (accessed on 8 May 2023).
  11. Randall, L.V.; Thomas, H.J.; Remnant, J.G.; Bollard, N.J.; Huxley, J.N. Lameness prevalence in a random sample of UK dairy herds. Vet. Rec. 2019, 184, 350. [Google Scholar] [CrossRef] [PubMed]
  12. Griffiths, B.E.; Grove White, D.; Oikonomou, G. A cross-sectional study into the prevalence of dairy cattle lameness and associated herd-level risk factors in England and Wales. Front. Vet. Sci. 2018, 5, 65. [Google Scholar] [CrossRef] [PubMed]
  13. AHDB. Lameness in Dairy Cows. 2023. Available online: https://ahdb.org.uk/knowledge-library/lameness-in-dairy-cows (accessed on 10 May 2023).
  14. Grimm, K.; Haidn, B.; Erhard, M.; Tremblay, M.; Döpfer, D. New insights into the association between lameness, behavior, and performance in Simmental cows. J. Dairy Sci. 2019, 102, 2453–2468. [Google Scholar] [CrossRef] [PubMed]
  15. Myint, B.B.; Onizuka, T.; Tin, P.; Aikawa, M.; Kobayashi, I.; Zin, T.T. Development of a real-time cattle lameness detection system using a single side-view camera. Sci. Rep. 2024, 14, 13734. [Google Scholar] [CrossRef]
  16. Georg, H.; Totschek, K. Examaning an automatic brush for dairy cows. Landtechnik 2001, 56, 260–261. [Google Scholar]
  17. Mandel, R.; Whay, H.R.; Klement, E.; Nicol, C.J. Invited review: Environmental enrichment of dairy cows and calves in indoor housing. J. Dairy Sci. 2016, 99, 1695–1715. [Google Scholar] [CrossRef] [PubMed]
  18. DeVries, T.; Vankova, M.; Veira, D.; Von Keyserlingk, M. Usage of mechanical brushes by lactating dairy cows. J. Dairy Sci. 2007, 90, 2241–2245. [Google Scholar] [CrossRef] [PubMed]
  19. Foris, B.; Sadrzadeh, N.; Krahn, J.; Weary, D.M.; von Keyserlingk, M.A.G. The Effect of Placement and Group Size on the Use of an Automated Brush by Groups of Lactating Dairy Cattle. Animals 2023, 13, 760. [Google Scholar] [CrossRef]
  20. Toaff-Rosenstein, R.L.; Velez, M.; Tucker, C.B. Technical note: Use of an automated grooming brush by heifers and potential for radiofrequency identification-based measurements of this behavior. J. Dairy Sci. 2017, 100, 8430–8437. [Google Scholar] [CrossRef] [PubMed]
  21. Simonsen, H. Grooming behaviour of domestic cattle. Nord. Veterina. 1979, 31, 1–5. [Google Scholar]
  22. Ewing, S.A.; Lay, D.C.; Von Borell, E. Farm Animal Well-Being: Stress Physiology, Animal Behavior, and Environmental Design; Prentice Hall: Upper Saddle River, NJ, USA, 1999. [Google Scholar]
  23. Schukken, Y.H.; Young, G.D. Field Study on Milk Production and Mastitis Effect of the DeLaval Swinging Cow Brush; DeLaval: Tumba, Sweden, 2009; pp. 1–26. [Google Scholar]
  24. Mandel, R.; Whay, H.R.; Nicol, C.J.; Klement, E. The effect of food location, heat load, and intrusive medical procedures on brushing activity in dairy cows. J. Dairy Sci. 2013, 96, 6506–6513. [Google Scholar] [CrossRef]
  25. McConnachie, E.; Smid, A.M.C.; Thompson, A.J.; Weary, D.M.; Gaworski, M.A.; von Keyserlingk, M.A.G. Cows are highly motivated to access a grooming substrate. Biol. Lett. 2018, 14, 20180303. [Google Scholar] [CrossRef] [PubMed]
  26. Keeling, L.; De Oliveira, D.; Rustas, B. Use of mechanical rotating brushes in dairy cows—A potential proxy for performance and welfare. In Precision Dairy Farming; Wageningen Academic: Gelderland, The Netherlands, 2016; p. 343. [Google Scholar]
  27. Mandel, R.; Harazy, H.; Gygax, L.; Nicol, C.J.; Ben-David, A.; Whay, H.R.; Klement, E. Short communication: Detection of lameness in dairy cows using a grooming device. J. Dairy Sci. 2018, 101, 1511–1517. [Google Scholar] [CrossRef]
  28. Weary, D.; Huzzey, J.; Von Keyserlingk, M. Board-invited review: Using behavior to predict and identify ill health in animals. J. Anim. Sci. 2009, 87, 770–777. [Google Scholar] [CrossRef]
  29. McFarland, D. Animal Behaviour: Psychobiology, Ethology, and Evolution; Longman: London, UK, 1999; Volume 3. [Google Scholar]
  30. Dawkins, M.S. From an Animals Point of View-Motivation, Fitness and Animal-Welfare [review]. Behav. Brain Sci. 1990, 13, 1–9. [Google Scholar] [CrossRef]
  31. Mandel, R.; Nicol, C.J.; Whay, H.R.; Klement, E. Short communication: Detection and monitoring of metritis in dairy cows using an automated grooming device. J. Dairy Sci. 2017, 100, 5724–5728. [Google Scholar] [CrossRef] [PubMed]
  32. Toaff-Rosenstein, R.L.; Gershwin, L.J.; Zanella, A.J.; Tucker, C.B. Characterizing the BRD sickness response: Opportunities for improved disease detection. In Proceedings of the American Association of Bovine Practitioners Conference Proceedings, Albuquerque, NM, USA, 18–20 September 2014. [Google Scholar]
  33. Foris, B.; Lecorps, B.; Krahn, J.; Weary, D.M.; von Keyserlingk, M.A. The effects of cow dominance on the use of a mechanical brush. Sci. Rep. 2021, 11, 22987. [Google Scholar] [CrossRef] [PubMed]
  34. Sadrzadeh, N.; Foris, B.; Krahn, J.; von Keyserlingk, M.A.G.; Weary, D.M. Automated monitoring of brush use in dairy cattle. PLoS ONE 2024, 19, e0305671. [Google Scholar] [CrossRef] [PubMed]
  35. Ferlizza, E.; Fasoli, S.; Cavallini, D.; Bolcato, M.; Andreani, G.; Isani, G. Preliminary study on urine chemistry and protein profile in cows and heifers. Pak. Vet. J. 2020, 40, 413–418. [Google Scholar] [CrossRef]
  36. Felini, R.; Cavallini, D.; Buonaiuto, G.; Bordin, T. Assessing the impact of thermoregulatory mineral supplementation on thermal comfort in lactating Holstein cows. Vet. Anim. Sci. 2024, 24, 100363. [Google Scholar] [CrossRef] [PubMed]
  37. Raspa, F.; Chessa, S.; Bergero, D.; Sacchi, P.; Ferrocino, I.; Cocolin, L.; Corvaglia, M.R.; Moretti, R.; Cavallini, D.; Valle, E. Microbiota characterization throughout the digestive tract of horses fed a high-fiber vs. a high-starch diet. Front. Vet. Sci. 2024, 11, 1386135. [Google Scholar] [CrossRef] [PubMed]
  38. O’Leary, N.W.; Byrne, D.T.; O’Connor, A.H.; Shalloo, L. Invited review: Cattle lameness detection with accelerometers. J. Dairy Sci. 2020, 103, 3895–3911. [Google Scholar] [CrossRef] [PubMed]
  39. Val-Laillet, D.; Veira, D.M.; von Keyserlingk, M.A. Short communication: Dominance in free-stall-housed dairy cattle is dependent upon resource. J. Dairy Sci. 2008, 91, 3922–3926. [Google Scholar] [CrossRef]
  40. Reyes, F.S.; Gimenez, A.R.; Anderson, K.M.; Miller-Cushon, E.K.; Dorea, J.R.; Van Os, J.M.C. Impact of Stationary Brush Quantity on Brush Use in Group-Housed Dairy Heifers. Animals 2022, 12, 972. [Google Scholar] [CrossRef]
  41. Kerbl. Happycow Uno Data Sheet. 2021. Available online: http://kerbl.com/ftp/product-doc/180782.pdf (accessed on 14 May 2023).
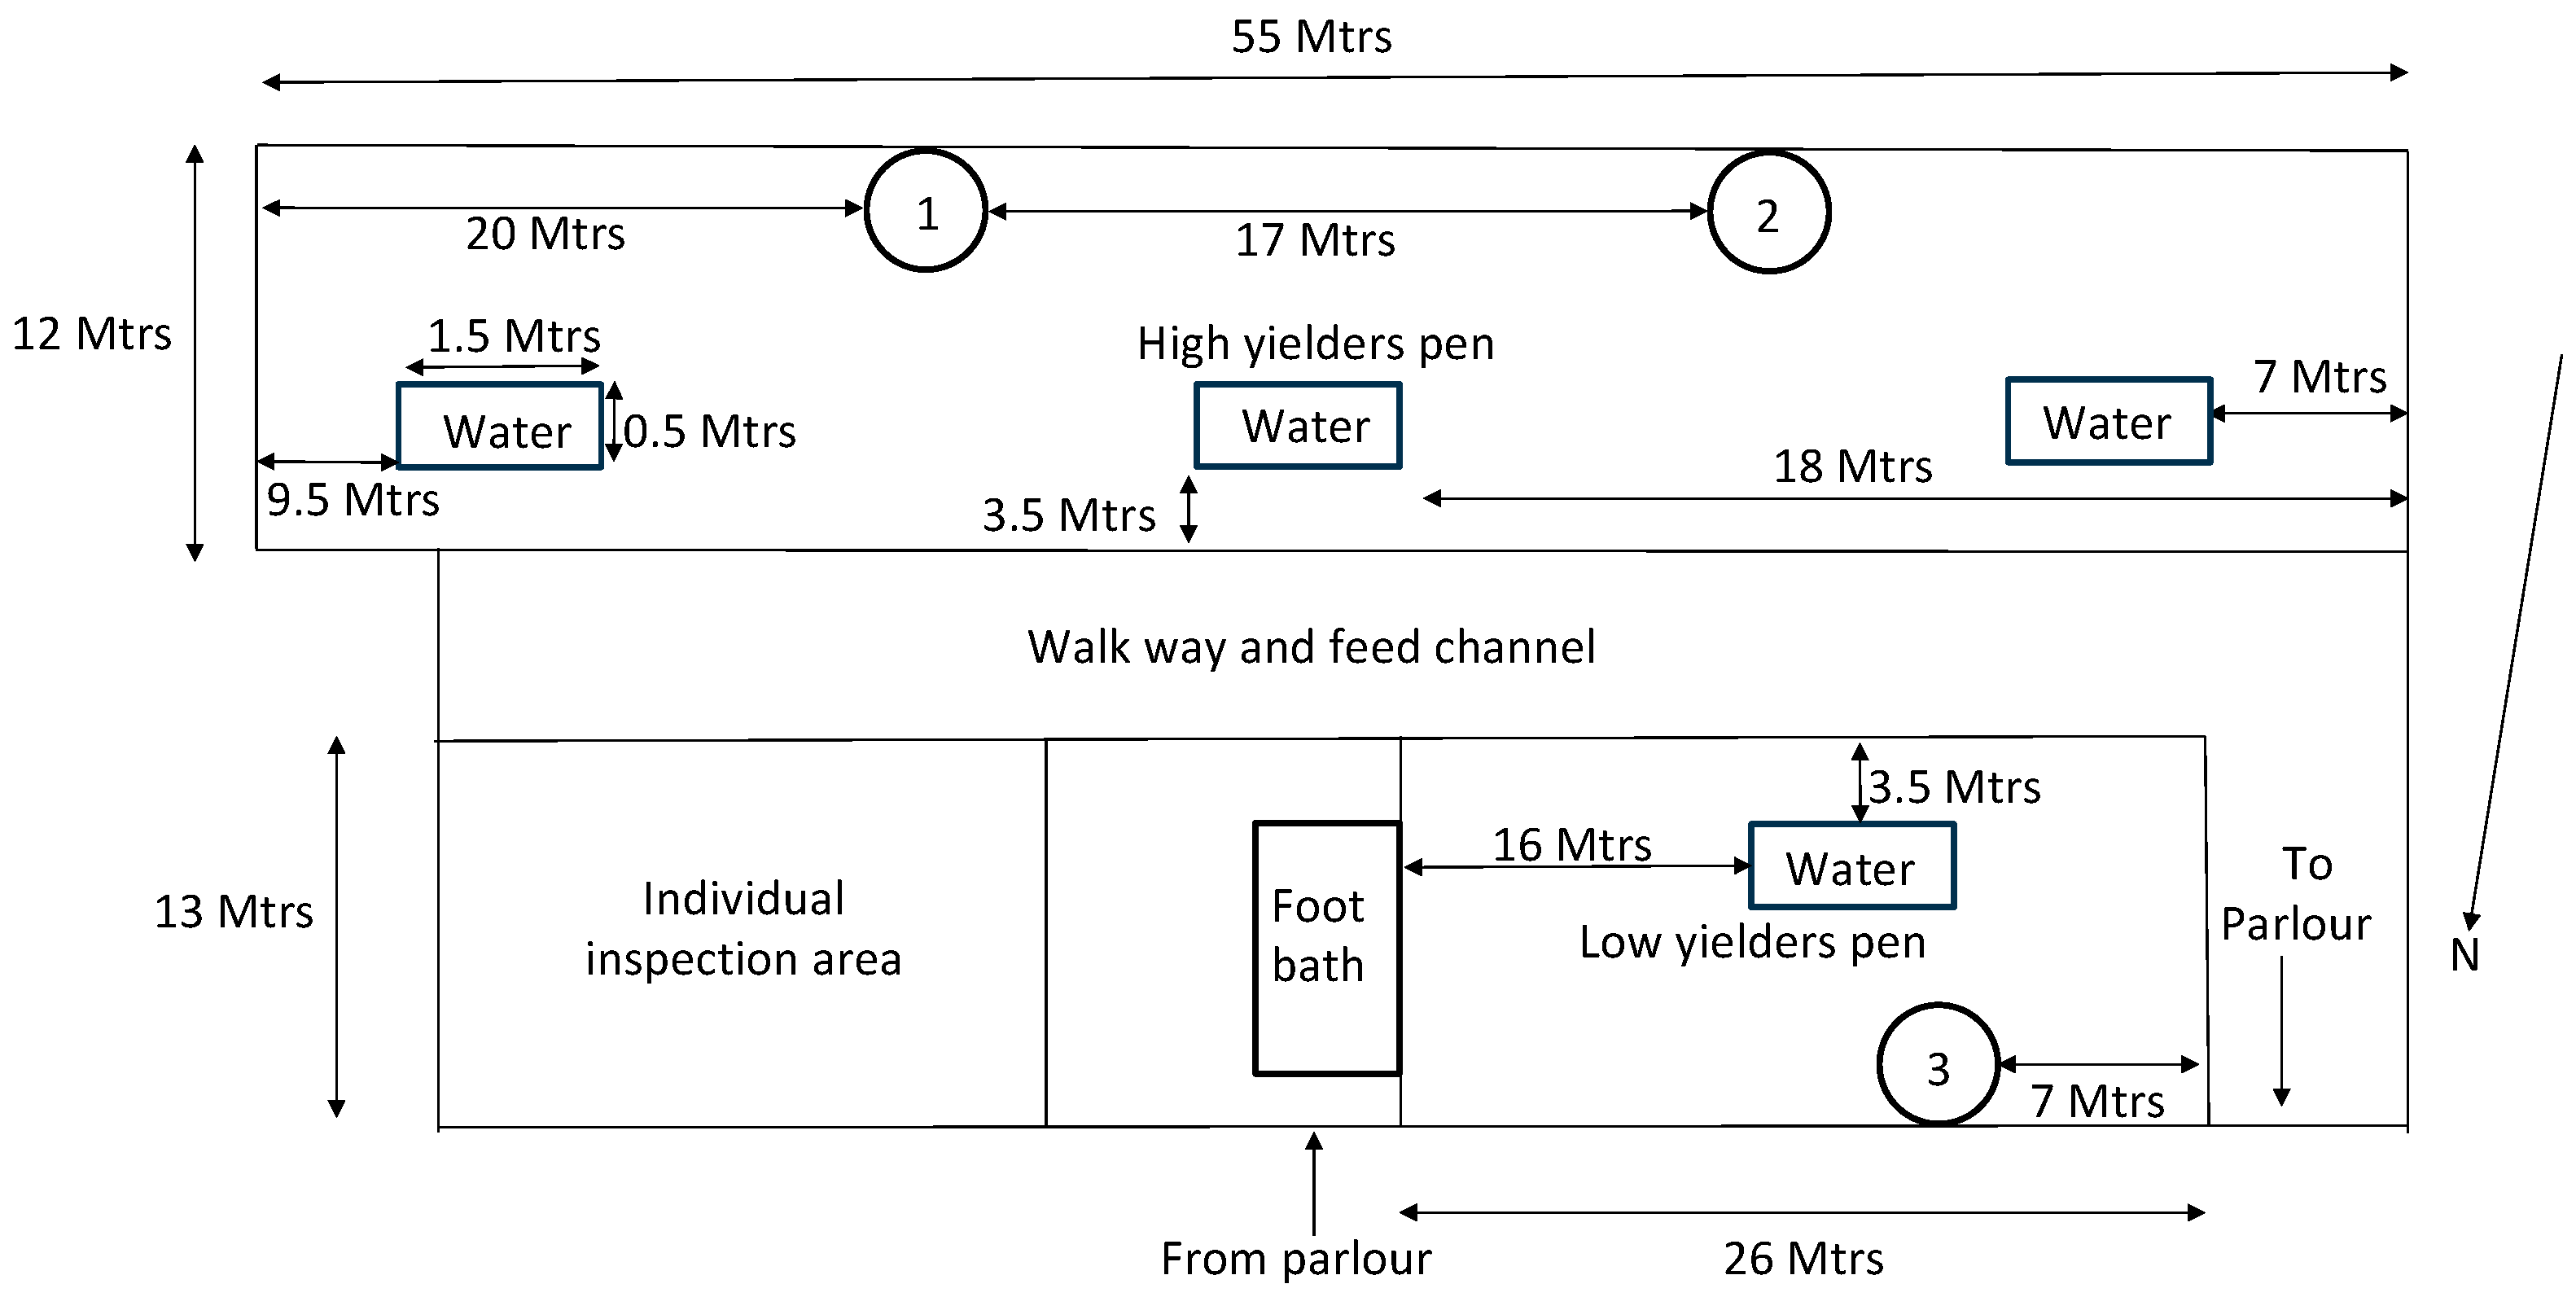
Figure 1. Loose-housing layout and brush position on the study farm. Included are the positions of the “Happy cow brush” mechanical brushes (numbered 1, 2 and 3). Brush 1 and 3 were inoperable at the time of investigation and therefore acted as static angled round brushes. Brush 2 was in full working order and would rotate when the cows interacted with it.
Ruminants 04 00027 g001
Figure 2. Cows were divided into eight areas to record the interaction with the brush. (Image adapted from Leon von Salisch, CC BY-SA 4.0 <https://creativecommons.org/licenses/by-sa/4.0>, via Wikimedia Commons accessed on 2 July 2024).
Ruminants 04 00027 g002
Figure 3. Breakdown of how the cows interacted with the brush(es). (Image adapted from Leon von Salisch, CC BY-SA 4.0 <https://creativecommons.org/licenses/by-sa/4.0>, via Wikimedia Commons, assessed 2 July 2024).
Ruminants 04 00027 g003
Figure 4. Total time spent brushing per individual (n = 48) separated by the lameness score (sound cows (n = 41) have an AHDB score of 0 or 1, lame cows (n = 7) have an AHDB score of 2 or 3 based on data from 22 February 2023).
Ruminants 04 00027 g004
Figure 5. Number of individual interactions (per individual) against lameness status (based on an AHDB scoring on 22 February 2023).
Ruminants 04 00027 g005
Table 1. Observation data showing the duration and quantity of individual visits to the brush.
Observation Window (n = 49 Cows)Total Time Brush in UseInteractions (Total and Mean per Cow)Visits (Total and Mean per Cow)Mean Interaction Time per IndividualMean Visits Time per Individual
All (72 h)10:49:24784
(16.0/cow)
442
(9.02/cow)
49.70 s88.15 s
7 am–7 pm
(36 h—live)
6:43:47508
(10.37/cow)
277
(5.56/cow)
47.69 s87.46 s
7 pm–7 am
(36 h—video)
4:05:37274
(5.91/cow)
165
(3.37/cow)
53.78 s89.32 s
Table 2. Lameness prevalence by group and whole herd.
Date AssessedGroupS0S1S2S3Lameness Prevalence
22 February 2023Herd
n = 68
34
(50%)
26
(38.2%)
7
(10.3%)
1
(1.5%)
11.8%
22 February 2023Sample
n = 48
22
(45.8%)
19
(39.6%)
6
(12.5%)
1
(2.1%)
14.6%
6 March 2023Herd
n = 64
16
(25%)
39
(60.9%)
8
(12.5%)
1
(1.6%)
14.1%
6 March 2023Sample
n = 41
10
(24.4%)
25
(61%)
5
(12.2%)
1
(2.4%)
14.6%
Table 3. Notable differences between areas that the cow chose to interact with the brush.
Comparison (A vs. B)ABp-Value
L1/R1 vs. L1 (n = 106 vs. 206)74.66 ± 5.43140.05 ± 1.804<0.0001
L1/R1 vs. R1 (n = 106 vs. 183)74.66 ± 5.43144.23 ± 2.523<0.0001
L1/R1 vs. L2 (n = 106 vs. 49)74.66 ± 5.43141.41 ± 4.364<0.0001
L1/R1 vs. R2 (n = 106 vs. 57)74.66 ± 5.43135.68 ± 2.711<0.0001
L1/R1 vs. L3 (n = 106 vs. 45)74.66 ± 5.43160.44 ± 14.250.0203
L1/R1 vs. R3 (n = 106 vs. 57)74.66 ± 5.43142.16 ± 5.056<0.0001
L1/R1 vs. L4 (n = 106 vs. 26)74.66 ± 5.43152.58 ± 10.860.1200
L1/R1 vs. R4 (n = 106 vs. 45)74.66 ± 5.43166.71 ± 11.360.2298
Table 4. Notable interactions illustrating the difference between the lame and sound cows.
Comparison (A vs. B (vs. C))ABCp-Value
Interactions per individual A n = 48
Sound (S0 and S1) (A) vs. Lame (S2/3) (B)
11.32 ± 1.1006.286 ± 1.267-0.0509 *
Visit duration (s) B n = 48
S0 (A) vs. S1 (B) vs. S2/3 (C)
95.86 ± 9.228104 ± 7.08663.03 +/− 9.2200.0358
Visit duration (s) C n = 29
S0 (A) vs. S2/3 (B)
95.86 ± 9.22863.03 ± 9.220-0.0353
Visit duration (s) A n = 48
Sound (S0 and S1) (A) vs. Lame (S2/3) (B)
91.66 ± 6.06063.03 ± 9.220-0.0097
Total duration per individual A (S)
Sound (S0 and S1) (A) vs. Lame (S2/3) (B)
536.6 ± 57.80306.1 ± 54.67-0.0689 *
Interaction duration (s) A n = 49
Head (1) (A) vs. Rest of the body (2, 3 and 4) (B)
49.01 ± 1.77248.58 ± 3.444-0.0532 *
The above data were analysed using the Mann–Whitney test (A), Kruskal–Wallis test (B) and Dunn’s multiple comparison test (C). A result of p = <0.05 was considered statistically significant, and a result of between p = 0.10 and p = 0.05 was considered to have a tendency towards a difference (*). A, B and C represent mean values; ± represents the standard error.
Disclaimer/Publisher’s Note: The statements, opinions and data contained in all publications are solely those of the individual author(s) and contributor(s) and not of MDPI and/or the editor(s). MDPI and/or the editor(s) disclaim responsibility for any injury to people or property resulting from any ideas, methods, instructions or products referred to in the content.