Article

The Cattle Trading Network and Its Effect on the Spread of Brucellosis in Paraná, Brazil

by
Diego Leonardo Rodrigues
1,*,
Nelly Marquetoux
2,
José Henrique de Hildebrand Grisi Filho
3 and
José Soares Ferreira Neto
3
1
Ministry of Agriculture and Livestock of Brazil, Curitiba 82820-000, Brazil
2
Epicentre, Massey University, Palmerston North 4474, New Zealand
3
Department of Preventive Veterinary and Animal Health, University of São Paulo—WOAH Collaborating Centre for Economics of Animal Health in the Americas Region, São Paulo 05508-270, Brazil
*
Author to whom correspondence should be addressed.
Ruminants 2023, 3(3), 202-213; https://doi.org/10.3390/ruminants3030019
Submission received: 29 June 2023 / Revised: 11 August 2023 / Accepted: 23 August 2023 / Published: 25 August 2023
(This article belongs to the Special Issue Disease Diagnostics and Surveillance in Ruminants)

Abstract

:
This study analyzed the cattle trade network in Paraná, Brazil, for the years 2018 and 2019 to identify potential movement patterns that could contribute to the spread of brucellosis among farms. The brucellosis statuses of 1757 farms were incorporated into the analysis. Network parameters of farms with a known brucellosis infection status were statistically compared between infected and non-infected farms using traditional techniques and the quadratic assignment procedure. A multilinear regression model (MLR) was used to consider known risk factors for brucellosis infection in conjunction with the network parameters. The cattle trade network in Paraná during the study period comprised 115,296 farms linked by 608,807 cattle shipments. The movement pattern was marked by a high concentration of movements to and from a small percentage of farms. The existence of such highly connected farms could facilitate the transmission of communicable diseases via the cattle trade in Paraná. The trading communities in Paraná exhibited a spatial pattern, with proximate farms more likely to engage in trade. Brucellosis-infected farms traded more frequently than non-infected farms (odds ratio [OR] 3.61), supplied cattle to other farms more often than the regional average (OR 2.12), and received more cattle (OR 2.78). The in-degree and out-degree were associated with brucellosis infection on the farm. The mean shortest path between infected farms was significantly shorter than that between non-infected farms (4.14 versus 4.49, p = 0.004, OR 1.39). In the MLR, a higher out-degree was positively associated with infected farms after accounting for previously identified risk factors. This novel information offers insights into the factors driving the current endemic situation in the study area and can inform the development of targeted animal health policies.

1. Introduction

Bovine brucellosis, a significant reproductive disease, is globally distributed. However, it is presumed that certain European countries, in addition to Canada, Japan, Australia, and New Zealand, are free from the causative agent [1]. This accomplishment was attained through rigorous control programs that combined testing and measures to regulate animal movements [2].
In Brazil, brucellosis is endemic in cattle [3]. In the state of Paraná, the herd prevalence was estimated at 4.9% [95% confidence interval [CI] 4.0–5.9%], and the animal prevalence was estimated at 2.2% [95% CI 1.5–3.4%] [4].
In a study examining potential risk factors for brucellosis in Brazil, Alencar Mota et al. [5] discovered that farms acquiring cattle from other farms, as well as those with larger herds, were more susceptible to brucellosis infection. However, no research has specifically investigated the impact of cattle movements on farm-level brucellosis infection in the state of Paraná.
The transportation of livestock between farms or markets significantly influences the dissemination of numerous transmissible pathogens within animal populations [6]. By mapping the movement of potential infection sources, stakeholders can make informed decisions about disease spread risks and improve risk-based surveillance [7]. Moreover, understanding the parameters that characterize movement patterns can highlight the primary disease transmission pathways in a specific area and enable temporal comparisons to determine whether the network is evolving over time [8].
Thus, we aimed to examine the cattle trade network in Paraná, Brazil, during 2018 and 2019, identify associations between farm-level infection status for brucellosis and the pattern of cattle movement, and provide information that can inform control policies against brucellosis in Brazil.

2. Materials and Methods

2.1. Study Area and Population

The research was conducted in the state of Paraná, located in southern Brazil (Figure 1). The target population comprised all bovines and buffalos, collectively referred to as cattle, that were registered on farms situated within the region. Spanning a geographical area of 199,305 km2, Paraná housed a cattle population of 8,397,219 in 2017, accounting for 4.8% of the national herd. The state boasts the eighth largest bovine population and ranks third in milk production nationwide [9].

2.2. Farm-Level Brucellosis Status

In 2019, random, two-level (cattle and farm) sampling of farms in Paraná was conducted to identify herds seropositive for anti-Brucella antibodies. Out of the 1757 farms tested, 95 were found to be infected [4], resulting in a farm infection prevalence of 4.87% (95% CI 3.98–5.93%)—please refer to the Supplementary Materials section for raw data. The data obtained from this serological survey were utilized to determine the farm-level brucellosis status for our social network analysis (SNA) study.

2.3. Data of Cattle Movement

In Brazil, cattle movements are mandatorily registered. The Official Veterinary Service of the state (Agência de Defesa Agropecuária do Paraná—ADAPAR) supplied data on all cattle movements originating in the state of Paraná from 1 January 2018 to 31 December 2019. These data included the number of animals per shipment, species, origin, destination, and the purpose of the movement. We utilized these data to construct a static directed network of cattle movement between farms, with each shipment considered a direct link between the origin and destination farms. However, certain movements were excluded from the dataset: those to a slaughter plant, those to and from a farm outside of the state of Paraná, and those to or from a farm lacking a unique farm identifier or geocoding. Although these movements were not included in the network analysis, they were analyzed as described below.

2.4. Analysis of the Full Network

The network parameters were computed for the entire network of farms, irrespective of their brucellosis status. Each farm’s centrality metrics within the network were evaluated (Table 1). Additionally, we identified tightly interconnected communities of farms using their geocoding data. We employed a method outlined by Blondel et al. [10] via Gephi software, which is designed to optimize the modularity of network communities. All other analyses were conducted using R software [11].

2.5. Association between Movements of Cattle and Brucellosis Infection

Network metrics of brucellosis-infected and non-infected farms were compared using the Mann–Whitney test, with a confidence level of 0.95. This two-tailed test was adjusted using the Bonferroni method.
The movements of cattle to and from farms with a known brucellosis status were documented. The association between these cattle movements and the brucellosis status of the farm was evaluated using a Z-test and by calculating the odds ratio (OR). Notably, the network analysis was confined to farm-to-farm trade, which was described and analyzed independently.
Considering that the prevalence of brucellosis at the farm level in the state is 4.87%, we compared the total movements to and from farms with a known brucellosis status (infected and non-infected) with the proportion of movements to and from infected farms. This comparison was conducted to determine whether the latter group trades more frequently than the general population. This was accomplished using a Z-test and OR. Similarly, we compared movements towards temporary precincts (such as events, markets, and fairs) between infected and non-infected farms.
We performed a comparison between the number of shipments from infected farms and the average number of shipments from all farms in the region. This comparison was achieved using a Z-test and by calculating the OR.
The association between farm brucellosis status and the length of the shortest pathway [16] was tested using the quadratic assignment procedure (QAP) [17]. Standard statistical significance tests are predicated on the assumption of independent observations. However, this assumption is violated in a network where dyadic observations are inherently dependent. Conversely, the QAP offers a robust framework for testing associations for dyadic observations. We contrasted pairs where both the origin and destination were infected with pairs where farms were categorized as non-infected. The analysis was conducted using the netlogit function of the SNA package in R, with the application of 1000 Monte Carlo simulations.

2.6. Association between Brucellosis Status and Cattle Movements, Accounting for Previously Detected Risk Factors

A logistic regression model was constructed to estimate the likelihood of brucellosis infection at the farm level. The network metrics outlined in Table 1 were evaluated as potential predictors. In addition, previously identified risk factors for brucellosis on farms (Rodrigues et al., 2021) [4], such as herd size and regular brucellosis testing (binary variable), were considered for inclusion in the model. Model selection was conducted using a backward process, with a statistical significance level of p-value < 0.05. The AIC was employed to assess the model’s fit.

3. Results

3.1. Description of the Full Cattle Trade Network in Paraná

The original dataset comprised 115,296 unique farms and 942,936 cattle shipments between them, spanning from 1 January 2018 to 31 December 2019, in the state of Paraná. This corresponds to the movement of 13,434,561 cattle, averaging 14.2 cattle per shipment. For this analysis, we excluded 295,867 cattle shipments destined for abattoirs and 5798 shipments either originating or destined for other states. Additionally, 32,384 shipments to or from locations lacking ID or geocoding information, primarily shipments to or from events and temporary precincts, were excluded. The final dataset, therefore, consisted of 608,887 cattle shipments to or from 115,296 farms (Figure 2).
Summary measures of farm-level network metrics are presented in Table 2.
The parameters exhibit strong asymmetry and are predominantly right-skewed, except for the “closeness out” parameter, which is left-skewed.
The cattle trade is predominantly concentrated within a minor fraction of farms. The top 10% of cattle sellers are responsible for 73% of all sales, while the top 10% of cattle buyers account for 83% of all purchases (Figure 3).

3.2. Community Detection

We identified 2272 cattle trade communities within a network modularity of 0.722. All cattle movements in the period were aggregated, each community is formed by farms that are more closely connected by cattle movements among themselves than any other set of farms in the area. The eight largest communities, which included 55.36% of all nodes in the network, are highlighted (Figure 4).

3.3. Analysis of Movements of Cattle among Farms with a Known Status of Brucellosis

In total, 20,143 shipments, involving at least one farm with a known brucellosis status, accounted for the trade of 227,705 animals, averaging 11.30 animals per transaction. These 20,143 transactions constituted 3.30% of the 608,887 total movements within the entire network during the specified period. More specifically, the brucellosis status of the origin farm was known for 12,443 movements, while the status of the destination farm was known for 9178 movements. Consequently, the brucellosis status was known for both the origin and destination farms in 1478 movements.
Out of the 95 farms afflicted with brucellosis, 86 engaged in at least one cattle trade during 2018–2019, accounting for 90.5% of the total. In contrast, among the non-infected farms (n = 1662), only 72.6% participated in at least one trade, a significantly lower proportion (p < 0.001) (Figure 5).
Given the estimated prevalence of brucellosis in herds in the region at 4.87% (Rodrigues et al., 2021) [4], we tested the hypothesis that infected farms dispatch cattle to other farms more frequently than would be anticipated from a random selection of farms in the region (Table 3). Consequently, the null hypothesis was rejected (p < 0.001), indicating that infected farms trade more frequently (OR = 2.12).
The hypothesis that infected farms acquire cattle more frequently than non-infected farms was tested (Table 3). The results indicated that infected farms indeed obtained a higher number of bovines than expected (p < 0.001, OR = 2.78).
In relation to the conduct of farms with a confirmed brucellosis status when dispatching cattle to temporary locations (markets, fairs, sports, and entertainment), it was observed that infected farms had a significantly higher number of shipments than anticipated in the overall population (p < 0.001, OR 3.03) (Table 4).
In terms of dyadic relationships, the mean distance of the shortest route between two infected farms was significantly less than that between pairs of non-infected farms (Table 5).

3.4. Network Parameters of Infected and Non-Infected Farms

The network parameters for infected and non-infected farms are presented in Table 6. Infected farms exhibited significantly higher in-degree and out-degree scores compared with their uninfected counterparts. However, no significant differences were observed in the other parameters between the two groups.

3.5. Association between Brucellosis Status and Cattle Movements, Accounting for Previously Detected Risk Factors

Upon adjusting for previously identified risk factors for brucellosis (including herd size and testing frequency), the significance of most network variables diminished. However, farms with an out-degree exceeding the median (17 shipments) during the study period demonstrated 2.2-fold increased odds of brucellosis infection compared with other farms (Table 7).

4. Discussion

4.1. Cattle Trade Network in the State of Paraná

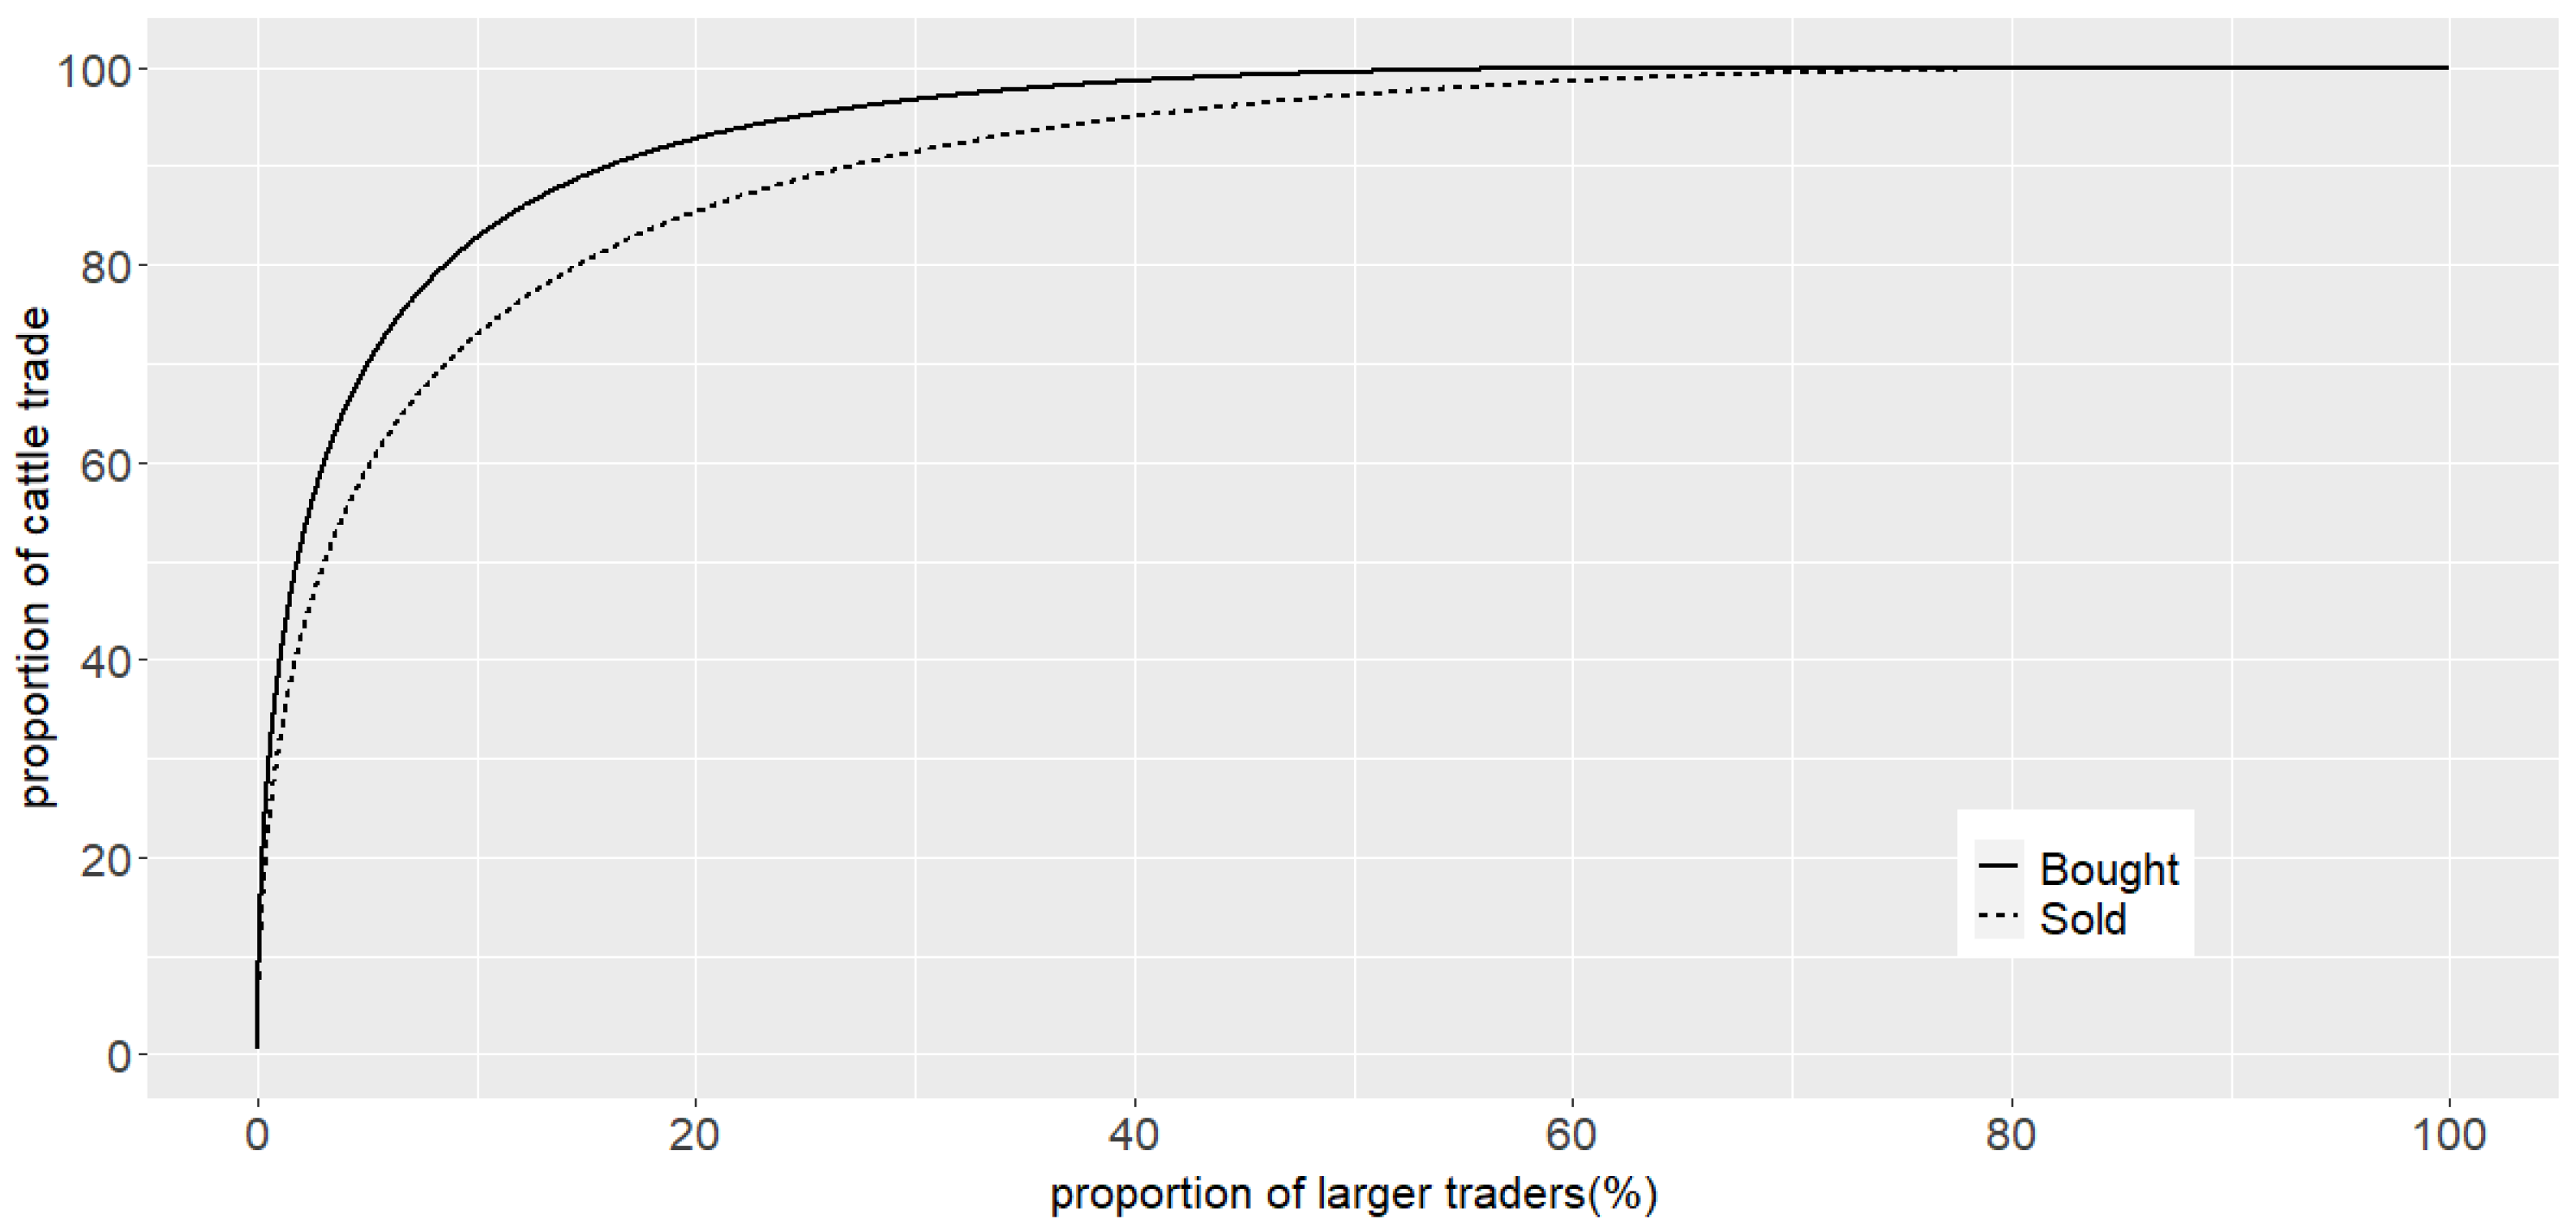
The cattle trade network in Paraná state is characterized by a high concentration of movements within a small number of farms. All evaluated parameters exhibited a right-skewed distribution, indicating that hubs (highly connected nodes) serve as potential sources of communicable diseases that depend on animal movement. Conversely, most nodes in the network trade few cattle and, if infected, are likely to pose a lower risk of disease transmission [18]. This pattern has commonly been observed in other animal trade networks, such as those in Northern Ireland [19], Italy [20], Uruguay [21], and Denmark [22]. However, the network in Chile follows a more evenly distributed pattern [23]. The implications of these findings are significant: in a resource-limited setting, informed decision-making is crucial for prioritizing actions, and the identification of surveillance system hotspots becomes increasingly important.
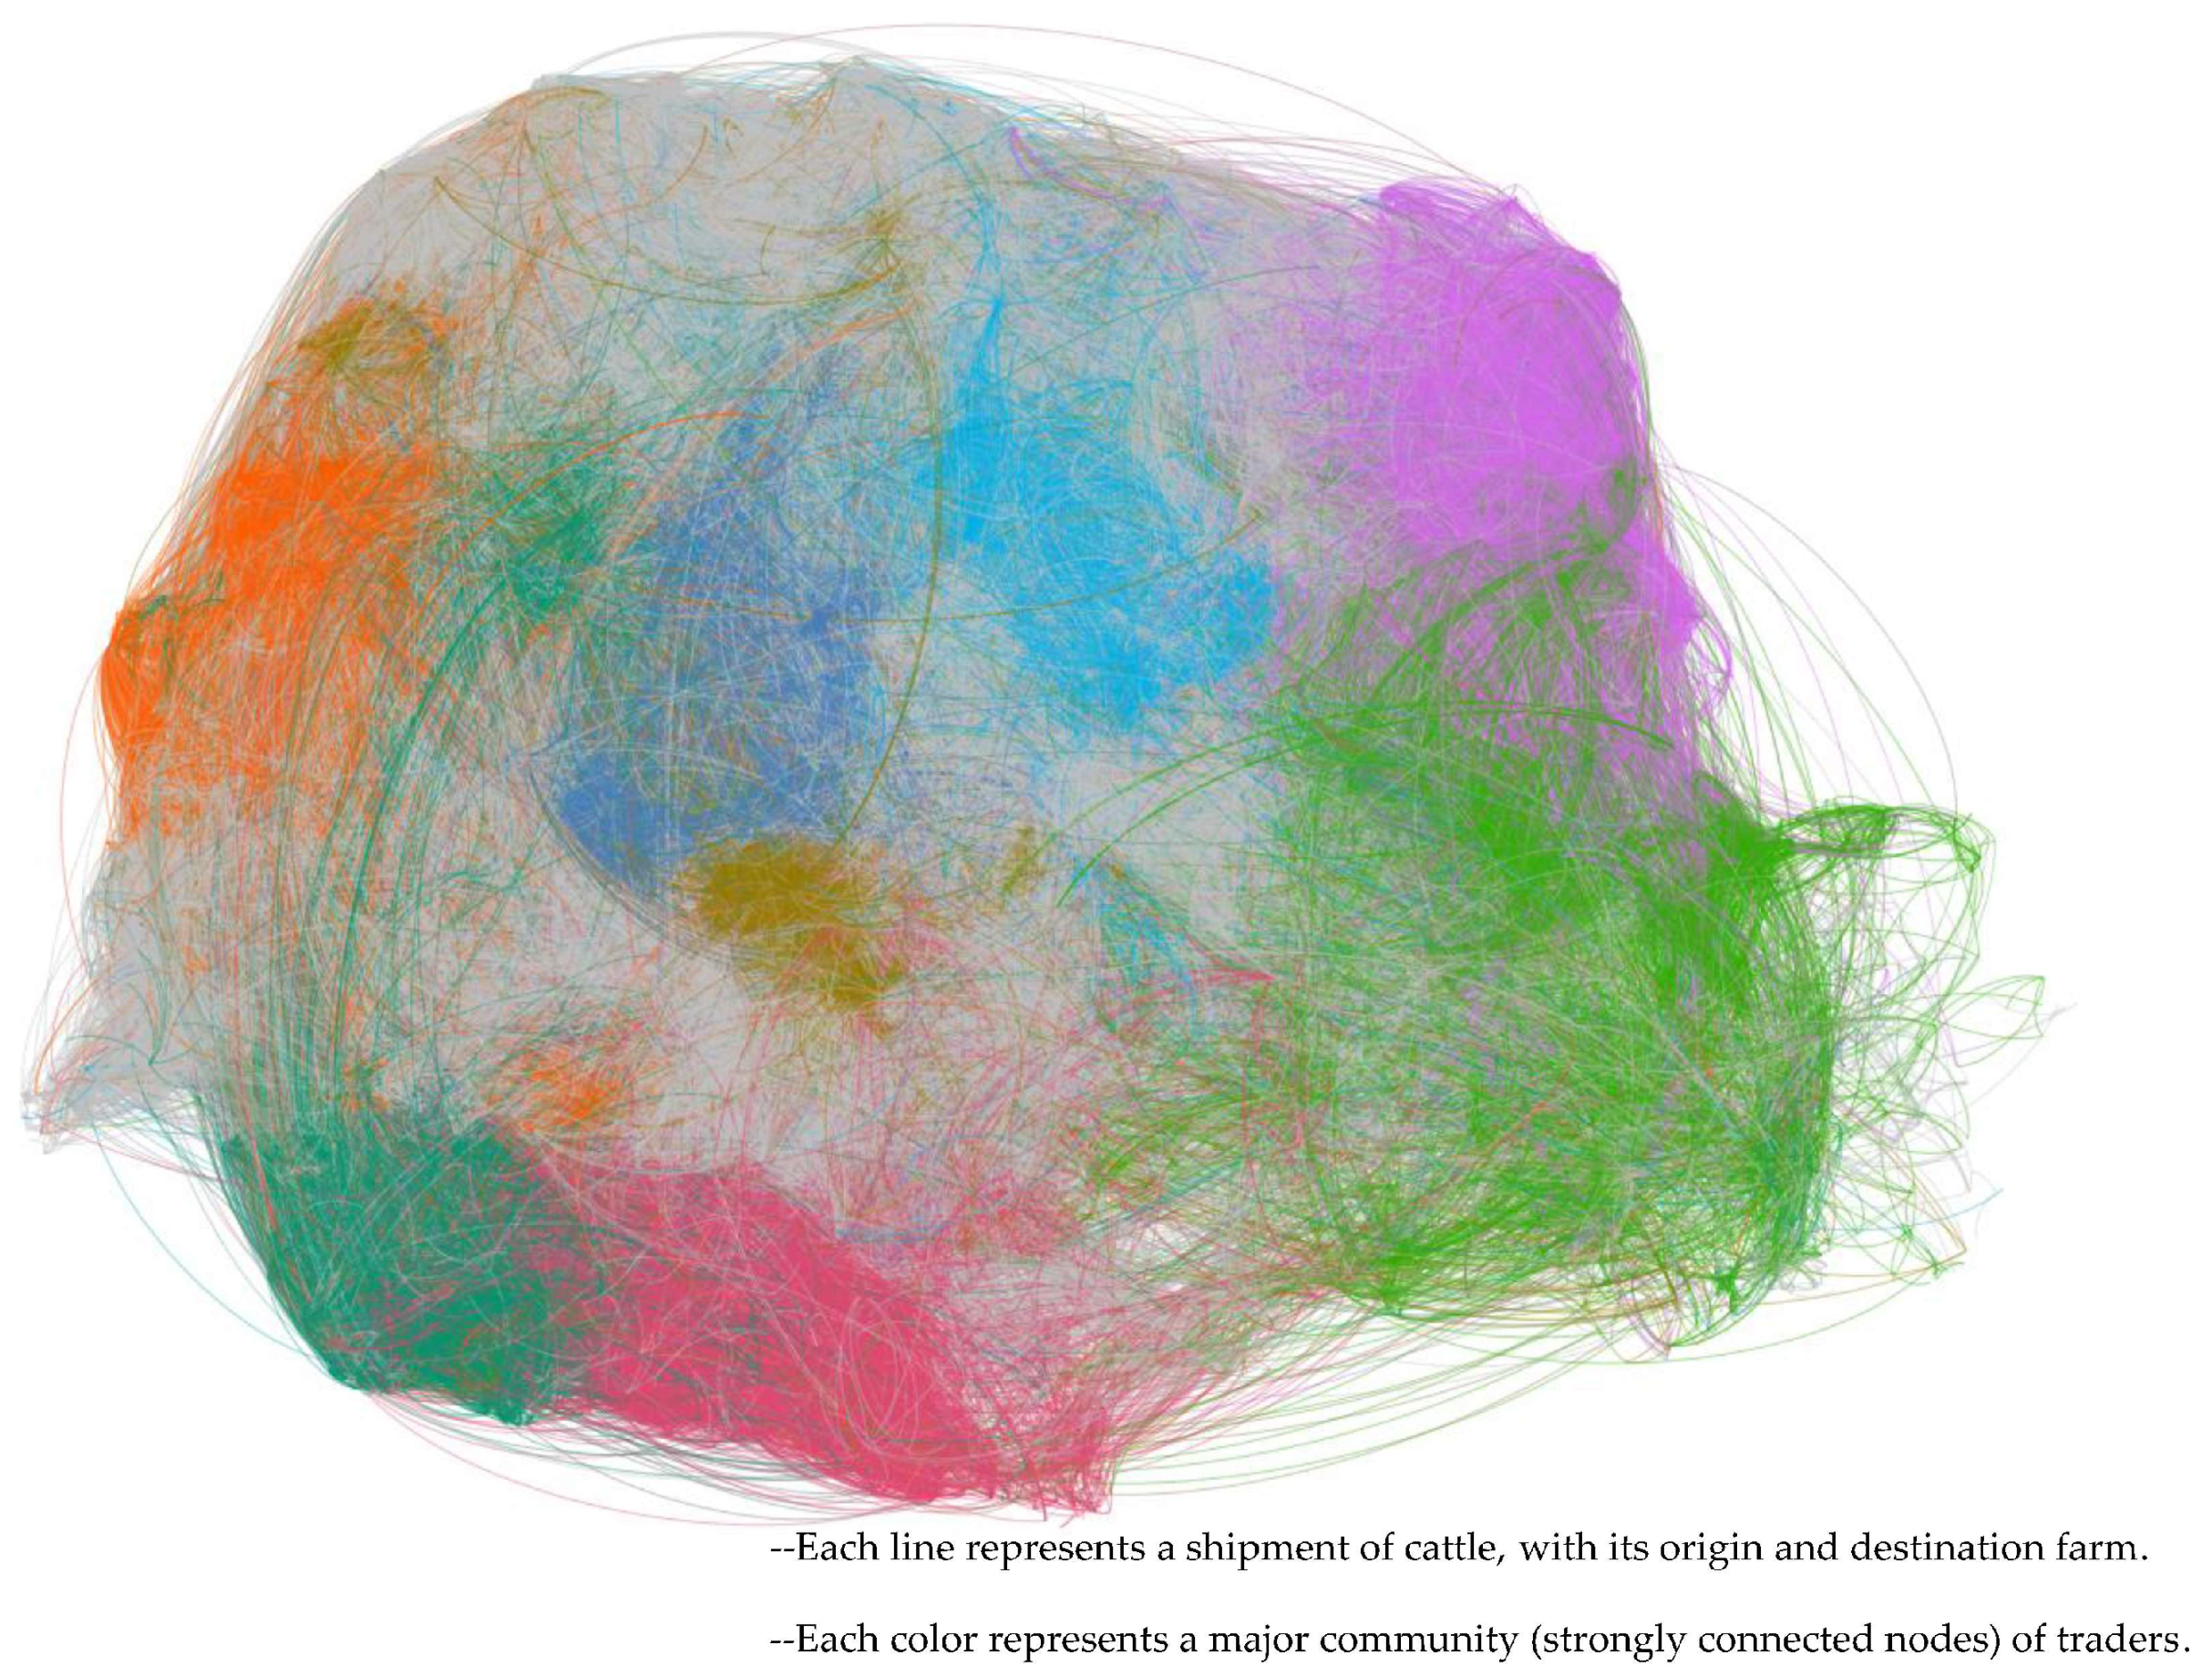
The trading communities in Paraná have been observed to follow a spatial pattern, with proximate farms more likely to engage in trade, a finding that mirrors the cattle network in Chile [23]. Crucially, the primary communities identified in this study enhance our understanding of the variation in brucellosis prevalence within Paraná [4], potentially offering valuable insights into the compartmentalization or zoning of areas for the future recognition of disease-free zones. The fundamental premise is that the transmission chain of infectious agents is spatially bound. Individuals who share close spatial proximity exert a pronounced influence on potential social interactions and, more specifically, on the plausible pathways for infection transmission when a host releases an infectious agent into the environment. Although the simultaneous spatial and network analysis is a recent development [24], movement between farms may be more significant than local spread between neighbors, as evidenced in the case of Mycobacterium subs. Paratuberculosis (MAP) in New Zealand [25]. Conversely, in some instances, introducing animals may be less significant than other risk factors, as observed with brucellosis in Sicily, Italy [26]. It is likely that these factors intersect to varying degrees, as demonstrated in a study of concurrent risk factors for brucellosis and tuberculosis in Spain [27]. While the birth or abortion of a calf is critical to B. bovis contaminating the environment within and around farms, it is biologically plausible that the trading of infected cattle represents the primary transmission route to other farms. This combined effect warrants further investigation. In endemic areas, the primary focus is on minimizing the transmission pathways of an infectious agent between infected and non-infected farms. This study presents novel evidence that traders’ communities in Paraná are geographically clustered, a finding that could inform the development of localized, tailored actions and policies. While this is the general pattern for this network, we also identified a few communities with long-distance connections, establishing a secondary center geographically separate from the main one. This potentially signifies important commercial routes that adhere to a regional rationale and should also be taken into consideration.
The static, 2-year network, representing the selected timeframe of 2018 and 2019, serves as a valuable reference for future analyses, particularly for chronic endemic diseases. Since 2020, Brazil has implemented new policies concerning animal transit regulation, aligning with its strategy to control foot and mouth disease. These changes are likely to impact the dynamics of other diseases, such as brucellosis. Once the alterations in animal trade are firmly established, it is advisable to re-evaluate the network and identify any changes. Additionally, it is recommended to conduct a temporal network analysis, as the sequence of movements over time may not be accurately detected in the static network, potentially leading to overestimations or underestimations of the differences within it [8,28].

4.2. Movements of Cattle in Brucellosis-Infected and Non-Infected Farms

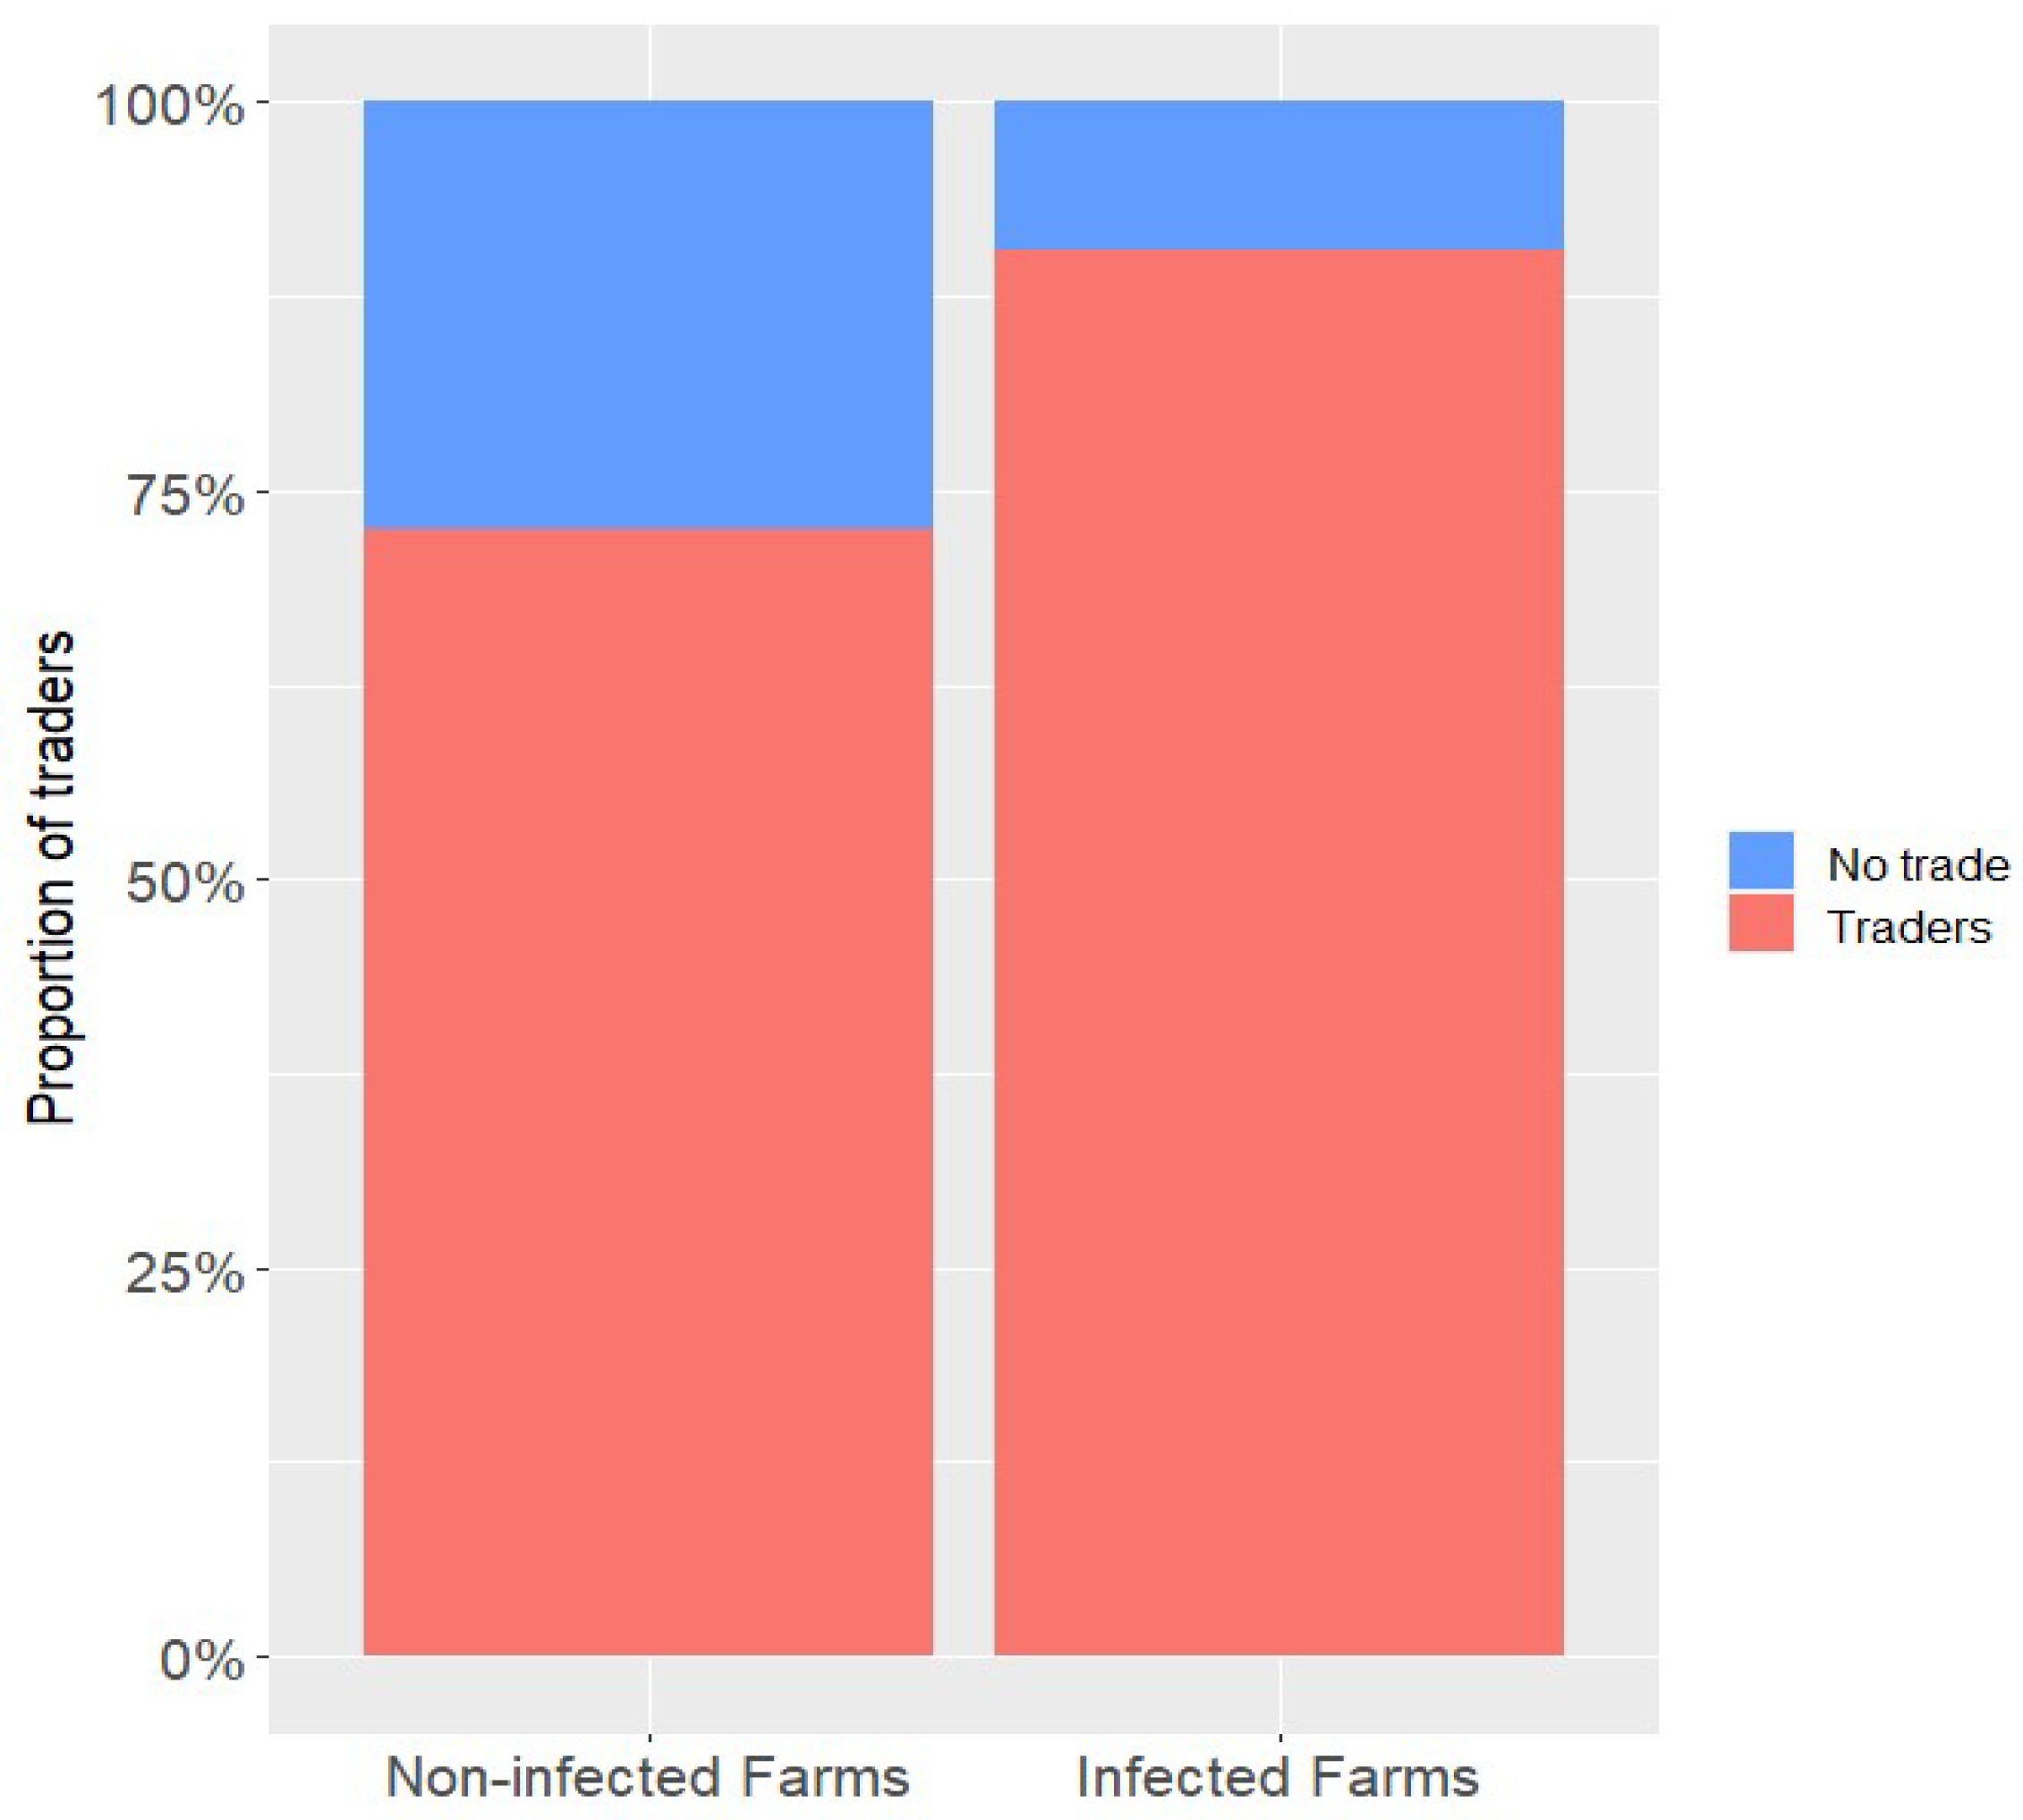
Our data indicate that infected herds purchase cattle more frequently than non-infected herds, with an OR of 2.78, given the current brucellosis prevalence of 4.87%. We hypothesized that each additional animal introduced from an infected area increases the likelihood of introducing a source of infection into the receiving farm. This could explain the risk of brucellosis among farms. In Italy, a model identifying regional vulnerability found that cattle trade significantly contributed to the persistent occurrence of brucellosis in the southern regions [29]. A similar situation exists in the state of Paraná, where the brucellosis prevalence remains unchanged despite years of control program implementation [4]. Complementarily, we found that infected herds sell cattle more frequently (OR 2.1) than expected, which helps explain the current situation in the area. If the surveillance system fails to efficiently detect infected herds, or if control measures are not implemented during an outbreak, the potential for an infected herd to spread brucellosis to the next farm is amplified by a high volume of cattle sales. Evidence suggests that non-compliance following outbreaks and a higher trading profile can significantly contribute to the spread of brucellosis across any given region [29]. This information can be used to improve the sensitivity of a surveillance system by focusing on more connected farms. Ultimately, a risk-based surveillance system in a heterogeneous network, similar to the one described here, is more likely to identify infected farms by concentrating on those with more connections in the network [7,21].
Markets and fairs serve as temporary epicenters for cattle trade. The high numbers of animals during these events significantly influence certain network measures, including the shortest pathway length between farm pairs and the average shortest pathway length across the network, thereby amplifying the spread of infection sources. Our findings indicate that brucellosis-infected premises dispatch cattle to these events more frequently than non-infected farms. In certain scenarios, these events could be perceived as primary hubs for disease distribution [23]. In the network associated with the initial brucellosis outbreak in Sicily, markets and staging points were often part of the pathway linking infected holdings [30]. Consequently, implementing sanitary controls for animal admission at these locations can effectively mitigate the risk of brucellosis spread.

4.3. Comparison of Network Parameters

Herein, we examined various node-level parameters within the network. We found a significant correlation (p < 0.05) between the incoming and outgoing degrees and the incidence of brucellosis infection in the holdings. From an epidemiological perspective, a higher degree could plausibly account for the increased frequency of brucellosis infection in holdings, a relationship that mirrors findings from a similar study conducted in Italy [29].
The out-degree parameter is directly proportional to the potential for infection amplification across the network [19]. Parameters such as betweenness, clustering in, clustering out, page rank, closeness in, and closeness out did not show a significant association with brucellosis detection on farms. These parameters, among others, have been investigated as potential predictors of infectious disease risk, but evidence often suggests otherwise. Savini et al. found that the in-degree parameter is more effective than the out-degree, degree, betweenness, hub, and authority [30] for efficiently fragmenting the cattle network, thereby maximizing the isolation of brucellosis outbreaks with minimal network impact. This involves selecting the most connected nodes for removal from the network. Their study revealed significant differences among the six networks produced post-fragmentation. For instance, the in-degree reduced its original network by 37%, limiting the reach of outbreaks in the fragmented network to only 4% of the original outbreak number. Conversely, betweenness reduced its network by 80%, but the fragmented network still reached 12% of the outbreaks. In Mato Grosso, Brazil, degree and out-degree were associated with brucellosis, but parameters such as ingoing contact chain, outgoing contact chain, clustering in, clustering out, closeness in, closeness out, page rank, and betweenness were not [31]. These findings underscore the importance of the careful selection of centrality parameters, taking into account their inherent characteristics. Any models or policies should only be implemented after validation with real, empirical data. As SNA gains popularity, it is crucial to clarify the range of its methodologies, their respective applications, and limitations [32].
Analysis of the shortest pathway length between farms with a confirmed brucellosis status in the network, using QAP, revealed an inverse relationship with the incidence of brucellosis. Farms with infections are topologically closer (shorter pathway) compared with other farm pairs within the network. This observation aligns with findings from New Zealand, where a positive correlation exists between the shortest pathway length between farms and the sharing of the same MAP strain [25]. This insight underscores the potential value of investigating farms that link two infected farms, which could enhance the field investigation of outbreaks. In Brazil’s field conditions, veterinary services typically only probe direct contacts of the outbreaks, mirroring the approach taken during Italian outbreak investigations [30]. Future research could delve into whether this relationship between the shortest pathway and disease holds any significant biological implications, or if it merely represents an indirect effect of the infected holdings being more interconnected. From a methodological perspective, the QAP applied here offers a more robust hypothesis test for SNA [17], and its results are consistent with other classical hypothesis tests used in our dataset, as outlined in previous sections.
Several risk factors for brucellosis in cattle have been identified. Our logistic regression analysis revealed a positive correlation between the out-degree and infected herds, after accounting for two previously reported risk factors for brucellosis in the state of Paraná: herd size and regular herd testing. Bovines in larger herds are not intrinsically more susceptible to infection; rather, this characteristic has been globally reported as correlated with infected herds [5,26,33,34]. However, the concept of herd size as a relative factor requires further clarification, because it encompasses a variety of features. For instance, a high correlation is anticipated between herd size and trading frequency [31], suggesting that increased trading may be an inherent aspect of larger herds. Viewed from another angle, this implies that factors beyond cattle movement should be considered when formulating policies to control brucellosis. Other transmission pathways should also be investigated accordingly.
In a practical context, understanding that hubs are high-risk holdings contributes to risk-based surveillance [8,21,35], thereby improving the system’s sensitivity. This knowledge also guides outbreak analyses, particularly when evaluating data related to movements to and from the farm under investigation. A scale-free network is especially sensitive when more connected nodes are impacted [19]. Consequently, implementing measures such as vaccination and movement restrictions on these nodes is likely to yield superior results [18].

5. Limitations of the Study

The present study had some limitations. First, the accurate identification of infected and non-infected farms relies on the characteristics of the employed testing protocol. The protocol’s performance significantly influences the analysis produced. Specifically, the protocol’s sensitivity and specificity introduce a degree of imprecision. However, the authors do not anticipate this impacting the presented conclusions. Second, employing a static network over a 2-year period may introduce bias. This is because the flow of time is not considered, potentially leading to an overestimation of some nodes’ connectivity.

6. Conclusions

Networks aggregated over extended time scales are pertinent to endemic chronic diseases such as bovine brucellosis. The present study concluded that the cattle trade in Paraná, Brazil, constitutes a network highly concentrated within a relatively small number of farms, with its communities being geographically aggregated. Both global and farm-level connectivity are generally anticipated to be significant indicators of trade networks’ vulnerability to infectious diseases [36]. We have provided new empirical evidence supporting this assumption under specific conditions. In-degree, out-degree, and shortest pathways serve as suitable parameters for identifying brucellosis-infected farms, thereby enhancing risk-based surveillance. However, not all network parameters are relevant for this purpose. Any parameter should be evaluated in conjunction with additional epidemiological information and validated with actual disease occurrence data. The information provided offers insights into drivers of the current endemic situation in the study area and more effectively informs future animal health policies.

Supplementary Materials

The following supporting data related to the status of brucellosis are available online at https://data.mendeley.com/datasets/3ntpkdvscc/2, Table S1: Brucellosis_Par-ana_Animal_Prevalence, Table S2: Brucellosis_Paraná_Herd_Prevalence, Table S3: Risk Factors Brucellosis—NoGeo.xlsx, and Table S4: Variables key.pdf. Data related to the movements of cattle can be provided in a case-by-case request.

Author Contributions

Conceptualization: D.L.R., J.H.d.H.G.F., N.M., J.S.F.N.; methodology, D.L.R., J.H.d.H.G.F. and N.M.; software, D.L.R.; formal analysis: D.L.R.; data curation: D.L.R.; writing—original draft preparation, D.L.R.; review and editing: J.H.d.H.G.F., N.M. and J.S.F.N., supervision: J.S.F.N. All authors have read and agreed to the published version of the manuscript.

Funding

This research received no external funding.

Institutional Review Board Statement

Not applicable.

Informed Consent Statement

Not applicable.

Acknowledgments

The Ministry of Agriculture and Livestock of Brazil supported this research.

Conflicts of Interest

The authors declare no conflict of interest.

References

  1. OIE-World Organisation for Animal Health Home Page. Brucellosis. Available online: https://www.woah.org/en/disease/brucellosis/ (accessed on 22 May 2023).
  2. Zhang, N.; Huang, D.; Wu, W.; Liu, J.; Liang, F.; Zhou, B.; Guan, P. Animal brucellosis control or eradication programs worldwide: A systematic review of experiences and lessons learned. Prev. Vet. Med. 2018, 160, 105–115. [Google Scholar] [CrossRef] [PubMed]
  3. Ferreira Neto, J.S.; Da Silveira, G.B.; Rosa, B.M.; Gonçalves, V.S.P.; Gris-Filho, J.H.H.; Amaku, M.; Dias, R.A.; Ferreira, F.; Heinemann, M.B.; Telles, E.O.; et al. Analysis of 15 years of the national program for the control and eradication of animal brucellosis and tuberculosis, Brazil. Semin. Agrar. 2016, 37, 3385–3402. [Google Scholar] [CrossRef]
  4. Rodrigues, D.L.; Amorim, E.A.; Ferreira, F.; Amaku, M.; Baquero, O.S.; de Hildebrand e Grisi Filho, J.H.; Dias, R.A.; Heinemann, M.B.; Telles, E.O.; Gonçalves, V.S.P.; et al. Seroprevalence and risk factors for bovine brucellosis in the state of Paraná, Brazil: An analysis after 18 years of ongoing control measures. Trop. Anim. Health Prod. 2021, 53, 503. [Google Scholar] [CrossRef] [PubMed]
  5. de Alencar Mota, A.L.A.; Ferreira, F.; Ferreira Neto, J.S.; Dias, R.A.; Amaku, M.; Hildebrand Grisi-Filho, J.H.; Telles, E.O.; Picão Gonçalves, V.S. Large-scale study of herd-level risk factors for bovine brucellosis in Brazil. Acta Trop. 2016, 164, 226–232. [Google Scholar] [CrossRef] [PubMed]
  6. House, T.; Keeling, M.J. Insights from unifying modern approximations to infections on networks. J. R. Soc. Interface 2011, 8, 67–73. [Google Scholar] [CrossRef]
  7. Amaku, M.; Grisi-Filho, J.H.d.H.; Negreiros, R.L.; Dias, R.A.; Ferreira, F.; Neto, J.S.F.; Cipullo, R.I.; Marques, F.S.; Ossada, R. Infectious disease surveillance in animal movement networks: An approach based on the friendship paradox. Prev. Vet. Med. 2015, 121, 306–313. [Google Scholar] [CrossRef]
  8. Cárdenas, N.C.; Vanderwaal, K.; Veloso, F.P.; Galvis, J.O.A.; Amaku, M.; Filho, J.H.H.G. Spatio-temporal network analysis of pig trade to inform the design of risk-based disease surveillance. Prev. Vet. Med. 2020, 189, 105314. [Google Scholar] [CrossRef]
  9. IBGE Censo Agro. Available online: https://censoagro2017.ibge.gov.br/templates/censo_agro/resultadosagro/pecuaria.html?localidade=0&tema=75657 (accessed on 3 July 2021).
  10. Blondel, V.D.; Guillaume, J.L.; Lambiotte, R.; Lefebvre, E. Fast unfolding of communities in large networks. J. Stat. Mech. Theory Exp. 2008, 2008, P10008. [Google Scholar] [CrossRef]
  11. R Core Team. R: A Language and Environment for Statistical Computing; R Foundation for Statistical Computng: Vienna, Austria, 2022. [Google Scholar]
  12. Watts, D.J.; Strogatz, S.H. Collectivedynamics of ‘small-world’ networks. Nature 1998, 393, 440–442. [Google Scholar] [CrossRef]
  13. Page, L.; Brin, S. The anatomy of a large-scale hypertextual Web search engine. Comput. Netw. ISDN Syst. 1998, 30, 107–117. [Google Scholar] [CrossRef]
  14. Freeman, L.C. A Set of Measures of Centrality Based on Betweenness. Sociometry 1977, 40, 35. [Google Scholar] [CrossRef]
  15. Freeman, L.C. Centrality in social networks conceptual clarification. Soc. Netw. 1978, 1, 215–239. [Google Scholar] [CrossRef]
  16. Dijkstra, E.W. A note on two problems in connexion with graphs. Numer. Math. 1959, 1, 269–271. [Google Scholar] [CrossRef]
  17. Krackhardt, D. Predicting with networks: Nonparametric multple regression analysis of dyadic data. Soc. Netw. 1988, 10, 359–381. [Google Scholar] [CrossRef]
  18. Dubé, C.; Kelton, D.F.; Dubé, C.; Ribble, C.; Kelton, D.; Mcnab, B. Inroduction to network analysis and its implications for animal disease modelling Introduction to network analysis and its implications for animal disease modelling. Rev. Sci. Tech. Off. Int. Epiz. 2011, 30, 425–436. [Google Scholar] [CrossRef]
  19. Brown, E.; Marshall, A.H.; Mitchell, H.J.; Byrne, A.W. Cattle movements in Northern Ireland form a robust network: Implications for disease management. Prev. Vet. Med. 2019, 170, 104740. [Google Scholar] [CrossRef]
  20. Natale, F.; Giovannini, A.; Savini, L.; Palma, D.; Possenti, L.; Fiore, G.; Calistri, P. Network analysis of Italian cattle trade patterns and evaluation of risks for potential disease spread. Prev. Vet. Med. 2009, 92, 341–350. [Google Scholar] [CrossRef]
  21. VanderWaal, K.L.; Picasso, C.; Enns, E.A.; Craft, M.E.; Alvarez, J.; Fernandez, F.; Gil, A.; Perez, A.; Wells, S. Network analysis of cattle movements in Uruguay: Quantifying heterogeneity for risk-based disease surveillance and control. Prev. Vet. Med. 2016, 123, 12–22. [Google Scholar] [CrossRef]
  22. Bigras-Poulin, M.; Barfod, K.; Mortensen, S.; Greiner, M. Relationship of trade patterns of the Danish swine industry animal movements network to potential disease spread. Prev. Vet. Med. 2007, 80, 143–165. [Google Scholar] [CrossRef]
  23. Alocilla, O.; Monti, G. Network analysis of cattle movements in Chile: Implications for pathogen spread and control. Prev. Vet. Med. 2022, 204, 105644. [Google Scholar] [CrossRef]
  24. Albery, G.F.; Kirkpatrick, L.; Firth, J.A.; Bansal, S. Unifying spatial and social network analysis in disease ecology. J. Anim. Ecol. 2021, 90, 45–61. [Google Scholar] [CrossRef] [PubMed]
  25. Marquetoux, N.; Heuer, C.; Wilson, P.; Ridler, A.; Stevenson, M. Merging DNA typing and network analysis to assess the transmission of paratuberculosis between farms. Prev. Vet. Med. 2016, 134, 113–121. [Google Scholar] [CrossRef]
  26. Calistri, P.; Iannetti, S.; Atzeni, M.; Di Bella, C.; Schembri, P.; Giovannini, A. Risk factors for the persistence of bovine brucellosis in Sicily from 2008 to 2010. Prev. Vet. Med. 2013, 110, 329–334. [Google Scholar] [CrossRef] [PubMed]
  27. Cowie, C.E.; Marreos, N.; Gortázar, C.; Jaroso, R.; White, P.C.L.; Balseiro, A. Shared risk factors for multiple livestock diseases: A case study of bovine tuberculosis and brucellosis. Res. Vet. Sci. 2014, 97, 491–497. [Google Scholar] [CrossRef] [PubMed]
  28. Lentz, H.H.K.; Koher, A.; Hövel, P.; Gethmann, J.; Sauter-Louis, C.; Selhorst, T.; Conraths, F.J. Disease Spread through Animal Movements: A Static and Temporal Network Analysis of Pig Trade in Germany. PLoS ONE 2016, 11, e0155196. [Google Scholar] [CrossRef]
  29. Darbon, A.; Valdano, E.; Poletto, C.; Giovannini, A.; Savini, L.; Candeloro, L.; Colizza, V. Network-based assessment of the vulnerability of Italian regions to bovine brucellosis. Prev. Vet. Med. 2018, 158, 25–34. [Google Scholar] [CrossRef]
  30. Savini, L.; Candeloro, L.; Conte, A.; De Massis, F.; Giovannini, A. Development of a forecasting model for brucellosis spreading in the Italian cattle trade network aimed to prioritise the field interventions. PLoS ONE 2017, 12, e0177313. [Google Scholar] [CrossRef]
  31. Cipullo, R.I.; Grisi-Filho, J.H.H.; Dias, R.A.; Ferreira, F.; Neto, J.S.F.; Gonçalves, V.S.P.; Marques, F.S.; Negreiros, R.L.; Ossada, R.; Amaku, M. Cattle movement network, herd size, and bovine brucellosis in the State of Mato Grosso, Brazil. Semin. Agrar. 2016, 37, 3777–3792. [Google Scholar] [CrossRef]
  32. Sosa, S.; Sueur, C.; Puga-Gonzalez, I. Network measures in animal social network analysis: Their strengths, limits, interpretations and uses. Methods Ecol. Evol. 2021, 12, 10–21. [Google Scholar] [CrossRef]
  33. Crawford, R.P.; Huber, J.D.; Adams, B.S. Epidemiology and Surveillance. In Animal Brucellosis; CRC Press: Boca Raton, FL, USA, 1990; pp. 131–151. [Google Scholar]
  34. Ogugua, A.J.; Akinseye, V.O.; Cadmus, E.O.; Jolaoluwa Awosanya, E.A.; Alabi, P.I.; Idowu, O.S.; Akinade, S.A.; Dale, E.J.; Perrett, L.; Taylor, A.; et al. Prevalence and risk factors associated with bovine brucellosis in herds under extensive production system in southwestern Nigeria. Trop. Anim. Health Prod. 2018, 50, 1573–1582. [Google Scholar] [CrossRef]
  35. Cameron, A.R. The consequences of risk-based surveillance: Developing output-based standards for surveillance to demonstrate freedom from disease. Prev. Vet. Med. 2012, 105, 280–286. [Google Scholar] [CrossRef] [PubMed]
  36. Keeling, M.J.; Eames, K.T.D. Networks and epidemic models. J. R. Soc. Interface 2005, 2, 295–307. [Google Scholar] [CrossRef] [PubMed]
Figure 1. Map of the state of Paraná, Brazil.
Ruminants 03 00019 g001
Figure 2. Number of cattle shipments in the state of Paraná from 2018 to 2019 and the data exclusion process.
Ruminants 03 00019 g002
Figure 3. Market proportion of larger traders in the cattle network in the state of Paraná, Brazil.
Ruminants 03 00019 g003
Figure 4. Eight larger communities for cattle trade network in the state of Paraná, Brazil from 2018 to 2019.
Ruminants 03 00019 g004
Figure 5. Proportion of traders among farms with a known brucellosis status in the state of Paraná, Brazil, during 2018–2019.
Ruminants 03 00019 g005
Table 1. Description of the network metrics.
MetricDescriptionReference
In-DegreeThe number of inbound cattle movements to each farm.NA
Out-DegreeThe number of outbound cattle movements from each farm.NA
Inward clustering coefficientLocal measure of how close a farm is connected to its neighbors considering inbound cattle movements.[12]
Outward clustering coefficientLocal measure of how close a farm is connected to its neighbors considering outbound cattle movements.[12]
PageRankA ranking measure of importance based on the indegree of a given farm and the indegree of its neighbors.[13]
BetweennessThe proportion of shortest pathways between every pair of farms, which includes that farm.[14]
Closeness inCoefficient that represents how close a farm is to all other farms in the network regarding the inbound cattle movements.[15]
Closeness outCoefficient that represents how close a farm is to all other farms in the network regarding the outbound cattle movements.[15]
Table 2. Network metrics of the cattle trade in the state of Paraná, 2018 to 2019.
1st QuartileMedianMean3rd QuartileMax. Value
In-Degree0579.713045,379
Out-Degree41479.714846,221
Clustering In000.080.071
Clustering Out000.130.171
Page Rank1.791 × 10−62.380 × 10−68.673 × 10−64.811 × 10−64.545 × 10−3
Betweenness00528,56392,4777.3 × 108
Closeness In7.52273 × 10−117.52299 × 10−112.22424 × 10−103.79517 × 10−103.81499 × 10⁻¹⁰
Closeness out1.45671 × 10−101.45712 × 10−101.31759 × 10−101.45722 × 10−101.45918 × 10⁻¹⁰
Table 3. Observed and expected shipments of cattle from and destinated to brucellosis-infected farms in the state of Paraná, Brazil, in 2018 and 2019.
ObservedExpected *Odds Ratiop Value
Number of shipments from infected farms1222606 (4.87% out 12,443)2.120.001
Number of shipments to infected farms1147447 (4.87% out 9178)2.78<0.001
* Based on a herd prevalence of 4.87% in the state of Paraná, Brazil [4].
Table 4. Number of shipments of cattle from infected and non-infected farms towards temporary precincts (markets, fairs, sports, and entertainment).
Brucellosis Status of Farm of OriginNumber of Shipments toward Temporary Precincts
ObservedExpected *
Infected4717
Non-infected309339
Total356356
* Based on a herd prevalence of 4.87% in the Paraná State [4].
Table 5. Shortest pathway statistics of pairs with at least one infected farm and pairs with non-infected farms in the state of Paraná, Brazil, in 2018 and 2019.
Shortest Pathway Length
MeanSDp Value
Links between infected farms4.140.870.004
Remaining links4.491.06
Table 6. Network metrics of brucellosis-infected and non-infected farms in the network of cattle trade in the state of Paraná.
Infected MeanNon-Infected Meanp Value
In-Degree180.576.940.006
Out-Degree245.392.430.000
Clustering In0.073180.058100.431
Clustering Out0.131540.11430.121
Page Rank1.500 × 10−58.521 × 10−60.166
Betweenness1,200,5821,090,9160.159
Closeness In2.556 × 10−102.160 × 10−100.061
Closeness out1.383 × 10−101.353 × 10−100.999
Table 7. Multivariate logistic regression model for brucellosis-infected farms in the state of Paraná, Brazil.
Variable and LevelsOdds Ratio95% CIp Value
Herd size (cows aged over 24 m)
Herd ≤ 8 cows (50th percentile)base
Herd ≥ 9 to ≤88 cows2.831.53–5.23<0.01
Herd > 88 cows (95th percentile)6.743.10–14.62<0.01
Diagnosis
Brucellosis regularly testedbase
Brucellosis not regularly tested2.771.72–4.48<0.01
Out-degree (categorized by median)
Low out-degree (≤17)base
High out-degree (>17)2.201.29–3.75<0.01
Disclaimer/Publisher’s Note: The statements, opinions and data contained in all publications are solely those of the individual author(s) and contributor(s) and not of MDPI and/or the editor(s). MDPI and/or the editor(s) disclaim responsibility for any injury to people or property resulting from any ideas, methods, instructions or products referred to in the content.

