Article

Emerging Near-Surface Solar MHD Dynamos

by
Alexander Bershadskii
ICAR, P.O. Box 31155, Jerusalem 91000, Israel
Foundations 2025, 5(3), 31; https://doi.org/10.3390/foundations5030031
Submission received: 8 July 2025 / Revised: 1 September 2025 / Accepted: 17 September 2025 / Published: 19 September 2025
(This article belongs to the Section Physical Sciences)

Abstract

Using the results of numerical simulations and solar observations, this study shows that the transition from deterministic chaos to hard turbulence in the magnetic field generated by the emerging small-scale, near-surface (within the Sun’s outer 5–10% convection zone) solar MHD dynamos occurs through a randomization process. This randomization process has been described using the concept of distributed chaos, and the main parameter of distributed chaos β has been employed to quantify the degree of randomization (the wavenumber spectrum characterising distributed chaos has a stretched exponential form E ( k ) exp ( k / k β ) β ). The dissipative (Loitsianskii and Birkhoff–Saffman integrals) and ideal (magnetic helicity) magnetohydrodynamic invariants govern the randomization process and determine the degree of randomization 0 < β 1 at various stages of the emerging MHD dynamos, directly or through Kolmogorov–Iroshnikov phenomenology (the magnetoinertial range of scales as a precursor of hard turbulence). Despite the considerable differences in the scales and physical parameters, the results of numerical simulations are in quantitative agreement with solar observations (magnetograms) within this framework. The Hall magnetohydrodynamic dynamo is also briefly discussed in this context.

1. Introduction

Both global and local (small-scale) chaotic solar dynamos have been vigorously studied over the last decades (see, for instance, refs. [1,2,3,4] and references therein). Large- and small-scale dynamos can coexist, and both the quiet Sun and the highly active solar regions can exhibit chaotic behavior. It is believed that the chaotic/turbulent dynamo mechanisms are localized mainly in the near-surface (shear) solar layer, within the Sun’s outer 5–10% convection zone. The dynamo mechanism can involve the magnetorotational instability operating in the shear layer (see, for instance, recent Refs. [3,5,6,7,8] and references therein).
Solar models have been actively developing for a long time; there is a large amount of observational data explaining certain quantitative characteristics of the Sun, including the magnitude of the magnetic field at different scales. In this paper, we do not present a new model nor do we modify any existing models. Therefore, instead of providing an extensive introduction into existing models and their advantages and disadvantages (see [9] for a recent comprehensive review of observationally guided models of the solar dynamo), we will concentrate on the main subject of the present paper—the process of randomization of the magnetic field during its evolution from the setup of a small-scale (fluctuation) dynamo [10] (deterministic chaos) through different stages of randomization controlled by fundamental magnetohydrodynamic invariants.
The concept of smoothness can be functional for the quantitative classification of non-laminar regimes in magnetohydrodynamics (and in fluid dynamics in general) according to their randomness. Spectral analyses can be used for this purpose. Namely, stretched exponential spectra are typical for smooth magnetohydrodynamics.
E ( k ) exp ( k / k β ) β
Here, 1 β > 0 , and k is the wavenumber. The value β = 1 , and
E ( k ) exp ( k / k c ) ,
which is typical for deterministic chaos [11,12,13,14].
For 1 > β , the dynamics are still smooth but not deterministic (and will be called distributed chaos; see below for a clarification of the term). It can also be considered soft turbulence [15].
Non-smooth (hard turbulence [15]) dynamics is typically characterized by power law (scaling) spectra.
In this approach, the value of the β can be considered a proper measure of randomization. Namely, the further the value of the parameter β is from the deterministic β = 1 (i.e., the smaller the β ), the stronger the randomization.
Let us consider two examples. The first example can be taken from a direct numerical simulation (DNS) reported in a paper (Ref. [16]). Figure 1 shows the magnetic energy spectra generated by a small-scale, incompressible, saturated MHD dynamo at the magnetic Prandtl number P r m = 10 and different values of the Reynolds number (shown in the figure). The spectral data were taken from Figure 33a of Ref. [16] (see below for a more detailed description of this DNS).
The dashed curves in Figure 1 indicate the best fits that correspond to the stretched exponentials in Equation (1), and the dotted arrow indicates the position of the characteristic wavenumber k c from Equation (2).
The values of the parameter β decrease when the value of the Reynolds number increases (starting from β = 1 , i.e., from the deterministic chaos at a low Reynolds number), indicating increasing randomization in the Reynolds number. This trend conforms to physical expectations.
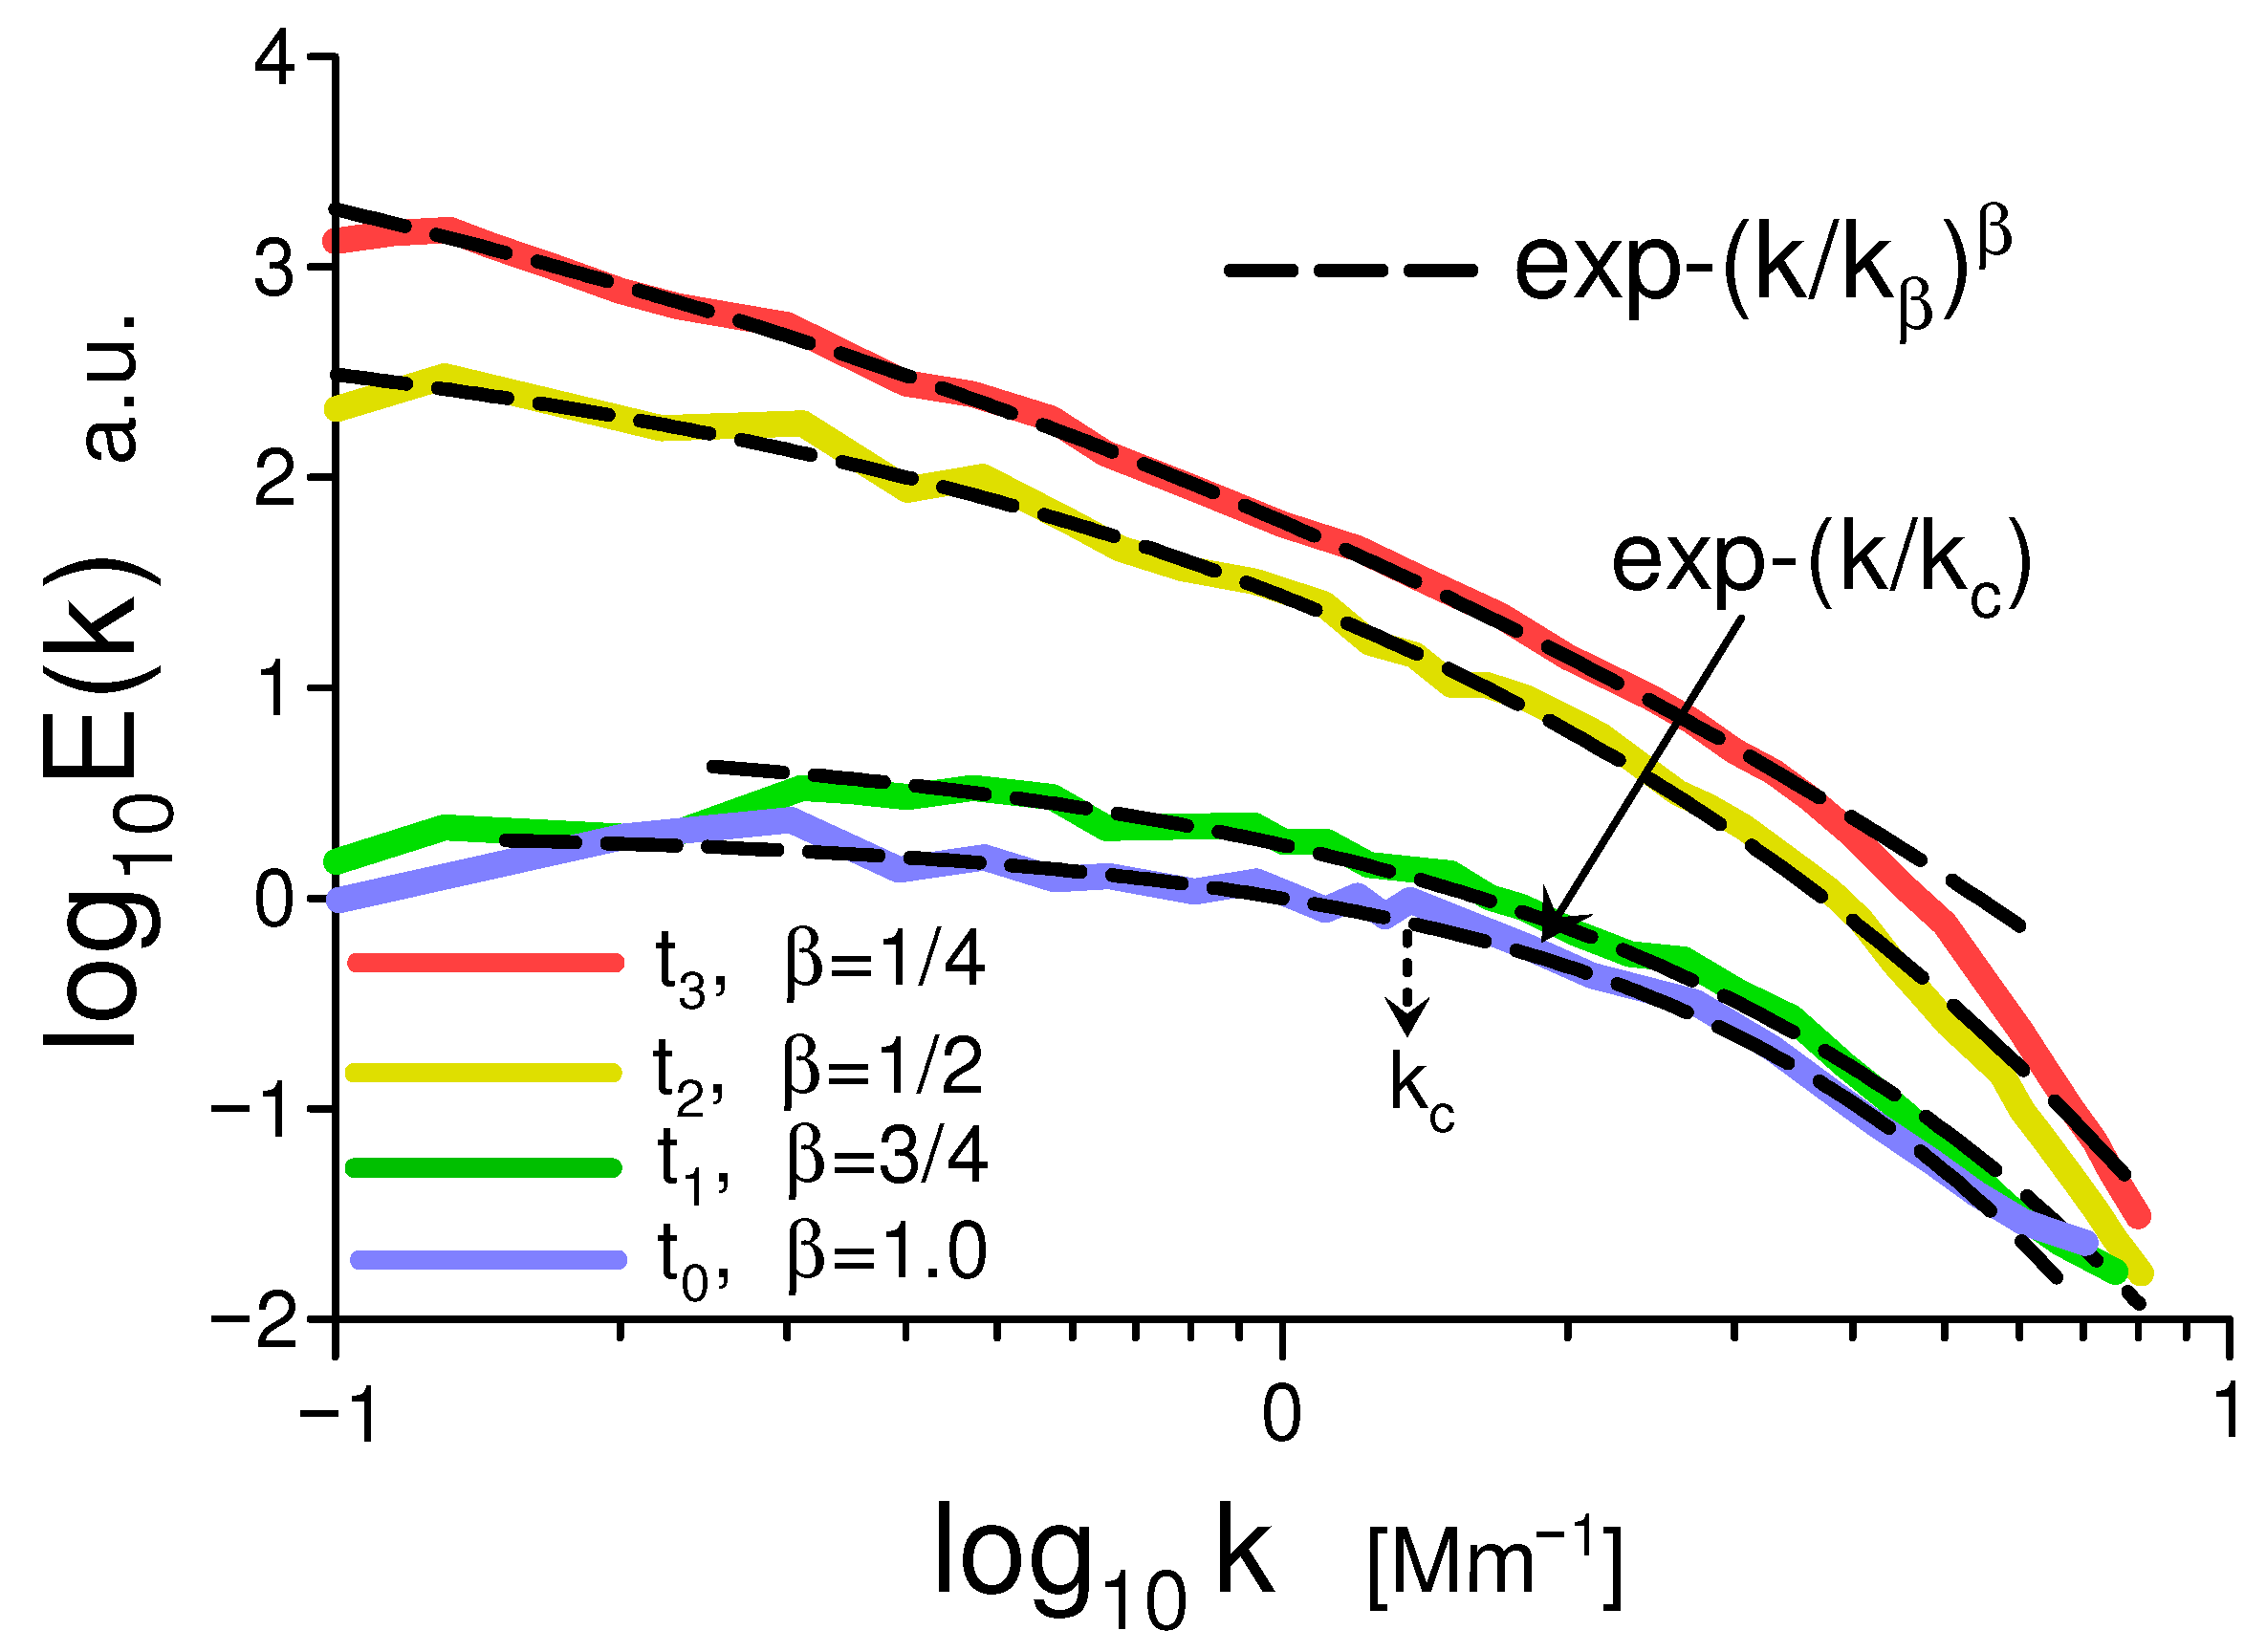
The second example can be taken from an observation of the evolution of the magnetic field in a rather large emerging solar active region, AR NOAA 11726. Measurements were provided by the Helioseismic and Magnetic Imager located onboard the Solar Dynamics Observatory (SDO/HMI). Figure 2 shows the magnetic power spectra for the emerging active region AR NOAA 11726 at different times of its evolution. Spectral data were taken from Figure 2a from a recent paper (Ref. [17]). The time moment t 0 corresponds to the start moment of the emerging process, and t 0 < t 1 < t 2 < t 3 is up to the beginning of the decline stage. The dashed curves in Figure 2 indicate the best fits that correspond to the stretched exponentials Equation (1), and the dotted arrow indicates the position of the characteristic wavenumber k c for the deterministic chaos (as in Figure 1).
One can see that the randomness of the magnetic field increases as the emergence of the active region proceeds (starting from β = 1 at t 0 , i.e., from the deterministic chaos at the beginning of the emergence process). This trend also conforms to physical expectations.
There will be no quantitative assessments in this paper in their usual sense (such as the Zeeman effect, for instance, which is used to quantitatively measure the strength and vector of magnetic fields in the photosphere). In the next sections, the estimates of the observed values of parameter β , which quantifies the degree of randomization, will be made using the observed magnetograms (cf. Figure 2) and (theoretical) magnetohydrodynamic invariants.
The spectra obtained using the magnetograms represent the state of the art in modern solar observation techniques and will be the primary focus of the present study. This is a statistically robust and informative material (that can be directly compared with the results of numerical simulations). Besides the spectra, there is little statistically significant and robust information of such quality related to the active solar regions and their evolution. The notion of fractal dimension has also been used for statistical descriptions of solar active regions (see, for instance, Refs. [18,19,20,21] and references therein). The chaotic nature of the magnetic field can be related to the fractal behavior of the solar magnetic field in the active regions [22]. However, there is no clear physical interpretation of corresponding measurements. This approach is still in its early stage of development (as well as the distributed chaos approach), and its relation to the distributed chaos approach used in the present paper can be a subject for future investigations. In any case, both of these indicate a complex, chaotic nature of the solar active regions and their evolution.

2. Magnetic Helicity and Distributed Chaos

2.1. Magnetic Helicity

Ideally, magnetohydrodynamics has three quadratic (fundamental) invariants: total energy, cross, and magnetic helicity [23].
The magnetic helicity density is
h m = a b
where the fluctuating magnetic field is b = [ × a ] ( · a = 0 ), and a spatial average is denoted as . Both fluctuating a and b have zero means, and · a = 0 .
The presence of a uniform magnetic field, B 0 , violates the invariance of magnetic helicity. A modified magnetic helicity density was introduced in Ref. [24] in the form
h ^ = h m + 2 B 0 · A
Here, B = B 0 + b , A = A 0 + a , and b = [ × a ] . This can be shown at rather weak restrictions on the boundary conditions in ideal magnetohydrodynamics [24] (see also Ref. [25]),
d h ^ d t = 0 ,
i.e., the modified magnetic helicity is an ideal magnetohydrodynamic invariant in the presence of a uniform magnetic field.

2.2. Distributed Chaos in the Magnetic Field Driven by Magnetic Helicity

A change in deterministically chaotic system parameters can result in random fluctuations in the characteristic scale k c in Equation (2). In this case, one has to use an ensemble averaging factor to compute the magnetic power spectra as follows:
E ( k ) 0 P ( k c ) exp ( k / k c ) d k c
with a probability distribution P ( k c ) characterizing the random fluctuations of the characteristic scale k c . Therefore, the corresponding smooth non-deterministic chaotic dynamics will be denoted as ‘distributed chaos’.
It is well-known that in a weakly non-ideal case, magnetic helicity is still almost conserved (since there are no processes that can effectively transfer it to resistive scales) while the magnetic and total energy are efficiently dissipated; that is, magnetic helicity is an adiabatic invariant in weakly non-ideal MHD. Therefore, one can find probability distribution P ( k c ) for magnetohydrodynamics dominated by magnetic helicity using the dimensional considerations and a scaling relationship [26],
B c | h m | 1 / 2 k c 1 / 2
relating the characteristic value of the magnetic field B c to the characteristic value of the wavenumber k c .
If the positive variable B c has the half-normal probability distribution P ( B c ) exp ( B c 2 / 2 σ 2 ) [27] (it is a normal distribution with zero mean truncated to only have a nonzero probability density for positive values of its argument; if B is a normal random variable, then B c = | B | has a half-normal distribution [28]), then it follows from Equation (7) that the characteristic value of the wavenumber k c has a chi-squared ( χ 2 ) distribution.
P ( k c ) k c 1 / 2 exp ( k c / 4 k β )
Here, k β is a new constant.
Substituting Equation (8) into Equation (6), we obtain
E ( k ) exp ( k / k β ) 1 / 2

2.3. Spontaneous Breaking of Local Reflectional Symmetry

In the special case of global (net) reflectional symmetry, the mean (net) magnetic helicity is equal to zero, while the point-wise magnetic helicity generally is not (due to the spontaneous breaking of the local reflectional symmetry). This is an intrinsic property of chaotic/turbulent flows. Blobs with non-zero kinetic/magnetic helicity can accompany spontaneous symmetry breaking [23,29,30,31,32,33]. A magnetic blob is bounded by the magnetic surface with b n · n = 0 (where n is a unit normal to the boundary of the magnetic blob). The sign-defined magnetic helicity of the magnetic blob is an ideal (adiabatic) invariant [23]. The magnetic blobs can be numbered, and H j ± denotes the helicity of the magnetic blob with number j and the blob’s helicity sign ‘+’ or ‘−’, as follows:
H j ± = V j ( a ( x , t ) · b ( x , t ) )   d x
Then we can consider the ideal adiabatic invariant
I ± = lim V 1 V j H j ±
The summation in Equation (11) is performed on the blobs with a certain sign only (‘+’ or ‘−’), and V is the entire volume of the blobs over which the summation Equation (11) was made.
The adiabatic invariant I ± Equation (11) can be used instead of h m in the estimation Equation (7) in cases of the local symmetry breaking.
B c | I ± | 1 / 2 k c 1 / 2
and the same spectrum in Equation (9) can be obtained for this case.

2.4. Examples

One can recognize the spectrum in Equation (9) in Figure 1 and Figure 2.
It should be noted that the DNS used to compute the spectra shown in Figure 1 was globally nonhelical [34] (see previous subsection).
In this DNS, the standard MHD equations in the Alfvénic units for incompressible fluid,
  t u + ( u · ) u = p + b 2 2 + b · b + ν 2 u + f
  t b = u · b + b · u + η 2 b
  · u = 0 ,     · b = 0 ,
were solved in a periodic spatial cube.
The dynamo DNS was initialized with seed random nonhelical magnetic fluctuations. The velocity force f was also nonhelical and random (white-noise-like). Therefore, the appearance of the spectrum in Equation (9) at R e = 622 in this case should be related to the spontaneous breaking of local reflectional symmetry (further randomization— β = 1 / 4 for R e = 1320 can also be related to the symmetry breaking; see the next section).
One can expect that small-scale dynamos will play a more significant role at the large R e m . A small-scale dynamo populates the chaotic/turbulent fluid with localized, highly intense structures and can affect the dynamic process faster than a large-scale dynamo [35]. The spontaneous breaking of local reflectional symmetry should also be more effective in this case. Therefore, let us consider a small-scale dynamo at a large R e m .
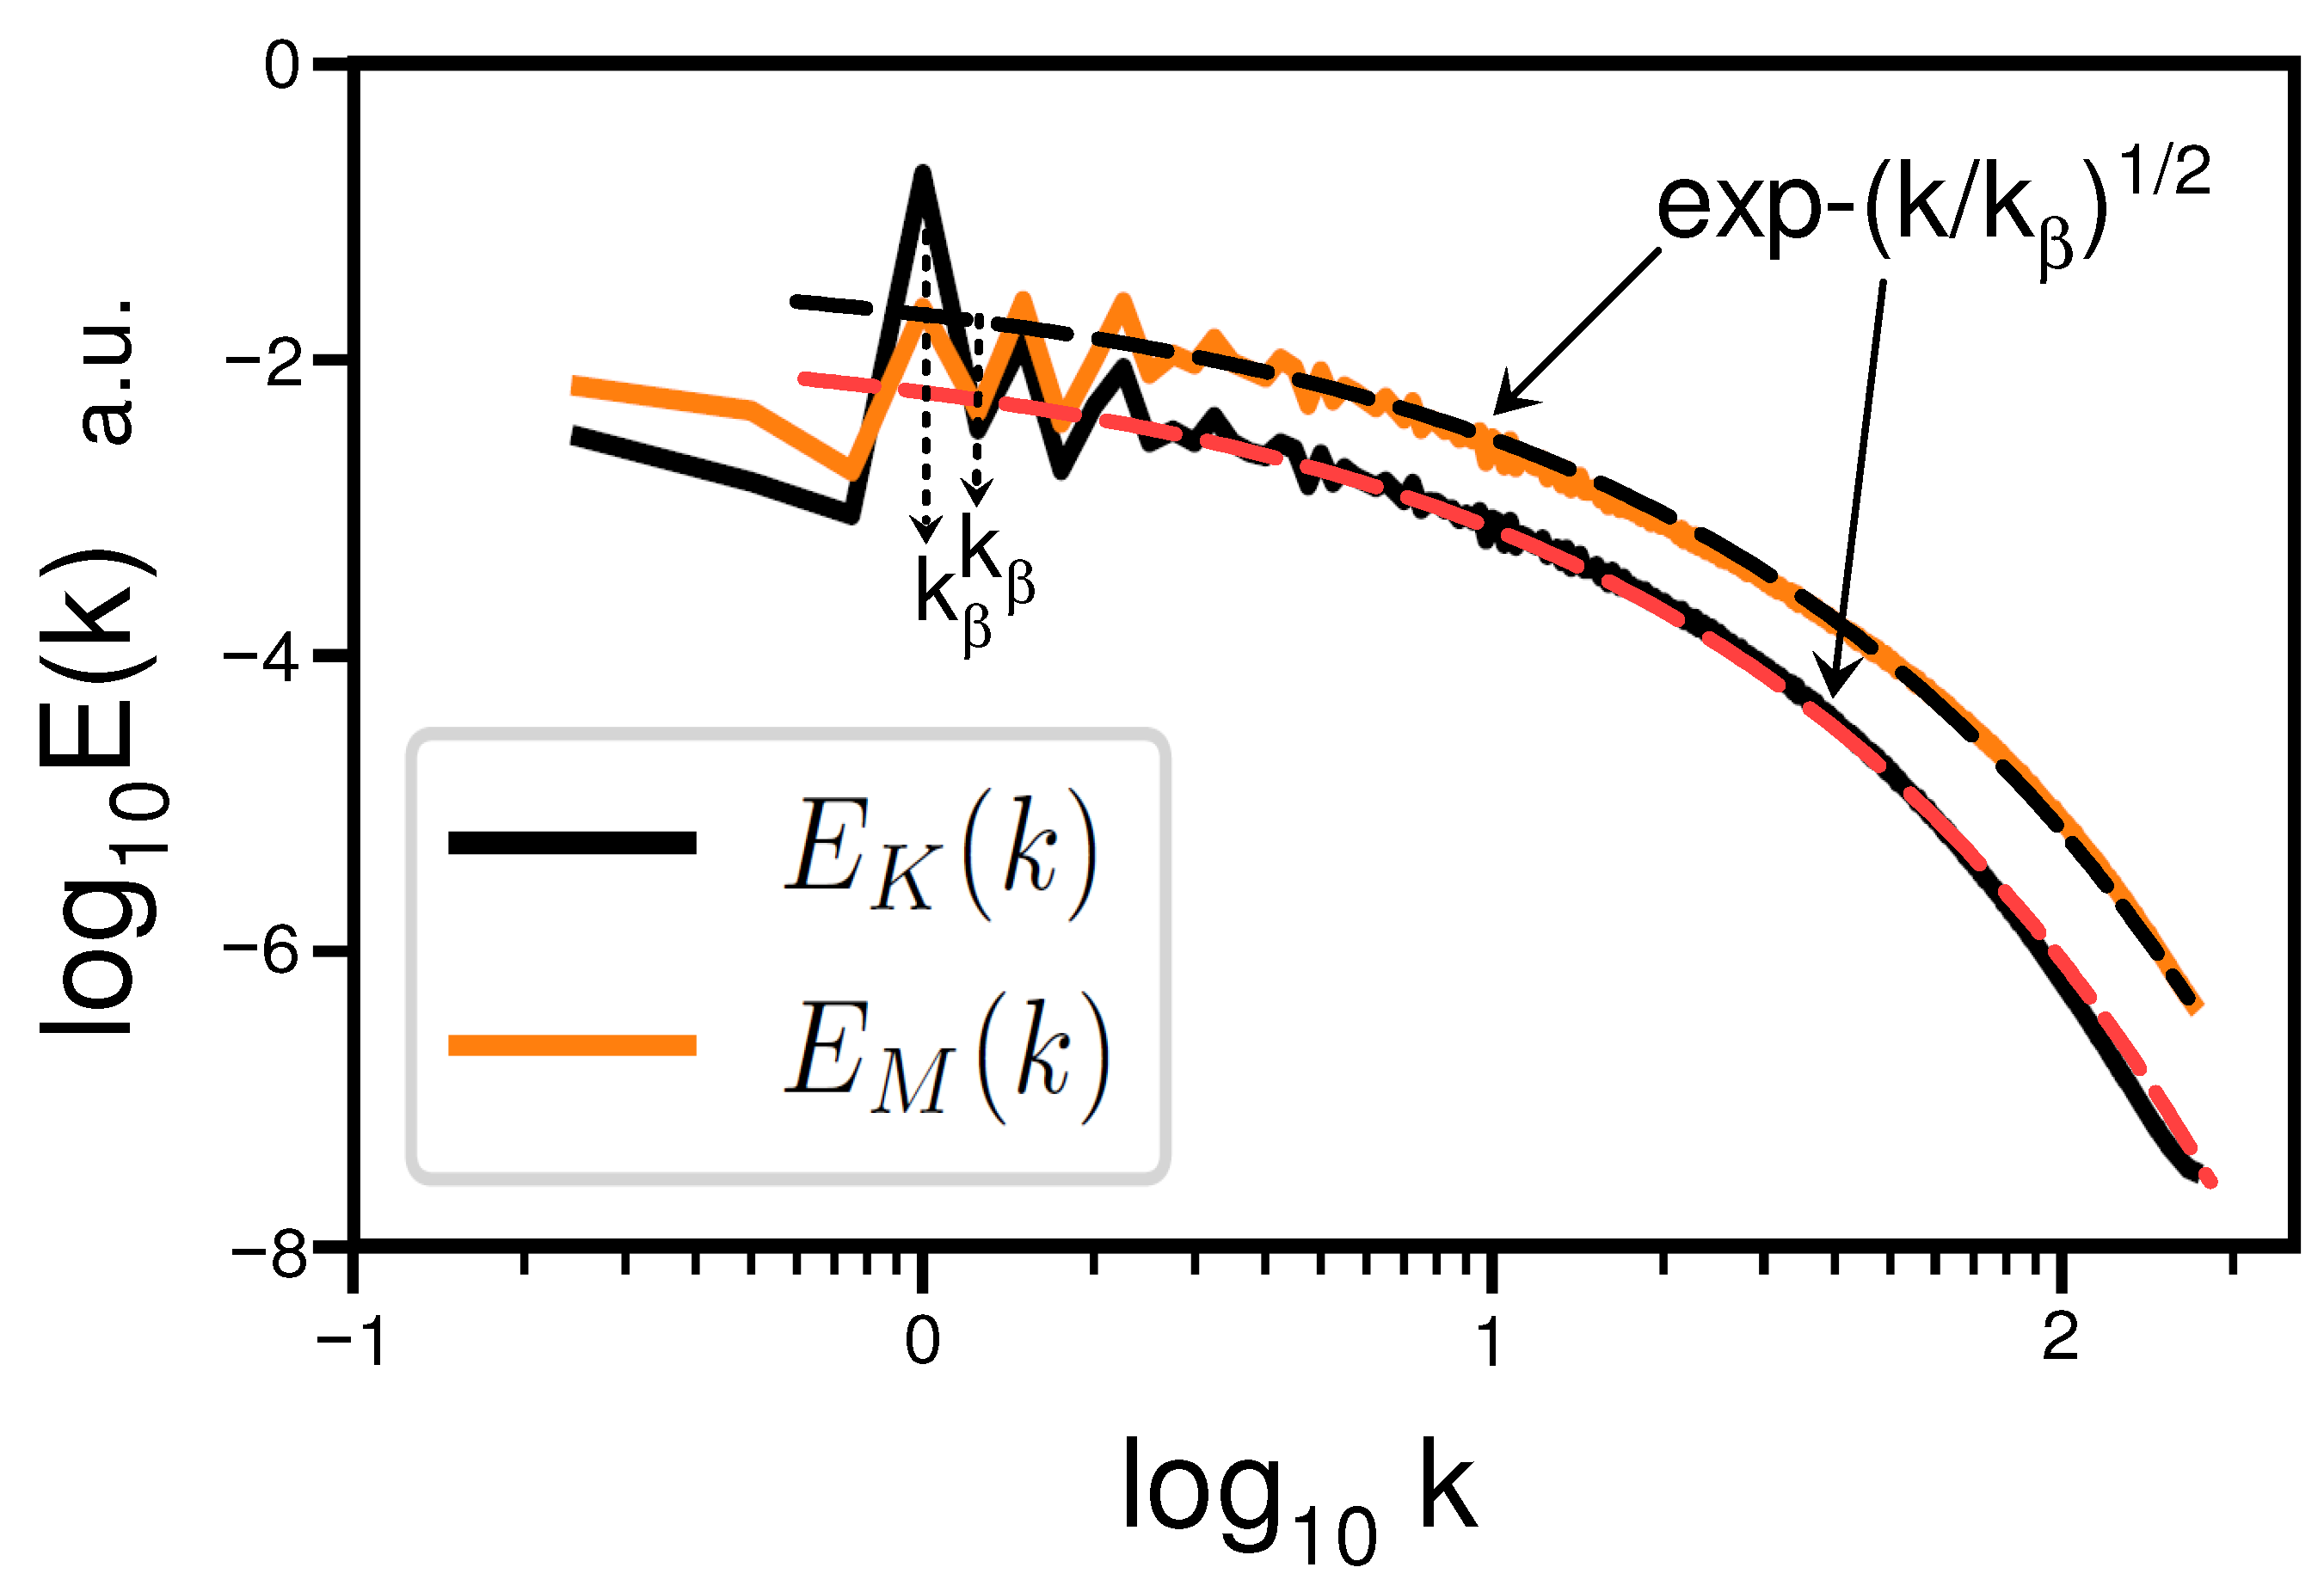
Figure 3 shows magnetic (up) and kinetic (bottom) saturated energy spectra computed in a DNS reported in a recent paper [35]. The spectral data were taken from Figure 5 of Ref. [35]. The energy input f into the system in Equations (13)–(15) was purely kinetic and nonhelical. The wavenumber in Figure 3 was normalized by the forcing wavenumber k f . The magnetic Reynolds number R e m = 2800 , and the magnetic Prandtl number P r m = 4 . Due to global reflectional symmetry, net helicity was negligible, whereas the local helicities were strong (the spontaneous breaking of local reflectional symmetry). The dashed curves indicate the helical energy spectra in Equation (9).

3. Magnetoinertial Range of Scales

In hydrodynamic turbulence, the existence of an inertial range of scales is expected for high Reynolds numbers. In this range, the statistical characteristics of the motion depend on the kinetic energy dissipation rate ε only [27]. In magnetohydrodynamics, a magnetoinertial range of scales can be introduced. In this range, two parameters, the magnetic helicity dissipation rate ε h (or dissipation rate of its modification I ± ; Equation (11)) and the total energy dissipation rate ε , govern the magnetic field dynamics. An analogous situation with two governing parameters (the kinetic dissipation rate and the passive scalar dissipation rate) was studied for the inertial–convective range in the Corrsin–Obukhov approach [27] (see also Ref. [36]). Let us, following this analogy, replace the estimates Equations (7) and (12) by the estimate [26]
B c ε h 1 / 2   ε 1 / 6   k c 1 / 6
for the magnetoinertial range dominated by magnetic helicity.
The estimates Equations (7), (12) and (16) can be generalized as
B c k c α
Let us look for the spectrum of distributed chaos as a stretched exponential (see Introduction and Equation (9))
E ( k ) 0 P ( k c ) exp ( k / k c ) d k c exp ( k / k β ) β
Equation (18) can be used to estimate the probability distribution P ( k c ) for large k c [37].
P ( k c ) k c 1 + β / [ 2 ( 1 β ) ]   exp ( γ k c β / ( 1 β ) )
A relationship between the exponents β and α can be readily obtained (using some algebra) from Equations (17) and (19) for the half-normally distributed B c .
β = 2 α 1 + 2 α
Since, for the magnetoinertial range (dominated by magnetic helicity), α = 1 / 6 (see Equation (16)), the corresponding magnetic energy spectrum can be estimated as
E ( k ) exp ( k / k β ) 1 / 4
The spectrum Equation (21) can be recognized in Figure 1 and Figure 2 and can be considered a precursor to hard turbulence.
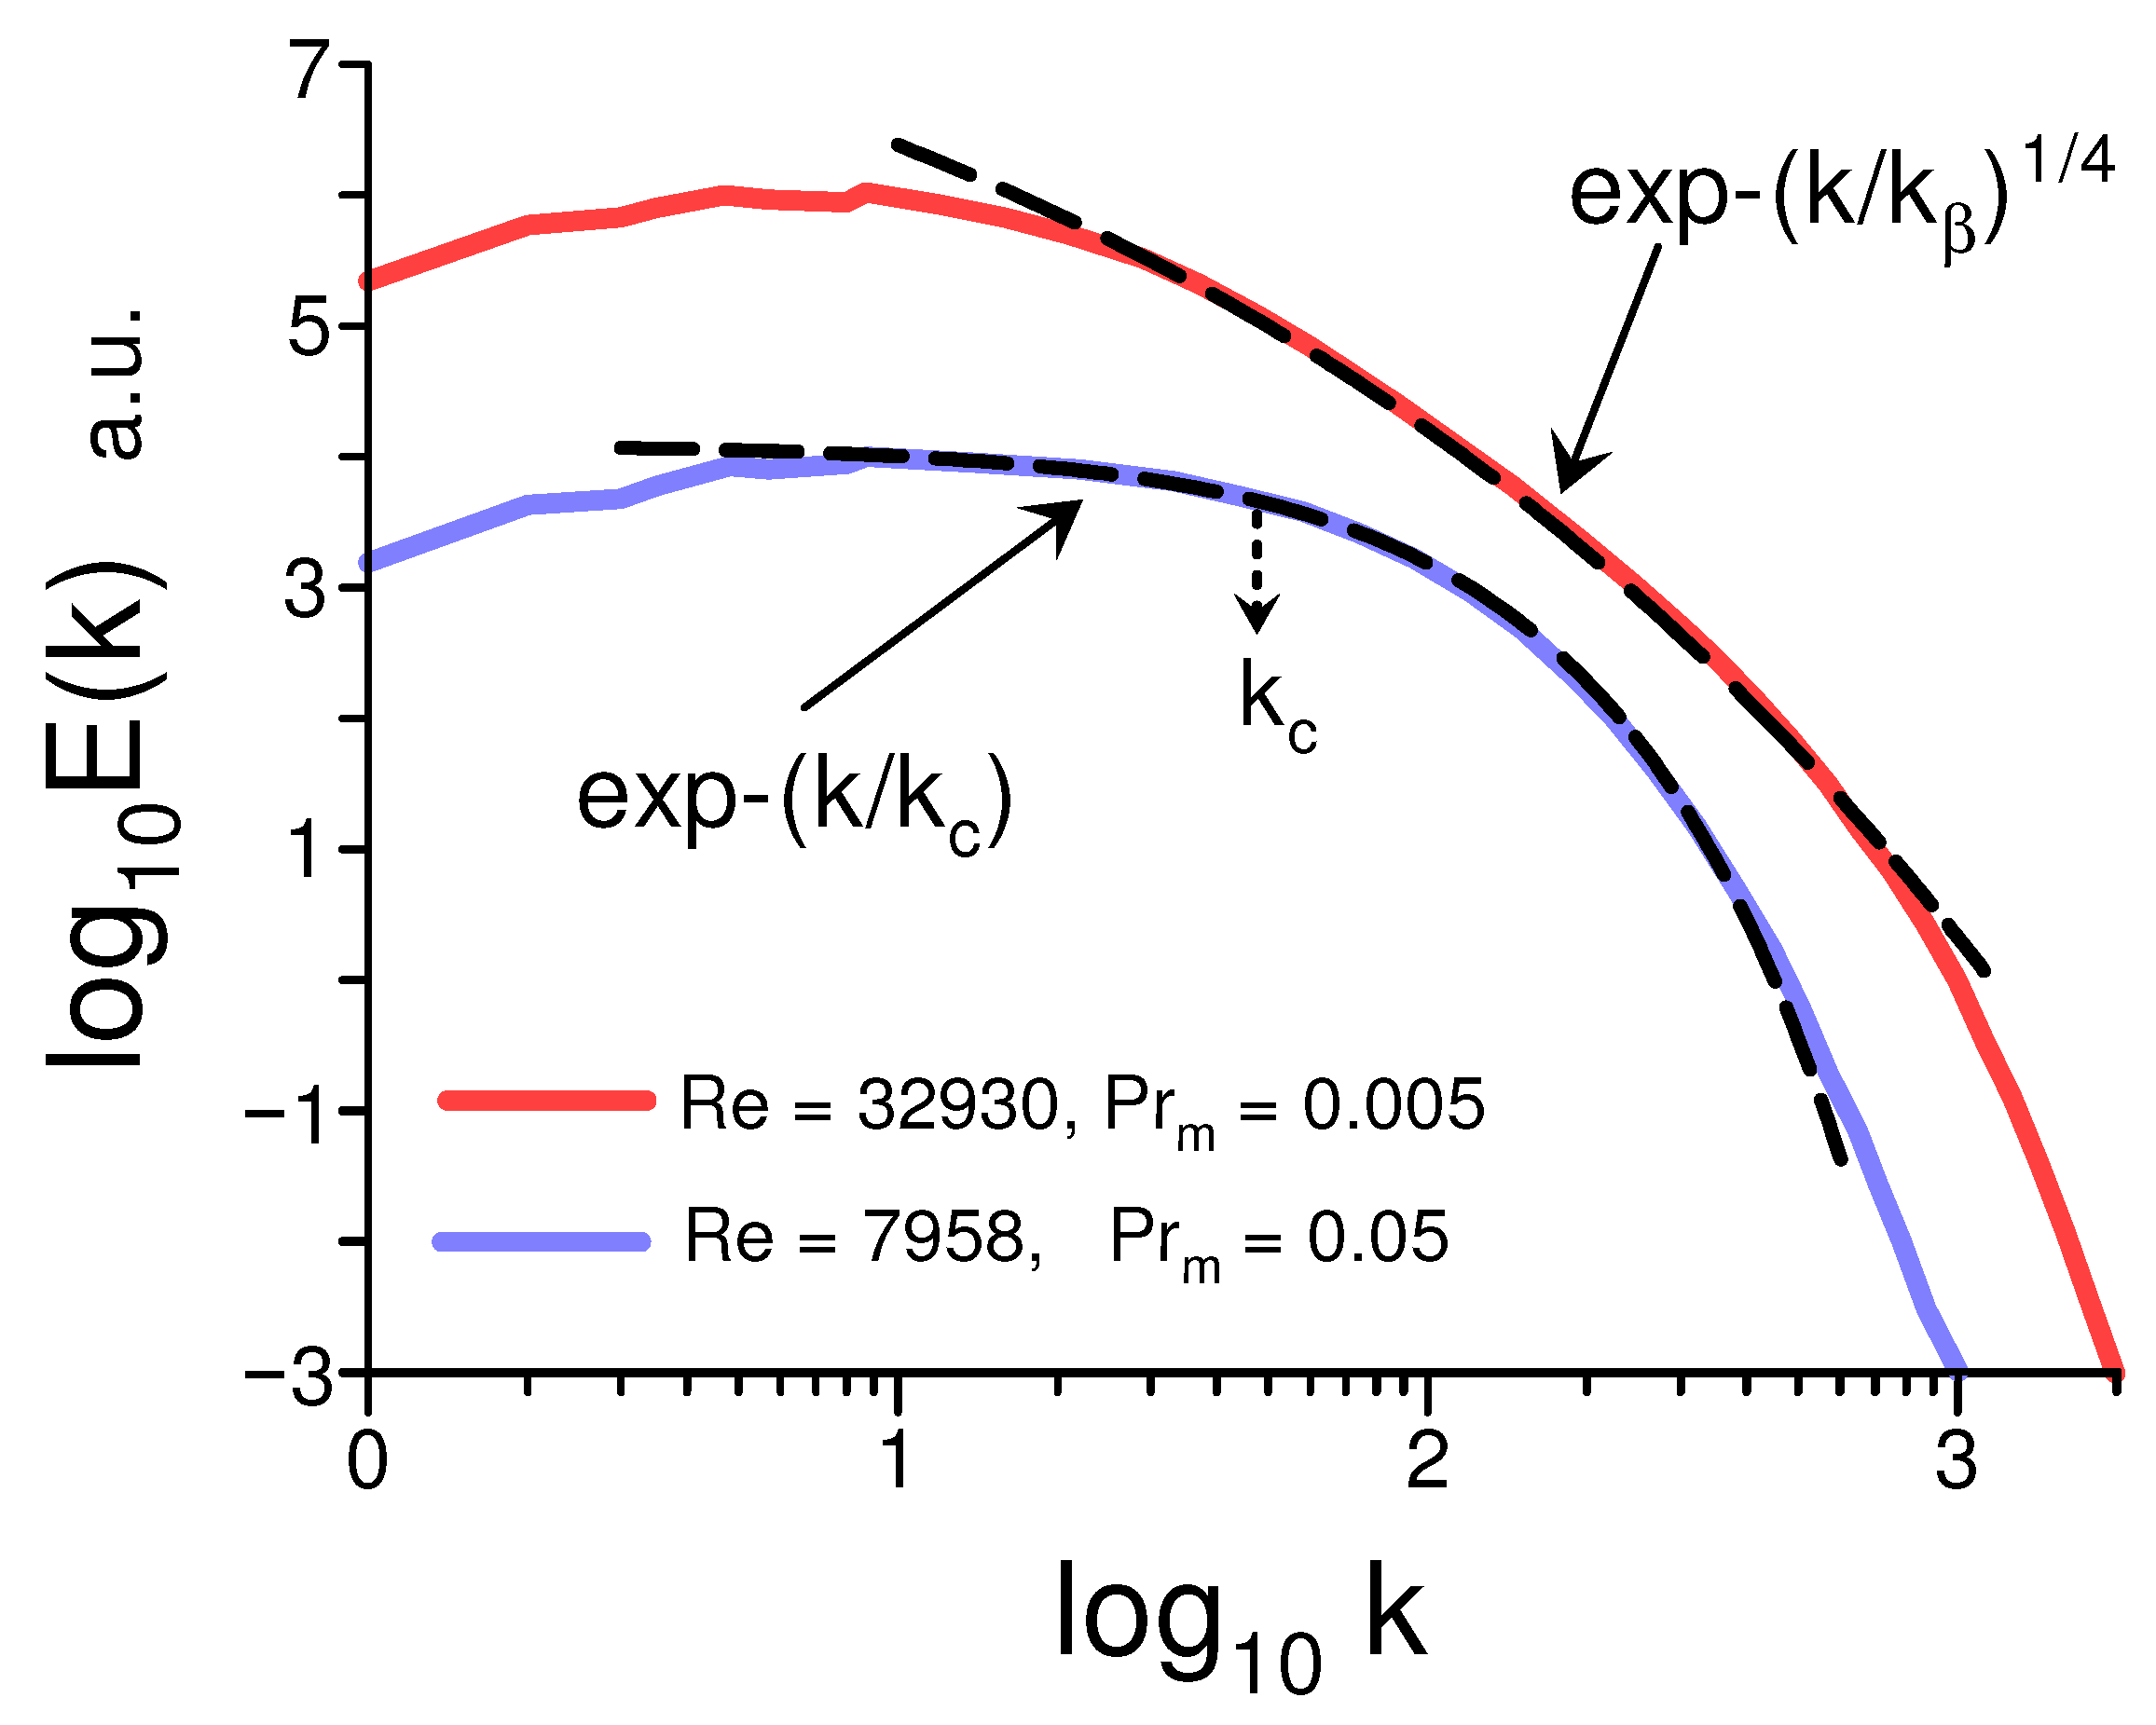
Figure 4 shows magnetic energy spectra computed in a recent paper (Ref. [6]), using direct numerical simulations of isothermal forced turbulence. Ref. [6] numerically studied the small-scale dynamo at rather low Prandtl numbers and significantly large Reynolds numbers. The spectral data were taken from Figure 4 of Ref. [6]. The boundary conditions were periodic, and the small-scale dynamo was initialized by a seed magnetic field with weak Gaussian noise.
The dashed curves indicate the magnetic energy spectrum in Equation (2) (deterministic chaos) for R e = 7958 and P r m = 0.05 and the magnetic energy spectrum in Equation (21) for R e = 32,930 and P r m = 0.005 (distributed chaos in the magnetoinertial range of scales).

4. Dissipative Distributed Chaos

4.1. Dissipative MHD Invariants

For hydrodynamics, dissipative invariants were introduced by Loitsianskii [27] (Loitsianskii integral) and Birkhoff [38] and Saffman (Birkhoff–Saffman integral) [39]. Chandrasekhar extended this notion on dissipative magnetohydrodynamics [40].
Originally, the dissipative invariants were used to estimate energy spectra at small wavenumbers [27,39]. Therefore, the restrictions related to isotropy and homogeneity were rather strict, as was the possible extension of the notion of dissipative invariants on magnetohydrodynamics. However, if one applies these invariants to larger wavenumbers (as will be performed below in the framework of the distributed chaos notion), these restrictions can be eased to local isotropy and homogeneity and to adiabatic invariance (i.e., a slow change with time in comparison to the time scales characteristic to the distributed chaos range).
The MHD Kármán–Howarth equation in terms of Elsässer variables z ± = v ± b can be written as [41]
z L ± z L ± t = r + 4 r C L L L ± ( r ) + 2 2 r 2 + 4 r D L L
where the subscript L denotes projections of z ± on r (longitudinal, i.e., z L ± = z ± · r / r ), z ± = z ± ( x + r , t ) , D L L ( r ) = [ ν + z L ± z L ± + ν z L ± z L ] , C L L L ± ( r ) = z L ± z L z L ± , ν ± = ν ± η .
Multiplying both sides of the Kármán–Howarth Equation (22) by r 4 and then integrating them on r from 0 to R, we obtain
0 R r 4 z L ± z L ± d r t = R 4 C L L L ± ( R ) + 2 R 4 D L L r r = R
If the terms
C L L L ± ( R )     and     D LL r r = R 0
are fast enough when R , then
lim r R 0 R r 4 z L ± z L ± d r t = 0
and, as a consequence,
r 2 z L ± z L ± d r = constant
Returning to the velocity and magnetic fields, we obtain
r 2 [ v L v L + b L b L ]   d r = constant
It is shown in paper [40] that
r 2 v L v L   d r = constant
Then, it follows from Equations (26) and (27) that
L b = r 2 b L b L   d r = constant
The integral L b can be considered a magnetic analogy of the Loitsianskii (adiabatic) invariant.
Analogously, using another form of the Kármán–Howarth equation suggested in Ref. [42], it can be shown that the magnetic analogy of the Birkhoff–Saffman integral is also a dissipative (adiabatic) invariant.
S b = b · b   d r = constant

4.2. Dissipative Distributed Chaos

In a range of scales dominated by the magnetic Birkhoff–Saffman invariant in Equation (29), the estimate in Equation (7) should be replaced by the estimate
B c S b 1 / 2 k c 3 / 2
i.e., α = 3 / 2 in this case. Using the relationship in Equation (20) we obtain β = 3 / 4 , which corresponds to the magnetic energy spectrum
E ( k ) exp ( k / k β ) 3 / 4 .
Analogously, in a range of scales dominated by the magnetic Loitsianskii invariant in Equation (28), the estimate in Equation (7) should be replaced by the estimate
B c L b 1 / 2 k c 5 / 2
i.e., α = 5 / 2 in this case. Using the relationship in Equation (20), we obtain β = 5 / 6 , which corresponds to the magnetic energy spectrum
E ( k ) exp ( k / k β ) 5 / 6 .
One can recognize the spectra in Equations (31) in Figure 1 and Figure 2.
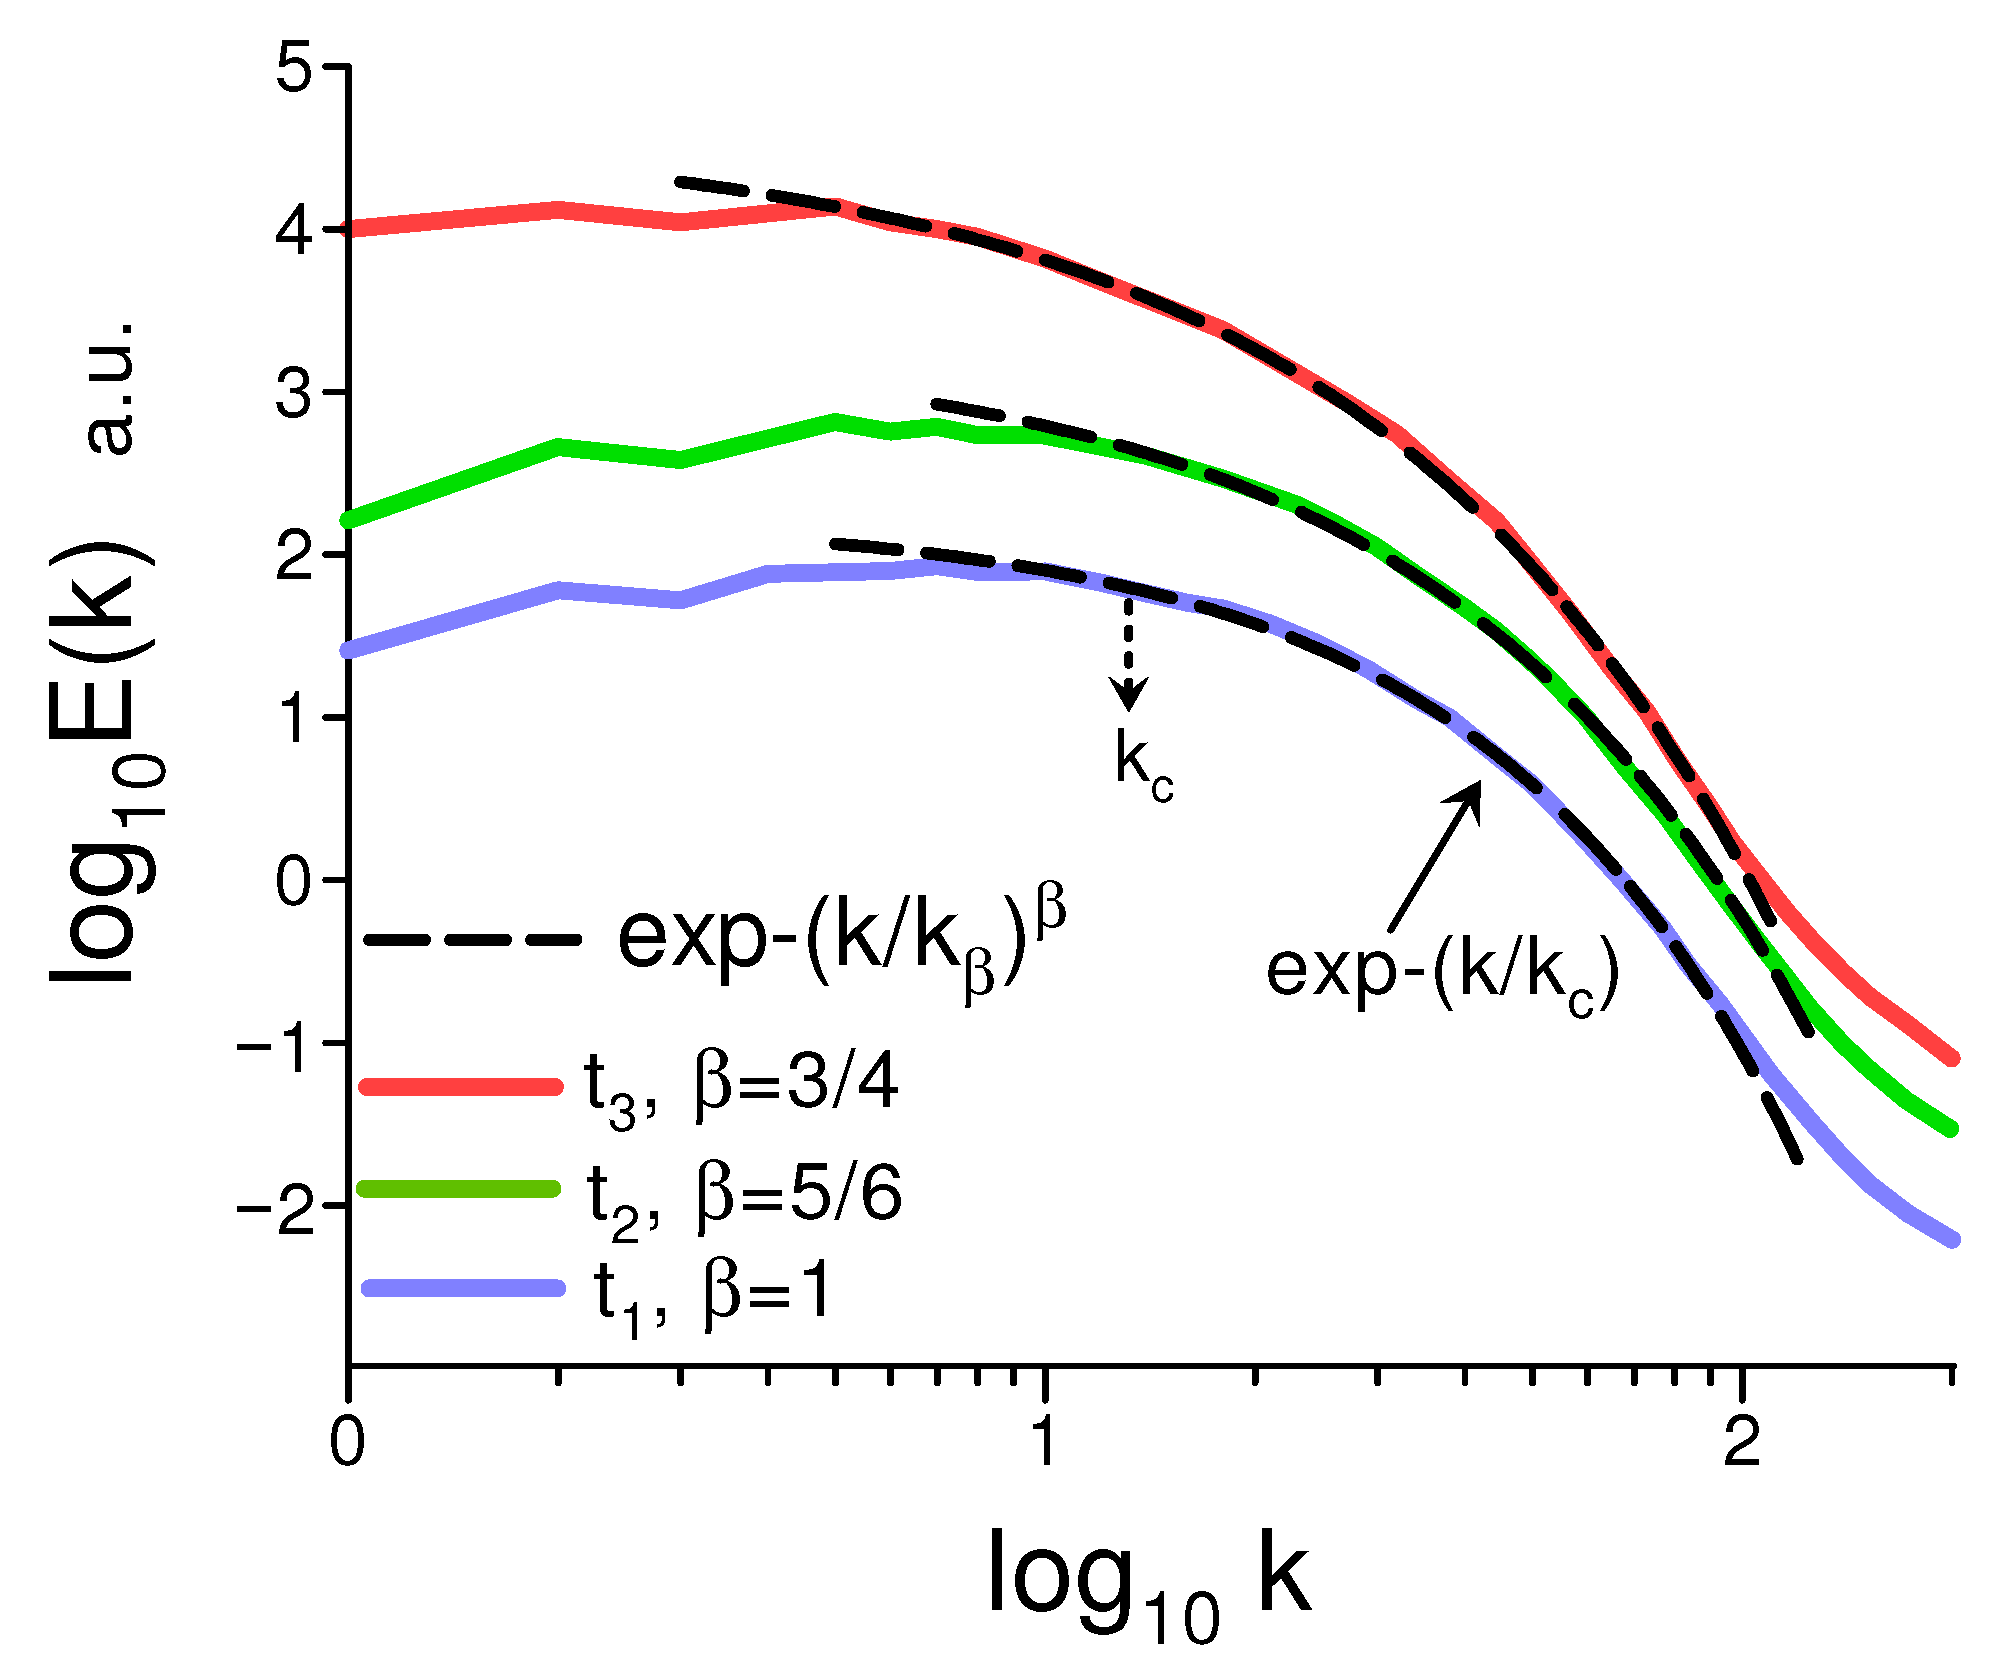
Figure 5 shows the magnetic energy spectra for different times of evolution ( t 1 < t 2 < t 3 ) of a direct, numerically simulated, small-scale dynamo (the spectral data were taken from Figure 2 of a recent paper, Ref. [43]). In this DNS, a non-helical, statistically isotropic, and homogeneous, small-scale dynamo in a randomly forced (a stochastic Ornstein–Uhlenbeck process) gas motion was performed in a periodic spatial cube. The transonic case considered here corresponds to the Mach numbers M = 1.1 , R e = 1250 , and P r m = 1 (the transonic motion consists of regions of both supersonic and subsonic motions).
The dashed curves indicate the best fit by the spectrum in Equation (2) (deterministic chaos at t 1 ) and by the spectra in Equations (31) and (33) (dissipative distributed chaos at t 2 and t 3 , respectively). The randomness becomes stronger with the increase in time of the dynamo’s evolution (cf. Figure 2).
More examples of the spectra in Equations (31) and (33) will be provided in the subsequent sections.

5. Hall Magnetohydrodynamics

In the ideal Hall MHD (unlike the standard magnetohydrodynamics), ions are not closely tied to the magnetic field due to their inertia. The electrons (which remain tied to the magnetic field) and ions decouple at the ions’ inertial length, d i .
The equations taking this phenomenon into account can be written in the form
  t u + ( u · ) u = p + b 2 2 + b · b + ν 2 u + f
t b = u · b + b · u + η 2 b + + d i j · b d i b · j
  · u = 0 ,     · b = 0 .
The last two terms of Equation (35) correspond to the Hall effect, where j = × b (cf. Equations (13)–(15) for standard magnetohydrodynamics).
Magnetic helicity is an ideal invariant for Hall magnetohydrodynamics [34,44,45], and the Kármán–Howarth equation can be written for Hall magnetohydrodynamics [46]. Therefore, the spectral laws in Equations (9), (21), (31) and (33) can also be obtained for Hall magnetohydrodynamics.
In Ref. [47], results of a DNS of a Hall MHD dynamo were reported. The DNS was performed in a periodic spatial cube with a size of L 0 , and helical large-scale hydrodynamic forcing was chosen as an ABC flow. A random small-scale seed magnetic field was introduced into the system after the flow reached a statistically steady state.
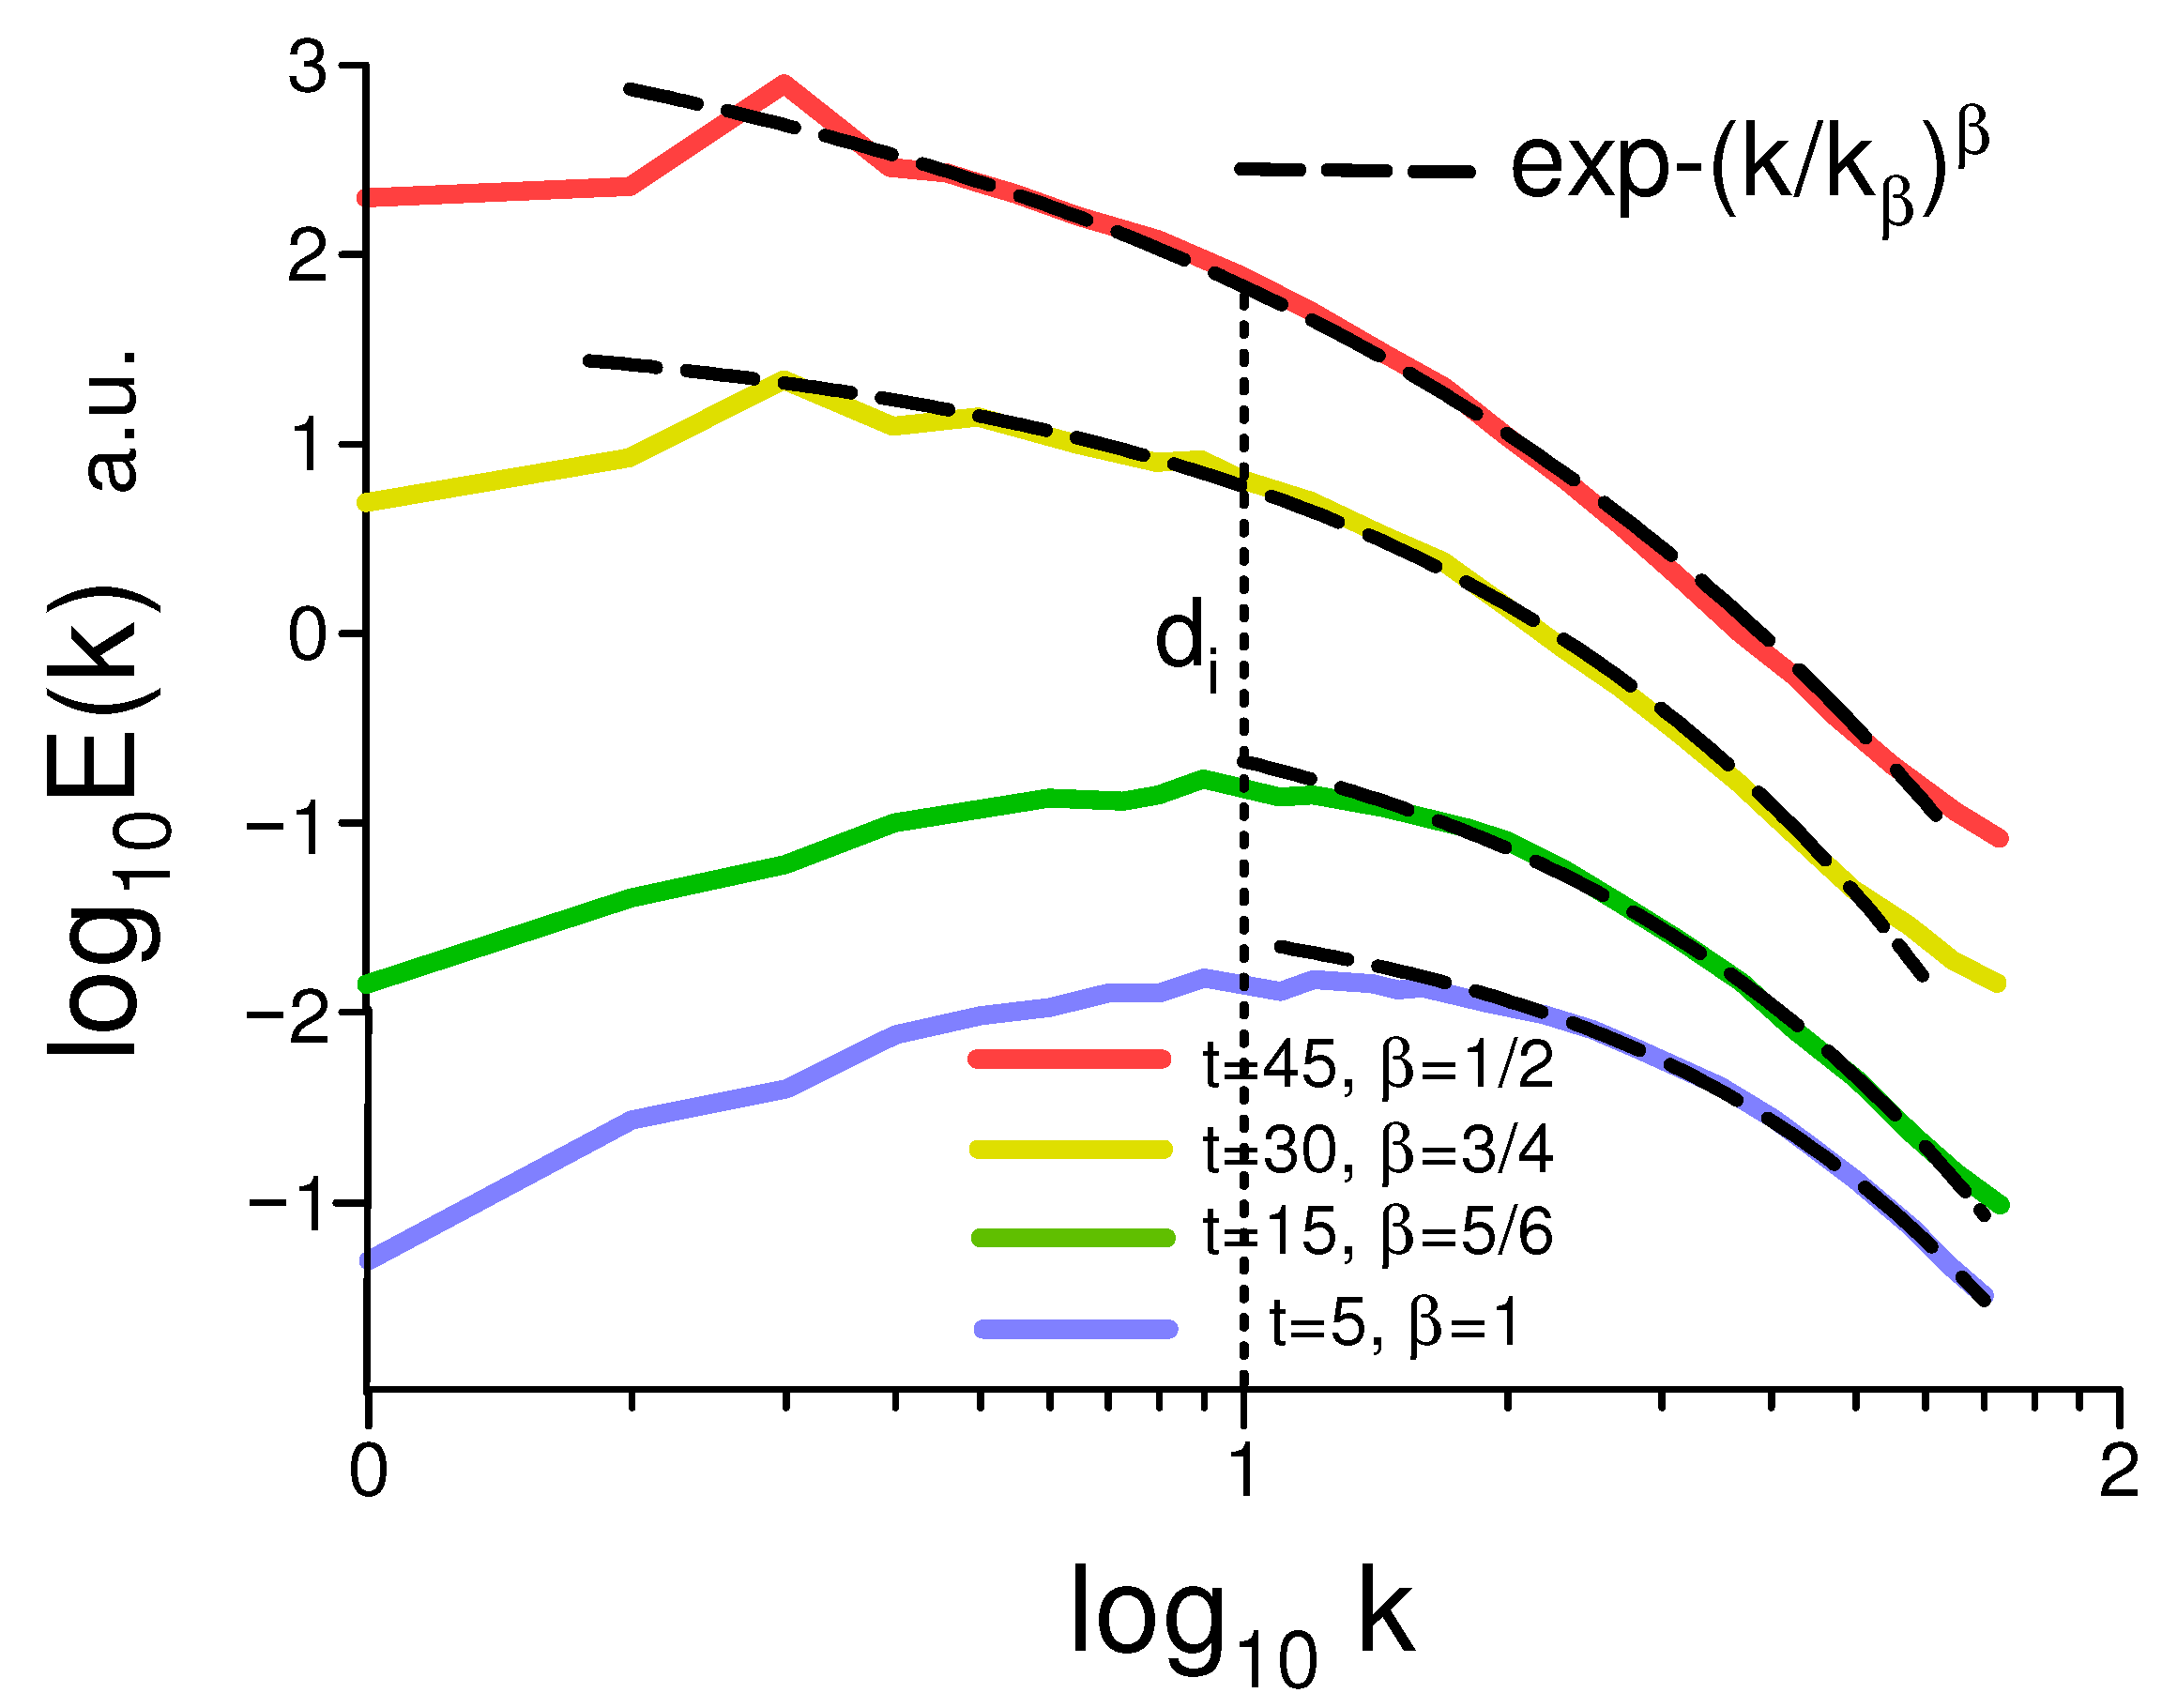
Figure 6 shows the time evolution of the magnetic energy spectrum at ε H = d i / L 0 = 0.1 (the spectral data were taken from Figure 2b of Ref. [47]). The dashed curve at t = 5 (the best fit) indicates the exponential spectrum in Equation (2) (i.e., deterministic chaos). The dashed curves at t = 15 and t = 30 indicate the stretched exponential spectra in Equation (33) and Equation (31) respectively, i.e., the dissipative distributed chaos dominated by the magnetic Loitsianskii and Birkhoff–Saffman adiabatic invariants. At a later time ( t = 45 ) of the dynamo’s development, we can observe the helical spectrum from Equation (9).
One can see that the randomness increases with the development of the Hall dynamo (cf. previous sections).

6. Solar Small-Scale MHD Dynamos

6.1. Numerical Simulations

Let us consider the results of two radiative MHD numerical simulations related to small-scale solar dynamos. In these numerical simulations, the MHD equations for a compressible flow were extended by adding an equation for the total energy to take the radiative flux into account.
In the first simulation [48], both viscous and resistive dissipation were taken into account. Standard models of the lower solar atmosphere and the solar interior were taken into account for initial conditions. A weak seed, uniform, vertical magnetic field was added to a fully developed solar convection to initiate a quiet-Sun, small-scale MHD dynamo.
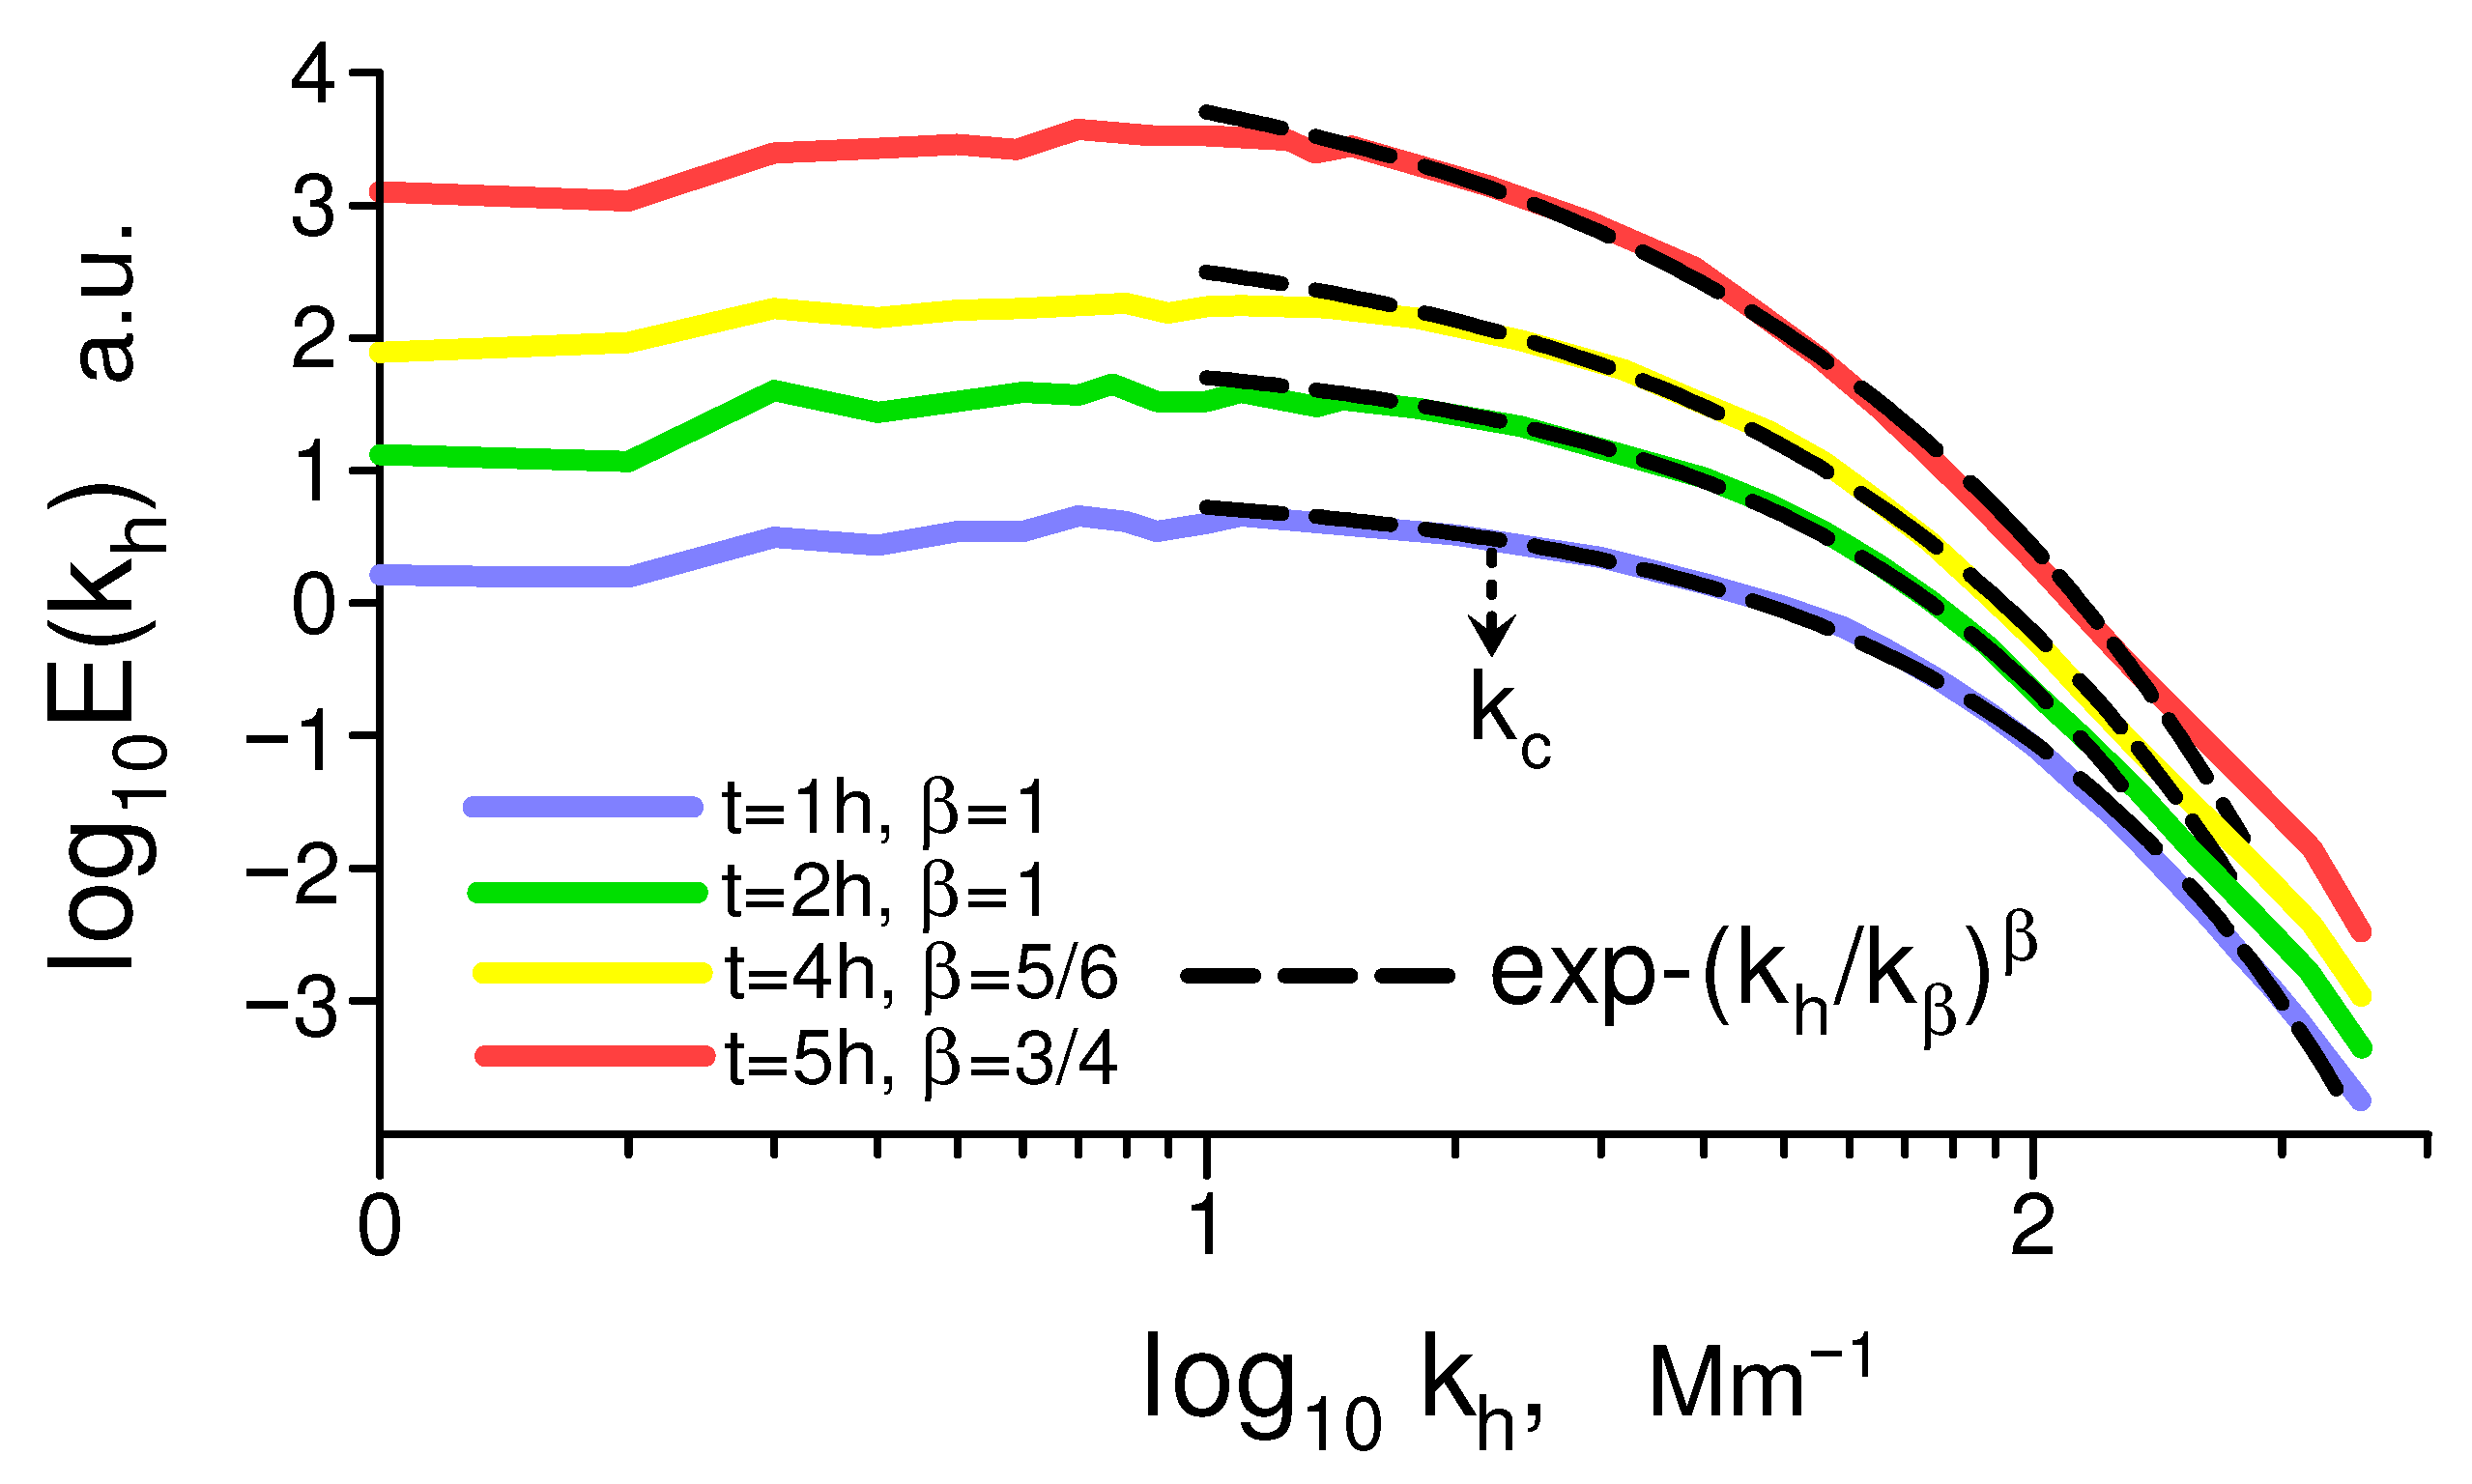
Figure 7 shows the magnetic energy spectra for a photospheric layer at different times of the dynamo’s evolution. The spectral data were taken from Figure 3b in Ref. [48] ( k h corresponds to the horizontal wavenumber). The two earlier time spectra ( t = 1 h and t = 2 h in simulation terms) are well-fitted by the exponential spectrum in Equation (2) ( β = 1 , deterministic chaos). The next spectrum ( t = 3 h) can be fitted by Equation (33) ( β = 5 / 6 , dissipative distributed chaos dominated by the magnetic Loitsianskii invariant); then, the spectrum at t = 4 h can be fitted by Equation (31) ( β = 3 / 4 , dissipative distributed chaos dominated by the magnetic Birkhoff–Saffman invariant).
The value of the parameter β decreases with the time of the dynamo evolution, indicating that the randomness of the generated magnetic field increases over time.
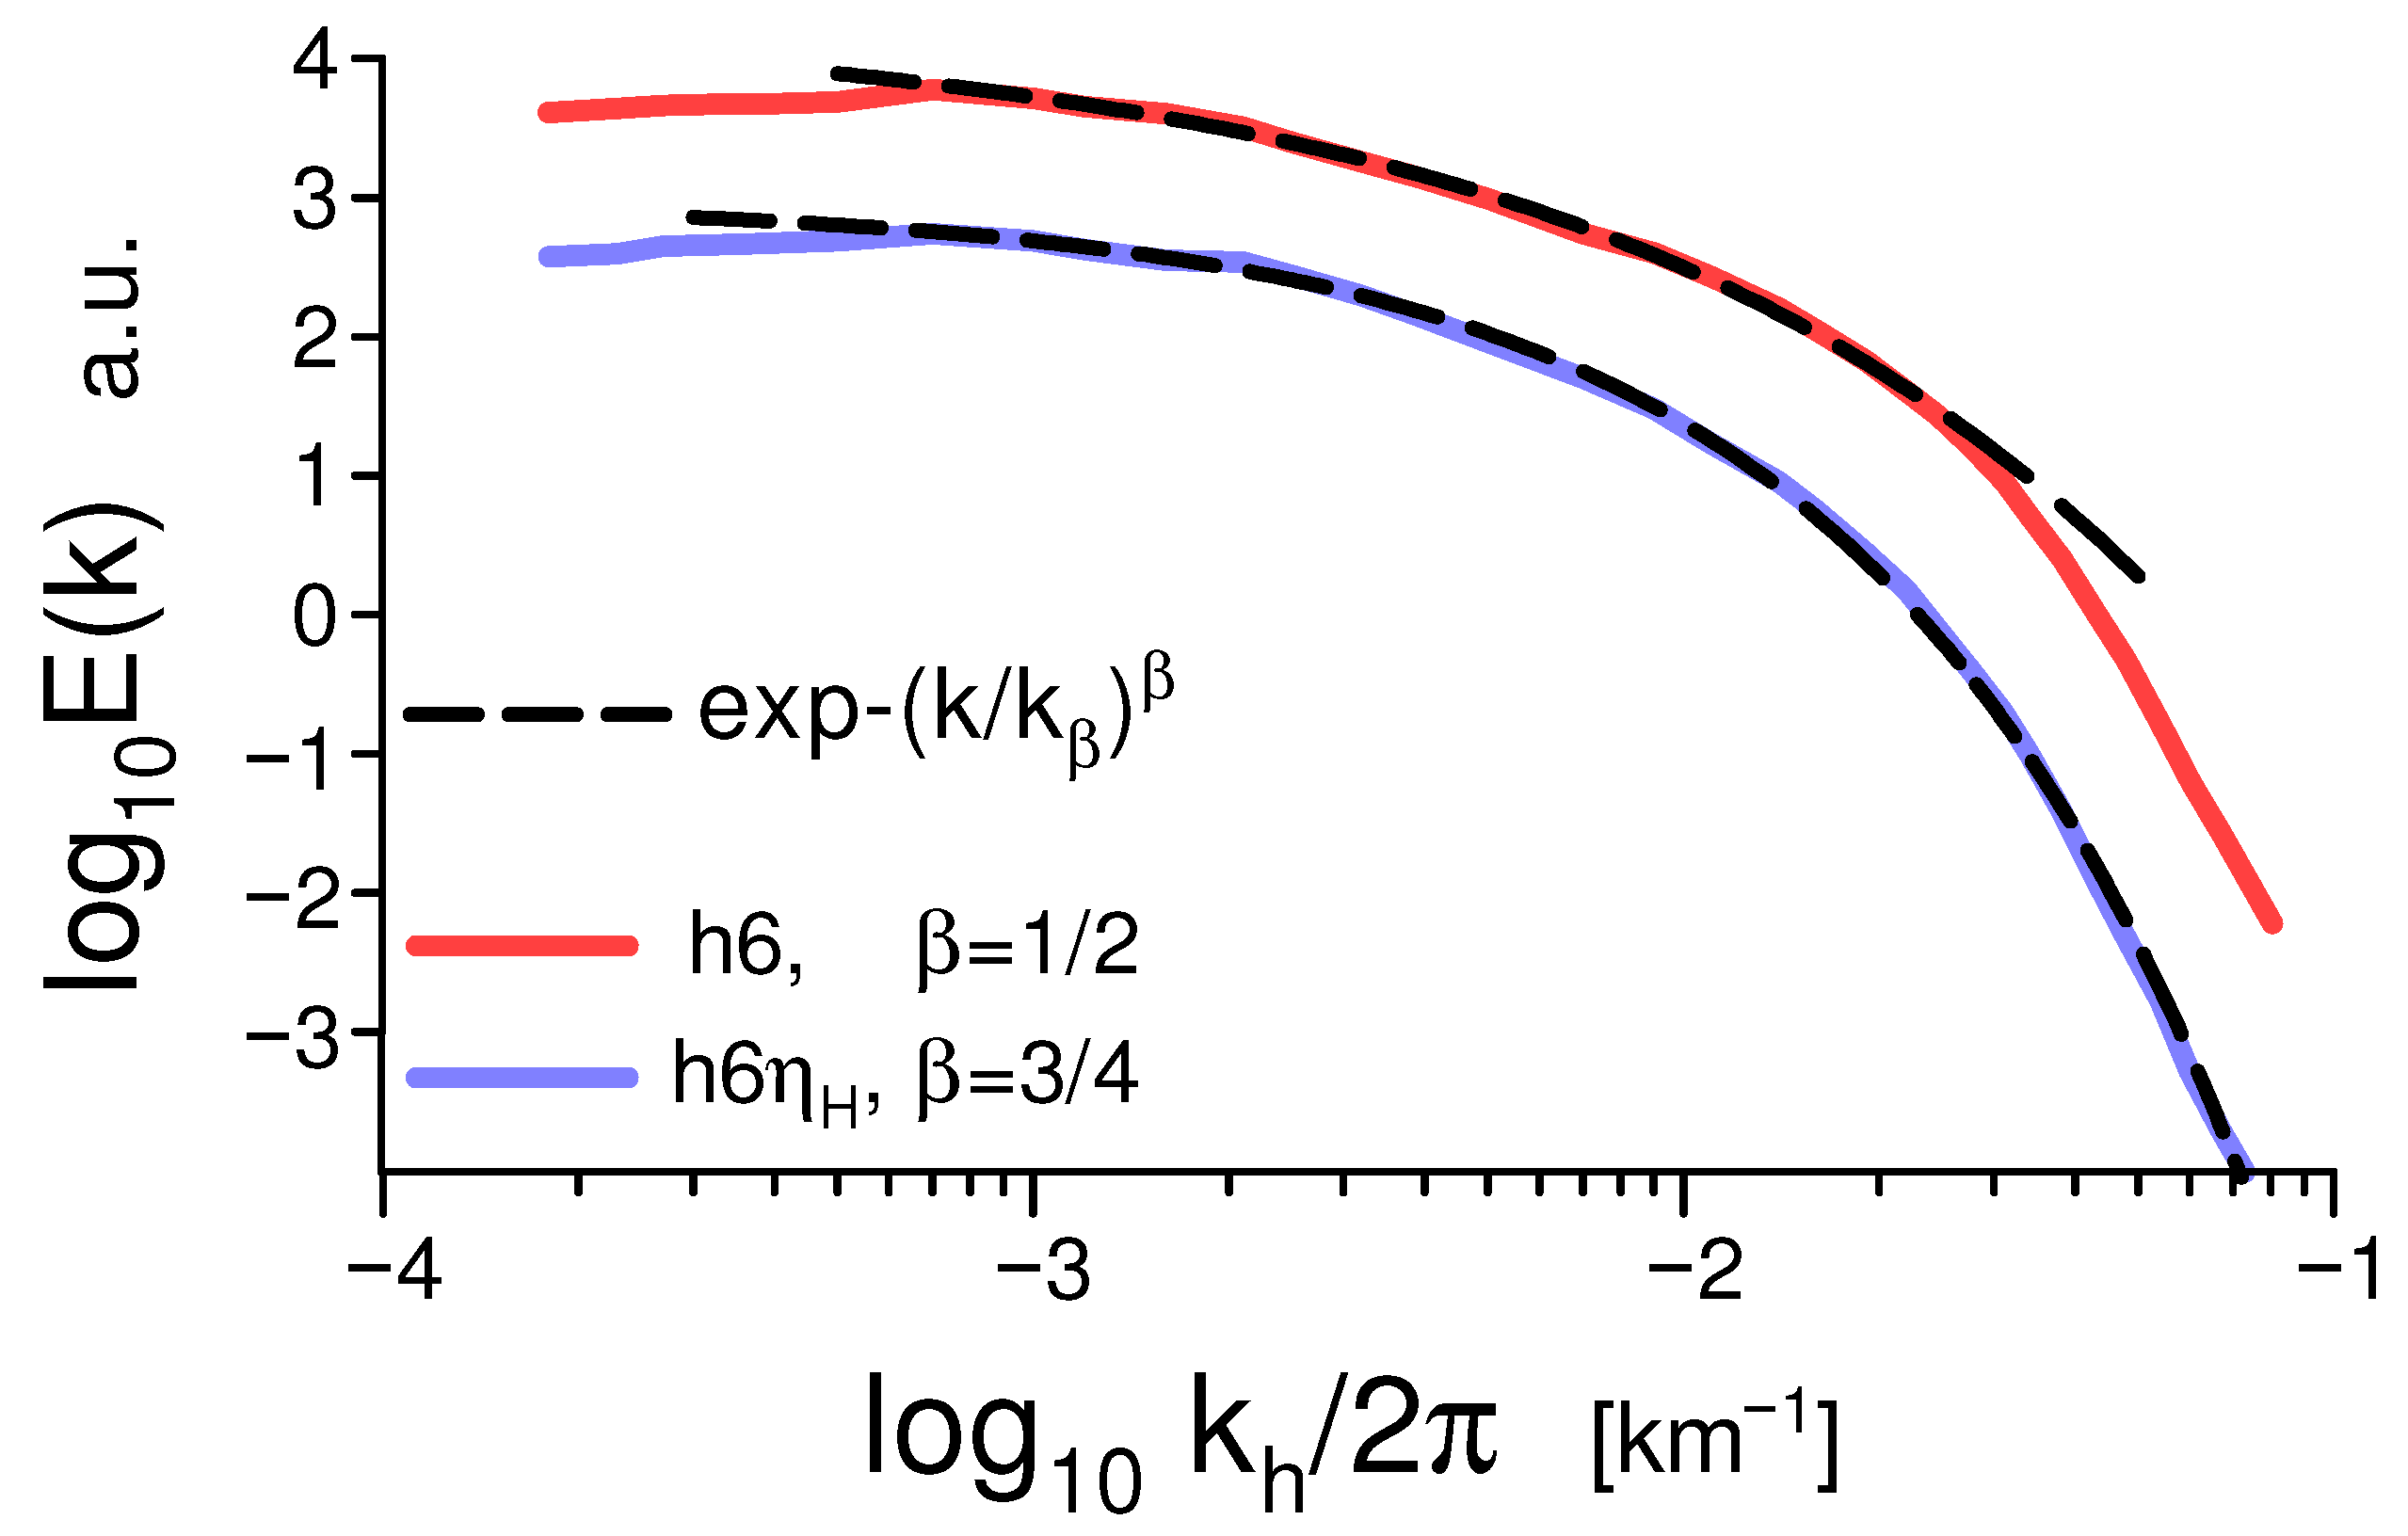
Figure 8 shows the magnetic energy spectra also generated by a small-scale radiative MHD dynamo initiated by a seed in a uniform vertical magnetic field and averaged over a vertical range between z = 0 km and z = 200 km, and over time. The spectral data were taken from Figure 3 in Ref. [49]. The bottom curve corresponds to the case with resistive dissipation, whereas the top curve corresponds to the ideal case (without the resistive dissipation). For both cases, the grid resolution h = 6 km.
The dashed curves indicate the best fit by Equation (31) ( β = 3 / 4 , dissipative distributed chaos dominated by the magnetic Birkhoff–Saffman invariant) for the dissipative case and by Equation (9) ( β = 1 / 2 , helical distributed chaos) for the ideal (non-dissipative) case.

6.2. Solar Observations

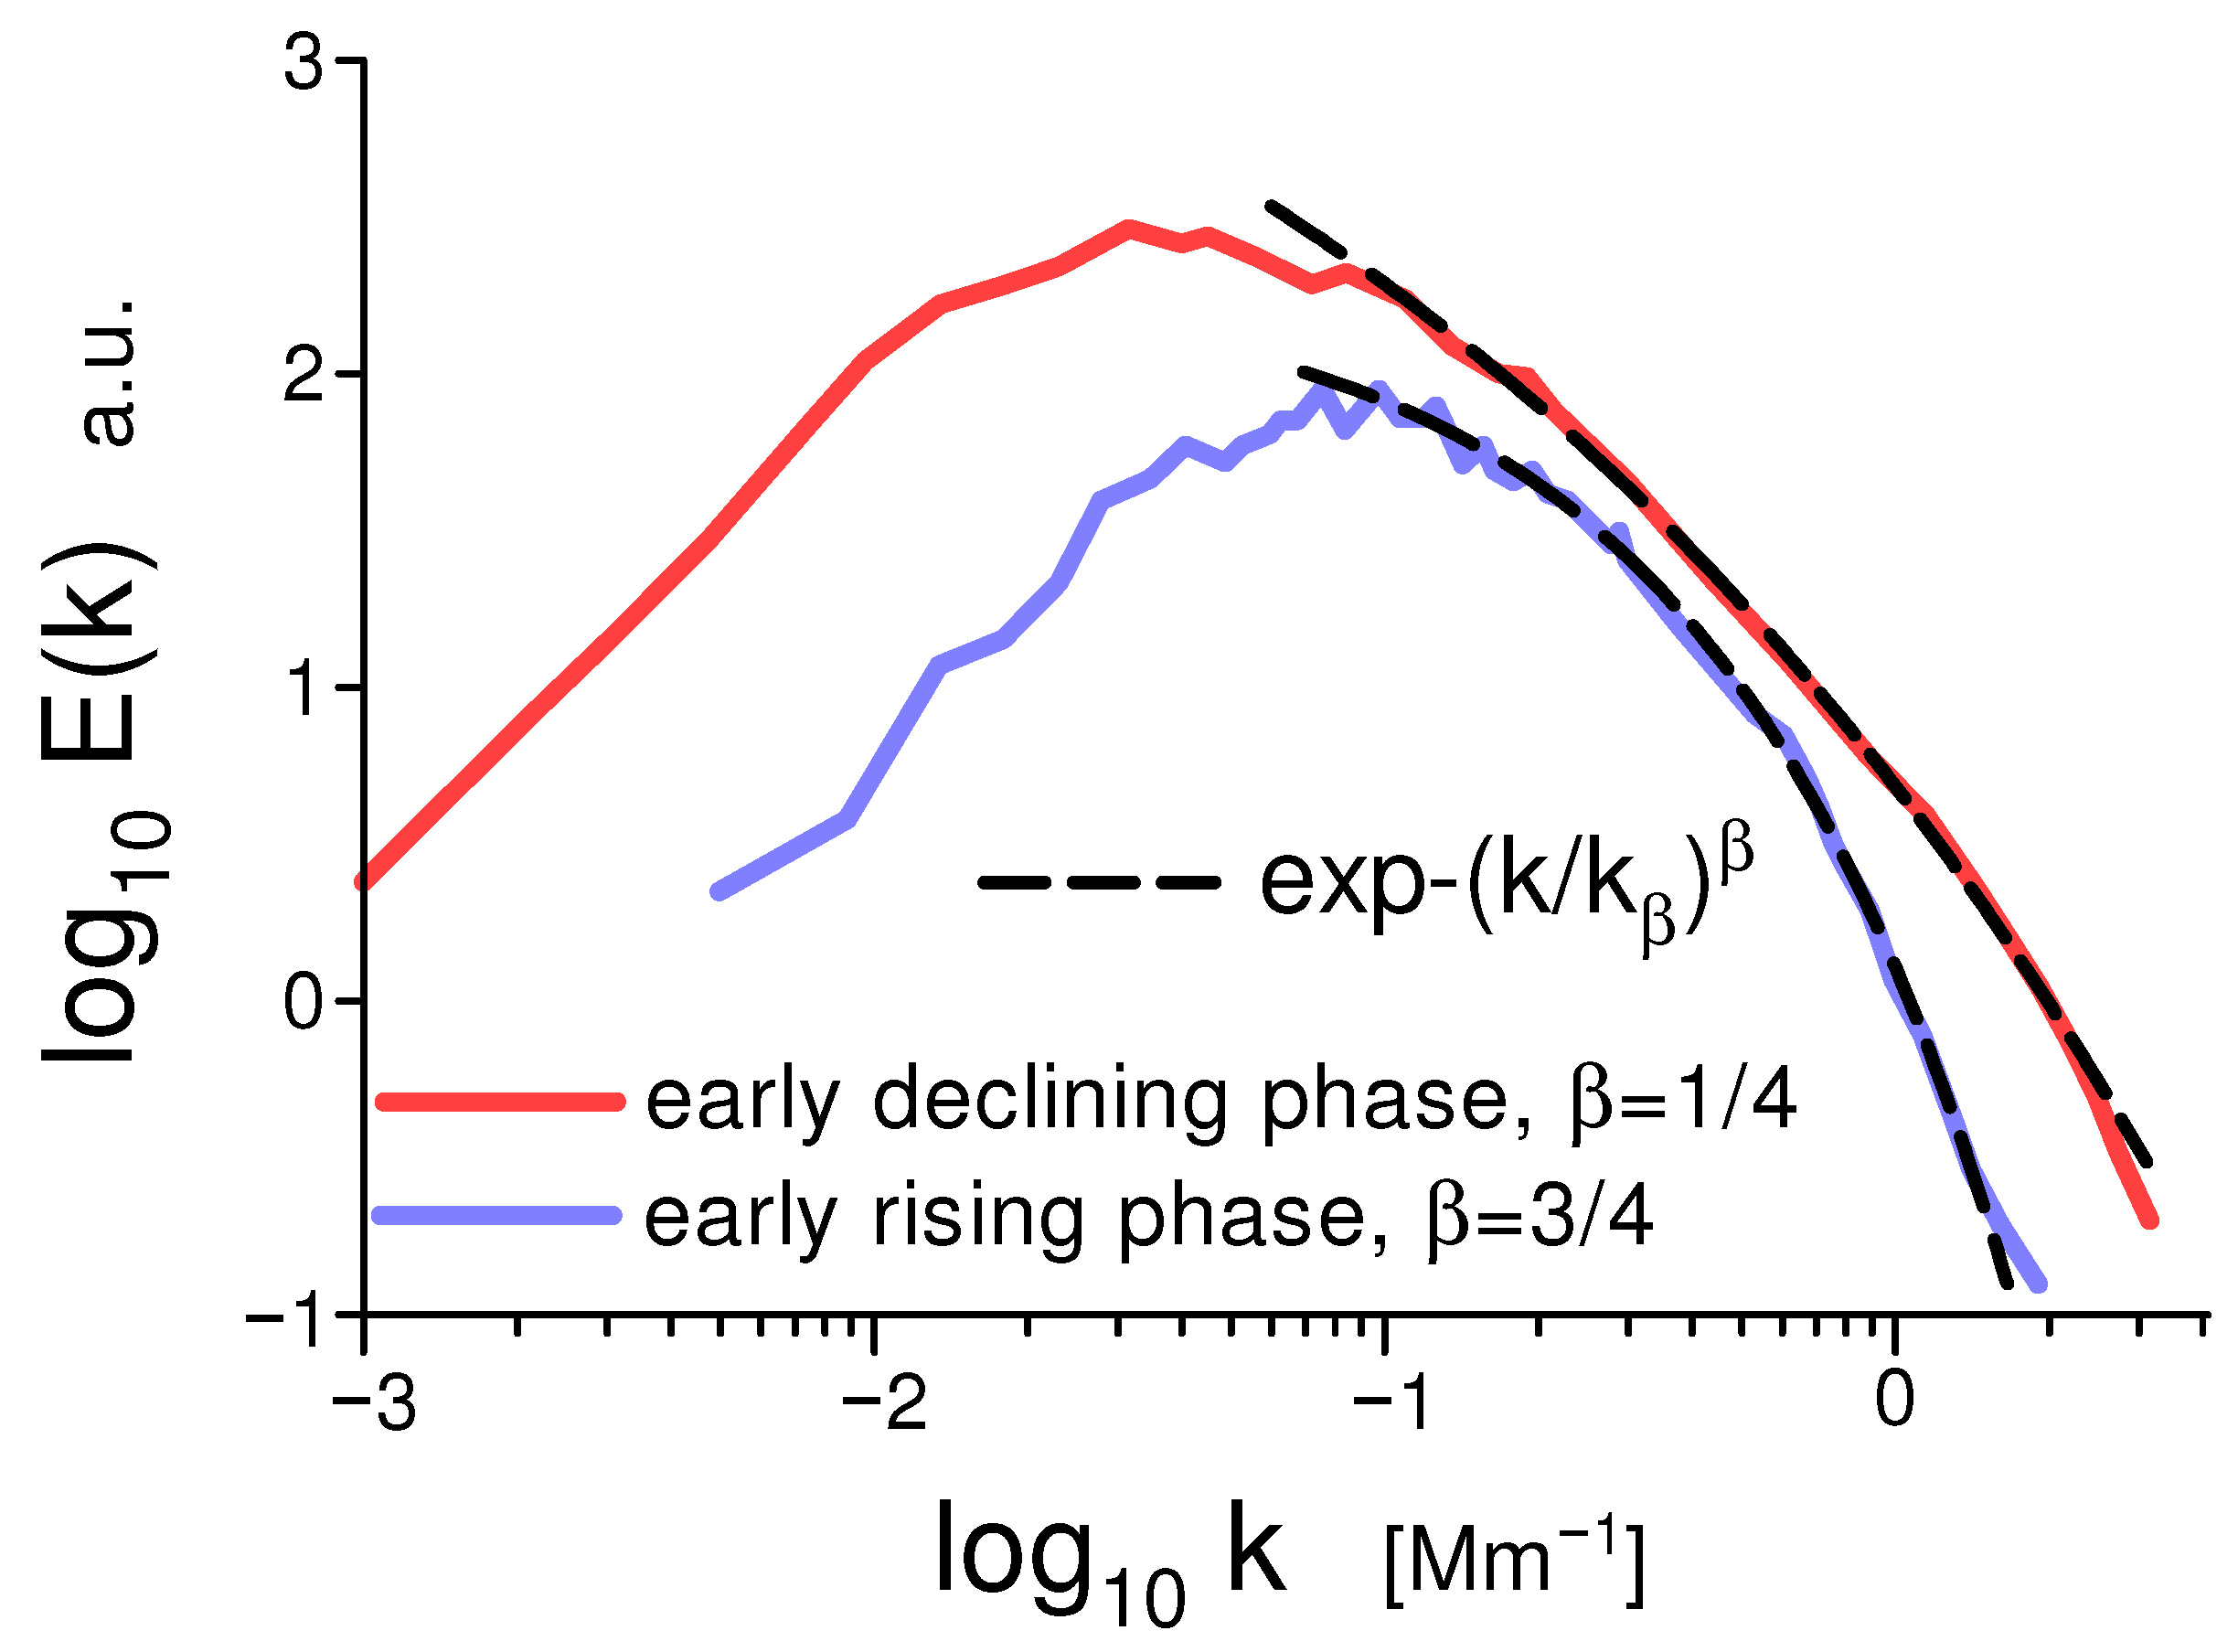
Figure 9 shows the magnetic energy spectra for synoptic maps of the early rising and early declining phases of solar cycle 24. During the early declining phase, both magnetic energy and magnetic helicity reached their maxima, whereas during the early rising phase, the magnetic energy attained its minimum. The spectral data were taken from Figures 4.2b and 4.3b of Ref. [50]. The data used to compute the spectrum for the early declining phase were obtained by the Helioseismic and Magnetic Imager onboard the Solar Dynamics Observatory, whereas the data used to compute the spectrum for the early rising phase were obtained by a Vector Spectromagnetograph from ground-based Synoptic Optical Long-term Investigations using the Sun telescope.
The dashed curves indicate the best fit of the spectra with Equation (31) ( β = 3 / 4 , dissipative distributed chaos dominated by the magnetic Birkhoff–Saffman invariant) for the early rising phase and Equation (21) ( β = 1 / 4 , the magnetoinertial range of scales) for the early declining phase when both magnetic energy and magnetic helicity reach their maxima.
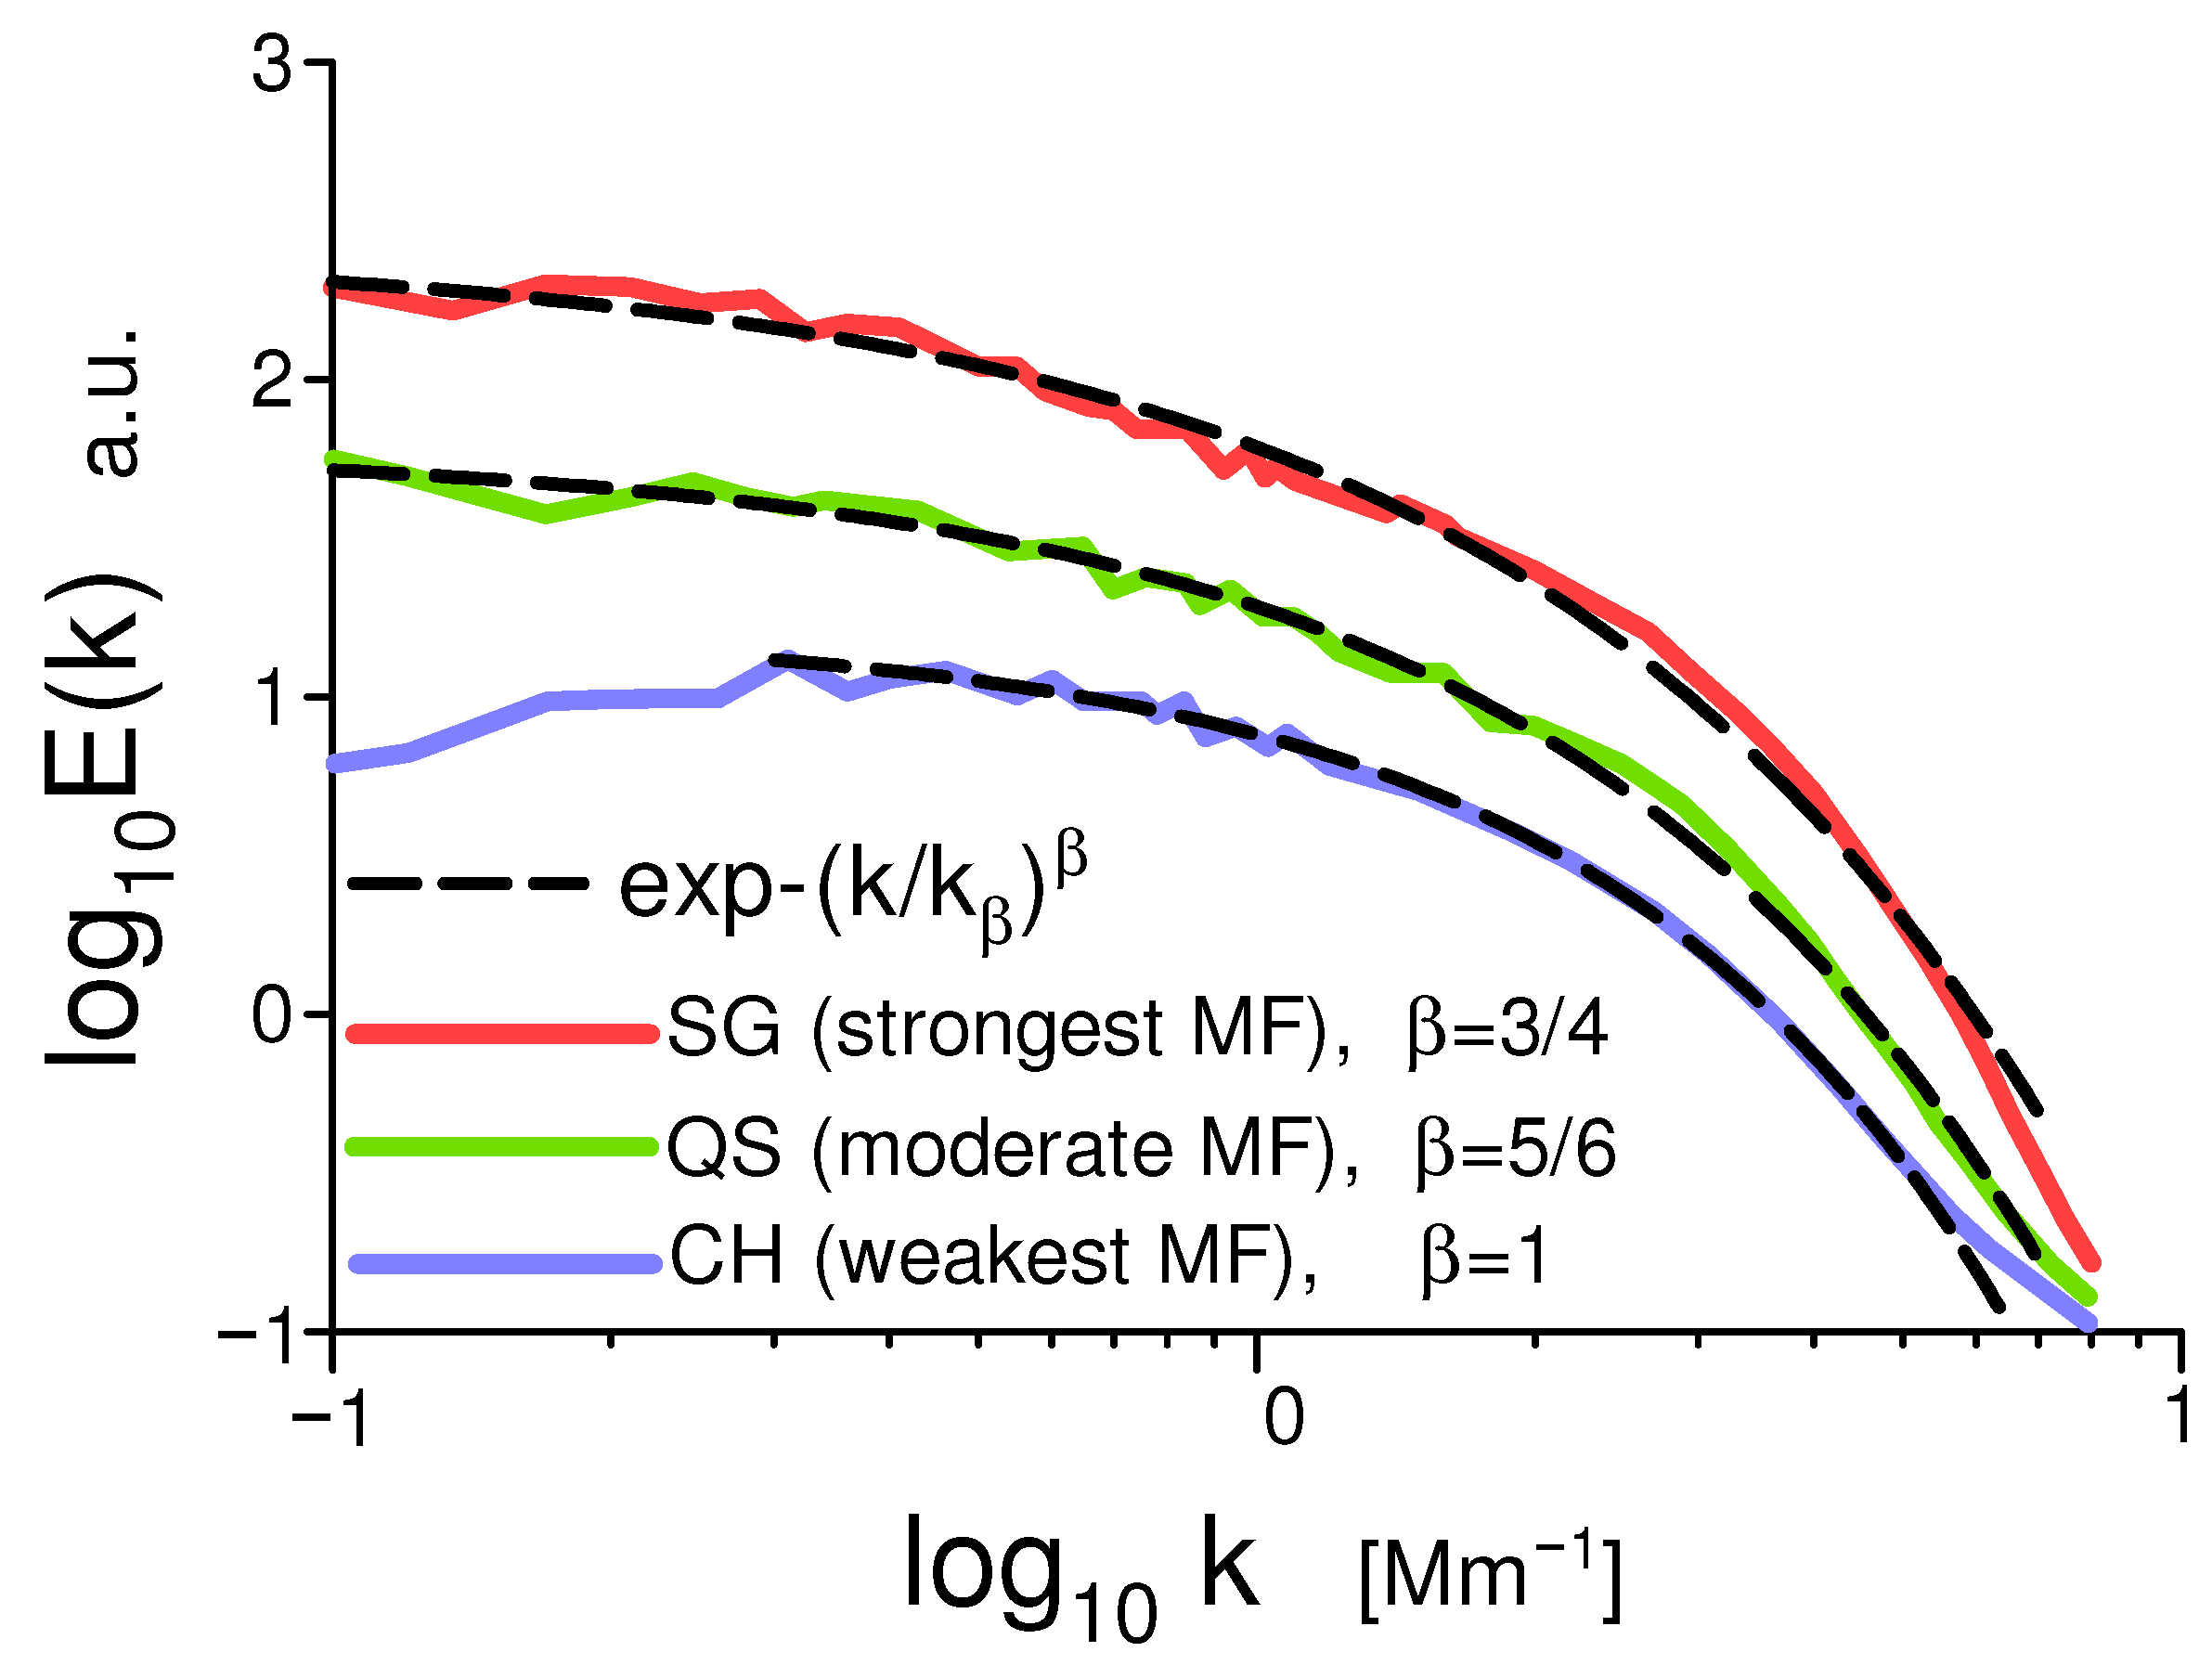
Figure 10 shows magnetic energy spectra in an undisturbed (outside active regions) photospheric area, computed using the results of measurements produced by the Helioseismic and Magnetic Imager onboard the Solar Dynamic Observatory on 19 June 2017, in the center of the solar disk. The spectral data were taken from Figure 4 in Ref. [51]. The solar area consists of three subregions: a coronal hole (CH), a quiet Sun region (QS), and a supergranular network (SG). Overall, it was an area of weak magnetic fields, but the CH, QS, and SG subregions exhibited comparatively different intensities of their magnetic fields: CH—weakest, QS—moderate, and SG—strongest. The supergranular network (SG subregion) was an area of decayed active regions in NOAA 12242–12259 several rotations ago.
The dashed curves indicate the best fit of the spectra with the exponent Equation (2) ( β = 1 , deterministic chaos in the CH weak magnetic field), with the Equation (33) ( β = 5 / 6 , dissipative distributed chaos dominated by the magnetic Loitsianskii invariant in the QS moderate magnetic field), and with the Equation (31) ( β = 3 / 4 , dissipative distributed chaos dominated by the magnetic Birkhoff–Saffman invariant in the SG strongest magnetic field).
The value of the parameter β decreases, and, consequently, the randomness of the magnetic field increases for the subregions with the increase in intensity of the magnetic field.
Figure 2 shows the evolution of the magnetic energy spectra for a large emerging solar active region, NOAA 11726. The spectral data were taken from Figure 2a in Ref. [17]. The measurements were provided by the Helioseismic and Magnetic Imager located onboard the Solar Dynamics Observatory. These spectra are well-fitted by a sequence of spectral laws (the dashed curves), starting from the deterministic chaos in Equation (2) ( β = 1 ), then the dissipative distributed chaos in Equation (31) ( β = 3 / 4 ), then the helical distributed chaos in Equation (9) ( β = 1 / 2 ), and finally the magneto-inertial range of scales in Equation (21) ( β = 1 / 4 , a precursor of hard turbulence.
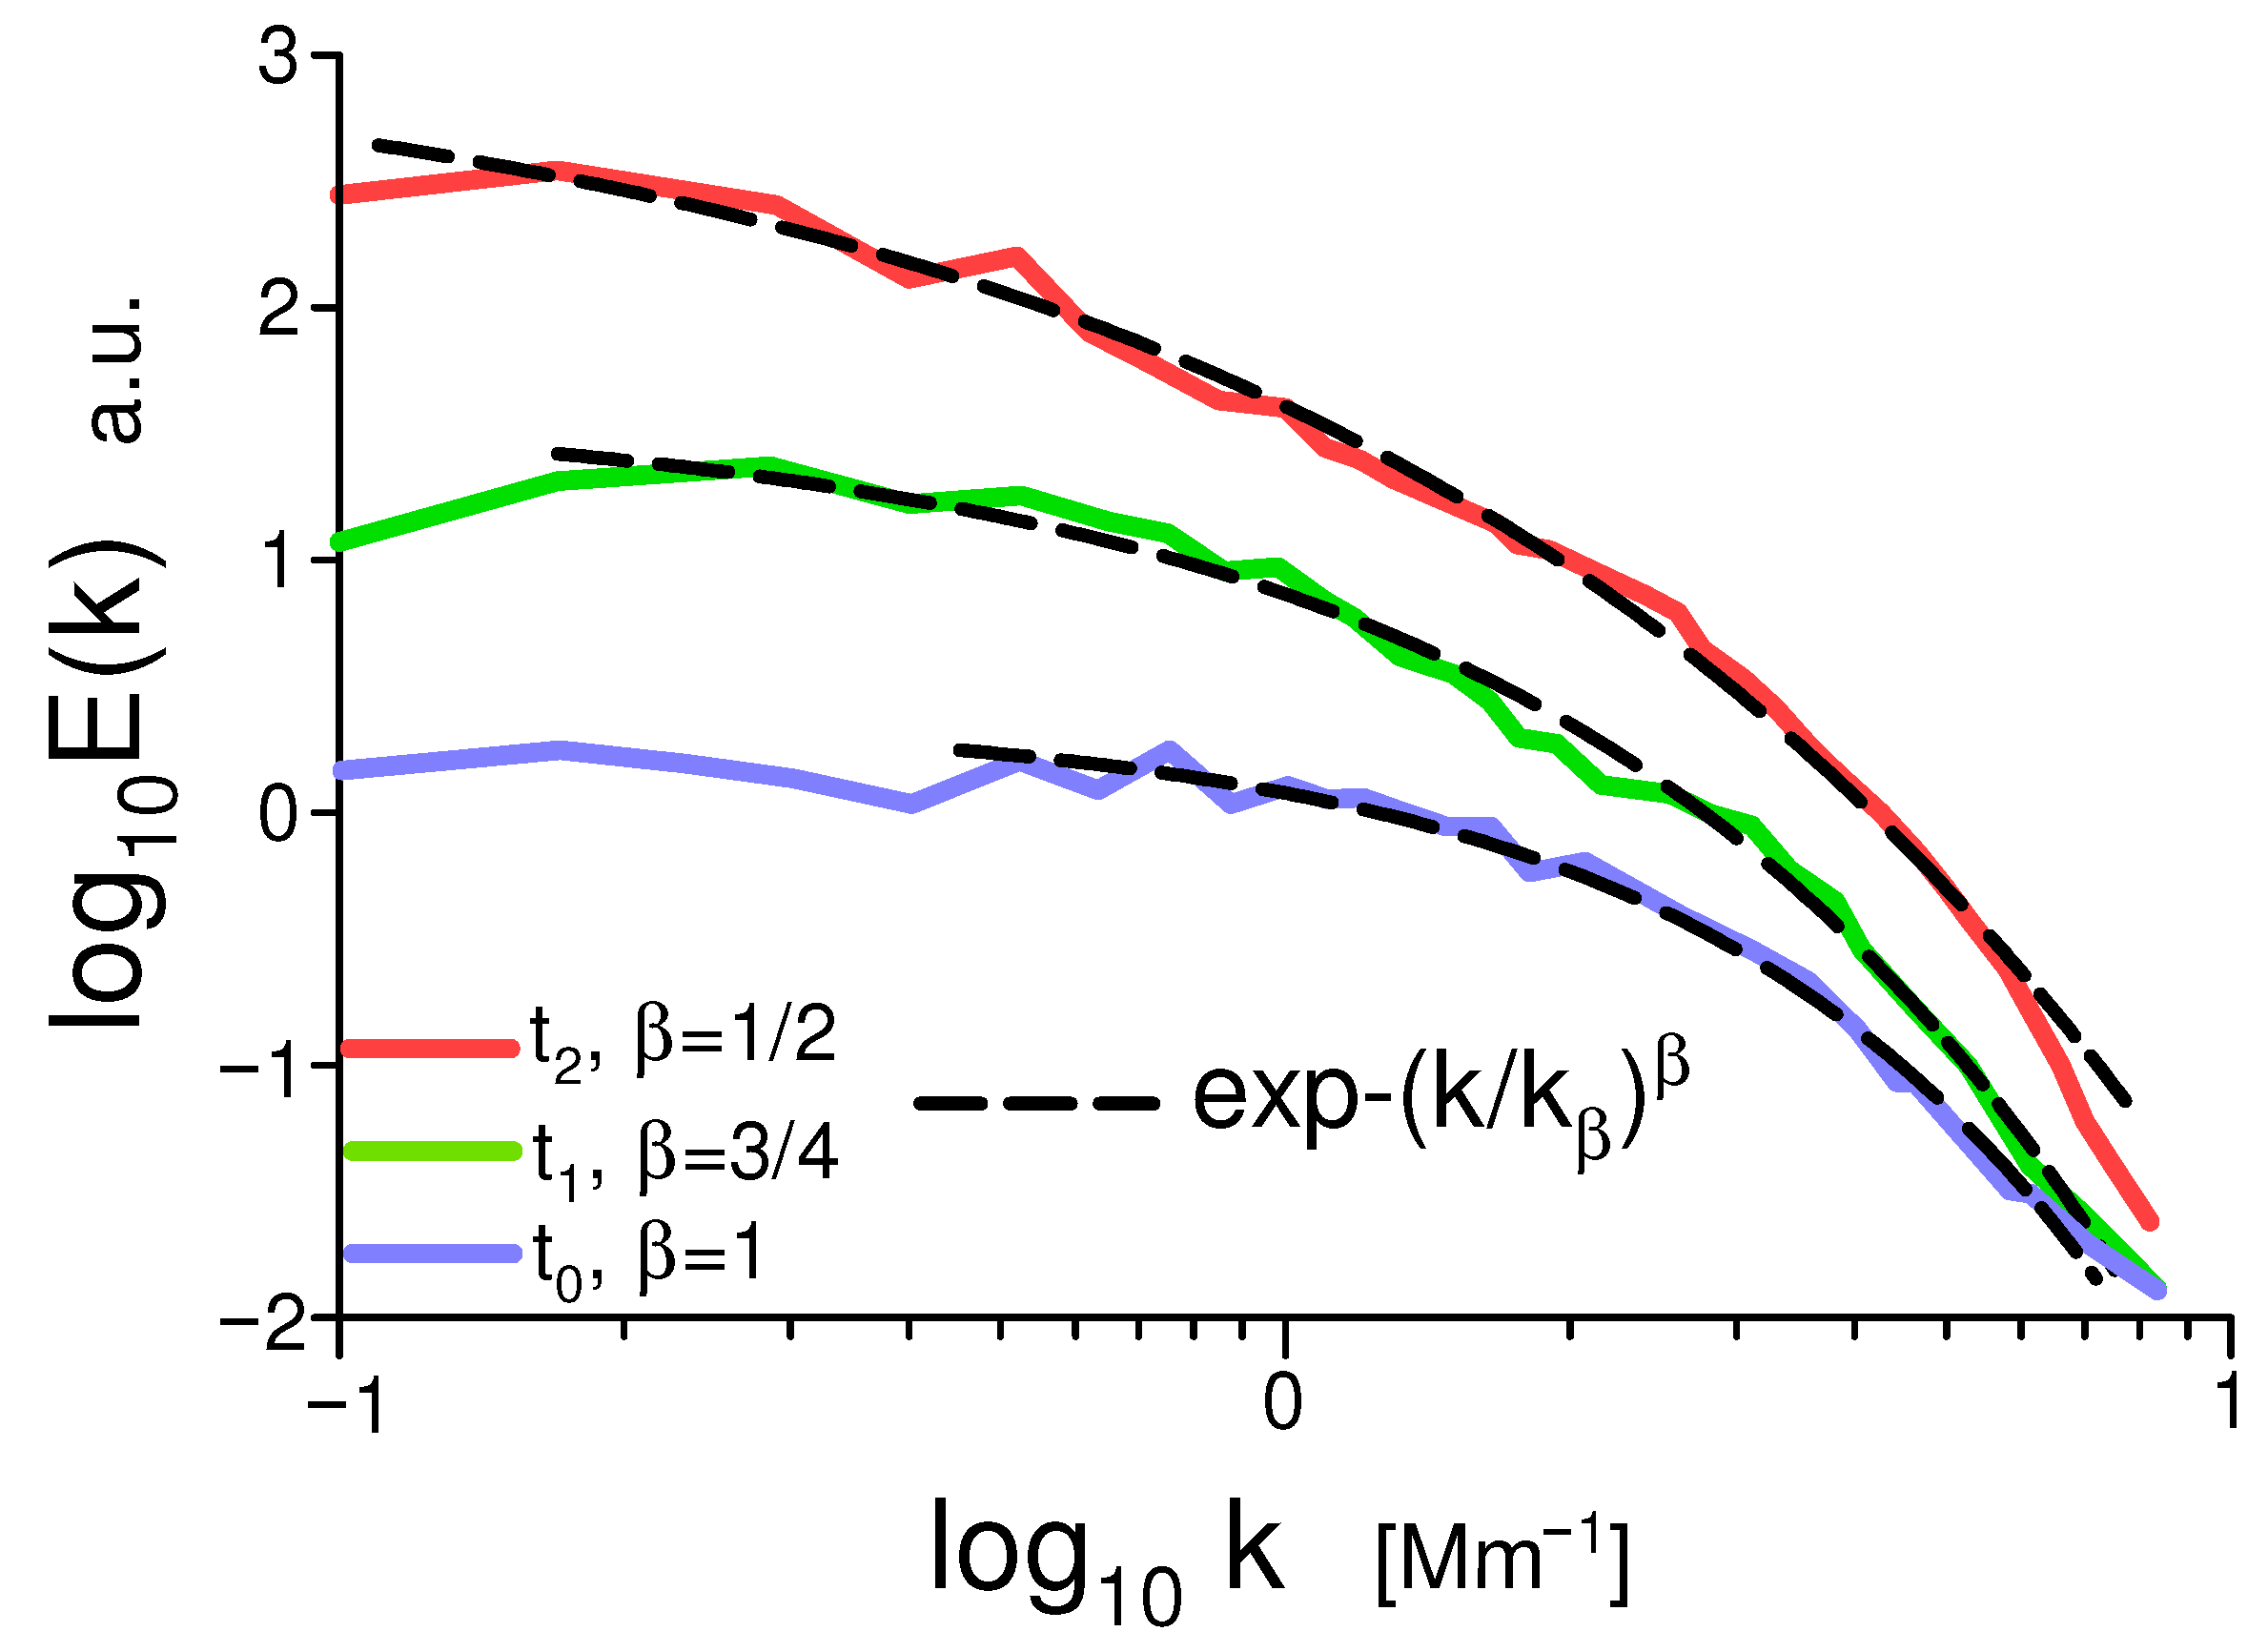
Figure 11 shows the evolution of the magnetic energy spectra for a smaller, emerging, active solar region, NOAA 11781. The spectral data were taken from Figure 2b of the same paper, Ref. [17]. The measurements were also provided by the Helioseismic and Magnetic Imager located onboard the Solar Dynamics Observatory. These spectra are well-fitted by a sequence of analogous spectral laws (the dashed curves), and only the most energetic magnetoinertial range of scales in Equation (21) ( β = 1 / 4 ) is absent here (cf. Figure 2).

6.3. The Role of the Mean Magnetic Field

To take into account the mean magnetic field (if it is present) in the case of a magnetoinertial range of scales, one should replace the energy dissipation rate ε in Equation (16) by ( ε B ˜ 0 ) (where B ˜ 0 = B 0 / μ 0 ρ is the normalized mean magnetic field - in the Alfvénic units, with the same dimension as velocity) [52] and the ε h by the modified magnetic helicity (Equation (4)) dissipation rate, ε h ^ .
The dimensional considerations result in [26,53,54]
B c ε h ^ 1 / 2   ( ε B ˜ 0 ) 1 / 8 k c 1 / 8
i.e., the parameter α = 1 / 8 . Then, from Equation (20), we obtain β = 1 / 5 .
E ( k ) exp ( k / k β ) 1 / 5
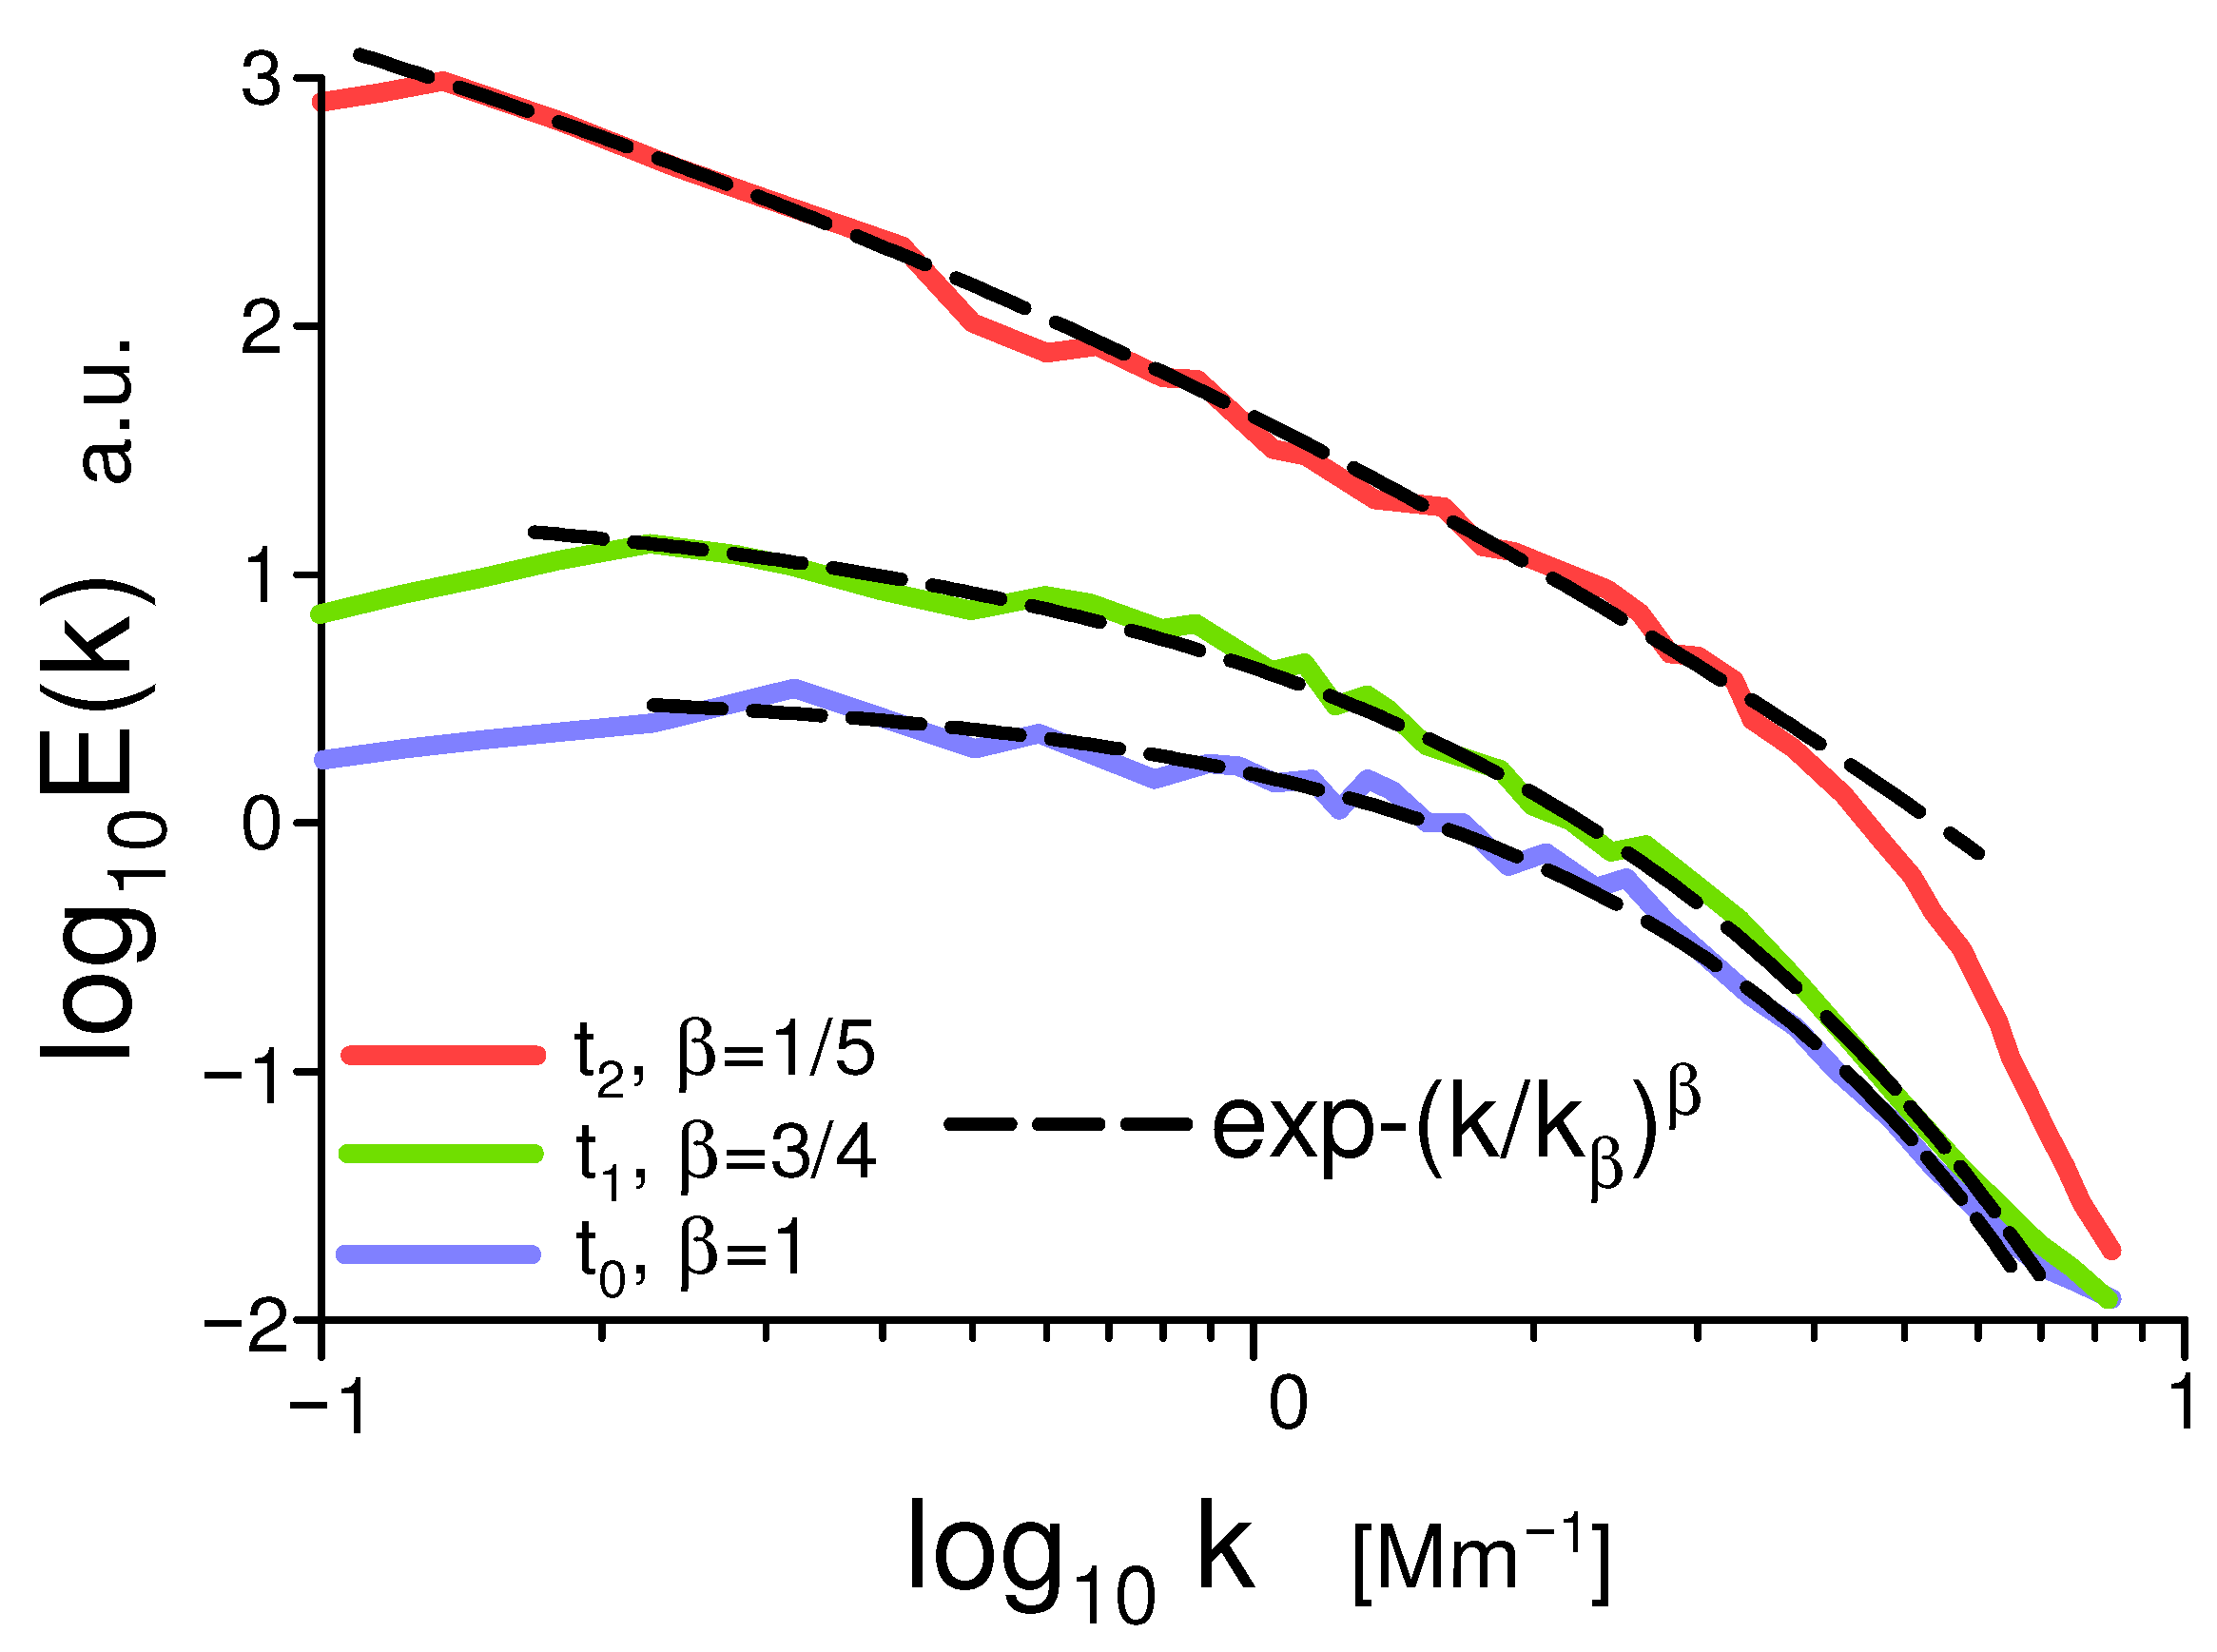
Figure 12 shows the evolution of the magnetic energy spectra for an emerging active solar region, NOAA 12219. The spectral data were taken from Figure 1 in Ref. [55]. The solar magnetogram images used for calculation of the spectra were obtained by the Helioseismic and Magnetic Imager onboard the Solar Dynamics Observatory spacecraft. The time t 0 corresponds to the onset of the active region emergence, t 1 corresponds to the time when only the first imprints of the emerging active region can be seen in the magnetogram, and the time t 2 corresponds to the peak of the magnetic flux.
These spectra are fitted by a sequence of spectral laws (the dashed curves): starting from the deterministic chaos in Equation (2) ( β = 1 ), then the dissipative distributed chaos in Equation (31) ( β = 3 / 4 ), and finally the magnetoinertial range of scales in Equation (38) ( β = 1 / 5 ), which corresponds to the magnetoinertial range under the strong influence of the mean magnetic field.
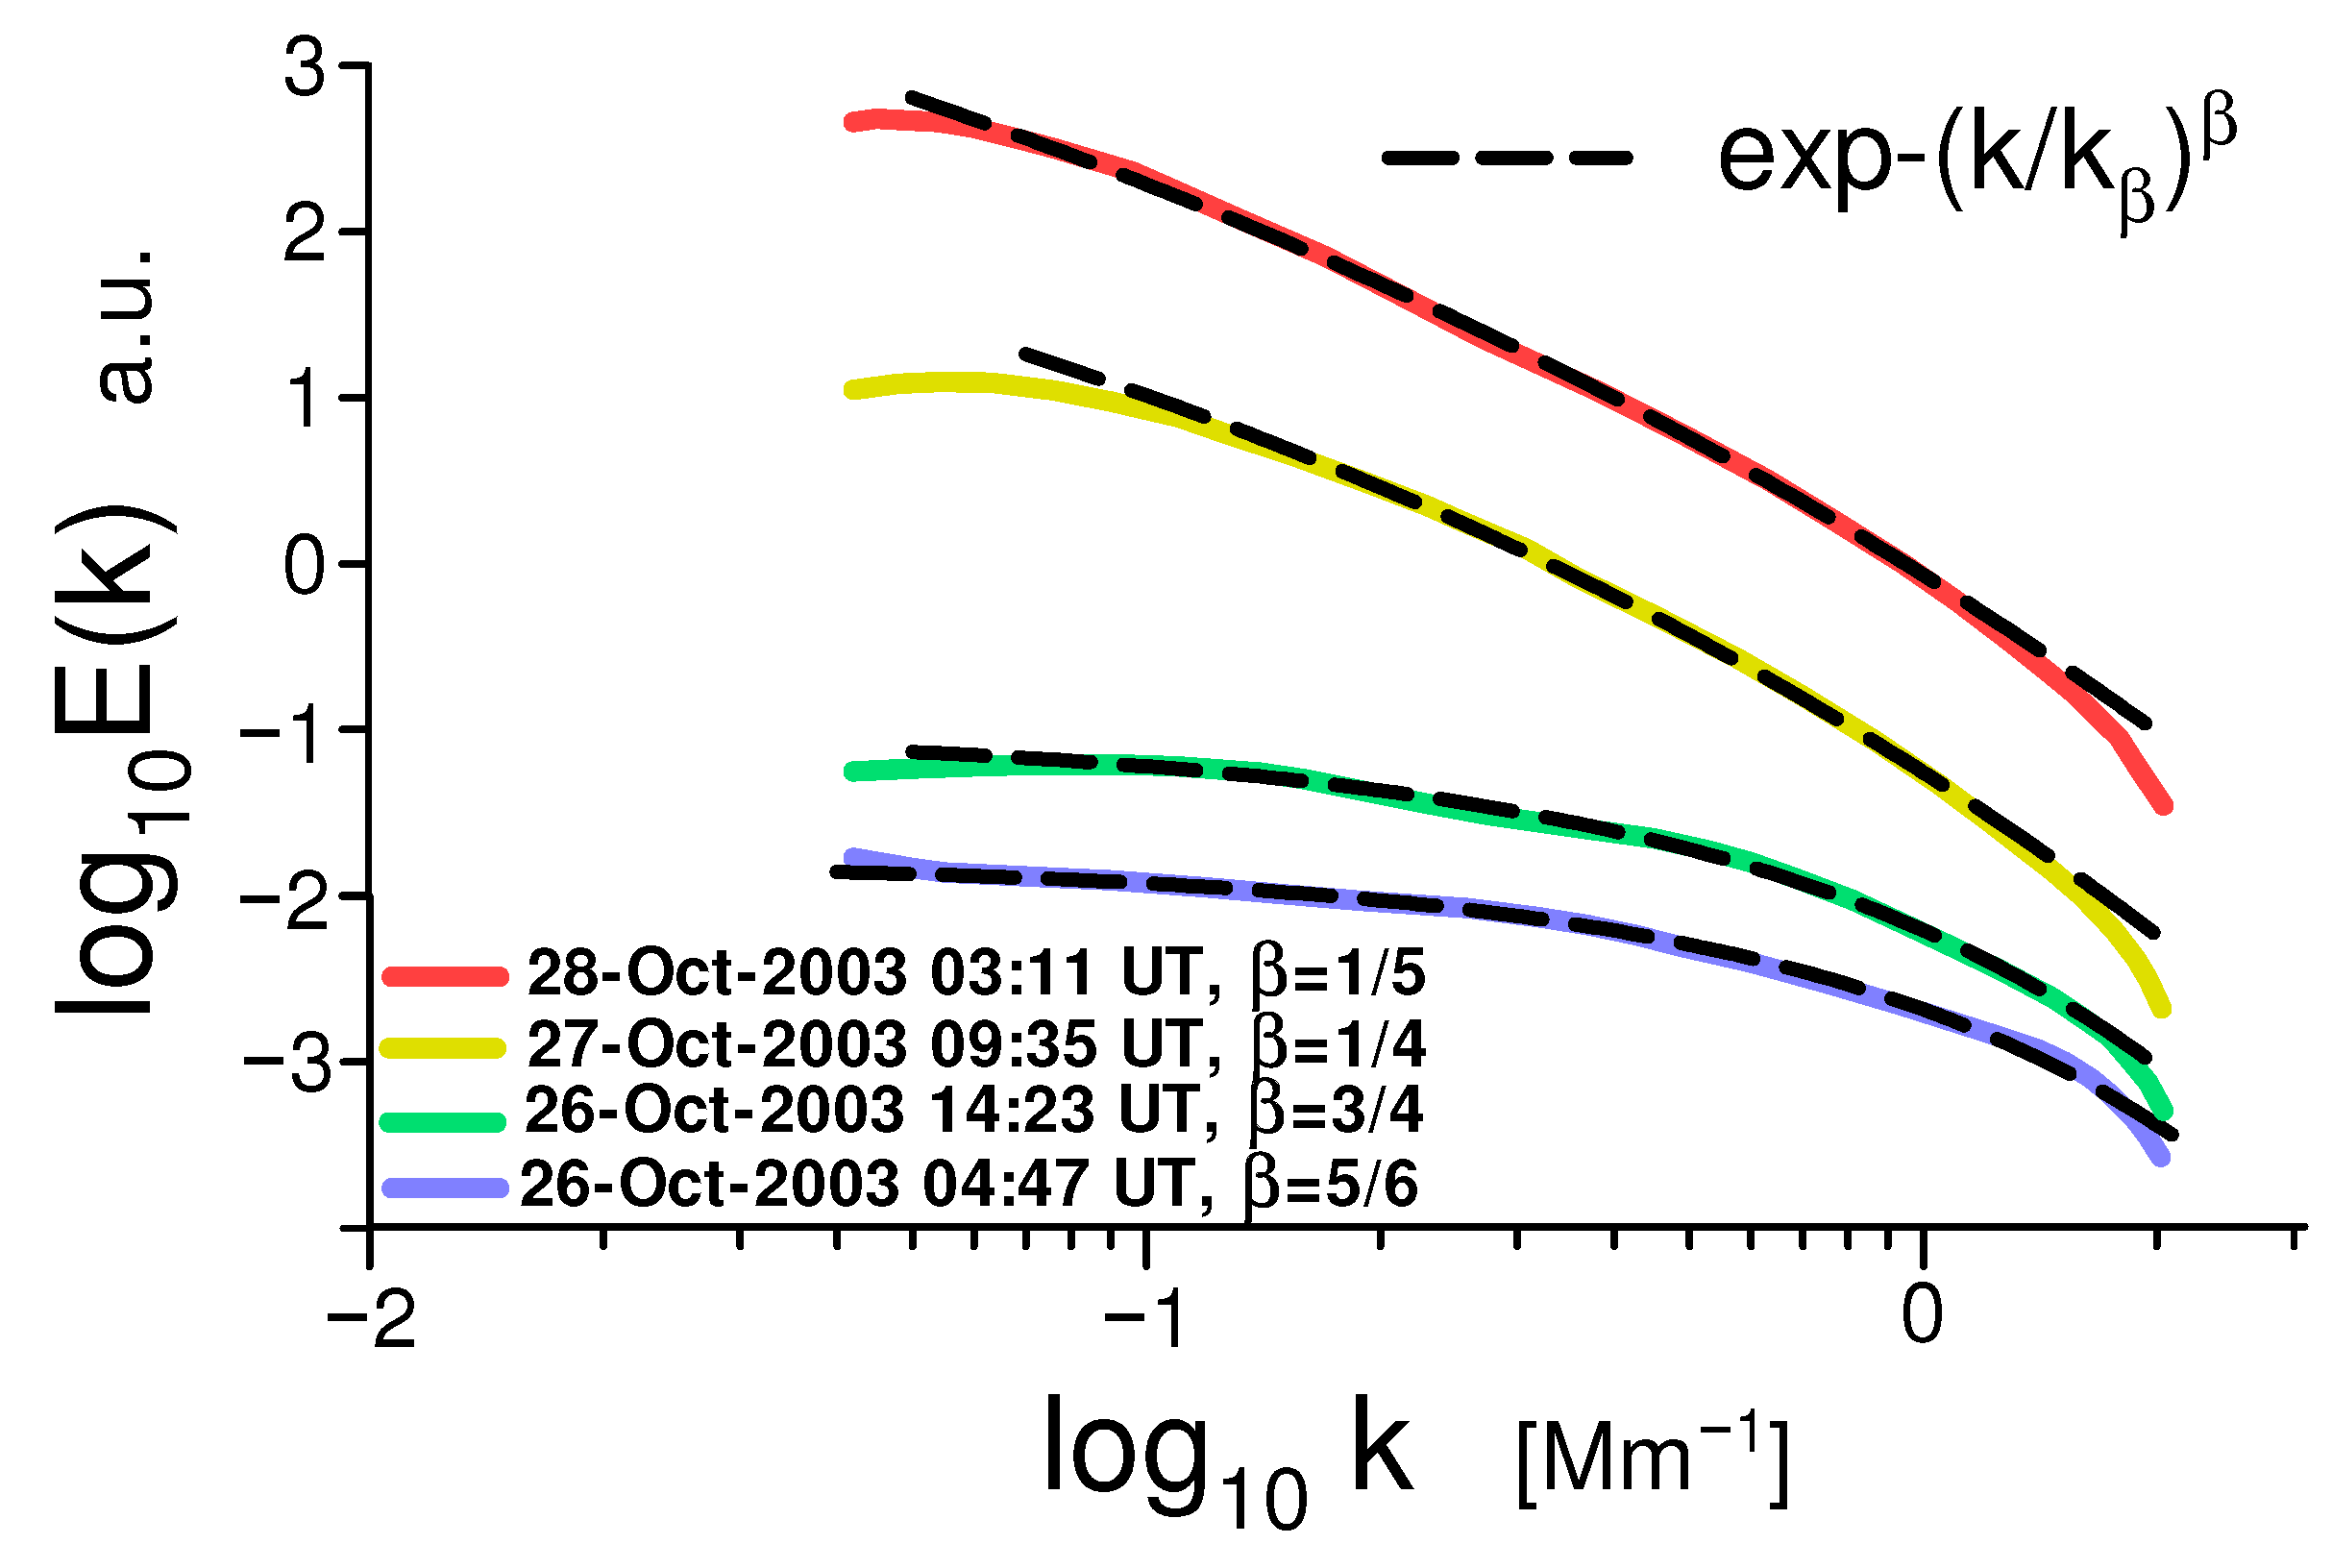
Figure 13 shows the evolution of the magnetic energy spectra for a rapidly emerging active region, NOAA 10488. The spectral data were taken from Figure 8 in Ref. [56]. The solar magnetogram images used for the calculation of the spectra were obtained by the Michelson Doppler Imager onboard the Solar and Heliospheric Observatory. An M-class flare and two C-class flares occurred in the active region, and also an active region, NOAA 10493, appeared near the AR NOAA 10488 during the period of 27–28 October 2003.
The dashed curves in Figure 13 indicate the best fit of the spectra in Equation (33) ( β = 5 / 6 ) and Equation (31) ( β = 3 / 4 ), which correspond to the dissipative distributed chaos dominated by the magnetic Loitsianskii and Birkhoff–Saffman invariants at the earlier stages of the emergence of AR NOAA 10488, and in Equation (21) ( β = 1 / 4 ) and Equation (38) ( β = 1 / 5 ), which correspond to the magnetoinertial range of scales at the mature stage of the emergence of AR NOAA 10488 (cf. Figure 2).

7. Conclusions

While chaotic/turbulent magnetohydrodynamic dynamos are a thriving subject of research in fluid dynamics (see Refs. [57,58,59] for recent reviews and references therein), the theory of the process of randomization generated by small-scale dynamo magnetic fields is still an emerging area [10]. The randomization process can be understood in more detail and quantified using the notion of distributed chaos.
The above examples demonstrate that different magnetohydrodynamic invariants govern this process at various stages of the emerging dynamo’s evolution. While at earlier stages of randomization, the dissipative invariants are dominant, for more advanced stages, the magnetic helicity plays a dominant role, either directly or through Kolmogorov–Iroshnikov types of phenomenology. A small-scale dynamo can coexist with a large-scale one.
Under this approach, the results of the numerical simulations are in quantitative agreement with solar observations (both for quiet and active solar regions) despite considerable differences in scales and physical parameters.

Funding

This research received no external funding.

Data Availability Statement

The data presented in this study are available in the article.

Conflicts of Interest

The author declares no conflicts of interest.

References

  1. Graham, J.P.; Cameron, R.H.; Schüssler, M. Turbulent small-scale dynamo action in solar surface simulations. Astrophys. J. 2010, 714, 1606. [Google Scholar] [CrossRef]
  2. Cameron, R.H.; Schüssler, M. Understanding solar cycle variability. Astrophys. J. 2017, 843, 111. [Google Scholar] [CrossRef]
  3. Rempel, M.; Bhatia, T.; Bellot, R.; Rubio, L.B.; Korpi-Lagg, M.J. Small-scale dynamos: From idealized models to solar and stellar applications. Space Sci. Rev. 2023, 219, 36. [Google Scholar] [CrossRef]
  4. Bershadskii, A. Subharmonic and chaotic resonances in solar activity. Europhys. Lett. 2010, 92, 50012. [Google Scholar] [CrossRef]
  5. Tanayveer, S.; Bhatia, T.S.; Cameron, R.H.; Solanki, S.K.; Hardi Peter, H.; Przybylski, D.; Witzk, V.; Shapiro, A. Small-scale dynamo in cool stars I. Changes in stratification and near-surface convection for main-sequence spectral types. Astron. Astrophys. 2022, 663, A166. [Google Scholar]
  6. Warnecke, J.; Korpi-Lagg, M.J.; Gent, F.A.; Rheinhardt, M. Numerical evidence for a small-scale dynamo approaching solar magnetic Prandtl numbers. Nat. Astron. 2023, 7, 662. [Google Scholar] [CrossRef]
  7. Vasil, G.M.; Lecoanet, D.; Augustson, K.; Burns, K.; Oishi, J.S.; Brown, B.P.; Brummell, N.; Julien, K. The solar dynamo begins near the surface. Nature 2024, 629, 769–772. [Google Scholar] [CrossRef] [PubMed]
  8. Gaire, B. Solar dynamo located near the surface. Nat. Astron. 2024, 8, 684. [Google Scholar] [CrossRef]
  9. Cameron, R.H.; Schüssler, M. Observationally guided models for the solar dynamo and the role of the surface field. Space Sci. Rev. 2023, 219, 60. [Google Scholar] [CrossRef]
  10. Shukurov, A.; Subramanian, K. The Fluctuation Dynamo. In Astrophysical Magnetic Fields: From Galaxies to the Early Universe; Cambridge University Press: Cambridge, UK, 2021; pp. 171–206. [Google Scholar]
  11. Maggs, J.E.; Morales, G.J. Generality of deterministic chaos, exponential spectra, and Lorentzian pulses in magnetically confined plasmas. Phys. Rev. Lett. 2011, 107, 185003. [Google Scholar] [CrossRef]
  12. Maggs, J.E.; Morales, G.J. Origin of Lorentzian pulses in deterministic chaos. Phys. Rev. E 2012, 86, 015401(R). [Google Scholar] [CrossRef]
  13. Maggs, J.E.; Morales, G.J. Exponential power spectra, deterministic chaos and Lorentzian pulses in plasma edge dynamics. Plasma Phys. Control. Fusion 2012, 54, 124041. [Google Scholar] [CrossRef]
  14. Khurshid, S.; Donzis, D.A.; Sreenivasan, K.R. Energy spectrum in the dissipation range. Phys. Rev. Fluids 2018, 3, 082601(R). [Google Scholar] [CrossRef]
  15. Wu, X.-Z.; Kadanoff, L.P.; Libchaber, A.; Sano, M. Frequency power spectrum of temperature fluctuations in free convection. Phys. Rev. Lett. 1990, 64, 2140–2143. [Google Scholar] [CrossRef]
  16. Schekochihin, A.A. MHD turbulence: A biased review. J. Plasma Phys. 2022, 88, 155880501. [Google Scholar] [CrossRef]
  17. Kutsenko, O.K.; Kutsenko, A.S.; Abramenko, V.I. Magnetic Power Spectra of Emerging Active Regions. Solar Phys. 2019, 294, 102. [Google Scholar] [CrossRef]
  18. Janßen, K.; Vögler, A.; Kneer, F. On the fractal dimension of small-scale magnetic structures in the Sun. Astron. Astrophys. 2003, 409, 1127–1134. [Google Scholar] [CrossRef]
  19. Zhou, S.; Feng, Y.; Wu, W.Y.; Li, Y.; Liu, J. Low-dimensional chaos and fractal properties of long-term sunspot activity. Res. Astron. Astrophys. 2014, 14, 104. [Google Scholar] [CrossRef]
  20. Abramenko, V.I. Fractal multi-scale nature of solar/stellar magnetic field. In Solar and Astrophysical Dynamos and Magnetic Activity Proceedings IAU Symposium; Kosovichev, A.G., de Gouviea Dal Pino, E.M., Yan, Y., Eds.; Cambridge University Press: Cambridge, UK, 2012; Volume 294. [Google Scholar]
  21. Rajkumar, B.; Haque, S. A fractal analysis of magnetograms within active regions. Sol. Phys. 2020, 295, 10. [Google Scholar] [CrossRef]
  22. Deng, L.H.; Li, B.; Xiang, Y.Y.; Dun, G.T. Comparison of chaotic and fractal properties of polar faculae with sunspot activity. Astr. J. 2016, 151, 2. [Google Scholar] [CrossRef]
  23. Moffatt, H.K.; Tsinober, A. Helicity in laminar and turbulent flow. Annu. Rev. Fluid Mech. 1994, 24, 281–312. [Google Scholar] [CrossRef]
  24. Matthaeus, W.H.; Goldstein, M.L. Measurement of the rugged invariants of magnetohydrodynamic turbulence in the solar wind. J. Geophys. Res. 1982, 87, 6011–6028. [Google Scholar] [CrossRef]
  25. Shebalin, J.V. Global invariants in ideal magnetohydrodynamic turbulence. Phys. Plasmas 2013, 20, 102305. [Google Scholar] [CrossRef]
  26. Bershadskii, A. Magneto-inertial range dominated by magnetic helicity in space plasmas. Fundam. Plasma Phys. 2024, 11, 100066. [Google Scholar] [CrossRef]
  27. Monin, A.S.; Yaglom, A.M. Statistical Fluid Mechanics, Vol. II: Mechanics of Turbulence; Dover Publications: New York, NY, USA, 2013. [Google Scholar]
  28. Johnson, N.L.; Kotz, S.; Balakrishnan, N. Continuous Univariate Distributions; Wiley: New York, NY, USA, 1994; Volume 1. [Google Scholar]
  29. Kerr, R.M. Elementary Vortices and Coherent Structures. In Proceedings of the IUTAM Symposium, Kyoto, Japan, 26–28 October 2004; pp. 1–8. [Google Scholar]
  30. Holm, D.D.; Kerr, R.M. Helicity in the formation of turbulence. Phys. Fluids 2007, 19, 025101. [Google Scholar] [CrossRef]
  31. Moffatt, H.K. The degree of knottedness of tangled vortex lines. J. Fluid Mech. 1969, 35, 117–129. [Google Scholar] [CrossRef]
  32. Moffatt, H.K. Magnetostatic equilibria and analogous Euler flows of arbitrarily complex topology. Part 1. Fundamentals. J. Fluid Mech. 1985, 159, 359–378. [Google Scholar] [CrossRef]
  33. Levich, E.; Tsinober, A. On the role of helical structures in three-dimensional turbulent flow. Phys. Lett. A 1983, 93, 293–297. [Google Scholar] [CrossRef]
  34. Schekochihin, A.A.; Cowley, S.C.; Dorland, W.; Hammett, G.W.; Howes, G.G.; Quataert, E.; Tatsuno, T. Astrophysical gyrokinetics: Kinetic and fluid turbulent cascades in magnetized weakly collisional plasmas. Astrophys. J. Suppl. Ser. 2009, 182, 310–377. [Google Scholar] [CrossRef]
  35. Rincon, F. Helical turbulent nonlinear dynamo at large magnetic Reynolds numbers. Phys. Rev. Fluids 2021, 6, L121701. [Google Scholar] [CrossRef]
  36. Bershadskii, A.; Sreenivasan, K.R. Intermittency and the passive nature of the magnitude of the magnetic field. Phys. Rev. Lett. 2004, 93, 064501. [Google Scholar] [CrossRef]
  37. Johnston, D.C. Stretched exponential relaxation arising from a continuous sum of exponential decays. Phys. Rev. B 2006, 74, 184430. [Google Scholar] [CrossRef]
  38. Birkhoff, G. Fourier synthesis of homogeneous turbulence. Commun. Pure Appl. Math. 1954, 7, 19–44. [Google Scholar] [CrossRef]
  39. Saffman, P.G. The large-scale structure of homogeneous turbulence. J. Fluid. Mech. 1967, 27, 581–593. [Google Scholar] [CrossRef]
  40. Chandrasekhar, S. The invariant theory of isotropic turbulence in magneto-hydrodynamics. Proc. R. Soc. Lond. Ser. A 1951, 204, 435–449. [Google Scholar]
  41. Politano, H.; Pouquet, A. von Kármán–Howarth equation for magnetohydrodynamics and its consequences on third-order longitudinal structure and correlation functions. Phys. Rev. E 1998, 57, R21. [Google Scholar] [CrossRef]
  42. Wan, M.; Oughton, S.; Servidio, S.; Matthaeus, W.H. von Karmán self-preservation hypothesis for magnetohydrodynamic turbulence and its consequences for universality. J. Fluid Mech. 2012, 697, 296. [Google Scholar] [CrossRef]
  43. Sur, S.; Bhat, P.; Subramanian, K. Faraday rotation signatures of fluctuation dynamos in young galaxies. Mon. Not. R. Astron. Soc. Lett. 2018, 475, L72. [Google Scholar] [CrossRef]
  44. Banerjee, S.; Galtier, S. Chiral exact relations for helicities in Hall magnetohydrodynamic turbulence. Phys. Rev. E 2016, 93, 033120. [Google Scholar] [CrossRef]
  45. Polygiannakis, J.M. Moussas, X. A review of magneto-vorticity induction in Hall-MHD plasma. Plasma Phys. Control. Fusion 2001, 43, 195–221. [Google Scholar] [CrossRef]
  46. Galtier, S. von Kármán-Howarth equations for Hall magnetohydrodynamic flows. Phys. Rev. E 2008, 77, 015302(R). [Google Scholar]
  47. Mininni, P.D.; Alexakis, A.; Pouquet, A. Energy transfer in Hall-MHD turbulence: Cascades, backscatter, and dynamo action. J. Plasma Phys. 2007, 73, 377. [Google Scholar] [CrossRef]
  48. Kosovichev, A.G.; Mansour, N.N.; Wray, A.A. Mechanism of local dynamo action on the Sun. arXiv 2013, arXiv:1312.0982. [Google Scholar]
  49. Riva, F.; Steiner, O. Methodology for estimating the magnetic Prandtl number and application to solar surface small-scale dynamo simulations. Astron. Astrophys. 2022, 660, A115. [Google Scholar] [CrossRef]
  50. Prabhu, A. Towards Constraining the Solar Dynamo with Observational Studies of the Sun’s Magnetic Field. Ph.D. Thesis, University of Goettingen, Goettingen, Germany, 2021. Available online: https://ediss.uni-goettingen.de/handle/11858/14010 (accessed on 16 September 2025).
  51. Abramenko, V.I.; Kutsenko, O.K. Magnetic power spectrum in the undisturbed solar photosphere. Acta Astrophys. Taurica 2020, 1, 1. [Google Scholar] [CrossRef]
  52. Iroshnikov, R.S. Turbulence of a conducting fluid in a strong magnetic field. Astron. Zhurnal 1964, 40, 742, English translation in Sov. Astron. 1964, 7, 566. [Google Scholar]
  53. Bershadskii, A. Chaotic variability of the magnetic field at Earth’s surface driven by ionospheric and space plasmas. J. Atmos. Sol.-Terr. Phys. 2025, 269, 106456. [Google Scholar]
  54. Bershadskii, A. Foreground emission randomization due to dynamics of magnetized interstellar medium: WMAP and Planck frequency bands. Foundations 2025, 5, 21. [Google Scholar] [CrossRef]
  55. Kutsenko, A.S.; Abramenko, V.I.; Kutsenko, O.K. On the possibility of probing the flare productivity of an active region in the early stage of emergence. Mon. Not. R. Astron. Soc. 2021, 501, 6076–6082. [Google Scholar] [CrossRef]
  56. Hewett, R.J.; Gallagher, P.T.; McAteer, R.T.J.; Young, C.A.; Ireland, J.; Conlon, P.A.; Maguire, K. Multiscale analysis of active region evolution. Solar Phys. 2007, 248, 311–322. [Google Scholar]
  57. Moffatt, K.; Dormy, E. Self-Exciting Fluid Dynamos; Cambridge University Press: Cambridge, UK, 2019. [Google Scholar]
  58. Tobias, S.M. The turbulent dynamo. J. Fluid Mech. 2021, 912, P1. [Google Scholar] [CrossRef]
  59. Shebalin, J.V. The Statistical Mechanics of Ideal Magnetohydrodynamic Turbulence and a Solution of the Dynamo Problem. Fluids 2024, 9, 46. [Google Scholar] [CrossRef]
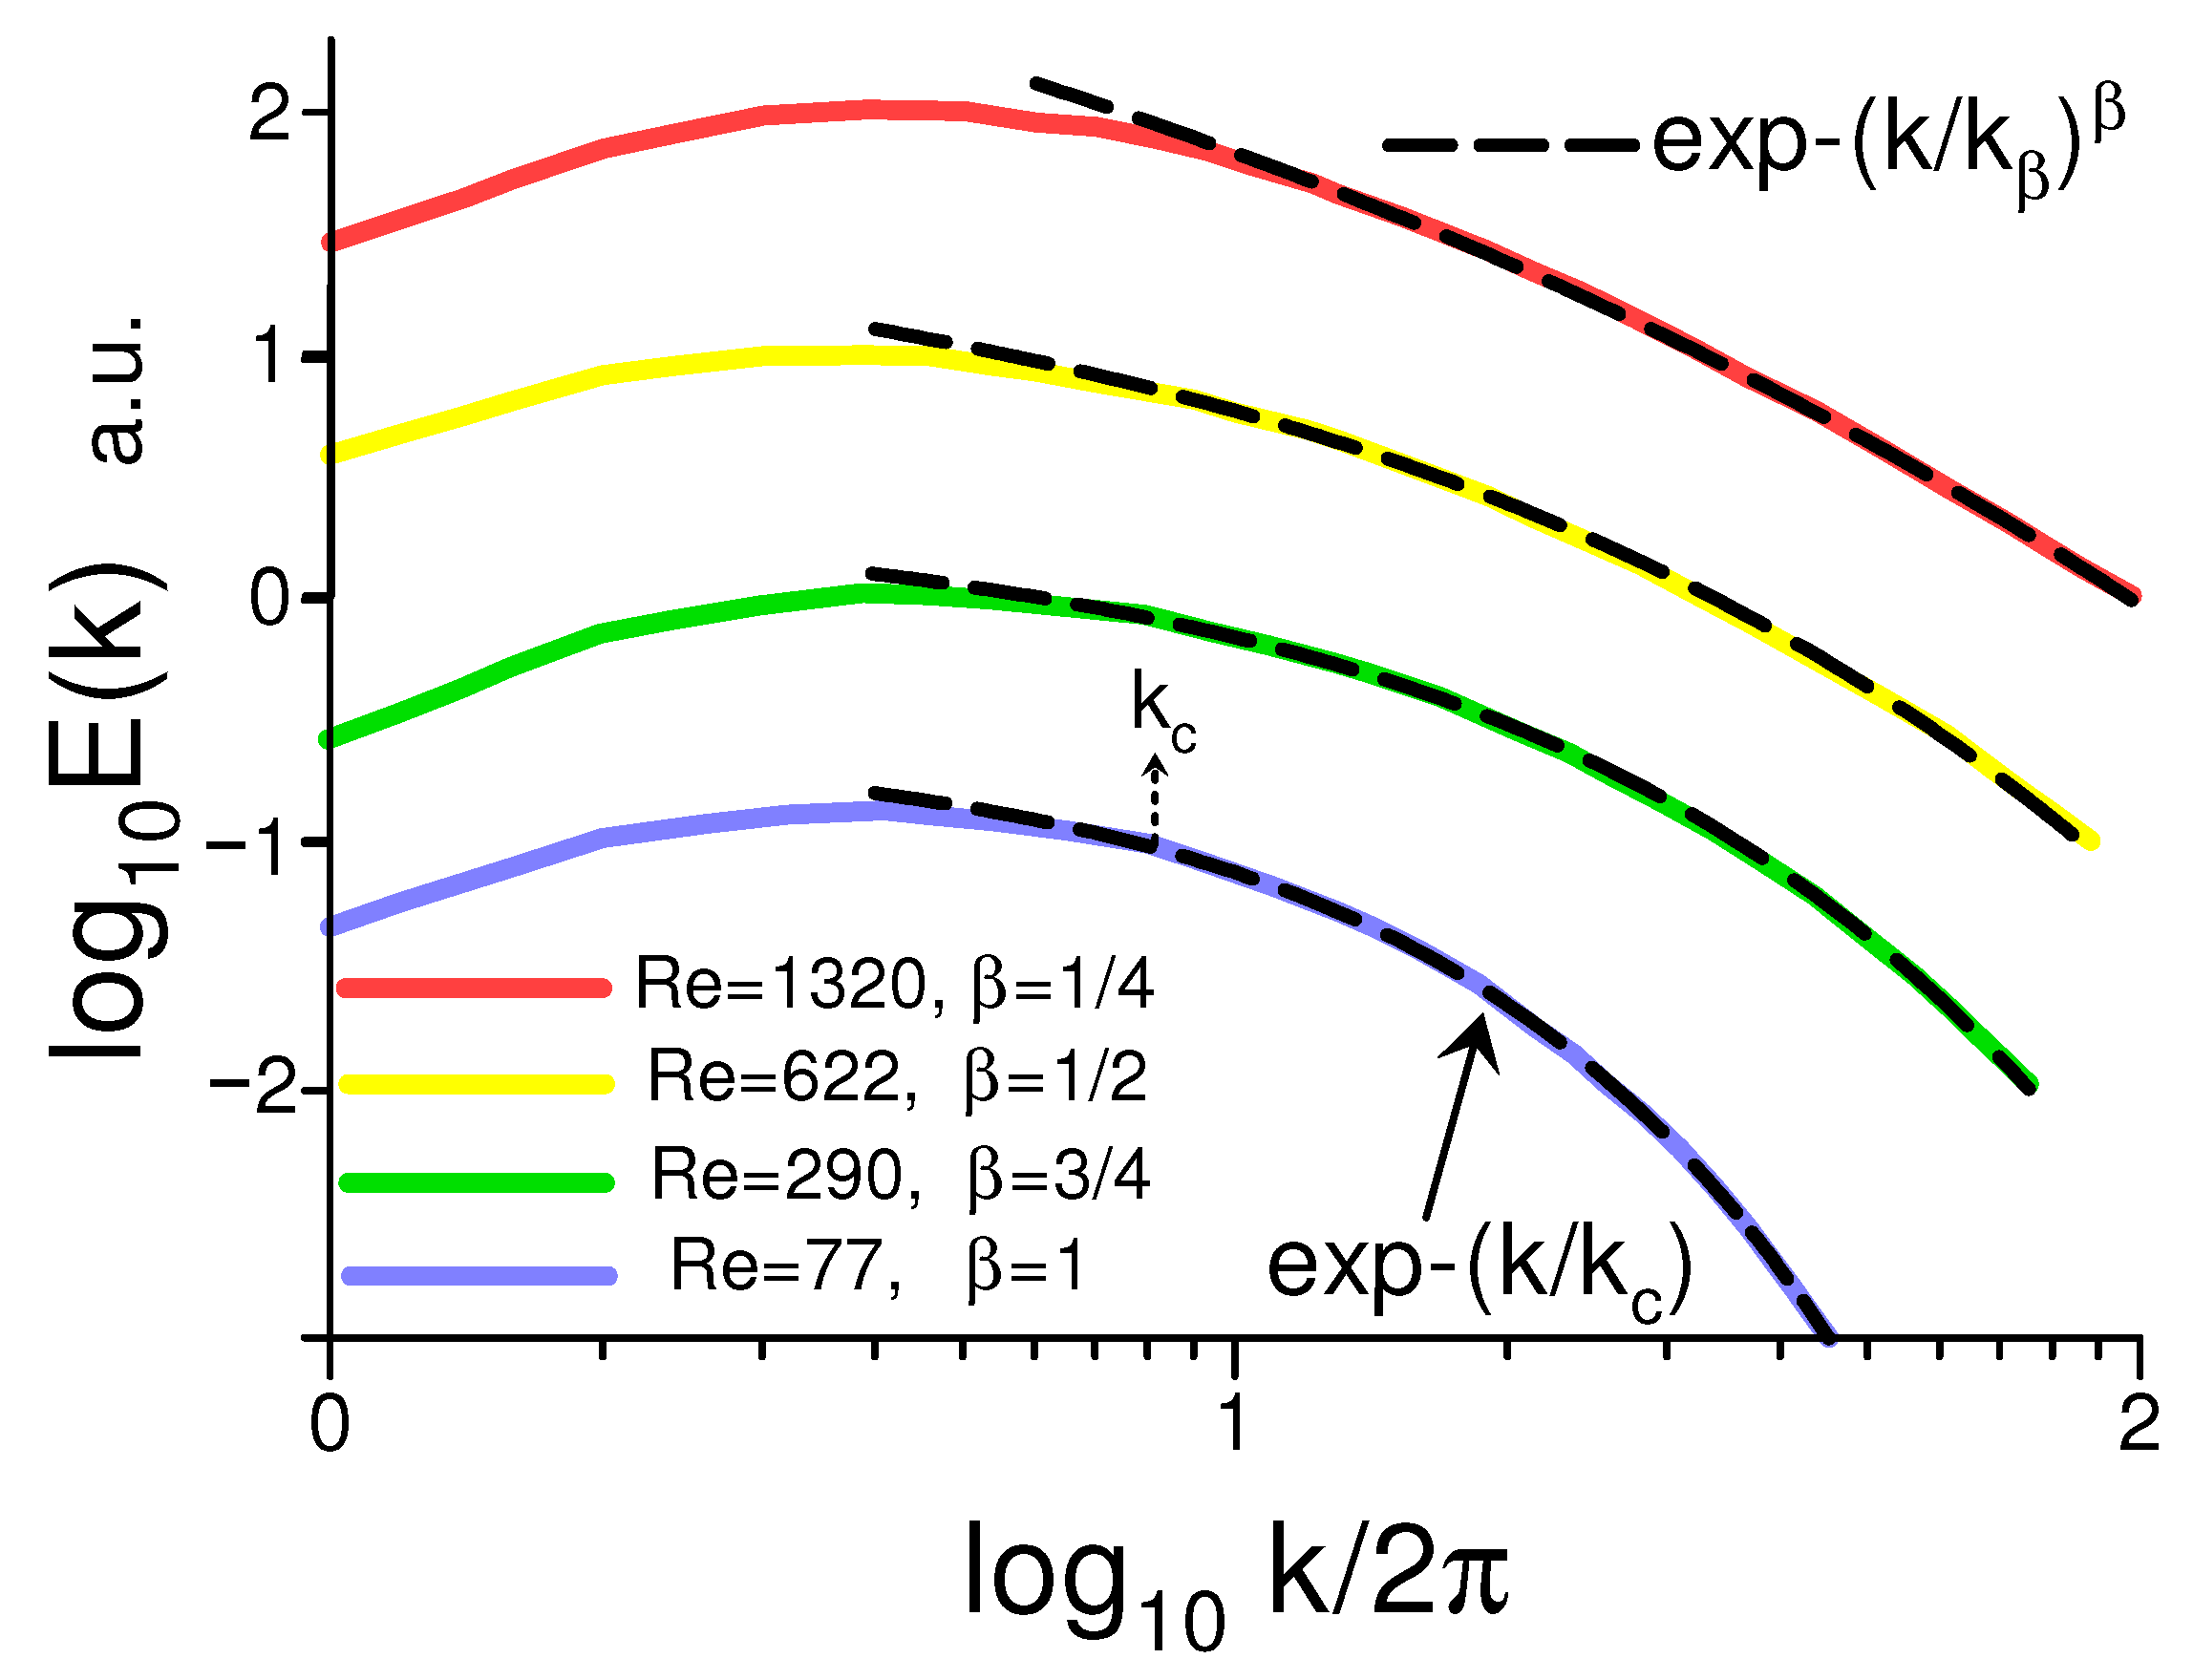
Figure 1. Magnetic energy spectra generated by a small-scale, incompressible, saturated MHD dynamo at different values of the Reynolds number and magnetic Prandtl number P r m = 10 (direct numerical simulations). The spectra are vertically shifted for clarity.
Foundations 05 00031 g001
Figure 2. Magnetic energy spectra for an emerging solar active region, AR NOAA 11726, at different times of its evolution.
Foundations 05 00031 g002
Figure 3. Magnetic and kinetic energy spectra at R e m = 2800 and P r m = 4 (direct numerical simulations without net kinetic and magnetic helicities).
Foundations 05 00031 g003
Figure 4. Magnetic energy spectra at R e = 7958 and P r m = 0.05 (bottom) and at R e = 32,930 and P r m = 0.005 (up). The direct numerical simulations were performed without net kinetic and magnetic helicities.
Foundations 05 00031 g004
Figure 5. Magnetic energy spectra for different times of evolution ( t 1 < t 2 < t 3 ) of a direct, numerically simulated, small-scale dynamo ( R e = 1250 , and P r m = 1 ). The direct numerical simulations were performed without net kinetic and magnetic helicities. The spectra are vertically shifted for clarity.
Foundations 05 00031 g005
Figure 6. Magnetic energy spectra for different times of evolution of a direct, numerically simulated, small-scale helical Hall MHD dynamo. The spectra are vertically shifted for clarity.
Foundations 05 00031 g006
Figure 7. Magnetic energy spectra for a photospheric layer at different times of the dynamo’s evolution (DNS).
Foundations 05 00031 g007
Figure 8. Magnetic energy spectra averaged over a vertical range between z = 0 km and z = 200 km, and over time. The dissipative and non-dissipative cases correspond to the bottom and top curves, respectively (DNS). The spectra are vertically shifted for clarity.
Foundations 05 00031 g008
Figure 9. Magnetic energy spectra for synoptic maps of the early rising (bottom) and early declining (top) phases of solar cycle 24.
Foundations 05 00031 g009
Figure 10. Magnetic energy spectra in undisturbed photosphere: CH—coronal hole (bottom); QS—quiet Sun region; SG—supergranular network (top); MF—magnetic field.
Foundations 05 00031 g010
Figure 11. Evolution of the magnetic energy spectra for an emerging active solar region, NOAA 11781.
Foundations 05 00031 g011
Figure 12. Evolution of the magnetic energy spectra for an emerging active solar region, NOAA 12219.
Foundations 05 00031 g012
Figure 13. Evolution of the magnetic energy spectra for a rapidly emerging active solar region, AR NOAA 10488. The spectra are vertically shifted for clarity.
Foundations 05 00031 g013
Disclaimer/Publisher’s Note: The statements, opinions and data contained in all publications are solely those of the individual author(s) and contributor(s) and not of MDPI and/or the editor(s). MDPI and/or the editor(s) disclaim responsibility for any injury to people or property resulting from any ideas, methods, instructions or products referred to in the content.