Article

Brainwave Dynamics: Neurophysiological Responses to Enclosed Courtyards for Mental Wellbeing in Educational Contexts

by
Raneem Anwar
1,*,†,
Samah Elkhateeb
1,2,
Samy Afifi
1 and
Karim Bayoumi
1
1
Urban Design and Urban Planning Department, Faculty of Engineering, Ain Shams University, Cairo 11517, Egypt
2
Smart and Sustainable Cities Center, Architectural Department, College of Engineering, University of Business and Technology (UBT), Jeddah 21448, Saudi Arabia
*
Author to whom correspondence should be addressed.
PhD candidate.
Architecture 2025, 5(3), 76; https://doi.org/10.3390/architecture5030076
Submission received: 10 July 2025 / Revised: 11 August 2025 / Accepted: 26 August 2025 / Published: 5 September 2025

Abstract

University students are subject to various demands in their role as academics. Such pressures tend to amplify emotional distress, making them more susceptible to mental health hazards. This study investigates the influence of enclosed courtyards on students’ mental health within educational facilities, focusing on their distinct spatial configurations, such as semi-open layouts and vegetation cover, as well as their effects on intellectual functioning and well-being. The research used electroencephalography (EEG) to examine brainwave activity and quantify the influence of the spatial design of enclosed courtyards on the mental and emotional well-being of students. An experiment with 16 students and EEG measurements was conducted in the Faculty of Engineering courtyard at Egypt’s Ain Shams University in Cairo, providing 60–70% statistical power to detect medium effect sizes (Cohen’s d = 0.5, α = 0.05), which is sufficient for exploratory research. The study explores the psychophysiological implications of the brain’s electrical signals as neurological measurements, such as alpha and theta brainwaves, in order to assess individuals’ relaxation, restoration, and attention levels. The findings show that natural characteristics of the courtyard, expansive space, and visual stimuli have a significant effect on restoration and attention. While the sample size is limited and the design is context-specific, the results provide preliminary evidence that meticulously designed enclosed courtyards can improve students’ mental well-being. These findings invite further multi-site validation to assess generalizability. This study contributes to the expanding domain of neurolandscape” by demonstrating the interplay between built environments and mental health in educational contexts.

1. Introduction

College students have several pressures, including role transitions, academic responsibilities, interpersonal interactions, and employment obligations [1]. These pressures frequently exacerbate emotional suffering, heightening susceptibility to mental health issues. Thus, this could impact students’ physical and mental health, as well as their academic performance, potentially leading to social isolation and negative behaviors [2]. In psychology, anxiety is defined as intrusive and distressing emotions concerning perceived threats, manifesting as excessive worry [3]. Noticeably, a considerable proportion of students worldwide experience anxiety-related challenges [4,5,6]. This underscores the critical role of learning environments in shaping not only academic experiences but also intellectual development and emotional well-being. Substantial evidence from environmental psychology further affirms that physical settings exert a profound influence on educational outcomes, including attention, motivation, and mental health [7,8].
Within this framework, learning environments present a paradox—while they have the potential to foster positive psychological states, they can also exacerbate mental health difficulties and hinder academic performance. Empirical studies indicate that poorly designed educational spaces contribute to heightened stress, increased anxiety, and diminished academic achievement [9,10]. In contrast, well-structured environments can promote relaxation (as defined in Stress Recovery Theory—SRT), enhance cognitive performance (as supported by Attention Restoration Theory—ART), and act as a restorative sanctuary, i.e., a space that supports psychological recovery and attention renewal [2]. These theories—SRT and ART—provide a theoretical foundation to explain how certain spatial and environmental features can positively influence mental states [11]. Additionally, prior research has demonstrated that exposure to natural elements, such as open spaces, greenery, and enough sunlight, has been scientifically linked to enhanced cognitive function and decreased stress levels, thereby fostering an environment that is conducive to successful learning [12]. This ambivalent outcome highlights the need for specific interventions designed to enhance these environments to successfully promote student mental health and academic achievement.
In terms of spatial configuration, courtyards—enclosed or semi-enclosed outdoor spaces within institutional settings—stand out as significant architectural features. Historically, courtyards have served as communal centers in educational institutions, promoting social interaction [13]. Despite their acknowledged importance, the psychophysiological impacts of courtyards with varying spatial configurations on students remain insufficiently explored, particularly through objective, real-time measures such as brainwave analysis. Furthermore, specific spatial design features that influence mental well-being may be adaptable, allowing their effectiveness to be optimized within courtyard settings. Courtyard environments encompass a variety of spatial and visual attributes that are likely to influence the neurophysiological responses related to attention and emotional well-being. Elements such as vegetation, natural light, and surface finishes constitute the visual stimuli that shape users’ sensory experiences within space [14]. Simultaneously, features like layout shape, spatial proportion, degrees of enclosure, and the connectivity between different zones reflect the spatial configuration that defines the courtyard’s structural logic [14,15]. These environmental qualities are not merely esthetic or functional, they are theorized to engage with cognitive and emotional processes, potentially triggering measurable changes in brain activity [16,17]. As such, understanding how these attributes interact with users on a neurological level is essential for developing courtyard designs that actively support mental restoration and cognitive performance.
Therefore, this study intends to shed some light on two main issues through answering the following questions:
1.
How do the spatial configurations of enclosed courtyards in educational settings influence students’ neurophysiological responses, as measured by brainwave activity (e.g., alpha and theta waves)?
2.
What is the relationship between the visual stimuli of enclosed courtyards (e.g., existing natural elements) and psychophysiological outcomes like relaxation or reduced anxiety in students?
In an enclosed courtyard in the Faculty of Engineering at Ain Shams University, the authors utilized EEG as a non-invasive technology to record the electrical activity of the brain. Although subjective methods such as surveys and interviews have traditionally been used in post-occupancy evaluations, EEG (electroencephalography) presents a more direct, real-time, and non-invasive method to assess the cognitive and emotional effects of designed spaces. Previous environmental and architectural studies have successfully employed EEG to examine how physical settings influence brain activity, including attentional states, stress recovery, and emotional arousal [18,19,20,21,22,23]. These studies validate EEG’s capacity to detect physiological indicators by translating them into psychological states.
Following this approach, this article presents evidence-based insights on designing courtyards that enhance students’ mental well-being. This research not only presents immediate findings but also advances the emerging field of the “neurolandscape”, which combines open space design principles with neuroscience in order to develop human-centered environments, thereby influencing educational design practices more broadly.

2. Shaping Minds: Educational Spaces and Students’ Mental Health

University campuses serve as more than venues for formal instruction; they are dynamic ecosystems where students engage extensively in activities that demand sustained concentration and cognitive effort [11,24]. Both indoor and outdoor settings within these campuses play a pivotal role in shaping a holistic learning experience that extends beyond conventional academic boundaries [25]. This interplay between people and their environment is best understood through two foundational theories—Attention Restoration Theory (ART) and Stress Recovery Theory (SRT).
Attention Restoration Theory (ART) offers a framework for comprehending the mechanisms by which natural environments restore cognitive resources [8]. It differentiates between directed voluntary attention and spontaneous involuntary attention. Directed voluntary attention is employed in challenging tasks such as studying; it depletes rapidly and results in mental fatigue. This type of attention requires active, conscious effort to focus while suppressing distractions. On the other hand, spontaneous involuntary attention, or fascination, is effortless and elicited by natural environments [26]. ART also delineates four facets—being away, extent, fascination, and compatibility—that facilitate the restoration of directed attention in environments [8]. SRT states that looking at scenery containing natural elements like greenery or water creates positive emotions and feelings like interest, pleasure, and calm, as well as having a restorative effect [18].
This connection between the environment and mental health is particularly relevant given the escalating mental health concerns among university students, with 86% reporting elevated stress, 62% experiencing anxiety, and 14% suffering from severe depression [27,28,29]. As highlighted by The Ottawa Charter, health is cultivated in everyday settings where individuals participate in studying, working, playing, and loving [30]. Hence, universities have a considerable capacity to improve mental well-being by creating environments that balance cognitive demands with opportunities for rest and recuperation [30]. Mental well-being is a state of emotional, psychological, and social health that helps people deal with life’s obstacles, maintain their equilibrium, and find fulfillment [31]. Additionally, several interrelated processes support mental health; among these, relaxation and restoration are crucial elements that support psychological resilience and recovery. Despite their close relationship, the two processes have different purposes. After stress or mental exhaustion, restoration is the process by which diminished cognitive, intellectual, and emotional resources are recovered. Rebuilding internal capacities and disengaging from stressors are usually linked to this. There are two primary categories of restoration—cognitive restoration, which involves regaining mental focus and attentional control, and emotional restoration, which is defined by minimizing negative effects and promoting positive mood [32,33].
Relaxation, on the other hand, is a more immediate, subjective state characterized by calmness and decreased arousal. Relaxation promotes a brief suspension of stress or alertness rather than the rebuilding of depleted resources, in contrast to restoration, which is goal-directed and frequently necessitates a certain amount of time or environmental quality to achieve recovery [34]. Through careful case studies, these psychological effects have been examined in relation to outdoor space design. The following (Table 1) illustrates the various ways that educational outdoor spaces can impact students’ mental health through a range of psychological effects [34,35,36].
Finally, mental well-being is underscored by the dynamic interaction between people and their settings, suggesting that well-designed places might serve as health resources [6,37]. In this article, the authors will focus on courtyards as spaces for restoration. The article will tackle courtyards not as a generic form but while reflecting on their spatial configuration and the encompassed visual stimuli presented in the landscape design of the courtyard.

3. The Courtyard Concept: Spatial Configuration and Visual Stimuli

Courtyards are architectural features that have a significant historical and contemporary role in educational settings [38,39]. Courtyards, as the article’s focus, serve as vital spaces that enhance students’ mental well-being and learning experiences. These environments provide visual and sensory stimuli that alleviate mental fatigue and promote a sense of community, meeting students’ needs for reflection and social interaction [40]. Defined as enclosed or partially enclosed areas surrounded by walls or buildings, courtyards have been an inherent element of building design for centuries, with their beginnings being traced back to their inception in Sumer and Pharaonic Egypt [17]. Originally intended for protection, they have now turned out to be the central points of dwelling, occupation, and interaction, driven by social and cultural forces [41]. In educational contexts, courtyards provide relief from the mental pressures of academic life, facilitating relaxation and socialization [13].
Previous research has investigated the influence of courtyard designs as outdoor spaces on human well-being, particularly through the analysis of spatial configurations and visual stimuli generated by landscape features. In terms of visual stimuli, courtyards characterized by greenery and natural lighting provide environments that foster relaxation, social interaction, and informal learning [10,40,42,43]. Elements such as comfortable seating, shade, and vegetation further promote mental restoration and strengthen students’ sense of belonging [16,17,44]. Incorporating water features, such as fountains, has been shown to enhance happiness, create a sense of openness, and significantly reduce anxiety levels (p < 0.01, OR = 0.504) [13]. Collectively, these design components cultivate tranquil settings that alleviate stress and support mental well-being [10,24].
The spatial configuration of courtyards is essential to determining how they affect students’ mental and physical health [45]. For instance, the use of diverse shapes in courtyards (e.g., rectangular, square, U-shaped, or curvilinear) could aid in taking optimum advantage of natural light and ventilation for ultimate comfort [45]. U-shaped courtyards, for example, are commonly east–west-oriented with a southern opening, improving ventilation and shading, making learning areas more comfortable for students [40].
Crucial design factors such as courtyard dimensions, degree of enclosure, and shape significantly influence psychological implications. Expansive, open layouts provide increased natural illumination, enhancing visual attractiveness, whereas square courtyards with elevated walls provide superior shade, resulting in more comfortable and cooler environments [10,38]. In high-density campuses, small courtyards situated near study areas are particularly beneficial as they offer immediate access to tranquil spaces that promote concentration and relaxation [24,46].
Ultimately, courtyards in educational environments serve as effective instruments for enhancing mental health and improving learning outcomes by integrating historical significance with modern design principles. Exquisitely structured courtyards, distinguished by deliberate shapes, orientations, and natural elements, are vital components of campus settings that affect academic achievement and psychological well-being, as colleges aim to address students’ mental health challenges.
The following tables (Table 2 and Table 3) show how the landscape elements that represent the visual stimuli and spatial configurations of courtyards would create specific psychological effects, according to previous studies.

4. Materials and Methods

4.1. Study Area

The courtyard is an enclosed outdoor space located within the Faculty of Engineering at Ain Shams University, Cairo, Egypt, positioned centrally within the faculty’s building complex; it is surrounded by academic structures. The following table (Table 4) depicts a full description of the courtyard.
Table 4. Courtyard description.
ParameterDescription
Spatial Configuration Shape and DimensionsRectangular courtyard with a narrow, elongated layout. Yellow-marked area in schematic plan indicates the experiment zone where students were seated, as seen in Figure 1.Approx. 9 m × 17 m (153 m2)Architecture 05 00076 i001
EnclosureSurrounded on four sides by multi-story buildings (3–4 stories), creating an enclosed confined space.Building height: ~12–15 m; height-to-width ratio ≈ 0.8–1.0
Visual Stimuli as seen in Vegetation CoverageDense greenery with large canopy trees, shrubs along building edges, and low vegetation near seating.~35% of courtyard areaArchitecture 05 00076 i002
Hardscape CoverageBrick paving for central walkway.~65% of courtyard area
Vegetation-to-Hardscape RatioRatio reflecting greenery versus paved/constructed surfaces.2:3 (35% vegetation: 65% hardscape)
Furniture and Shading Structures
1.
Shade provided naturally by tree canopies;.
2.
Wooden-slat benches.
3.
Concrete bollards.
1.
No artifital shading.
2.
Four
3.
Three
Source: Authors.
Figure 1. The study workflow. Source: Authors.
Architecture 05 00076 g001
Participants were seated on the most enclosed side of the U-shaped courtyard to test the enclosure’s impact on relaxation, enabling visibility and a sense of the entire space while shielding them from noise disruptions from other students and passersby. This location, identified as the calmest area, was also the most unfamiliar to participants, chosen to assess initial reactions by reducing the influence of habituation or personal associations. While other orientations were considered, this specific site was prioritized for its controlled conditions and enclosure benefits.
The experiment was conducted from November to January, on clear days in the winter season. It took place between 1:30 p.m. and 4.30 p.m. This time slot was chosen to occur after the break period in order to minimize external noise, as fewer students were present in the courtyard during these hours, as well as to ensure consistent environmental conditions and natural lighting while no artificial lighting was used. Throughout the experiment, the temperature fluctuated between 22 °C and 26 °C. This indicates that the weather was stable and temperate.

4.2. Study Design

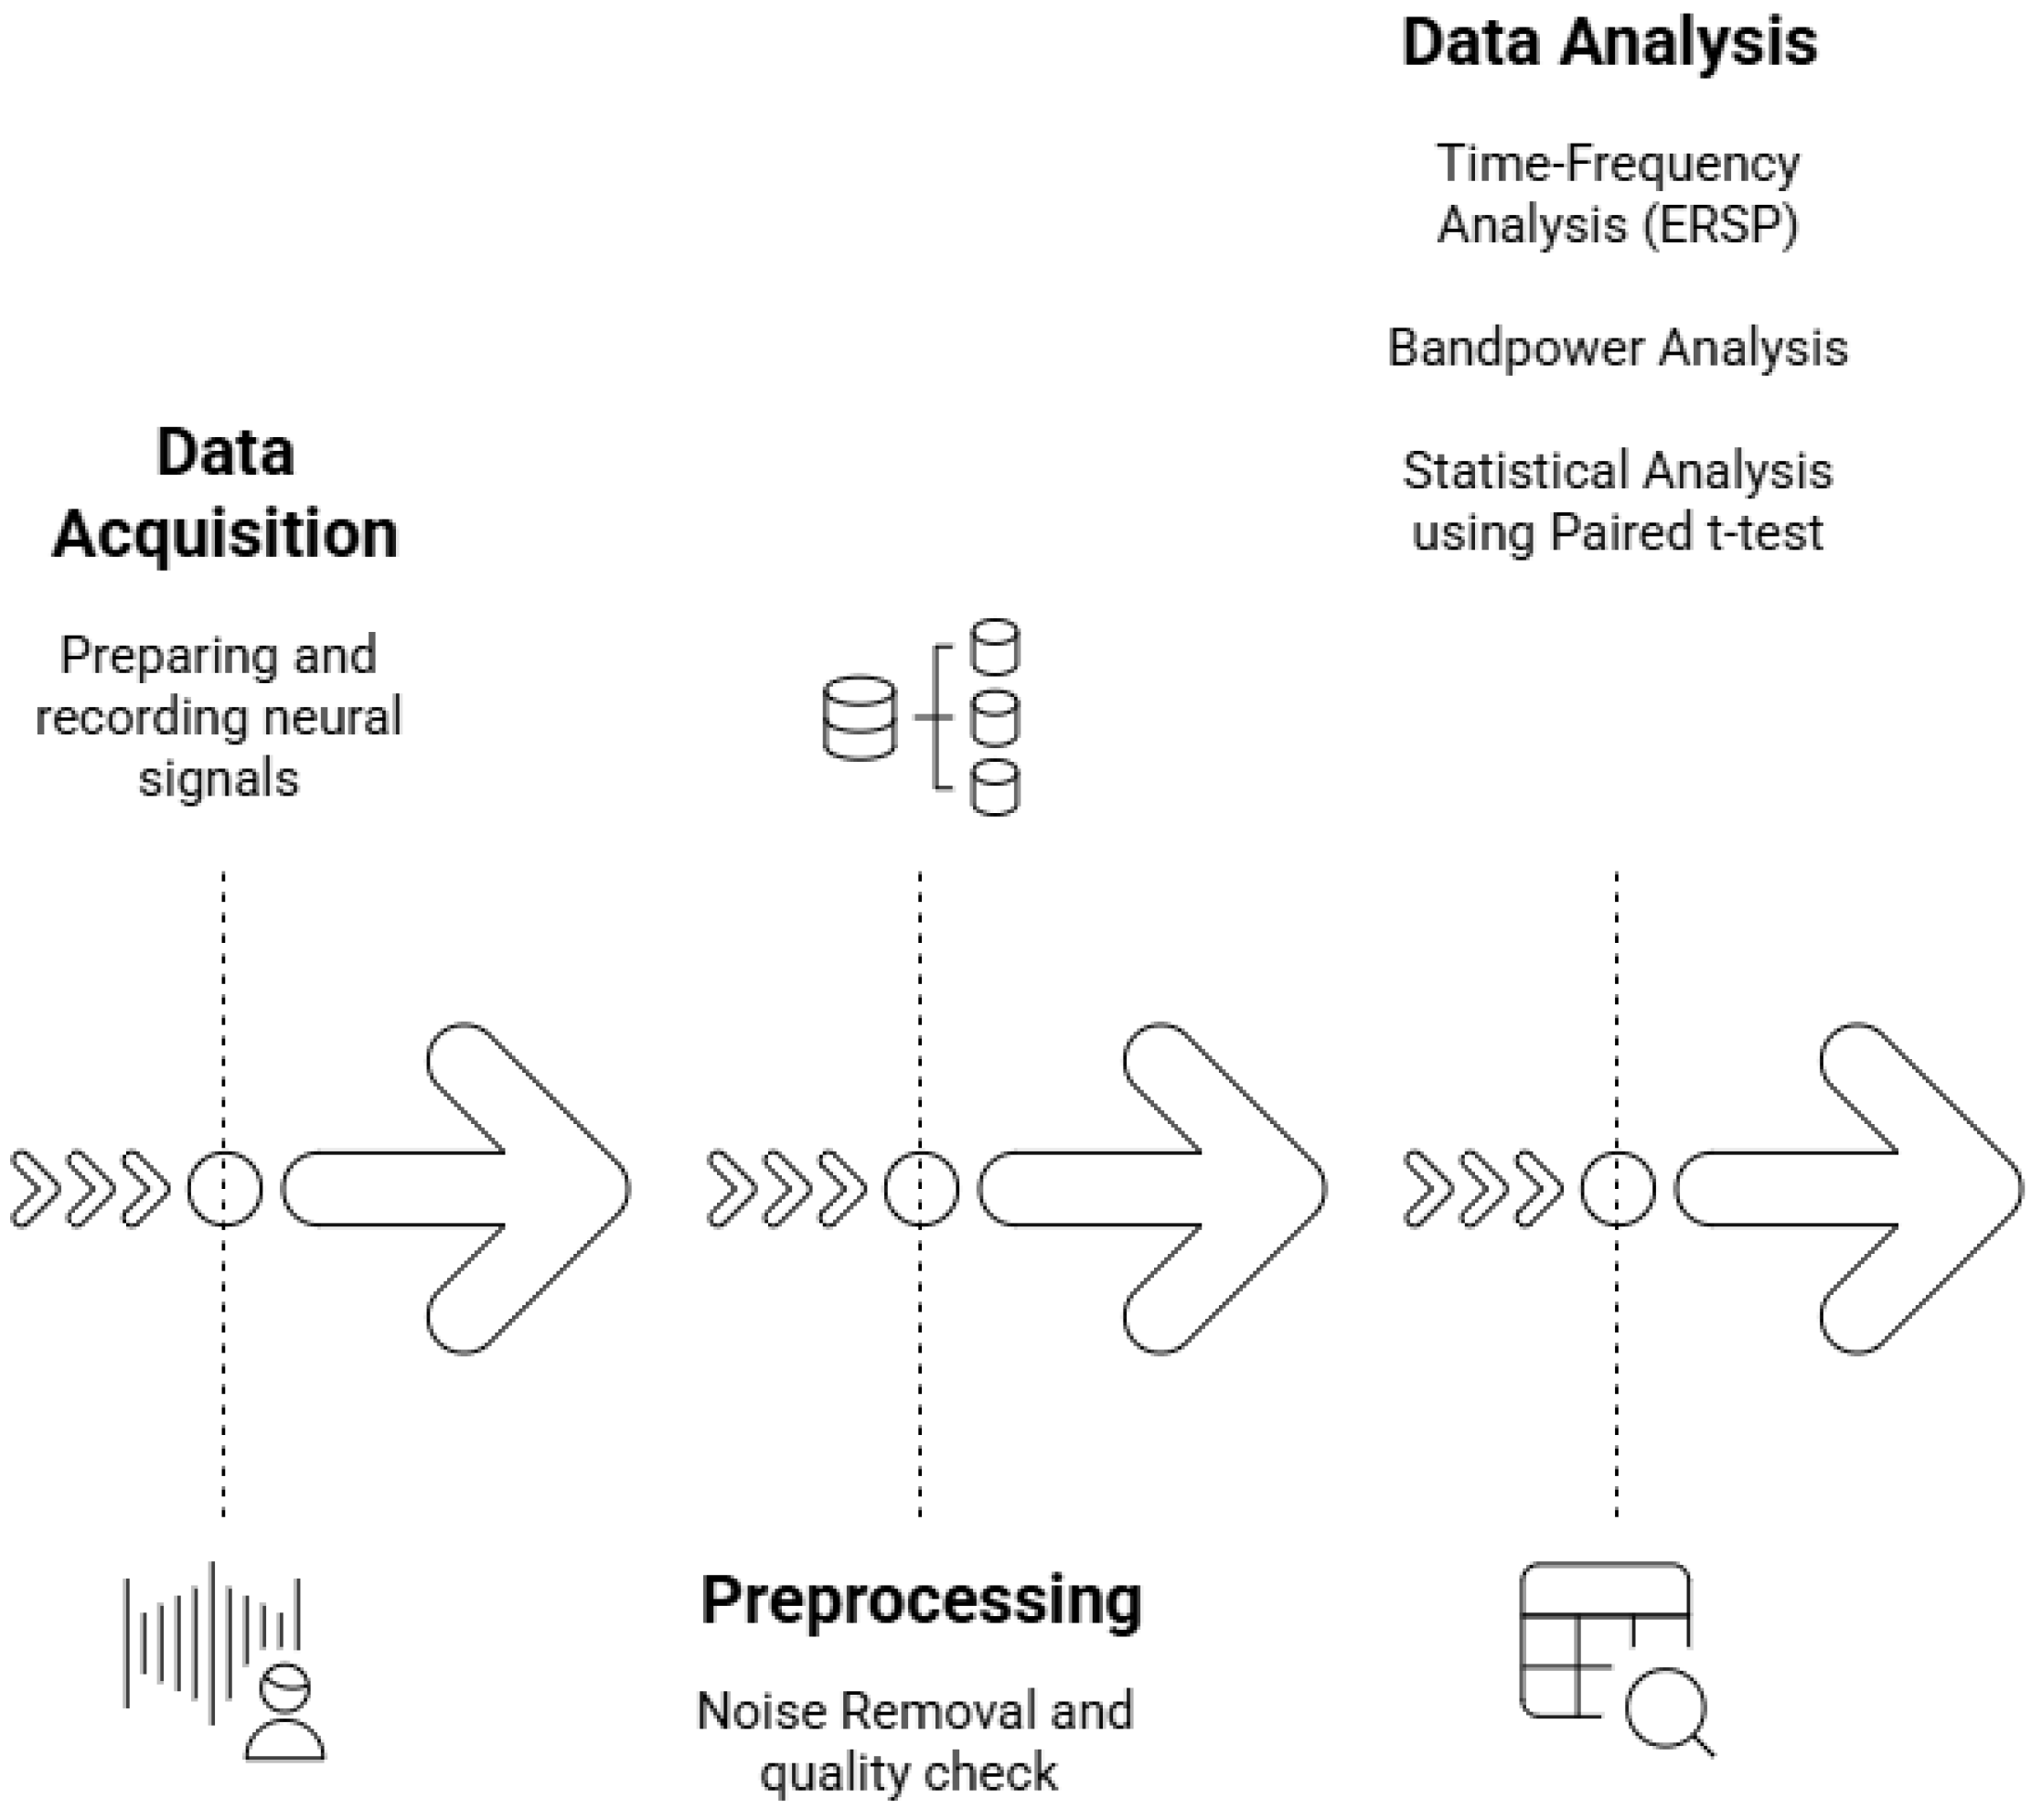
This endeavor followed a psychophysiological approach in the analysis, while following a neurophysiological (neurological) approach in data acquisition. It employed an experimental design to investigate the neurophysiological responses of students in an educational environment to an enclosed courtyard environment. The experiment was conducted exclusively in an enclosed courtyard at the Ain Shams University Faculty of Engineering in Cairo, Egypt. To provide similar baseline conditions for cognition and emotions, all participants had EEG recordings following a two-hour standardized lecture. The experiment aims to assess the psychological implications and outcomes of brainwave activity in relation to the courtyard environment, zeroing in on cognitive and emotional states such as tension, relaxation, and concentration. The study workflow is divided into three main stages—data acquisition, data preprocessing, and data analysis, as seen in Figure 1.

4.3. Participants

The experiment included 16 participants—9 female and 7 male—recruited from the Faculty of Engineering at Ain Shams University. According to power analysis guidelines [47] this sample size (n = 16) corresponds to a medium effect size (Cohen’s d = 0.5) and provides approximately 60–70% statistical power at a 0.05 significance level (two-tailed paired t-test), which is sufficient for detecting meaningful patterns in an exploratory, controlled setting. While adequate for preliminary investigation, the limited number of participants constrains the generalizability of the results, positioning this study as a pilot that can inform future research with larger and more diverse samples.
Participants were required to be healthy individuals aged 18–22, with no history of heart conditions (e.g., arrhythmia), emotional health disorders (e.g., severe depression or post-traumatic stress disorder), neurological conditions, or vision impairments not correctable to normal. To maintain data integrity, individuals did not use medications affecting brainwave activity or the nervous system. Participants were instructed to abstain from consuming stimulants, including caffeine and tobacco, on the day of testing.
Ethical approval was granted by the Ain Shams University institutional review board, and informed consent was obtained from all participants. All were enrolled in the Urban Design Department’s landscape design courses, ensuring both relevance to their academic background and commitment to the experimental study. Participants were unfamiliar with the setting in this space and, hence, have no negative experience about this space in order to minimize potential bias from prior experience. Additionally, as this was their first exposure to EEG within a research context, their responses were uninfluenced by previous procedural familiarity, though their engineering training likely enhanced their sensitivity to spatial configurations due to prior experience in design and spatial analysis.

4.4. Data Acquisition: Neurophysiological Approach

As shown in Figure 2, the recorded brain activity is categorized into distinct frequency bands, each corresponding to a specific range of brainwave frequencies. Theta (θ) was one of the brainwave frequencies that was recorded in the experiment. This frequency ranges from 4 to 8 Hz and is predominantly observed during sleep and daydreaming. It enables the individual to disconnect from the external environment, which, in turn, facilitates the acquisition of knowledge [48,49]. Alpha (α) waves, which span the Beta and Theta bands ranging from 8 to 12 Hz, are indicative of the brain’s quiescent state. These waves facilitate learning, body integration, mental coordination, alertness, and tranquility [50]. Beta (β) waves are low-amplitude, high-frequency waves that range from 12 to 25 Hz; they are associated with logical thinking, anxiety, task-oriented activities, conscious thought, and active concentration. Emotiv SDK further separates low-Beta (12–18 Hz) and high-Beta (18–25 Hz) sub-bands in order to improve intensity and output precision [33,51]. With a frequency range of 25 to 100 Hz, Gamma (γ) waves are the fastest brainwaves and are associated with cognitive functioning and high-level processing tasks. They facilitate quick and effective information transfer, which is essential for learning and information processing.

4.4.1. Apparatus Calibration and Data Preprocessing

The experiment employed the NeuroSky MindWave Mobile 2, which is a consumer-grade, single-channel, wireless EEG headset intended for non-invasive brainwave monitoring. It is characterized by a lightweight design and incorporates a dry electrode located at FP1 (forehead above the eye), along with reference and ground electrodes on an ear clip. This device was chosen for its affordability and accessibility, making it ideal for a pilot study with a limited sample. Its prior use in environmental psychology studies [33,52,53] further validates its reliability for detecting preliminary neurophysiological patterns in real-world settings. It utilizes the ThinkGear ASIC Module (TGAM) for signal processing, effectively filtering noise including EMG and 50/60 Hz interference, as well as providing raw EEG data (3–100 Hz, 512 Hz sampling rate), power spectra (Delta, Theta, Alpha, Beta, and Gamma), and eSense metrics (attention and meditation). Accurate signal capture in outdoor settings was guaranteed by the NeuroSky MindWave Mobile 2’s calibration. To reduce impedance, the forehead and earlobe were cleaned with alcohol wipes before the EEG electrode was positioned at FP1; this was carried out according to the catalog of the tool. The signal quality was then evaluated using OpenViBE 3.0.0software via the ThinkGear Connector, which confirmed stability (e.g., noise levels below 15%, usually indicating an acceptable range at 12.5%) and required modifications to obtain a green status. Artifact control was attained by regulated participant movements (e.g., blinking and head tilting), with OpenViBE employing a bandpass filter (0.5–45 Hz) to eliminate high-frequency noise and low-frequency drift, thereby augmenting TGAM’s filtering, as corroborated by visualization tools.

4.4.2. Procedures Seen in Figure 3

A neurophysiological (neurological) approach was utilized for data collection. The headset was positioned to capture the previously mentioned frequency bands, providing psychological interpretations, respectively [53]. To normalize cognitive load and fatigue levels, each participant underwent a 5-min EEG recording session in the enclosed courtyard immediately following a two-hour lecture. Participants were directed to sit comfortably for four minutes following a one-minute baseline recording with their eyes closed to ascertain resting brainwave activity. They engaged in a passive observation activity, concentrating on their environment without undertaking cognitively taxing activities. A passive observation task was chosen to isolate neurophysiological responses to environmental qualities, sensory perception, and spatial atmosphere, aligning with neurolandscape research focused on baseline mental states in response to mere landscape features.
Figure 3. Experiment procedures. Source: Authors.
Architecture 05 00076 g003

4.5. Data Processing and Analysis: Psychophysiological Approach (Figure 4)

4.5.1. Data Analyses
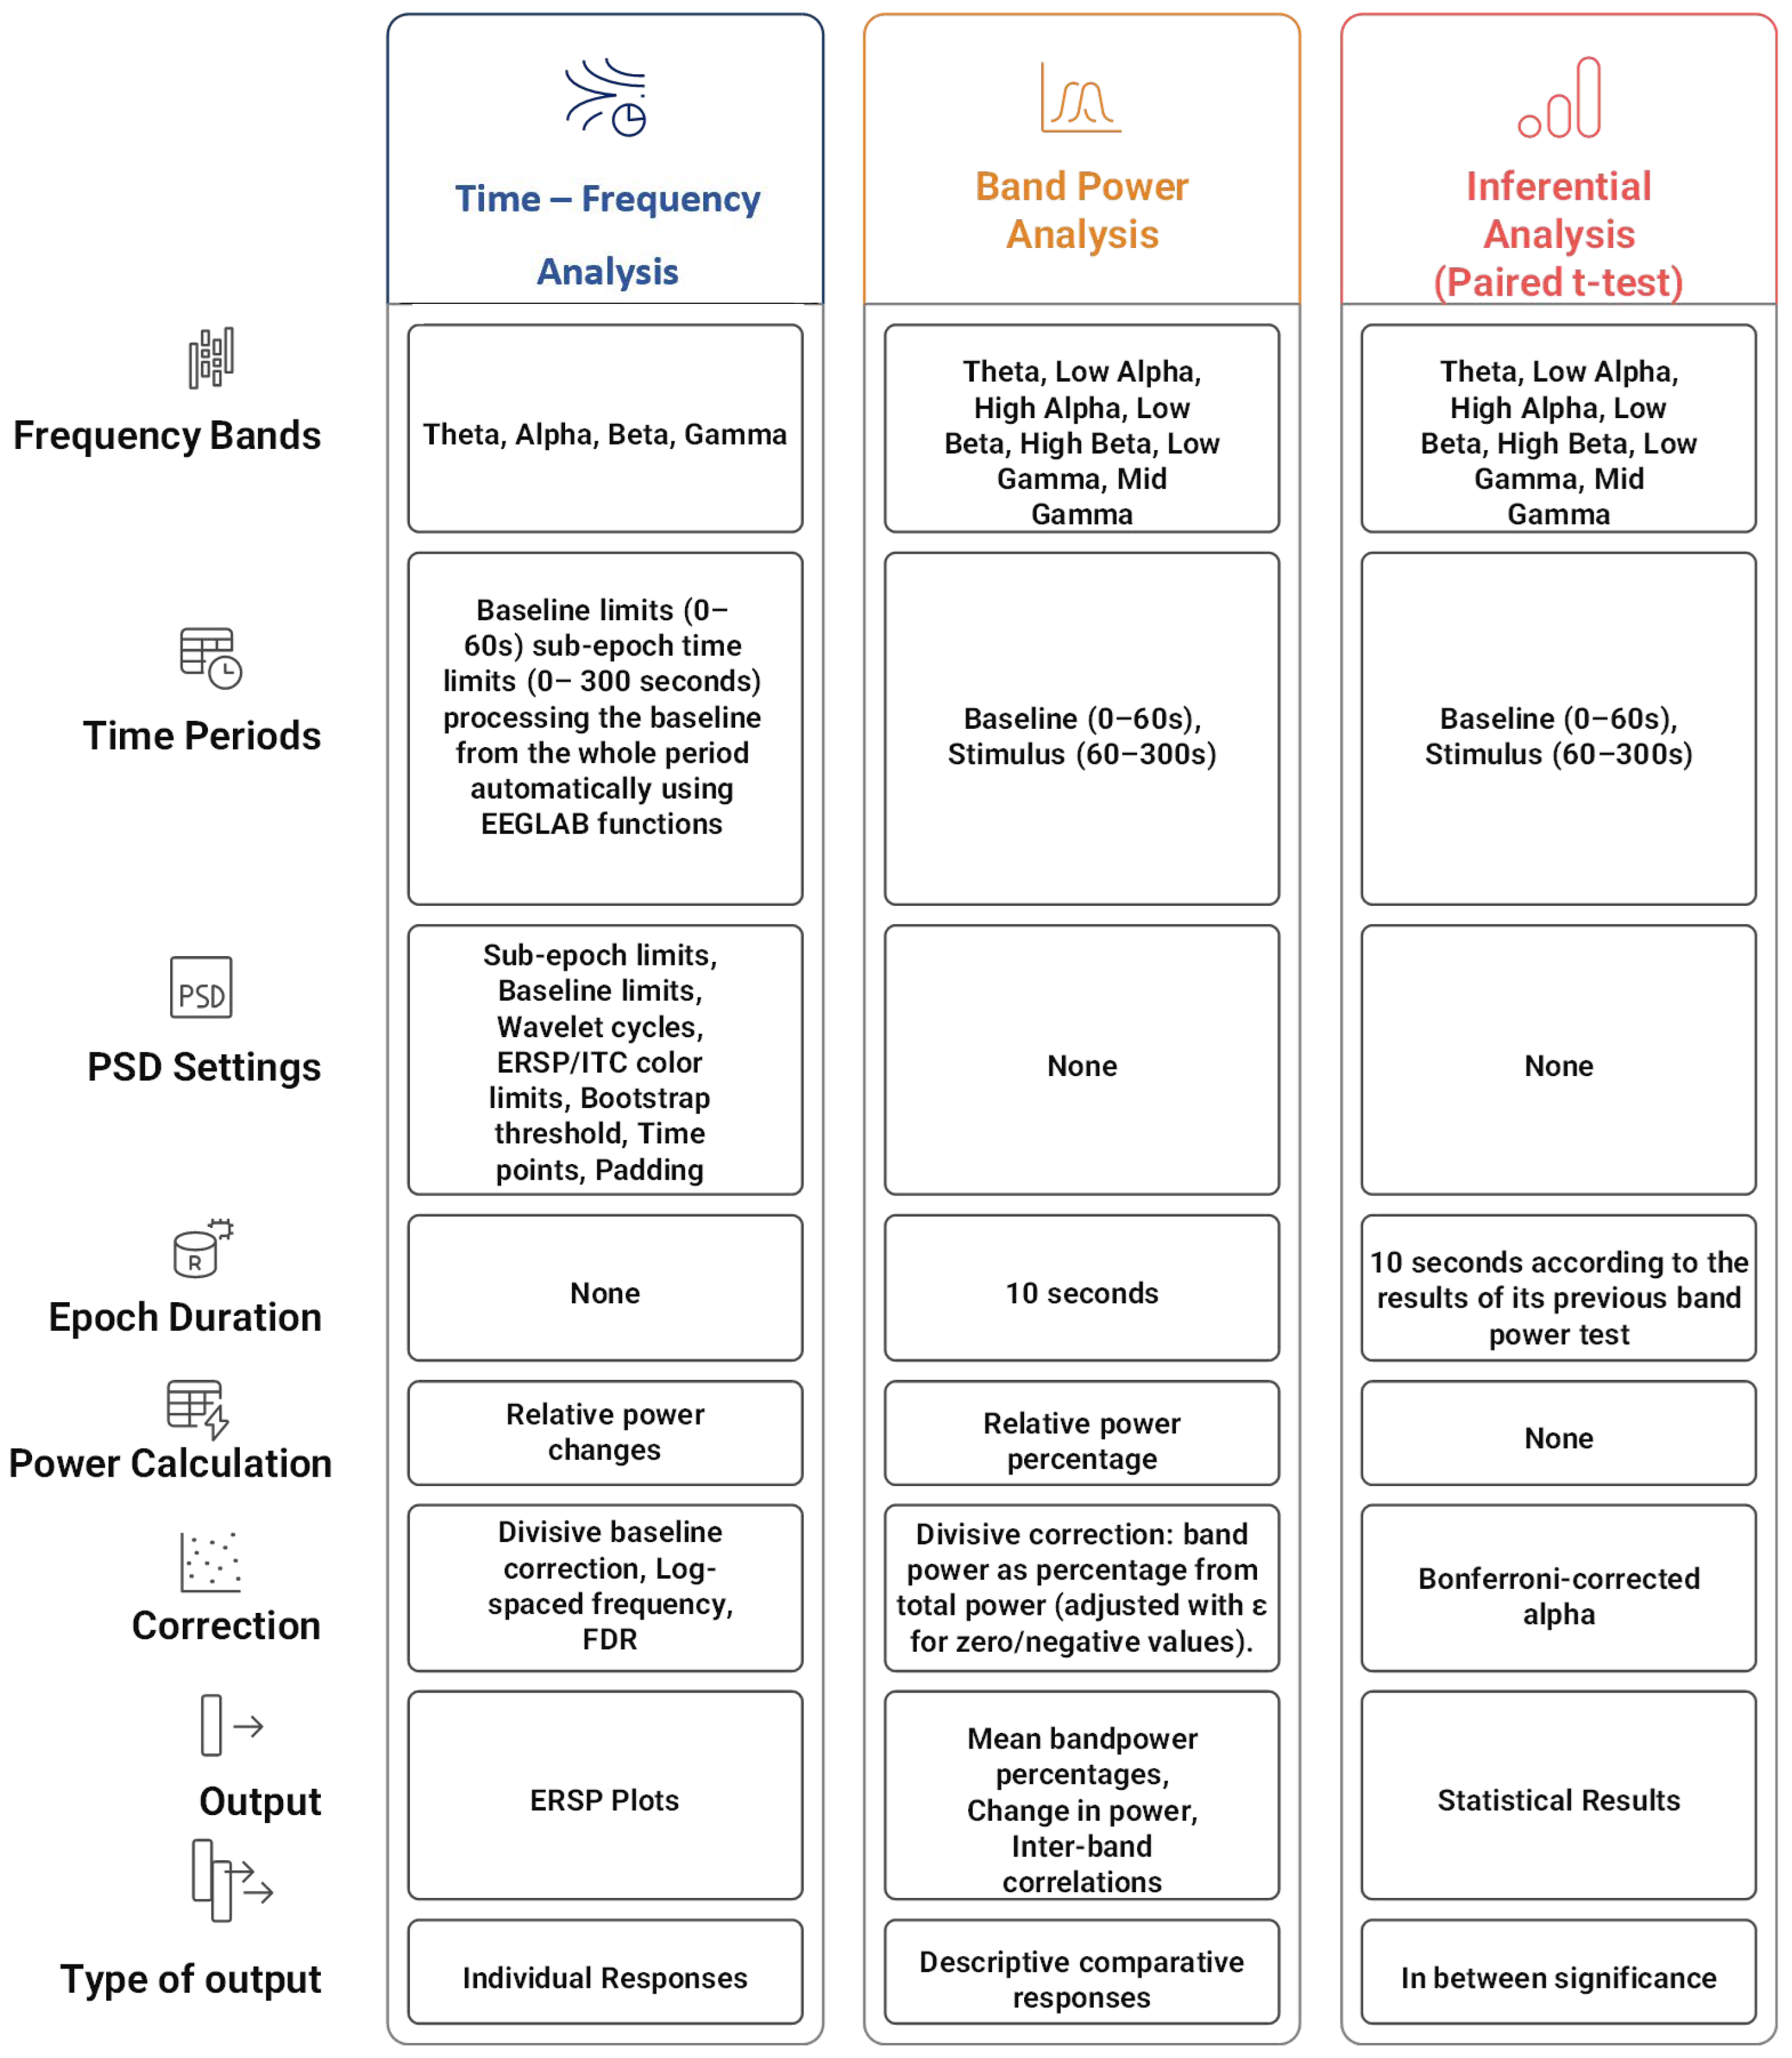
A psychophysiological approach was adopted to analyze EEG data, interpreting brainwave activity to assess psychological states. Neural activity to the courtyard environment was evaluated by three tandem analyses. The full analysis workflow began with raw EEG data being collected via NeuroSky MindWave Mobile 2, followed by preprocessing in EEGLAB to remove artifacts (e.g., noise from muscle movement), feature extraction using time–frequency and band power methods, and statistical comparison to identify significant changes. Firstly, a time–frequency analysis was conducted, leveraging EEGLAB in MATLAB (https://eeglab.ucsd.edu/, accessed on 20 March 2025). The power of each band was quantified using Power Spectral Density (PSD) over a 4 min stimulus interval. Individual variability was assessed using a 1 min baseline with eyes closed. This analysis produced Event-Related Spectral Perturbation (ERSP) graphs that visualize individual event-related changes in spectral power across time and frequency, identifying transient neural responses to the courtyard environment and how the mental state of each participant changed from the baseline state to the stimuli state.
Figure 4. Data analysis and data processing. Source: Authors.
Architecture 05 00076 g004
Secondly, a band power analysis utilizing Epoch-Based Power Distribution was conducted using MATLAB, aimed at quantifying the mean power within specific frequency bands to assess sustained changes in brain activity during the stimulus period.
This analysis computed mean band power percentages across seven frequency bands (theta, low alpha, high alpha, low beta, high beta, low gamma, and mid gamma) for the baseline (0–60 s) and stimulus (60–300 s) periods. Individual responses and inter-band correlations were visualized using the corr function with pairwise deletion, and changes were computed as the difference between means.
Thirdly, inferential analysis utilized paired t-tests to statistically validate band power differences, complementing the descriptive insights from ERSP and band power by confirming whether observed changes are unlikely due to chance. The paired t-test was justified based on its suitability for within-subject designs through analyzing repeated measures within the same participants, comparing baseline vs. stimulus conditions.
The paired t-test was performed with a Bonferroni-corrected significance threshold of α = 0.0071, reflecting correction for multiple comparisons across seven frequency bands. Typically, in a test like the paired t-test, a result is “significant” if the p-value is less than 0.05 (5% chance that it is random). However, when attempting many things at once (like a set of bands: Theta, Low Alpha, etc.), it might accidentally generate some “significant” results by chance. The Bonferroni correction adjusts this threshold to make it harder to call something significant, reducing those false positives. It does this by dividing the usual 0.05 by the number of tests (0.05 ÷ 7 = 0.0071). Thus, with α = 0.0071, a p-value would need to be less than 0.0071 to be significant, not just 0.05. This was implemented on the aggregated change scores (validChange = validStimulus − validBaseline) of the band power data, which provided statistical outcomes such as p-values, test decisions, t-statistics, and confidence intervals. Furthermore, prior to paired t-tests, Shapiro–Wilk tests confirmed that the band power change scores (stimulus − baseline) for all frequency bands were normally distributed. Given the small sample size (n = 16), non-parametric Wilcoxon signed-rank tests were also conducted as a robustness check; the results aligned with the t-test conclusion.

4.5.2. Data Processing

EEGLAB in MATLAB and its fundamental functions were used to process the EEG data from 16 subjects. Power Spectral Density (PSD) was used in the time–frequency analysis in EEGLAB, with parameters including sub-epoch time limits (0–300 s), frequency limits per band, baseline limits (0–60 s), wavelet cycles (3–0.8), ERSP color limits (20), ITC color limits (0.5), and a bootstrap significance threshold of 0.01. This encompassed 200 time points, with a padding of 1, as well as a divisive baseline correction to handle multiplicative noise, preserve relative signal changes, and stabilize variance when baseline fluctuations scale with signal magnitude. It also utilizes log-spaced frequency representation and applies False Discovery Rate (FDR) correction as necessary, with an initial emphasis on Theta, Alpha, Beta, and Gamma bands. Then, continuous EEG recordings were imported from Excel files via MATLAB, with detailed band power values (Theta: 4–8 Hz, LowAlpha: 8–10 Hz, HighAlpha: 10–12 Hz, LowBeta: 12–20 Hz, HighBeta: 20–25 Hz, LowGamma: 25–30 Hz, MidGamma: 30–40 Hz) adjusted to non-negative values to reduce erroneous readings. Also, the data were divided into 10 s epochs according to a sampling frequency calculated from inter-sample time intervals, with baseline epochs ranging from 0 to 60 s and stimulation epochs extending from 60 to 300 s. For each epoch, the relative power contribution of each band was computed as a percentage of the total power to standardize power across frequency bands, mitigating division-by-zero mistakes by assigning zero or negative values to a minimal threshold (ε). The mean band power was calculated over valid epochs for both periods, and the change in power was assessed as the difference.

5. Results and Discussion

5.1. Time–Frequency Analysis (ERSP)

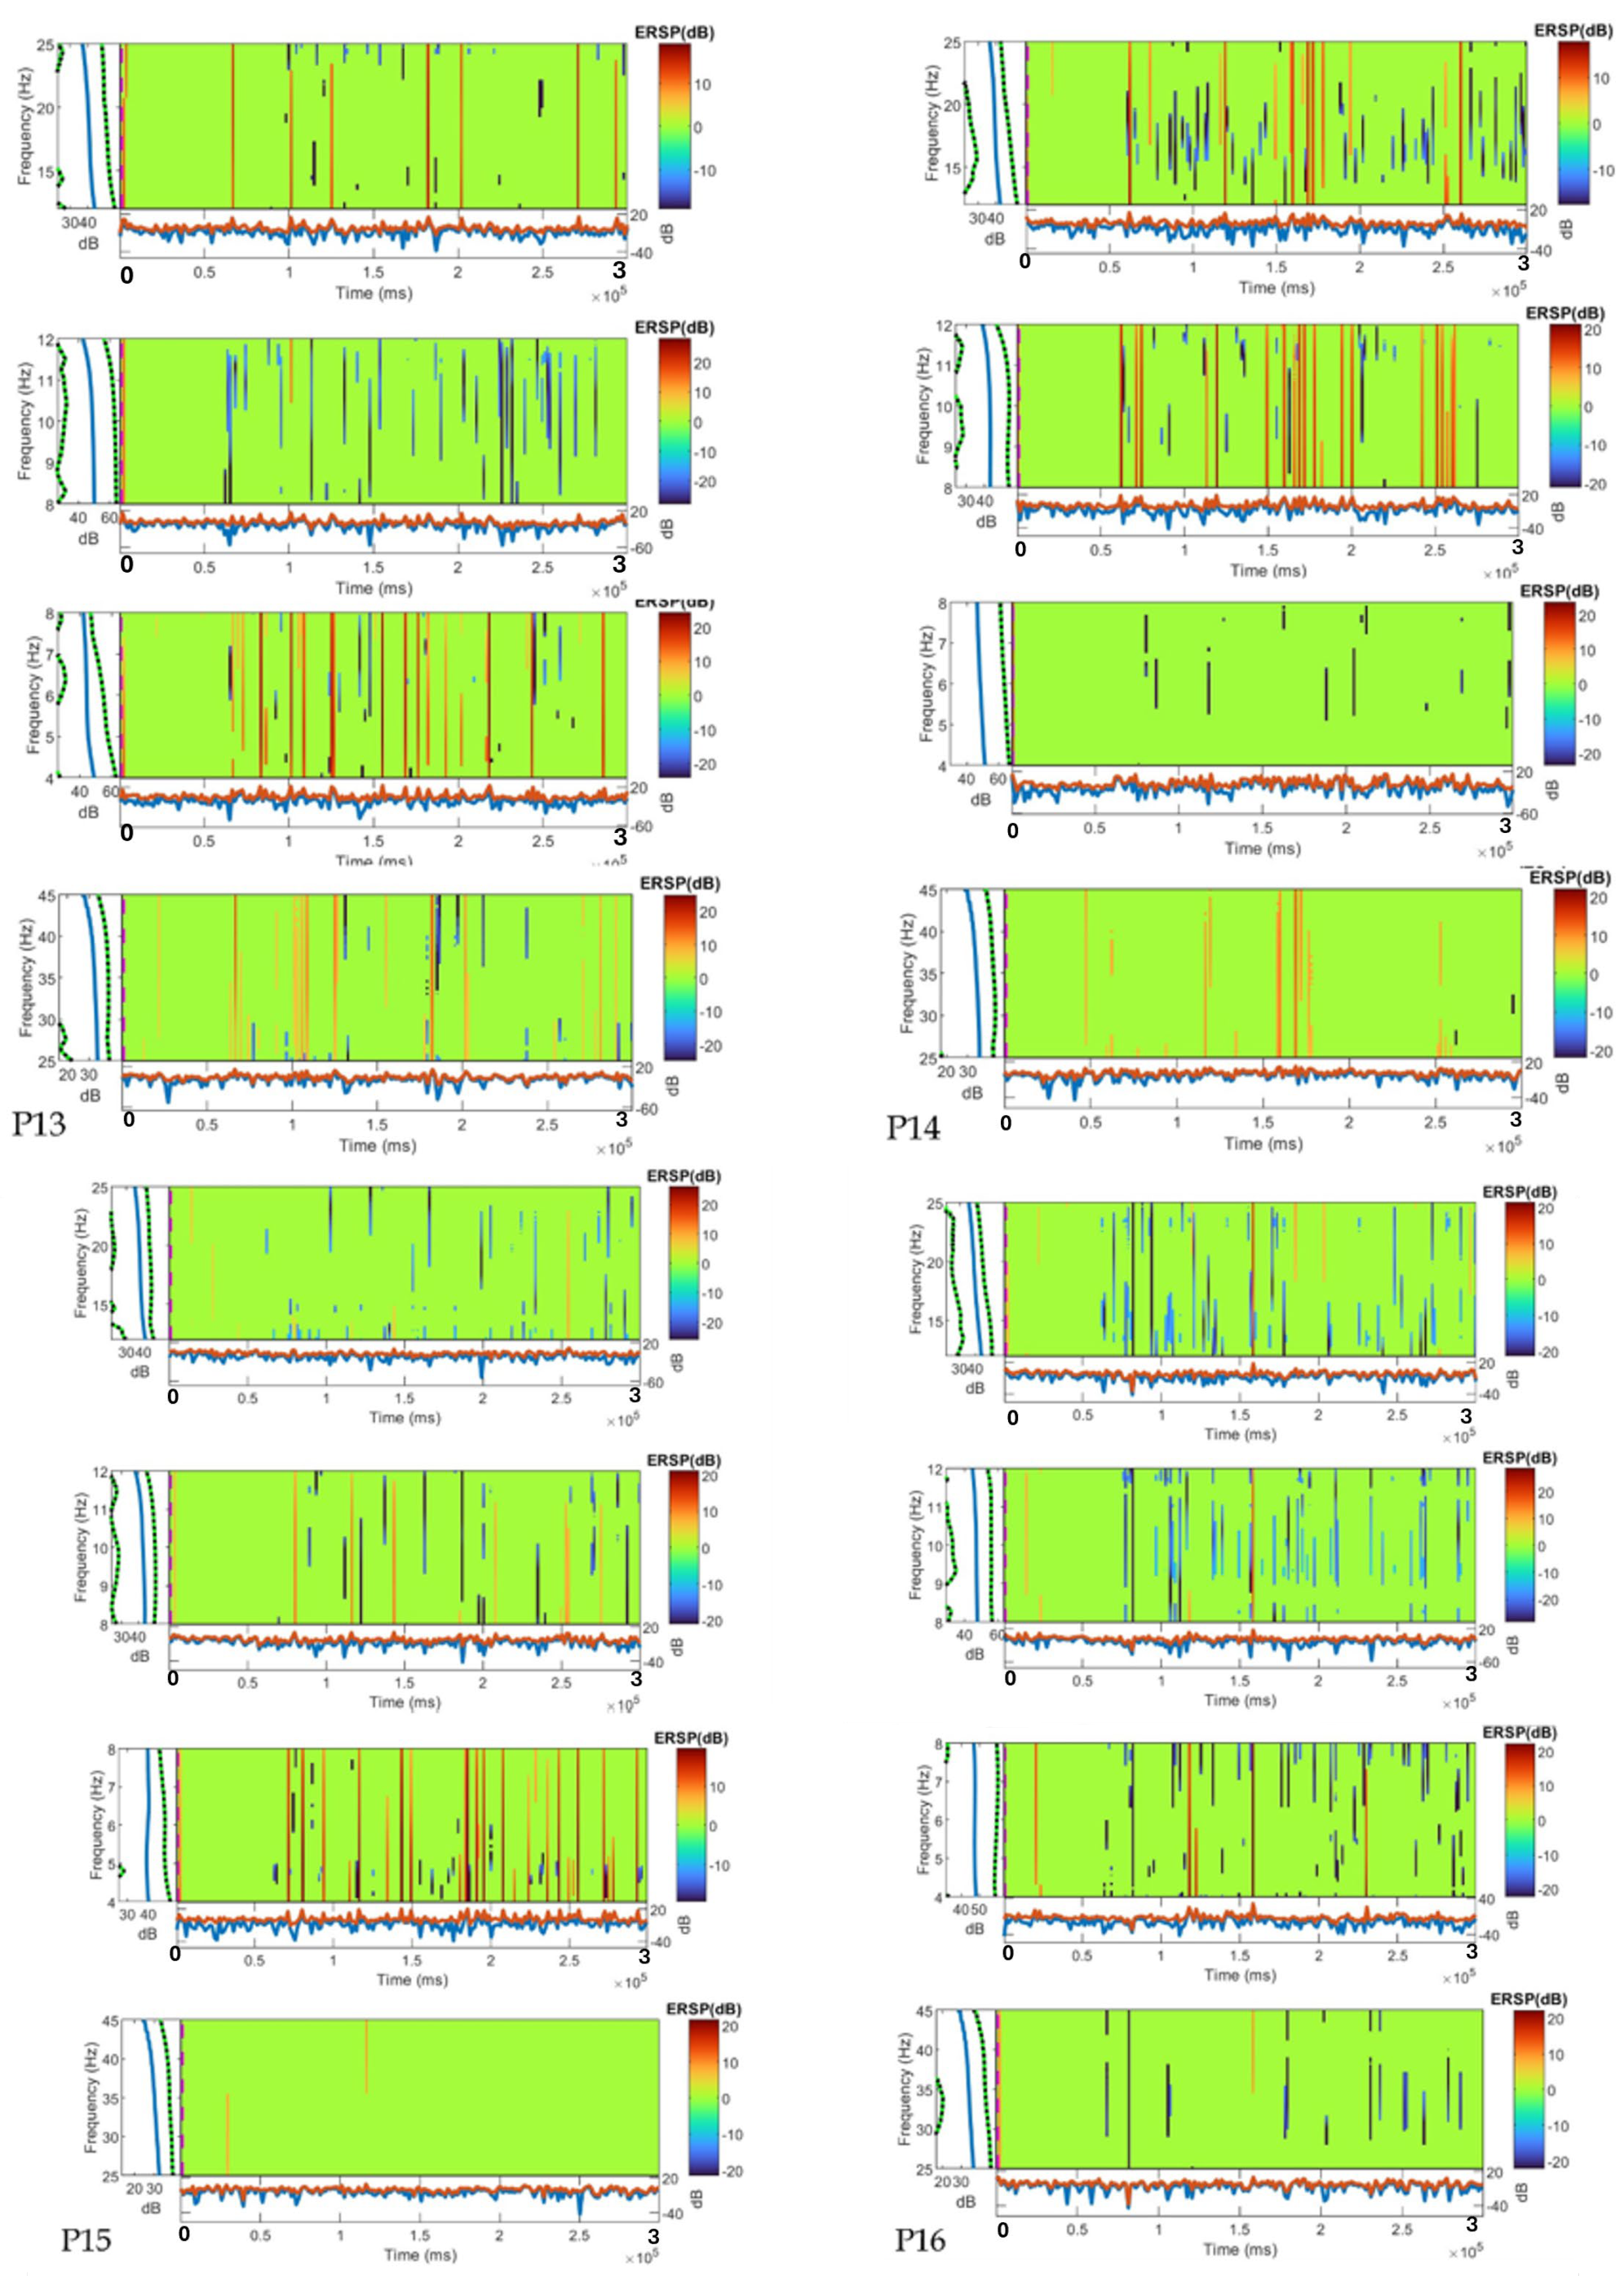
Time–frequency analysis was conducted on EEG data from 16 participants (P1–P9: female; P10–P16: male) to evaluate neural responses in the Theta, Alpha, and Beta frequency bands during a five-minute passive observation task in an enclosed courtyard. Event-Related Spectral Perturbation (ERSP) plots were generated to quantify spectral power changes, expressed in decibels (dB), relative to a pre-stimulus baseline, over a nominal time range of 0 to 3 units, where the time axis is scaled by a factor of 105 milliseconds. This scaling implies that the ERSP horizontal axis spans from 0 × 105 ms = 0 ms to 3 × 10⁵ ms = 300,000 ms, corresponding to a real-time duration of 0 to 5 min. In these plots, green regions (~0 dB) indicate baseline stability, red/orange areas (+10 to +20 dB) reflect increased neural activity, and blue areas (−10 to −20 dB) denote reduced activity, with extreme values reaching beyond these ranges. The dB scale provides a standardized measure of power variation relative to baseline, facilitating the interpretation of neural modulation patterns. The subsequent Figure 5 presents the band-specific ERSP findings for each participant.
Theta band (4–8 Hz)
Green dominates, indicating stable power (around 0 dB) for most participants. P2, P6, P5 (all female), and P14 (male) show occasional blue (−10 to −20 dB) decreases, suggesting disengagement, while P3 and P9 (both female) show sporadic red/yellow (+10 to +20 dB) increases, indicating enhanced relaxation. P16, P11, P15, P13 (all male), and P12 (male) exhibit frequent red/yellow colors, reflecting large increases in relaxation-related activity, with P8 (female) showing a mix of decreases and more pronounced increases.
Alpha Band (8–12 Hz)
The predominant green (0 dB) signifies stability in relevance to the baseline period. Random blue (−10 to −20 dB) color decreases for P1, P4, P7 (all female), and P10 (male), suggesting disengagement, while rare red/yellow colors (+10 to +20 dB) increase for P2, P5 (both female), P8 (female), and P11 (male), indicating mild alertness. Frequent red/yellow for P14 (male) shows increased engagement, with P16 (male) displaying constant red/yellow, reflecting a significant shift from baseline idleness.
Beta Band (12–25 Hz)
Green prevalence (0 dB) indicates stability relative to the baseline. P3, P6, P9 (all female), P12, and P15 (both male) show sporadic blue (−10 to −20 dB) decreases, suggesting reduced focus, while P1, P4, P7 (all female), P10, P13 (both male), and P16 (male) exhibit sporadic to intense red/yellow (+10 to +20 dB) increases, indicating attention peaks, with P16 showing the strongest and most frequent red/yellow, linked to heightened cognitive processing.
Gamma Band (25–45 Hz)
Green remains prevalent (0 dB), reflecting stability relative to the baseline. P4, P7 (both female), P10, P13 (both male), and P16 (male) show occasional red/yellow (+10 to +20 dB) increases, particularly at 20–25 Hz, suggesting cognitive engagement, while P16 has the most uniform and highest red/yellow color, indicating large power increases. P3, P6, P9 (all female), and P12 (male) have more frequent blue (−10 to −20 dB) decreases, with slight increases over time, and P15 (male) shows predominately green fields, maintaining a stable state.
Overall patterns and trends
Overall, the Event-Related Spectral Perturbation (ERSP) analysis revealed distinct neural modulation patterns across the Theta, Alpha, Beta, and Gamma bands during the five-minute observation period. In the Theta band, several participants exhibited moderate-to-pronounced increases in spectral power, suggesting enhanced relaxation and restorative processing, whereas others showed minimal change from baseline. Alpha band activity displayed mixed patterns, with some participants showing increased synchronization—indicative of calm attentional states—while others demonstrated reductions, potentially reflecting higher sensory engagement. Beta band responses varied, with localized power increases suggesting moments of focused attention and cognitive engagement, as well as decreases corresponding to reduced task-related processing. Gamma band changes were less consistent, with occasional bursts in high-frequency activity that may be linked to brief episodes of heightened perceptual or cognitive integration. These variations underline both the influence of courtyard design features on neural activity and individual differences in environmental perception.
For participants such as P1, where all bands show green, this stability relative to the baseline suggests that the participant maintained their initial neural state—potentially a neutral or undisturbed condition. As shown in Figure 6, these trends, illustrated with green (increases), gray (stable), and red (decreases), underscore neural response heterogeneity, potentially influenced by courtyard features or gender differences, warranting further investigation.
Furthermore, in Figure 7, a composite pie chart merges EEG power modulation across all frequency bands (Theta 4–8 Hz, Alpha 8–12 Hz, Beta 12–25 Hz, and Gamma 25–45 Hz) for the 16 participants (P1–P9: female; P10–P16: male; aged 18–24). An analysis of 64 band-specific observations revealed 37.5% increases (e.g., P16, P13 (both male), and P3 (female)), 26.6% decreases (e.g., P2, P6, and P5 (all female)), and 35.9% stability (e.g., P1, P4, and P8 (all female)), based on ERSP data comparing the first minute to the subsequent four minutes. This division, with green indicating increases (+10 to +20 dB), red denoting decreases (−10 to −20 dB), and gray signifying stability (0 dB relative to the baseline), reflects a balanced neural activation profile. P16’s (male) consistent increases suggest high reactivity, possibly influenced by the courtyard environment or gender-specific responses, while stable cases like P1 (female) across bands indicate preserving the baseline state, potentially reflecting an adaptive response to the courtyard. However, the psychological interpretation depends on the baseline condition, which requires further characterization, underscoring the need for multi-relational EEG analyses.
Lastly, a participant profile was developed from the EEG data analysis, summarizing individual power variations across the designated frequency bands (Table 5). Sensitivity levels were classified based on EEG response patterns—high sensitivity indicated frequent and pronounced fluctuations, moderate sensitivity reflected occasional but consistent changes, and low sensitivity denoted predominantly stable activity.

5.2. Band Power Descriptive Analysis

An epoch-by-epoch power distribution analysis was conducted to compare the relative proportions of EEG band power between two time periods—a 1 min baseline and a 4 min exposure to the stimulus. The analysis comprised the following four components: (1) mean band power comparison across the two experimental conditions; (2) assessment of the distribution of changes; (3) examination of individual response patterns; and (4) evaluation of band change correlations. The results of these analyses are presented in the following graphs.
  • Mean Band power Comparison (Figure 8): This bar chart compares the mean power (%) across different brain frequency bands (Theta, LowAlpha, HighAlpha, LowBeta, HighBeta, LowGamma, MidGamma) under two conditions—baseline (blue bars) and stimulus (orange bars). Theta and LowAlpha show the highest power, with stimulus slightly increasing power in Theta and decreasing it in LowAlpha and HighAlpha compared to baseline.
2.
Distribution of Changes (Figure 9): This box plot shows the distribution of percentage changes in power for each frequency band. The median changes are close to zero, with Theta and LowAlpha showing the widest distributions (both positive and negative outliers), while MidGamma has a narrower range and a slight positive shift.
3.
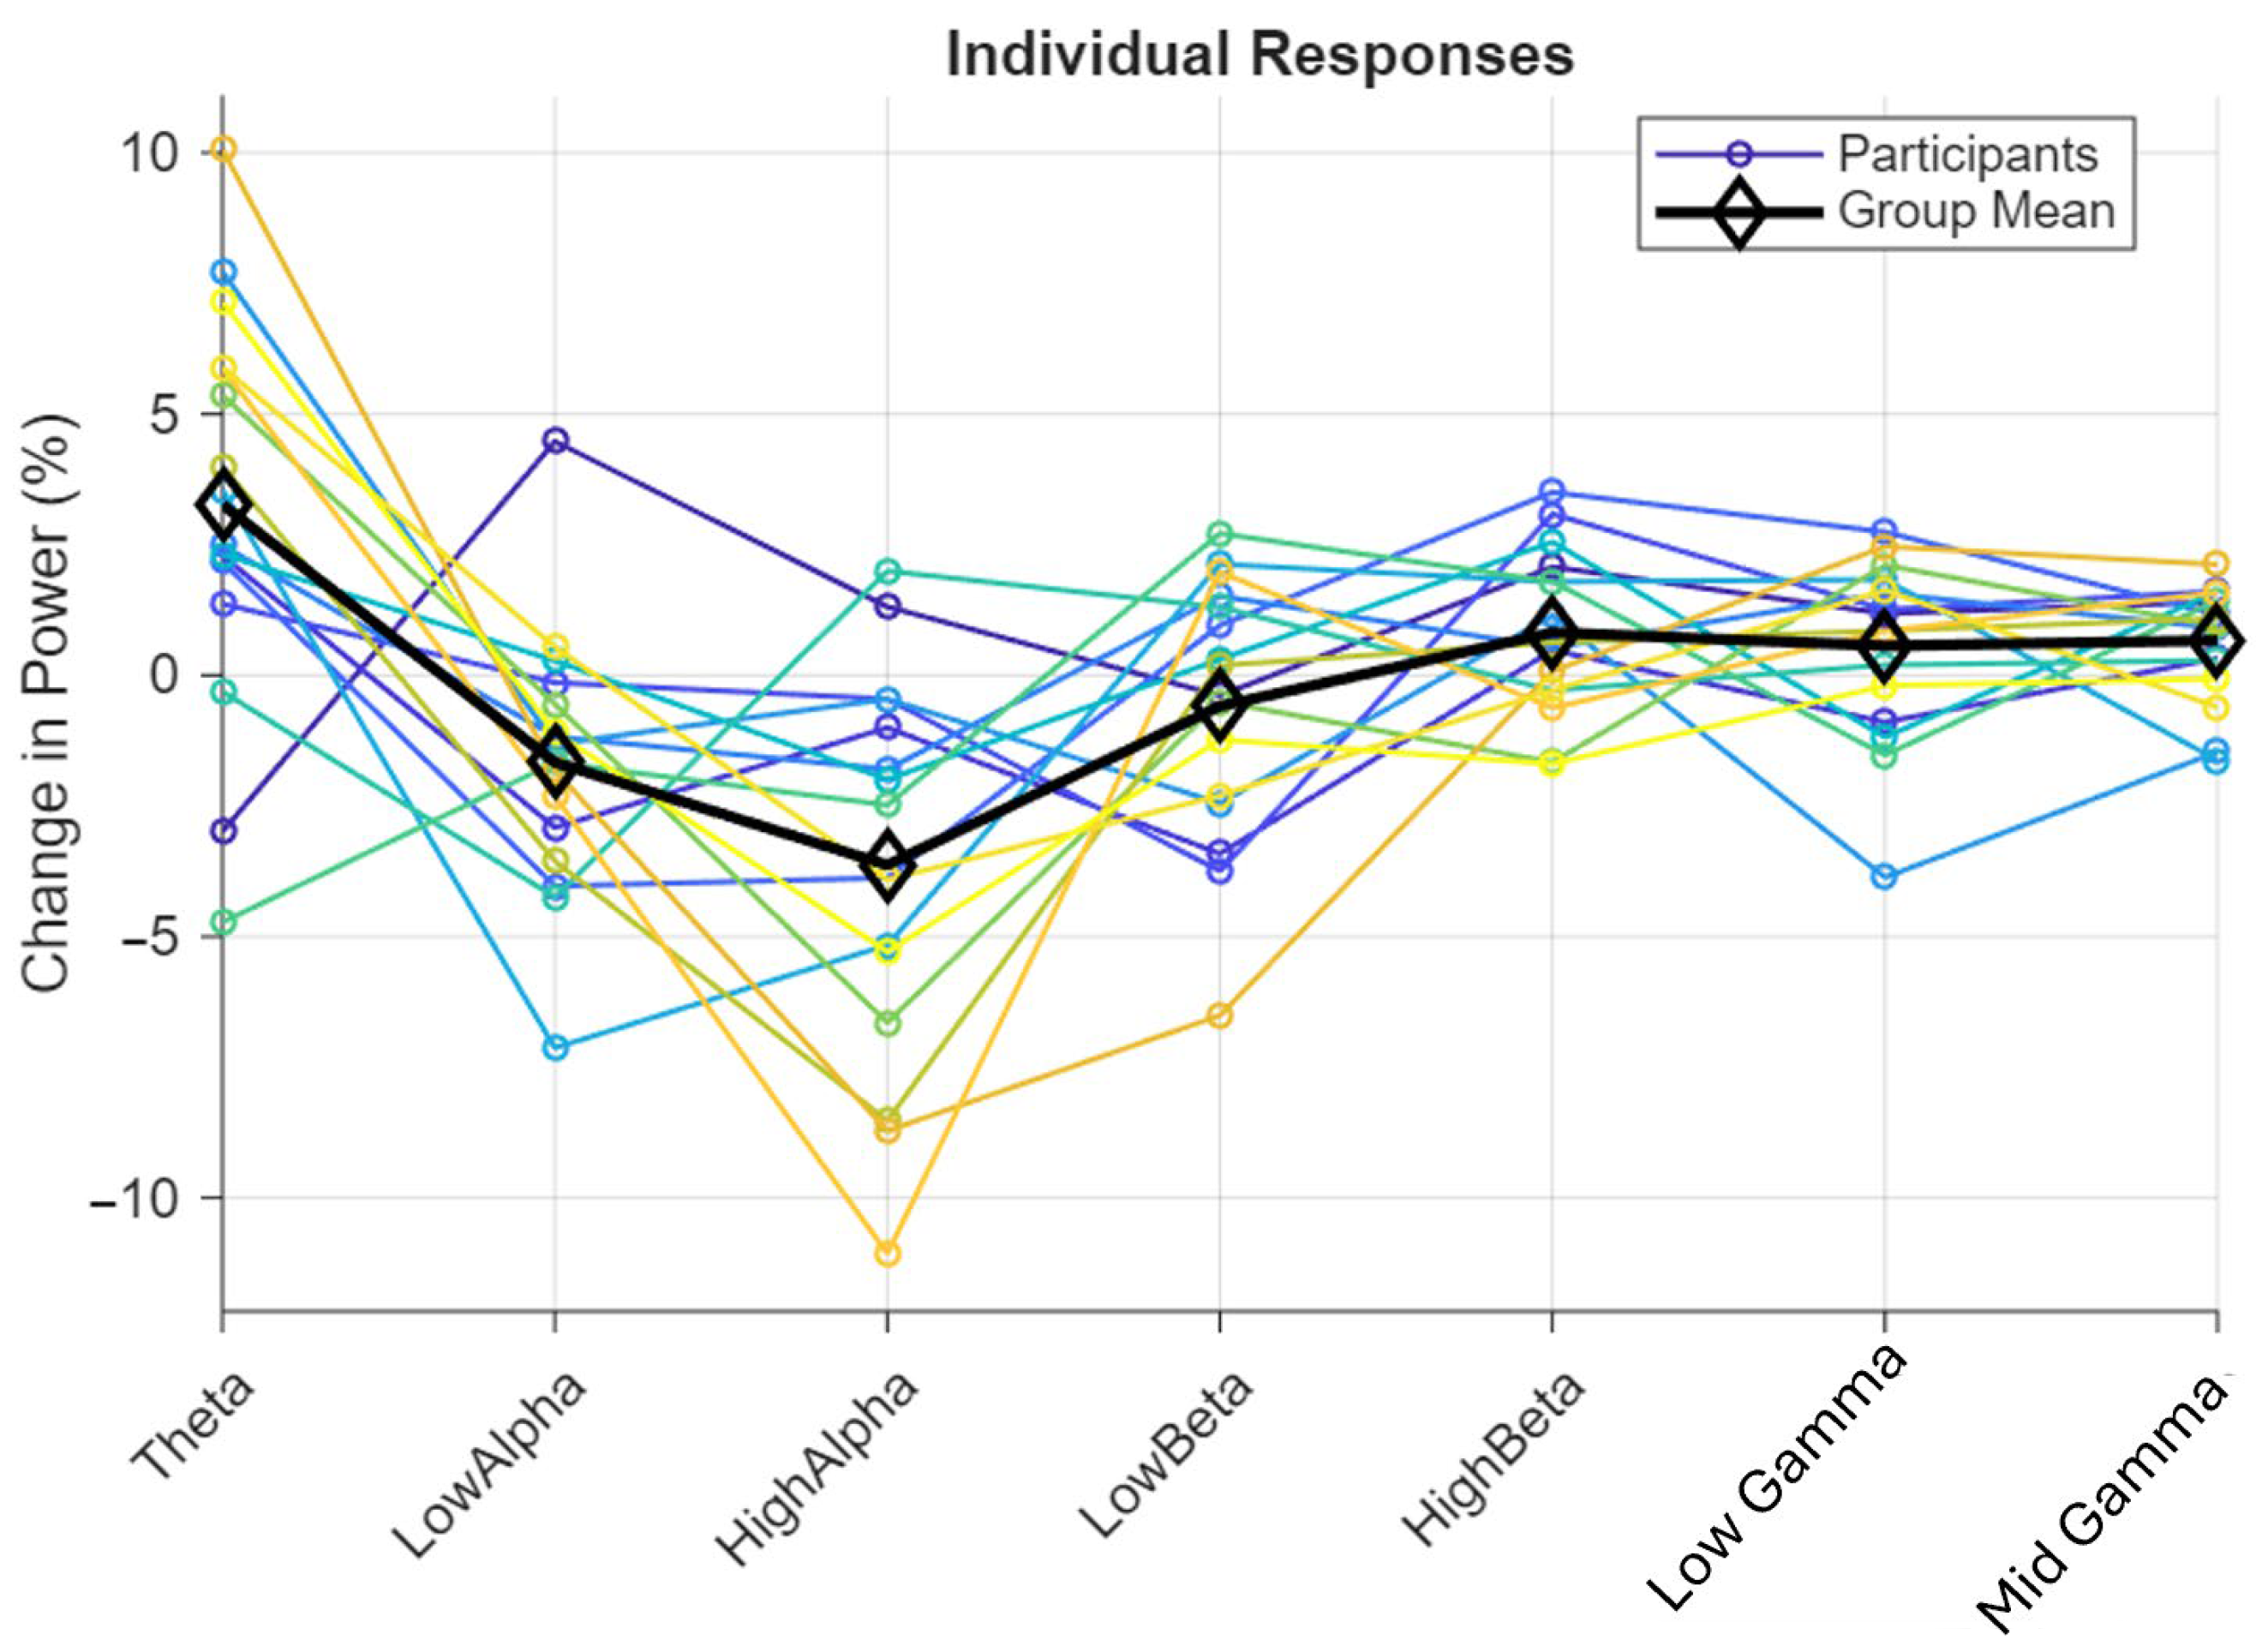
Individual Responses (Figure 10): This line graph displays the percentage change in power for each frequency band (Theta to MidGamma) across multiple individual responses (different colored lines). The changes vary widely, with some bands (e.g., HighAlpha) showing significant decreases, while others (e.g., LowGamma) show more stability.
4.
Band Change Correlations (Figure 11): The correlation matrix illustrates the pairwise relationships between stimulus-induced power changes across EEG frequency bands in the study cohort. In this visualization, red indicates positive correlations (0 to +1), signifying that power changes in paired bands co-vary in the same direction, while blue denotes negative correlations (−1 to 0), reflecting inverse relationships where power increases in one band associated with decreases in another. The dark-red diagonal confirms the expected perfect positive autocorrelations (r = +1) for each band. For example, dark-blue, where “LowAlpha” meets “Theta,” means that participants who showed increased Low Alpha waves during the stimulus also tended to show decreased Theta waves. The asterisks (*) mark correlations that are statistically significant (less than 5% likely to occur by chance).
For a deeper analysis, the results are presented numerically in the following table (Table 6). The mean relative power (%) is provided for each frequency band (Theta, Low Alpha, High Alpha, Low Beta, High Beta, Low Gamma, and Mid Gamma). The final row displays the mean power difference (Δ%) between the stimulus and baseline periods to ascertain whether neural activity patterns are either enhanced or suppressed during stimulation in comparison to rest.
Gamma↑ (↑0.56–0.67%) + High Beta ↑ (↑0.82%) Combination
The intricacies of the courtyard, such as the texture of the vegetation in an enclosed environment and natural sounds, were being processed through the eyes, as indicated by a slow increase in Gamma activity (0.56–0.67%). According to [16,44], the slow Gamma rise is indicative of a limited engagement that skips cognitive surplus, as indicated by a slight spike in high Beta activity (↑0.82%). That is, participants were actively engaging with the intricate details of the environment.
Eyes-Closed Baseline (High Alpha)
In the eyes-closed condition, subjects displayed high-amplitude Alpha waves, signifying coordinated activity in the visual cortex, aligning with a default resting state marked by limited visual processing. This baseline functioned as a reference for subsequent alterations following exposure to the courtyard.
Eyes-Opened Stimulus (Alpha Decrease)
Upon opening their eyes, there was an immediate desynchronization of Alpha waves, indicative of the visual cortex’s interaction with exterior stimuli. The extent of Alpha suppression was quantified at −3.63%. However, this result was presumably influenced by the physiological stimulation of visual processing and further cognitive involvement with the courtyard’s surroundings, encompassing diverse leaf patterns, tree canopies, and birds sounds; this could be due to the Alpha blockage effect [12].
Theta ↑ + Alpha ↓ Combination
The analysis revealed a significant increase in Theta activity (+3.27%) alongside the Alpha decrease. Typically, Theta remains stable when Alpha suppression results solely from eyes opening.
These paradoxical findings have two interpretations.
Theta rise measures passive restoration, and Alpha reduction measures mild cognitive activation and lower relaxation states, balancing with nature through the presence of courtyard stimuli (e.g., leaf rustles and wind sounds) [54]. It aligns with nature’s “soft fascination,” in which the natural features of the courtyard, like dense vegetation and quiet atmosphere in a bounded away place, had a low mental load despite active visual attention.
As such, according to [54,55], nature’s “Soft Fascination” concept reflects Attention Restoration Theory (ART). The realm of the courtyard captures attention readily without straining cognitive effort. The increase in Theta indicated that the landscape brought about a restoration state, reducing mental exhaustion and promoting relaxation while the participants were visually engaged with the prospect.
On the other hand, the decrease in Alpha power when opening the eyes is not obligatory but is a well-documented phenomenon under specific conditions. Research indicates that Alpha activity (8–12 Hz), which is associated with a resting state, typically diminishes with eyes-open compared to eyes-closed states due to increased visual input and attentional demand, which is known as alpha blocking, even if the scene was not natural or demanding visual engagement. However, this effect varies with context, e.g., in a highly relaxing or monotonous environment, Alpha may remain stable or increase slightly, especially if the task minimizes cognitive load.
To investigate if the findings yielded are because of nature’s soft fascination or the Alpha blocking effect, the authors adopted an approach in which they removed the initial 10 s epoch of the 4 min stimulus time from analysis. This modification was used to check if the eye-open effect during the first epoch might have caused any bias in the result for the whole stimulus period, in that it may have produced a dramatic drop in Alpha power, affecting the mean value. However, when the first epoch was removed, the results also maintained similar trends, thus showing that soft fascination and restorative attention, which comprise engagement without overstimulation, are the primary effects. The following table shows the results after the 10 s epoch was removed (Table 7).

5.3. Inferential Statistical Analysis

Inferential tests (paired t-tests with Bonferroni-corrected alpha = 0.0071) are utilized to assess changes between baseline (0–60 s) and stimulus (60–240 s) periods upon statistical analysis.
Paired t-test Results (Bonferroni-corrected α = 0.0071)
Theta: p = 0.0041, h = 1, t(15) = 3.3868, 95% CI = [0.2651, 6.2650]—significant increase, indicating a reliable shift toward relaxation.
LowAlpha: p = 0.0200, h = 0, t(15) = −2.6031, 95% CI = [−3.6581, 0.3257]—not significant, suggesting no reliable change.
HighAlpha: p = 0.0015, h = 1, t(15) = −3.8814, 95% CI = [−6.5399, −0.7197]—significant decrease, possibly reflecting a shift from resting to engaged states.
LowBeta: p = 0.3662, h = 0, t(15) = −0.9318, 95% CI = [−2.5640, 1.3823]—not significant, indicating stable activity.
HighBeta: p = 0.0538, h = 0, t(15) = 2.0927, 95% CI = [−0.3985, 2.0353]—not significant, though near threshold, suggesting possible mild engagement.
LowGamma: p = 0.2147, h = 0, t(15) = 1.2957, 95% CI = [−0.7899, 1.9169]—not significant.
MidGamma: p = 0.0303, h = 0, t(15) = 2.3924, 95% CI = [−0.2005, 1.5341]—close to significant (p = 0.0303), hinting at possible sensory engagement.
Only Theta and High Alpha alterations are still significant after Bonferroni correction, suggesting a strong neural modulation of relaxation (Theta increase) and shift away from resting states (high Alpha decrease) under the exposure to courtyards.
Psychological Implications
The significant Theta increase (+3.27%, p = 0.0041, below Bonferroni-corrected α = 0.0071) suggests enhanced restoration or mental withdrawal, supporting the courtyard’s role as a restorative space; this aligns with theta activity (4–8 Hz) being associated with meditative states and reduced cognitive load during passive tasks [56]. In contrast, the significant high Alpha decrease (−3.63%, p = 0.0015) indicates a shift toward increased alertness or engagement. Together, these findings highlight the courtyard’s dual influence, promoting relaxation while occasionally stimulating attention.

6. Multimodal EEG Analysis: Findings and Synthesis

The paired t-test and band power descriptive analysis are equivalent to signaling the same results of significant Theta increase and significant high Alpha reduction. Individual differences also indicate the same trends, as ERSP data show, for instance, P3 and P5 with significant Theta increases of +10 to +15 dB, as well as P1 and P7 with high Alpha reductions. This is a sharp contrast, in that Alpha power would have been expected to increase in passive, relaxed states—particularly under the courtyard setting designed to induce relaxation. As in this research, previous EEG studies have demonstrated that exposure to natural environments is linked to a variety of neurophysiological patterns that are associated with stress reduction. These patterns include an increase in Alpha [57,58,59,60,61,62] and Theta power [62], as well as a decrease in Beta activity [58]. However, in this endeavor, it is seen that Alpha shows significant decreases, reflecting soft fascination after the removal of the first epoch, which means a continued Alpha blocking effect across the 4 min of visual stimuli.
To grasp these psychological implications, the authors referred to a previous study [63] that was conducted to compare the effect of walking through urban green areas, urban quiet areas, and urban busy areas. The results also show a higher Alpha increase in urban busy areas, while Alpha decreased in urban quiet areas, which is unexpected. But the study triggers an insight suggesting that the familiarity of the busy urban setting (e.g., familiar shops and landmarks like bus stops) may have driven the increase in Alpha, as familiar environments are associated with higher Alpha power [64]. In contrast, the urban quiet setting, being less familiar (e.g., a less-visited street), may have induced fascination (a core ART component), engaged involuntary attention, and potentially suppressed Alpha activity. In accordance with this study, the inclusion criteria of students were primarily determined by their unfamiliarity with the courtyard, resulting in a gentle fascination effect rather than any other effect. This elucidates a future research scope regarding the potential impact of familiarity as a concept on the mental and emotional state of space users.
Additionally, prior research that has demonstrated an increase in Alpha has concentrated on the comparison between urban and natural environments. Nevertheless, this study addresses the presence of specific natural elements in an enclosed outdoor space within an urban environment. Consequently, the concept is more closely tied to the extent to which Alpha has increased or decreased. Additionally, the suppression of Alpha was less than 5%. This contrasts with urban environments, which typically exhibit Alpha suppression of over 5% [63]. Hence, the courtyard imparts a natural feeling despite its urban realm. Therefore, the role of Alpha (8–12 Hz) and mid Gamma (35–45) in our research, while not a predictor, demonstrates a suppressor effect, increasing the effect strength of Theta on the courtyard-dependent variable. This suggests that Alpha modulation in this setting is more of a response to external factors than a direct psychological state indicator, potentially confounding its use as a primary measure of relaxation or stress. Given this, Alpha’s decrease aligns with attentional shifts rather than a pure relaxation metric, making it valuable for assessing engagement or environmental interaction rather than sole relaxation.
Moreover, a previous study was conducted to investigate the correlation between EEG functional connectivity and exposure to nature, in which a restorative scenario (i.e., a wooded garden) was associated with a considerable increase in Theta connectivity, in contrast to a non-restorative scenario (i.e., a traffic island) [64]. This reflects the significant restorative impact of an enclosed space that incorporates natural sounds and features elements of landscapes, such as vegetation.
Finally, to translate the neurophysiological findings into actionable spatial guidelines, the following table (Table 8) synthesizes the observed EEG responses with specific courtyard design features, providing evidence-based recommendations for enhancing mental restoration and engagement in similar outdoor settings while considering the context-specific design.
This study adds something new to the emerging field of neurolandscape research by offering preliminary insights into the neurophysiological effects of courtyard design on mental health. As a pilot study, its goal was to find possible associations rather than draw conclusions that could be applied to other situations. Based on previous EEG studies in environmental psychology, the study’s sample size of 16 participants yielded a statistical power of about 60–70% to detect medium effect sizes (Cohen’s d = 0.5, α = 0.05, two-tailed paired t-test). This sample size and the single-site design, which was carried out at a particular Ain Shams University courtyard, restrict architectural variability and statistical robustness, which may limit the findings to this setting. Instead of representing typical courtyard reactions, observed EEG patterns like elevated Theta power and Alpha suppression might reflect the spatial and sensory characteristics of this environment.
The study supports the hypothesis that courtyard spatial configuration and visual stimuli like vegetation and spatial enclosure could affect cognitive and emotional states, and it does so while establishing a methodological framework for incorporating neurophysiological tools into architectural research. For future research on neurolandscapes in educational settings, this provides an evidence-based background. Though useful for field research, the use of a single-channel EEG device limits the depth of neurophysiological analysis by sacrificing spatial resolution and the capacity to identify activity across cortical regions. Furthermore, uncontrolled environmental factors may have introduced noise into the EEG data, even though efforts were made to minimize disturbances in a quieter, enclosed courtyard area. These factors include ambient noise, visual distractions from passersby, and fluctuating light conditions. Furthermore, generalizability may be further limited by the homogeneous sample of students from the same academic department who have comparable schedules, educational backgrounds, and stressors. To improve the findings’ applicability, future studies should investigate a variety of spatial contexts, configurations, dimensions, height-to-width ratios, and enclosure levels.

7. Conclusions

An analysis of EEG data from 16 participants revealed a significant Theta increase (+3.27%, p = 0.0041), reflecting enhanced internal relaxation, psychological restoration, fatigue recovery, and a gateway to learning through withdrawal from the external stressors (4–8 Hz, associated with sleep and daydreaming), as well as a high Alpha decrease (−3.63%, p = 0.0015), indicating fascination and sensory engagement (8–12 Hz, typically linked to alertness, calmness, and mental coordination), which is influenced by the courtyard’s spatial design. Individual differences (e.g., P3, P5 with more Theta, P1, P7 with less Alpha) suggest varying responses to courtyard shape, enclosure, and vegetation-to-hardscape ratio. Enclosed spaces with more vegetation possibly enhance Theta-based learning readiness and open spaces with more hardscape, possibly suppressing Alpha’s calming effect through more external focuses. Psychologically, these findings position courtyards as learning settings that support restoration and cognitive readiness via Theta, while the Alpha decrease signifies a shift towards engagement, to the advantage of a balanced learning setting. Nevertheless, it demonstrated that despite its use as an indicator of relaxation and restoration, Alpha often functions as a suppressor in the analysis model. This is because it reflects the internal emotion in response to external stimuli, which could reflect individual preferences, rather than being used for rule generalization, as demonstrated in [63,64]. This reverberates on the direct relationship between higher Alpha power and familiarity of space, even if the space is not having a healing or relaxing effect. This would imply that Alpha reflects the internal emotions regarding space, and it begins internally rather than interpreting the impact of space on the interior emotions.
Finally, this study advocates for enclosed spaces with balanced proportions (approximate 1:1 height-to-width ratio). Moderate vegetation coverage (around 35%) was associated with increased Theta activity, suggesting improved relaxation and cognitive restoration. Seating arrangements that placed students near greenery and away from distractions further supported these effects. Natural sensory elements, such as subtle sounds from leaves or wind, also contributed to a calming atmosphere. Additionally, positioning students in slightly unfamiliar parts of the courtyard appeared to stimulate gentle engagement and soft fascination. To enhance mental restoration in educational spaces, courtyard designs should prioritize enclosure, natural elements, varied planting, comfortable seating, and sensory richness—while avoiding overly open, noisy, or overly familiar layouts.
Future research should systematically investigate the neurophysiological responses to familiar versus unfamiliar spatial typologies to enhance the understanding of spatial familiarity as a cognitive and emotional variable. Employing a larger sample size would bolster statistical power and enable the exploration of optimal courtyard designs—such as enclosed versus open configurations with varying width-to-height proportions—to develop a regression model linking enclosure to restoration effects, thereby informing educational design optimization. To improve external validity, multi-site studies should be conducted, incorporating varied spatial configurations, vegetation densities, and enclosure levels. Additionally, including participants with diverse demographic and cognitive profiles (e.g., gender, age, neurodiversity, and differing environmental familiarity) would broaden the applicability of the findings.

Author Contributions

Conceptualization: R.A. and K.B.; methodology: R.A. and S.A.; software: R.A.; validation: S.E., S.A., and K.B.; formal analysis: R.A.; investigation: S.E.; resources: R.A.; data curation: R.A. and S.E.; writing—original draft preparation: R.A.; writing—review and editing: R.A. and K.B.; visualization: R.A.; supervision: S.E., S.A., and K.B.; project administration: not applicable; funding acquisition: not applicable. All authors have read and agreed to the published version of the manuscript.

Funding

This research received no external funding.

Institutional Review Board Statement

The study was conducted in accordance with the Declaration of Helsinki and approved by the Institutional Review Board of Ain Shams University (protocol code IRB-ASU-25-012 on 23 June 2025).

Informed Consent Statement

Informed consent was obtained from all subjects involved in the study.

Data Availability Statement

The datasets generated and analyzed during the current study are not publicly available due to privacy and ethical restrictions related to human EEG data, as per the approval of the Institutional Review Board/Faculty of Engineering, Ain Shams University (reference number ASUIRE-2023-45). However, anonymized summary statistics and graphical representations derived from the data are available from the corresponding author upon reasonable request, subject to institutional policies and ethical approval.

Acknowledgments

During the preparation of this manuscript, the author(s) used the EEGLAB plugin in MATLAB for band power data extraction and graphical presentation and MATLAB code for all other analyses. The authors have reviewed and edited the output and take full responsibility for the content of this publication.

Conflicts of Interest

The authors declare no conflicts of interest.

References

  1. Reinilä, E.; Kekäläinen, T.; Saajanaho, M.; Kokko, K. The structure of mental well-being and its relationship with generativity in middle adulthood and the beginning of late adulthood. Int. J. Behav. Dev. 2023, 47, 328–338. [Google Scholar] [CrossRef]
  2. Lin, E. Well-being. In Routledge Encyclopedia of Philosophy; Routledge: London, UK, 2022. [Google Scholar] [CrossRef]
  3. Rhee, J.H.; Schermer, B.; Cha, S.H. Effects of indoor vegetation density on human well-being for a healthy built environment. Dev. Built Environ. 2023, 14, 100172. [Google Scholar] [CrossRef]
  4. Baxter, L.; Burnell, K. What is wellbeing and how do we measure and evaluate it? In Archaeology, Heritage, and Wellbeing; Routledge: London, UK, 2022; pp. 7–25. [Google Scholar] [CrossRef]
  5. Jarden, A.; Roache, A. What Is Wellbeing? Int. J. Environ. Res. Public Health 2023, 20, 5006. [Google Scholar] [CrossRef]
  6. McCay, L.; Bremer, I.; Endale, T.; Jannati, M.; Yi, J. Urban Design and Mental Health; Springer: Singapore, 2017; pp. 1–24. [Google Scholar] [CrossRef]
  7. Ulrich, R.S. View Through a Window May Influence Recovery from Surgery. Science 1984, 224, 420–421. [Google Scholar] [CrossRef]
  8. Kaplan, S. The restorative benefits of nature: Toward an integrative framework. J. Environ. Psychol. 1995, 15, 169–182. [Google Scholar] [CrossRef]
  9. Closs, L.; Mahat, M.; Imms, W. Learning environments’ influence on students’ learning experience in an Australian Faculty of Business and Economics. Learn. Environ. Res. 2022, 25, 271–285. [Google Scholar] [CrossRef]
  10. Foellmer, J.; Kistemann, T.; Anthonj, C. Academic Greenspace and Well-Being—Can Campus Landscape be Therapeutic? Evidence from a German University. Wellbeing Space Soc. 2021, 2, 100003. [Google Scholar] [CrossRef]
  11. Ohly, H.; White, M.P.; Wheeler, B.W.; Bethel, A.; Ukoumunne, O.C.; Nikolaou, V.; Garside, R. Attention Restoration Theory: A systematic review of the attention restoration potential of exposure to natural environments. J. Toxicol. Environ. Health Part B 2016, 19, 305–343. [Google Scholar] [CrossRef]
  12. Valtchanov, D.; Ellard, C.G. Cognitive and affective responses to natural scenes: Effects of low-level visual properties on preference, cognitive load and eye-movements. J. Environ. Psychol. 2015, 43, 184–195. [Google Scholar] [CrossRef]
  13. Salameh, M.; Touqan, B.; Suliman, A. Enhancing student satisfaction and academic performance through school courtyard design: A quantitative analysis. Archit. Eng. Des. Manag. 2024, 20, 911–927. [Google Scholar] [CrossRef]
  14. Norman, J.F.; Carmichael, M.; Hagan, E.; Mishchuk, Y.; Bryant, E.N.; Ramirez, A.B.; Sutton, A. Visual outdoor space perception. Sci. Rep. 2025, 15, 11549. [Google Scholar] [CrossRef] [PubMed]
  15. Zheng, H.; Luo, M.; Wang, Y.; Wei, Y. Multi-Sensory Interaction and Spatial Perception in Urban Microgreen Spaces: A Focus on Vision, Auditory, and Olfaction. Sustainability 2024, 16, 8809. [Google Scholar] [CrossRef]
  16. Guo, W.; Wen, H.; Liu, X. Research on the psychologically restorative effects of campus common spaces from the perspective of health. Front. Public Health 2023, 11, 1131180. [Google Scholar] [CrossRef] [PubMed]
  17. Ibrahim, I.; Al Badri, N.; Mushtaha, E.; Omar, O. Evaluating the Impacts of Courtyards on Educational Buildings, Case Study in the University of Sharjah. Sustainability 2021, 14, 141. [Google Scholar] [CrossRef]
  18. Callaghan, A.; McCombe, G.; Harrold, A.; McMeel, C.; Mills, G.; Moore-Cherry, N.; Cullen, W. The impact of green spaces on mental health in urban settings: A scoping review. J. Ment. Health 2021, 30, 179–193. [Google Scholar] [CrossRef]
  19. Olszewska, A.A.; Marques, P.F.; Barbosa, F. Enhancing Urban Landscape with Neuroscience Tools: Lessons from the Human Brain. Citygreen 2015, 1, 60. [Google Scholar] [CrossRef]
  20. Olszewska-Guizzo, A.; Sia, A.; Fogel, A.; Ho, R. Features of urban green spaces associated with positive emotions, mindfulness and relaxation. Sci. Rep. 2022, 12, 20695. [Google Scholar] [CrossRef]
  21. Jeon, J.Y.; Jo, H.I.; Lee, K. Psycho-physiological restoration with audio-visual interactions through virtual reality simulations of soundscape and landscape experiences in urban, waterfront, and green environments. Sustain. Cities Soc. 2023, 99, 104929. [Google Scholar] [CrossRef]
  22. Wei, N.; Jiangxu, J.; Mimi, W.; Jin, S.; Gang, L. Research on the Impact of Panoramic Green View Index of Virtual Reality Environments on Individuals’ Pleasure Level Based on EEG Experiment. Landsc. Archit. Front. 2022, 10, 36–51. [Google Scholar] [CrossRef]
  23. Seiz, A.; Kweon, B.S.; Ellis, C.D.; Oh, H.; Pietro, K. Exploring the Psychophysiological Effects of Viewing Urban Nature through Virtual Reality Using Electroencephalography and Perceived Restorativeness Scale Measures. Sustainability 2023, 15, 13090. [Google Scholar] [CrossRef]
  24. Aghabozorgi, K.; van der Jagt, A.; Bell, S.; Smith, H. The role of university campus landscape characteristics in students’ mental health. Urban For. Urban Green. 2025, 111, 128863. [Google Scholar] [CrossRef]
  25. Garg, A.M. Open Spaces in a Institutional Campus Leads to Active Environment. Int. J. Sci. Res. Eng. Manag. 2024, 8, 1–5. [Google Scholar] [CrossRef]
  26. Stigsdotter, U.K.; Grahn, P. What Makes a Garden a Healing Garden? Available online: https://www.researchgate.net/publication/234072230 (accessed on 2 April 2025).
  27. Si, B.; binti Mohd Noor, A.I.; Wen, K. Linking University Campus Green Space and Students’ Mental Health and Well-Being: A Systematic Literature Review. Int. J. Acad. Res. Environ. Geogr. 2024, 10, 31–47. [Google Scholar] [CrossRef]
  28. Olszewska-Guizzo, A.; Fogel, A.; Escoffier, N.; Sia, A.; Nakazawa, K.; Kumagai, A.; Dan, I.; Ho, R. Therapeutic Garden With Contemplative Features Induces Desirable Changes in Mood and Brain Activity in Depressed Adults. Front. Psychiatry 2022, 13, 757056. [Google Scholar] [CrossRef]
  29. Krefis, A.; Augustin, M.; Schlünzen, K.; Oßenbrügge, J.; Augustin, J. How Does the Urban Environment Affect Health and Well-Being? A Systematic Review. Urban Sci. 2018, 2, 21. [Google Scholar] [CrossRef]
  30. Choi, H.S.; Bruyns, G.; Zhang, W.; Cheng, T.; Sharma, S. Spatial Cognition and Three-Dimensional Vertical Urban Design Guidelines—Cognitive Measurement and Modelling for Human Centre Design. Urban Sci. 2023, 7, 125. [Google Scholar] [CrossRef]
  31. Mariani Wigley, I.C.; Nazzari, S.; Pastore, M.; Provenzi, L.; Barello, S. The contribution of environmental sensitivity and connectedness to nature to mental health: Does nature view count? J. Environ. Psychol. 2025, 102, 102541. [Google Scholar] [CrossRef]
  32. Roe, J.; Aspinall, P. The restorative outcomes of forest school and conventional school in young people with good and poor behaviour. Urban For. Urban Green. 2011, 10, 205–212. [Google Scholar] [CrossRef]
  33. Gao, T.; Zhang, T.; Zhu, L.; Gao, Y.; Qiu, L. Exploring psychophysiological restoration and individual preference in the different environments based on virtual reality. Int. J. Environ. Res. Public Health 2019, 16, 3102. [Google Scholar] [CrossRef]
  34. Lau, S.S.Y.; Gou, Z.; Liu, Y. Healthy campus by open space design: Approaches and guidelines. Front. Archit. Res. 2014, 3, 452–467. [Google Scholar] [CrossRef]
  35. Peker, E.; Ataöv, A. Exploring the ways in which campus open space design influences students’ learning experiences. Landsc. Res. 2020, 45, 310–326. [Google Scholar] [CrossRef]
  36. Ribeiro, H.; de S. Santana, K.V.; Oliver, S.L. Natural Environments in University Campuses and Students’ Well-being. arXiv 2024. [Google Scholar] [CrossRef]
  37. Ellard, C. Neuroscience, Wellbeing, and Urban Design: Our Universal Attraction to Vitality. Psychol. Res. Urban Soc. 2020, 3, 6. [Google Scholar] [CrossRef]
  38. Russo, A. Urban Green Spaces and Healthy Living: A Landscape Architecture Perspective. Urban Sci. 2024, 8, 213. [Google Scholar] [CrossRef]
  39. Hughes, H.; Franz, J.; Willis, J. School Spaces for Student Wellbeing and Learning Insights from Research and Practice; Springer: Singapore, 2019. [Google Scholar]
  40. Juba, İ.; Bogenç, Ç. Impact of Courtyard Architecture on Personal Well-Being and Human Health. Türkiye Peyzaj Araştırmaları Derg. 2024, 7, 204–212. [Google Scholar] [CrossRef]
  41. Nie, X.; Wang, Y.; Zhang, C.; Zhao, Y.; Kirkwood, N. The varied restorative values of campus landscapes to students’ well-being: Evidence from a Chinese University. BMC Public Health 2024, 24, 487. [Google Scholar] [CrossRef]
  42. Wen, Q.; Zhou, Q.; Ye, H.; Guo, Q.; Shan, J.; Huang, Z. A Perceptual Assessment of the Physical Environment in Teaching Buildings and Its Influence on Students’ Mental Well-Being. Buildings 2024, 14, 1790. [Google Scholar] [CrossRef]
  43. Karimi, N.; Sajadzadeh, H.; Aram, F. Investigating the Association between Environmental Quality Characteristics and Mental Well-Being in Public Open Spaces. Urban Sci. 2022, 6, 20. [Google Scholar] [CrossRef]
  44. Cao, Y.; Huang, L. Research on the Healing Effect Evaluation of Campus’ Small-Scale Courtyard Based on the Method of Semantic Differential and the Perceived Restorative Scale. Sustainability 2023, 15, 8369. [Google Scholar] [CrossRef]
  45. Alnusairat, S.; Al-Shatnawi, Z.; Ayyad, Y.; Alwaked, A.; Abuanzeh, N. Rethinking Outdoor Courtyard Spaces on University Campuses to Enhance Health and Wellbeing: The Anti-Virus Built Environment. Sustainability 2022, 14, 5602. [Google Scholar] [CrossRef]
  46. Farid, M.; Mohamed, S.; Nasr, S.; Assistant, T. Keywords-Academic Open Spaces (AOS), Social Health, Physical Health, Mental Health. Available online: https://www.iol.co.za/ (accessed on 20 May 2025).
  47. Faul, F.; Erdfelder, E.; Lang, A.-G.; Buchner, A. G*Power 3: A flexible statistical power analysis program for the social, behavioral, and biomedical sciences. Behav. Res. Methods 2007, 39, 175–191. [Google Scholar] [CrossRef]
  48. Chen, Z.; He, Y.; Yu, Y. Attention restoration during environmental exposure via alpha-theta oscillations and synchronization. J. Environ. Psychol. 2020, 68, 101406. [Google Scholar] [CrossRef]
  49. Chang, S.; Jun, H. Hybrid deep-learning model to recognise emotional responses of users towards architectural design alternatives. J. Asian Archit. Build. Eng. 2019, 18, 381–391. [Google Scholar] [CrossRef]
  50. Wu, J.; Zhong, Y.; Wang, Y.; Gong, C. Investigating the Relation between Visitor Attention and Visual Quality of Forest Landscape: A Mobile EEG Study. Forests 2022, 13, 1668. [Google Scholar] [CrossRef]
  51. Zhang, Z.; Zhuo, K.; Wei, W.; Li, F.; Yin, J.; Xu, L. Emotional responses to the visual patterns of urban streets: Evidence from physiological and subjective indicators. Int. J. Environ. Res. Public Health 2021, 18, 9677. [Google Scholar] [CrossRef]
  52. Li, Z.; Kang, J. Sensitivity analysis of changes in human physiological indicators observed in soundscapes. Landsc. Urban Plan. 2019, 190, 103593. [Google Scholar] [CrossRef]
  53. Song, R.; Chen, Q.; Zhang, Y.; Jia, Q.; He, H.; Gao, T.; Qiu, L. Psychophysiological restorative potential in cancer patients by virtual reality (VR)-based perception of natural environment. Front. Psychol. 2022, 13, 1003497. [Google Scholar] [CrossRef]
  54. Ren, H.; Zheng, Z.; Zhang, J.; Wang, Q.; Wang, Y. Electroencephalography (EEG)-Based Comfort Evaluation of Free-Form and Regular-Form Landscapes in Virtual Reality. Appl. Sci. 2024, 14, 933. [Google Scholar] [CrossRef]
  55. Guo, L.N.; Zhao, R.L.; Ren, A.H.; Niu, L.X.; Zhang, Y.L. Stress recovery of campus street trees as visual stimuli on graduate students in autumn. Int. J. Environ. Res. Public Health 2020, 17, 148. [Google Scholar] [CrossRef]
  56. Nota, A.; Tecco, S.; Ehsani, S.; Padulo, J.; Baldini, A. Postural stability in subjects with temporomandibular disorders and healthy controls: A comparative assessment. J. Electromyogr. Kinesiol. 2017, 37, 21–24. [Google Scholar] [CrossRef]
  57. Olszewska-Guizzo, A. Neuroscience for Designing Green Spaces; Routledge: New York, NY, USA, 2023. [Google Scholar] [CrossRef]
  58. Stevenson, M.P.; Dewhurst, R.; Schilhab, T.; Bentsen, P. Cognitive Restoration in Children Following Exposure to Nature: Evidence From the Attention Network Task and Mobile Eye Tracking. Front. Psychol. 2019, 10, 42. [Google Scholar] [CrossRef] [PubMed]
  59. Chang, C.-Y.; Hammitt, W.E.; Chen, P.-K.; Machnik, L.; Su, W.-C. Psychophysiological responses and restorative values of natural environments in Taiwan. Landsc. Urban Plan 2008, 85, 79–84. [Google Scholar] [CrossRef]
  60. Ulrich, R.S. Natural Versus Urban Scenes. Environ. Behav. 1981, 13, 523–556. [Google Scholar] [CrossRef]
  61. Grassini, S.; Revonsuo, A.; Castellotti, S.; Petrizzo, I.; Benedetti, V.; Koivisto, M. Processing of natural scenery is associated with lower attentional and cognitive load compared with urban ones. J. Environ. Psychol. 2019, 62, 1–11. [Google Scholar] [CrossRef]
  62. Koivisto, M.; Jalava, E.; Kuusisto, L.; Railo, H.; Grassini, S. Top-Down Processing and Nature Connectedness Predict Psychological and Physiological Effects of Nature. Environ. Behav. 2022, 54, 917–945. [Google Scholar] [CrossRef]
  63. Neale, C.; Aspinall, P.; Roe, J.; Tilley, S.; Mavros, P.; Cinderby, S.; Coyne, R.; Thin, N.; Ward Thompson, C. The impact of walking in different urban environments on brain activity in older people. Cities Health 2020, 4, 94–106. [Google Scholar] [CrossRef]
  64. Brielmann, A.A.; Buras, N.H.; Salingaros, N.A.; Taylor, R.P. What Happens in Your Brain When You Walk Down the Street? Implications of Architectural Proportions, Biophilia, and Fractal Geometry for Urban Science. Urban Sci. 2022, 6, 3. [Google Scholar] [CrossRef]
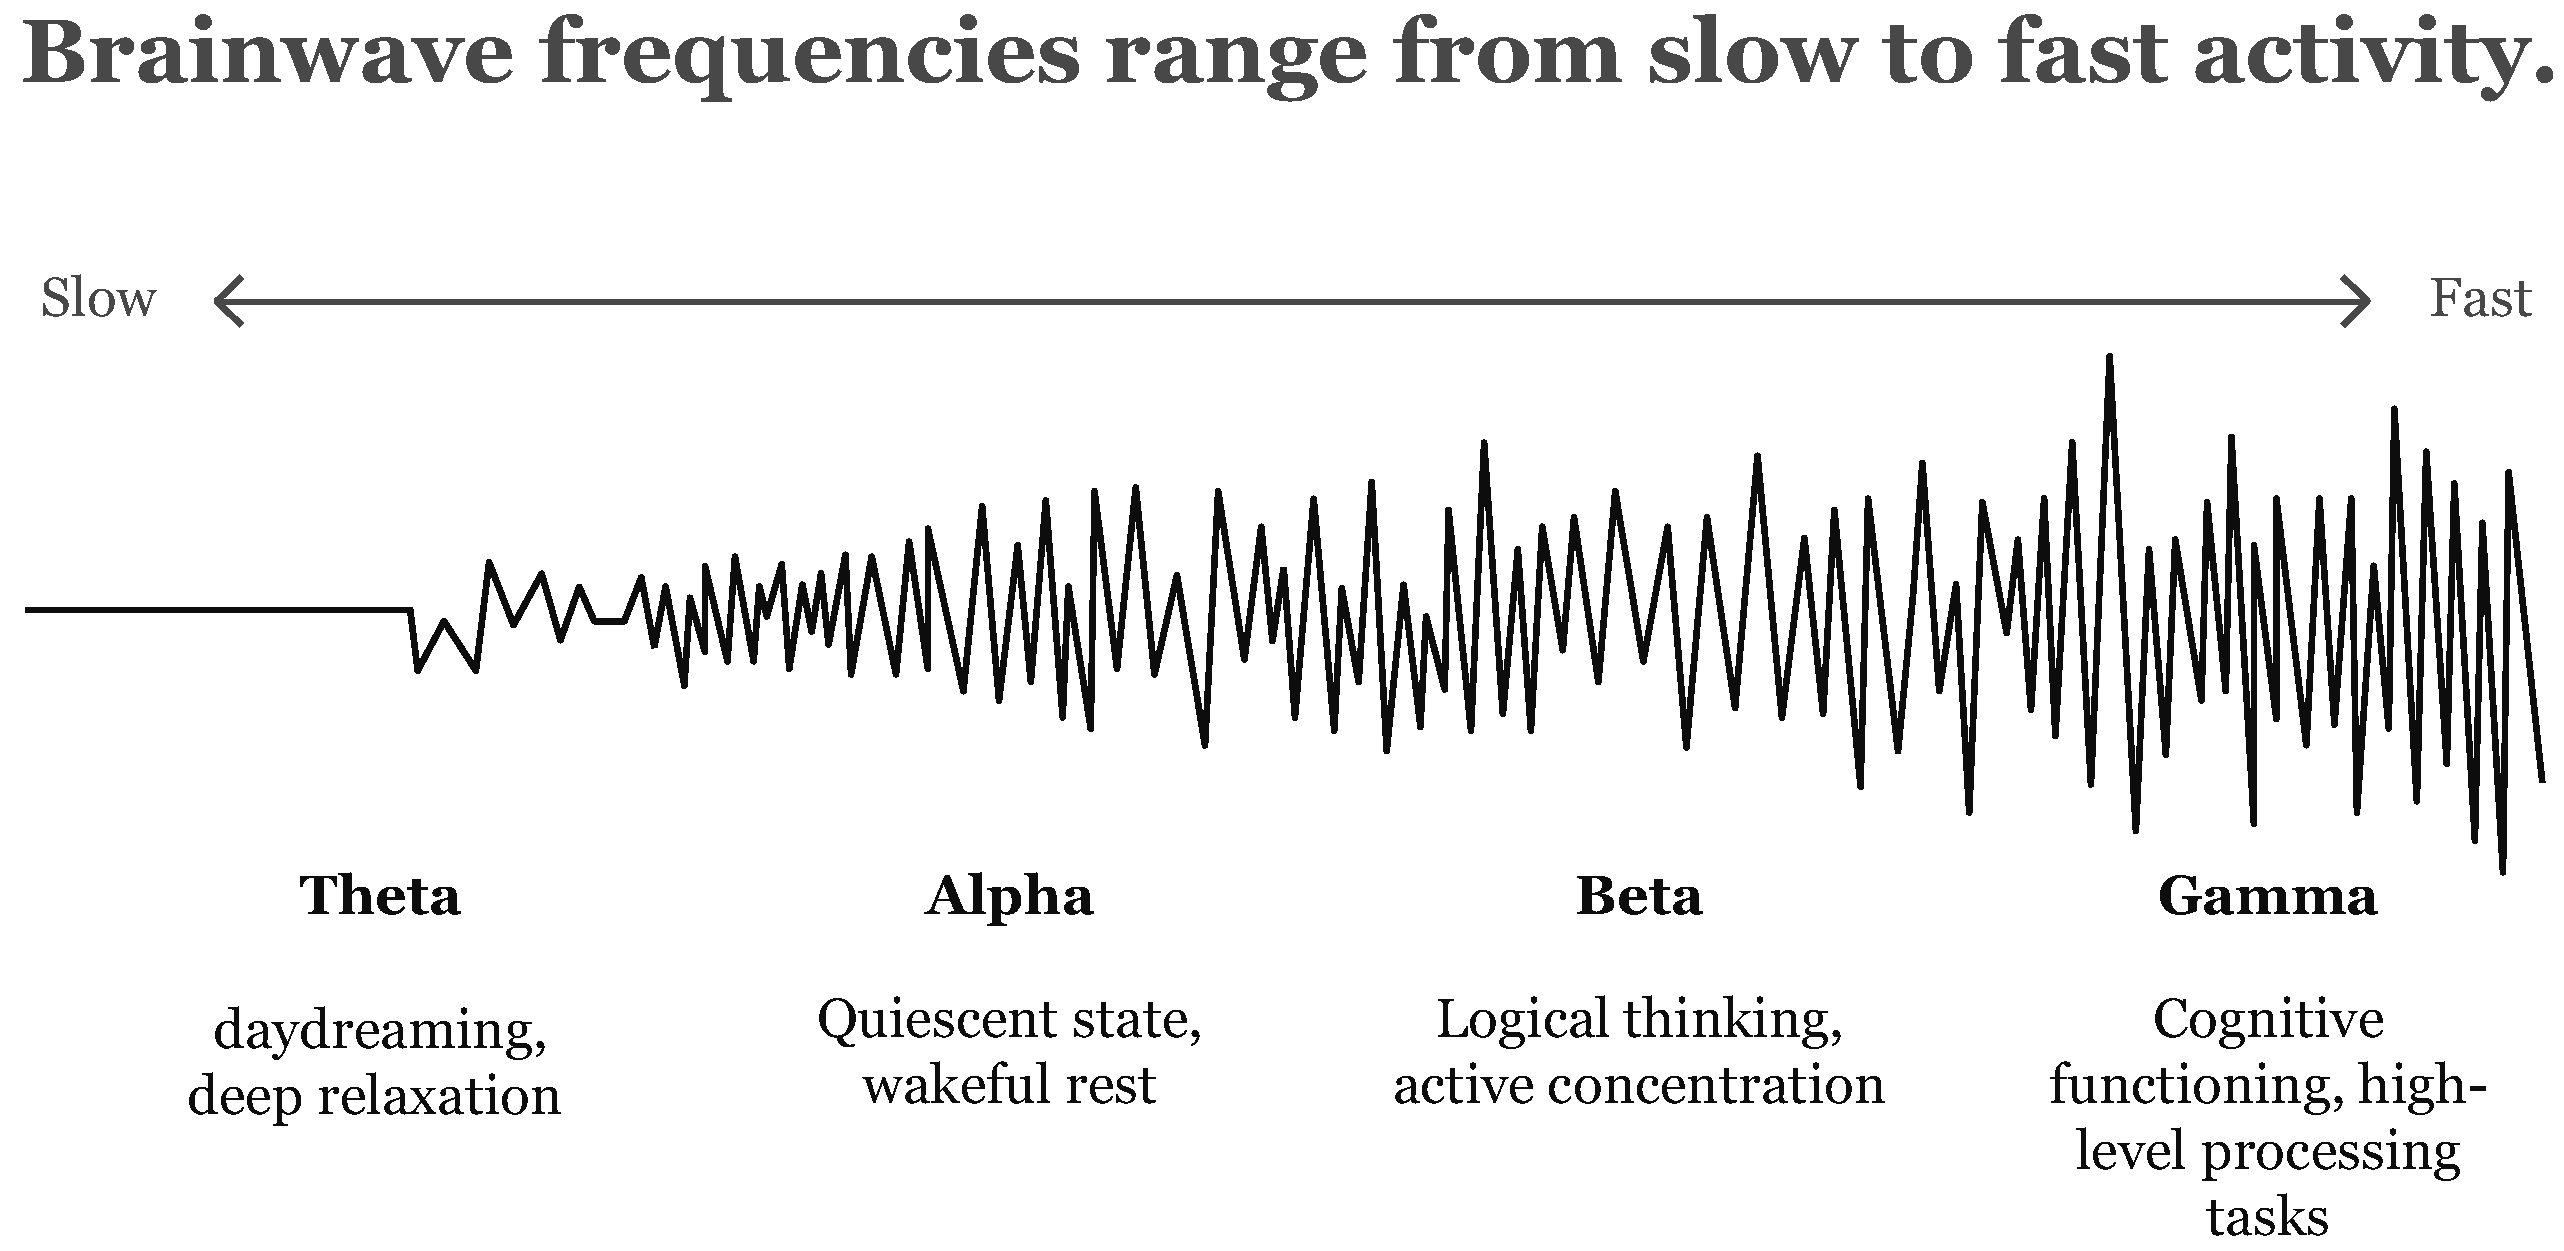
Figure 2. Brainwave frequencies. Source: Authors.
Architecture 05 00076 g002
Figure 5. Band power analyses of 16 participants. Source: Authors, using EEGLAB in MATLAB.
Architecture 05 00076 g005aArchitecture 05 00076 g005bArchitecture 05 00076 g005cArchitecture 05 00076 g005d
Figure 6. Event-Related Spectral Perturbation (ERSP) analysis of EEG responses across all bands for 16 participants (P1–P9: female; P10–P16: male) after baseline correction. Source: Authors.
Architecture 05 00076 g006
Figure 7. Composite pie chart of EEG power modulation across all bands for 16 participants after baseline correction. Source: Authors.
Architecture 05 00076 g007
Figure 8. Mean band power analysis. Source: Authors.
Architecture 05 00076 g008
Figure 9. Distribution of changes. Source: Authors.
Architecture 05 00076 g009
Figure 10. Individual responses. Source: Authors.
Architecture 05 00076 g010
Figure 11. Band change correlations. Source: Authors.
Architecture 05 00076 g011
Table 1. Different forms of educational outdoor spaces and mental well-being.
Spatial FormDescriptionPsychological Effect
PlazaCentral plaza for gatherings and eventsFosters social interaction and reduces stress
CourtyardsSpaces surrounded by buildings that could include greenery and seatingEncourages relaxation and restoration; enhances collaboration
Pedestrian promenadesPathways connecting campus areasPromotes mental relaxation and focus
Main building quadrangleSquare spaces surrounded by academic buildingsEnhances community; fosters informal learning
AmphitheatreVenue for cultural eventsBoosts creativity and mental rejuvenation
Lawns and gardensGreen spacesProvides mental relaxation; enhances creativity
Tree-lined pathwaysShaded paths for leisureEncourages peaceful reflection
Source: [34,35,36].
Table 2. Spatial configurations of courtyards and their psychological effects.
Aspect of ConfigurationDescriptionPsychological EffectBrainwave Band Associated
Degree of enclosureHigh enclosure (elevated walls) provides shade and cooler environments.Mental restoration and relaxationAlpha and Theta
Open layouts increase natural illumination.Improved visual attractiveness; reduced stressAlpha, Beta, and Gamma
ShapeRectangular/square courtyards optimize shade and comfort.Mental restoration; reduced anxietyTheta and Beta
U-shaped courtyards (east–west orientation) improve ventilation.Enhanced comfort and relaxationAlpha
Curvilinear shapes promote natural movement and openness.Increased happiness; reduced tensionGamma, Beta, and Alpha
DimensionsExpansive courtyards enhance natural light.Improved mood; reduced fatigueAlpha, Beta, and Theta
Small courtyards near study areas offer quick access to tranquility.Better concentration and relaxationAlpha
Source: [10,24,38,46].
Table 3. Visual stimuli of courtyards and their psychological effects.
Visual StimuliDescriptionPsychological EffectBand Associated
Greenery (vegetation, trees, and shrubs)High green coverage (GVI 30–90%)Pleasure; relaxation; stress reductionAlpha, Beta, and Theta
Water elements (fountains and ponds)Presence of blue spaces (BSs)Happiness; openness; reduced anxietyGamma and Beta
Comfortable seating and shadeEncourages social interaction and restSense of belonging; mental restorationAlpha Theta
Natural lightingOptimized through courtyard shape and orientationReduced mental fatigue; improved focusAlpha and Beta
Color variation and naturalnessBrightness, rhythm, and order in landscape designRelaxationAlpha
Landscape diversity (lawn, forest, and horticulture)Mixed natural elementsAlleviation of anxiety and depressionAlpha and Beta
Landmark featuresVisual cues providing feelings of safety Cognitive wayfinding and navigationTheta
Source: [10,13,40,42].
Table 5. Participant profiles.
IDGenderExperienceSensitivityTheta Band Alpha Band Beta Band Gamma Band
P1FemaleUnfamiliar with courtyard; no EEG experienceModerateStableRandom decreases (disengagement)Sporadic-to-intense increases (attention peaks)Stable
P2FemaleUnfamiliar with courtyard; no EEG experienceHighOccasional decreases (disengagement)Rare increases (mild alertness)StableStable
P3FemaleUnfamiliar with courtyard; no EEG experienceLowSporadic increases (enhanced relaxation)StableSporadic decreases (reduced focus)Frequent decreases; slight increases
P4FemaleUnfamiliar with courtyard; no EEG experienceModerateStableRandom decreases (disengagement)Sporadic-to-intense increases (attention peaks)Occasional increases (cognitive engagement)
P5FemaleUnfamiliar with courtyard; no EEG experienceHighOccasional decreases (disengagement)Rare increases (mild alertness)StableStable
P6FemaleUnfamiliar with courtyard; no EEG experienceLowOccasional decreases (disengagement)StableSporadic decreases (reduced focus)Frequent decreases; slight increases
P7FemaleUnfamiliar with courtyard; no EEG experienceModerateStableRandom decreases (disengagement)Sporadic-to-intense increases (attention peaks)Occasional increases (cognitive engagement)
P8FemaleUnfamiliar with courtyard; no EEG experienceHighMix of decreases and pronounced increases (relaxation)Rare increases (mild alertness)StableStable
P9FemaleUnfamiliar with courtyard; no EEG experienceLowSporadic increases (enhanced relaxation)StableSporadic decreases (reduced focus)Frequent decreases; slight increases
P10MaleUnfamiliar with courtyard; no EEG experienceModerateStableRandom decreases (disengagement)Sporadic-to-intense increases (attention peaks)Occasional increases (cognitive engagement)
P11MaleUnfamiliar with courtyard; no EEG experienceLowFrequent increases (large relaxation)Rare increases (mild alertness)StableStable
P12MaleUnfamiliar with courtyard; no EEG experienceHighFrequent increases (large relaxation)StableSporadic decreases (reduced focus)Frequent decreases; slight increases
P13MaleUnfamiliar with courtyard; no EEG experienceModerateFrequent increases (large relaxation)StableSporadic-to-intense increases (attention peaks)Occasional increases (cognitive engagement)
P14MaleUnfamiliar with courtyard; no EEG experienceHighOccasional decreases (disengagement)Frequent increases (increased engagement)StableStable
P15MaleUnfamiliar with courtyard; no EEG experienceLowFrequent increases (large relaxation)StableSporadic decreases (reduced focus)Predominantly stable
P16MaleUnfamiliar with courtyard; no EEG experienceModerateFrequent increases (large relaxation)Constant increases (significant engagement)Strong, frequent increases (heightened cognitive processing)Uniform, high increases (cognitive engagement)
Source: Authors.
Table 6. Band power analysis.
Band Power Analysis with Epoch-Based Power DistributionThetaLow AlphaHigh AlphaLow BetaHigh BetaLow GammaMid Gamma
Baseline Period (1 min)
Mean (%)23.08818.6016.78710.5837.4625.3742 3.7035
Stimulus Period (4 min)
Mean (%)26.35316.9413.1589.9938.2805.93774.3703
Change (Stimulus–Baseline)
Mean Δ (%)+3.265−1.666−3.630−0.59+0.810.56350.6667
Source: Authors, based on MATLAB code results.
Table 7. Band power analysis-adjusted epochs.
PeriodTheta (%)Low Alpha (%)High Alpha (%)Low Beta (%)High Beta (%)Low Gamma (%)Mid Gamma (%)
Baseline (1 Min)23.08818.60716.78710.5837.46185.37423.7035
Stimulus (70–240s)26.45516.90513.0869.99428.2435.92484.4565
Change (Δ)+3.3673−1.7014−3.7016−0.58925+0.78115+0.55065+0.75305
Source: Authors, using Matlab code.
Table 8. Design recommendations derived from EEG-based analyses of enclosed courtyard environments.
Design AspectSpace FeaturesEEG ImplicationsDesign Recommendations
Enclosure degree Enclosed courtyard with visible skyEnhances Theta activity (linked to psychological restoration)Avoid overly wide/open courtyards to preserve a sense of containment and refuge.
(Height-to-width proportion)approx. 1:1 (15 m height/~15 m width)
-
Maintain H/W ratios between 0.8 and 1.2 to preserve a sense of containment while allowing openness.
-
For smaller courtyards (<20 m width), ensure vertical elements (facades, trellises, and pergolas) maintain perceived enclosure.
-
Avoid widths exceeding 1.5× height, as this reduces restorative benefits
Vegetation-to-hardscape ratio~35% vegetation/65% hardscapeSufficient to induce Theta enhancement while supporting mild cognitive engagement
-
Maintain minimum 30–40% vegetation coverage.
-
Use multi-layered planting: canopy trees (6–8 m height), shrubs (1–2 m height), and ground covers.
-
Canopy coverage target: 20–25% of courtyard area.
-
Select species with seasonal foliage variation for visual interest.
-
Ensure permeable paving in at least 40% of hardscape to support microclimate.
Spatial configuration and furniture placementLinear layout with central walkway and benches along vegetation zonesSeating near vegetation and enclosed edges aligns with increased Theta activity
-
Place seating 1–2 m from vegetation for optimal visual and sensory engagement.
-
Orient seating toward natural focal points (trees and water features) rather than blank walls.
-
Use natural materials (timber and stone) for seating surfaces.
-
Avoid clustering benches in sterile or fully paved areas.
Acoustic and sensory designSubtle natural stimuli (leaf rustling and wind)Mild cognitive activation and sensory engagement: Alpha suppression, low Gamma near to significance, and restoration (Theta increase)
-
Preserve natural soundscapes by maintaining vegetation corridors.
Familiarity vs. FascinationSlightly unfamiliar courtyard layout with distinctive planting designNovelty triggers involuntary attention (Alpha modulation)
-
Incorporate at least one unique spatial element.
-
Limit direct axial sightlines to external streets to maintain immersion.
-
Avoid overuse of standard geometric plaza layouts.
Seasonal and climatic considerationsComfortable microclimate at 22–26 °C, clear daysThermal comfort likely enhances restoration
-
Provide shade for at least 50% of seating areas during peak sun hours via canopy trees or tensile structures.
-
Use deciduous trees for seasonal variation and passive temperature regulation.
-
Include seasonal flowering plants for continuous visual stimulation.
Source: Authors.
Disclaimer/Publisher’s Note: The statements, opinions and data contained in all publications are solely those of the individual author(s) and contributor(s) and not of MDPI and/or the editor(s). MDPI and/or the editor(s) disclaim responsibility for any injury to people or property resulting from any ideas, methods, instructions or products referred to in the content.