
Youth Engagement in Water Quality Monitoring: Uncovering Ecosystem Benefits and Challenges


Abstract
1. Introduction
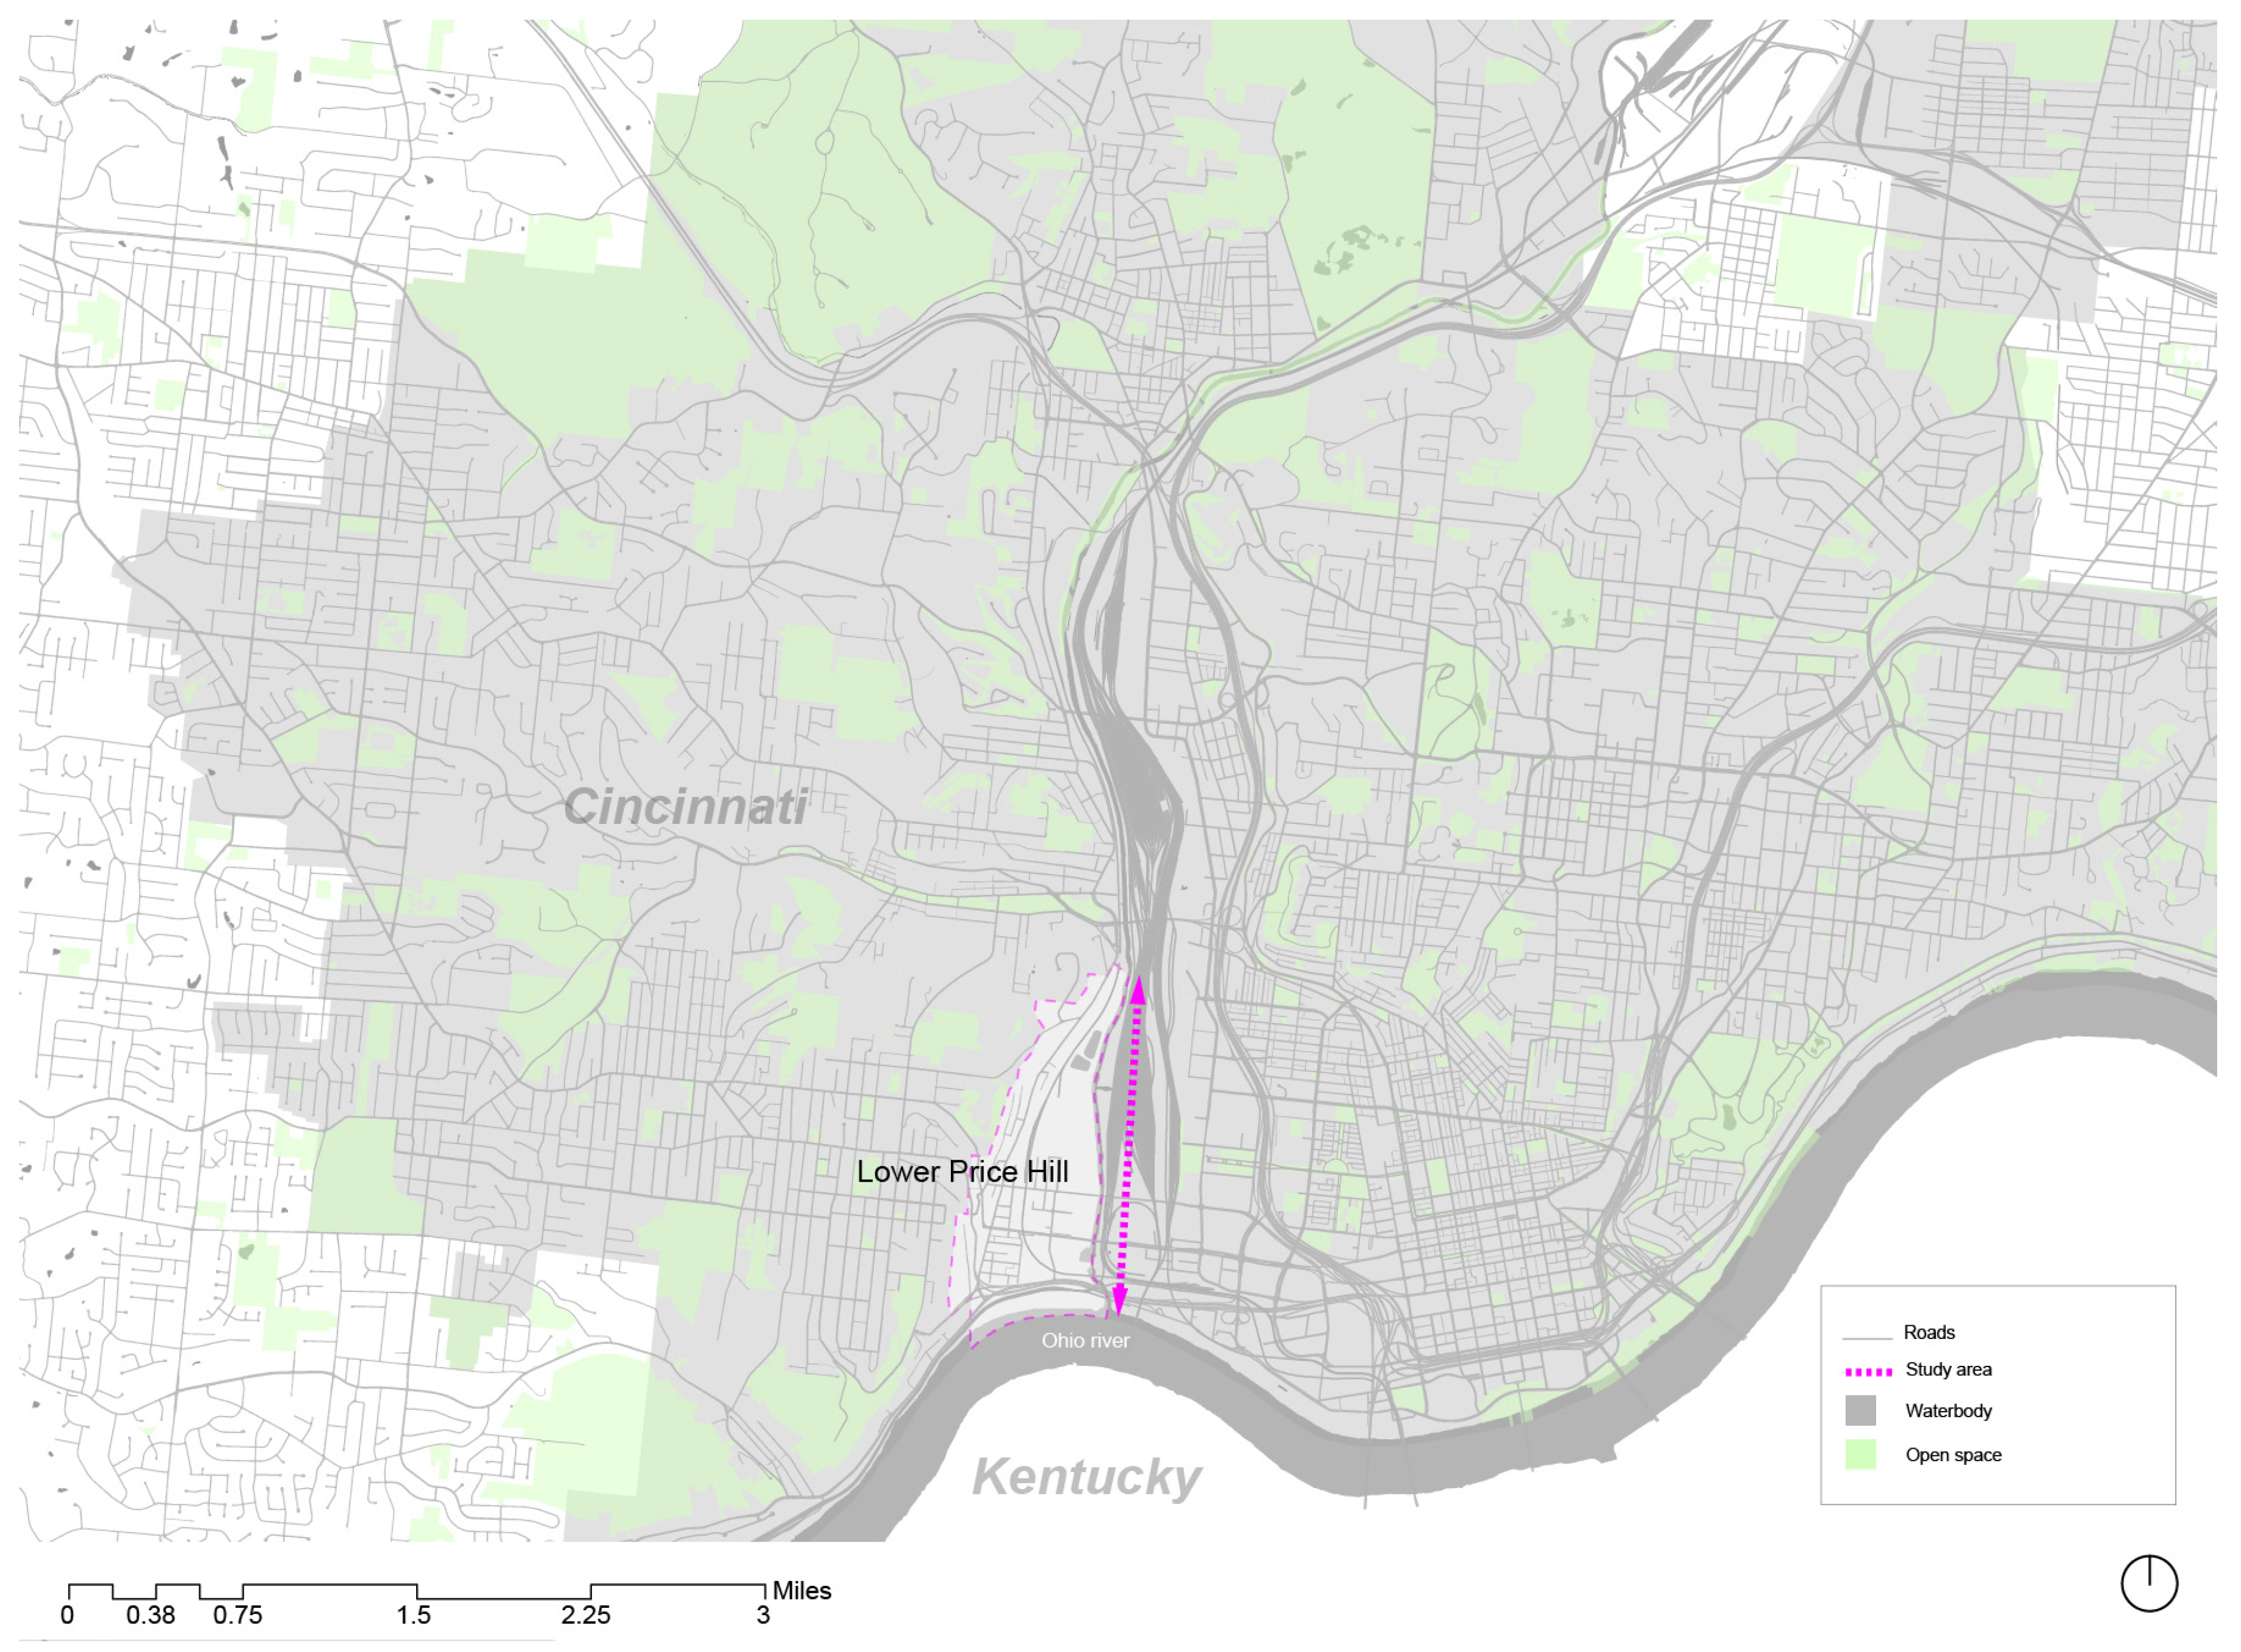
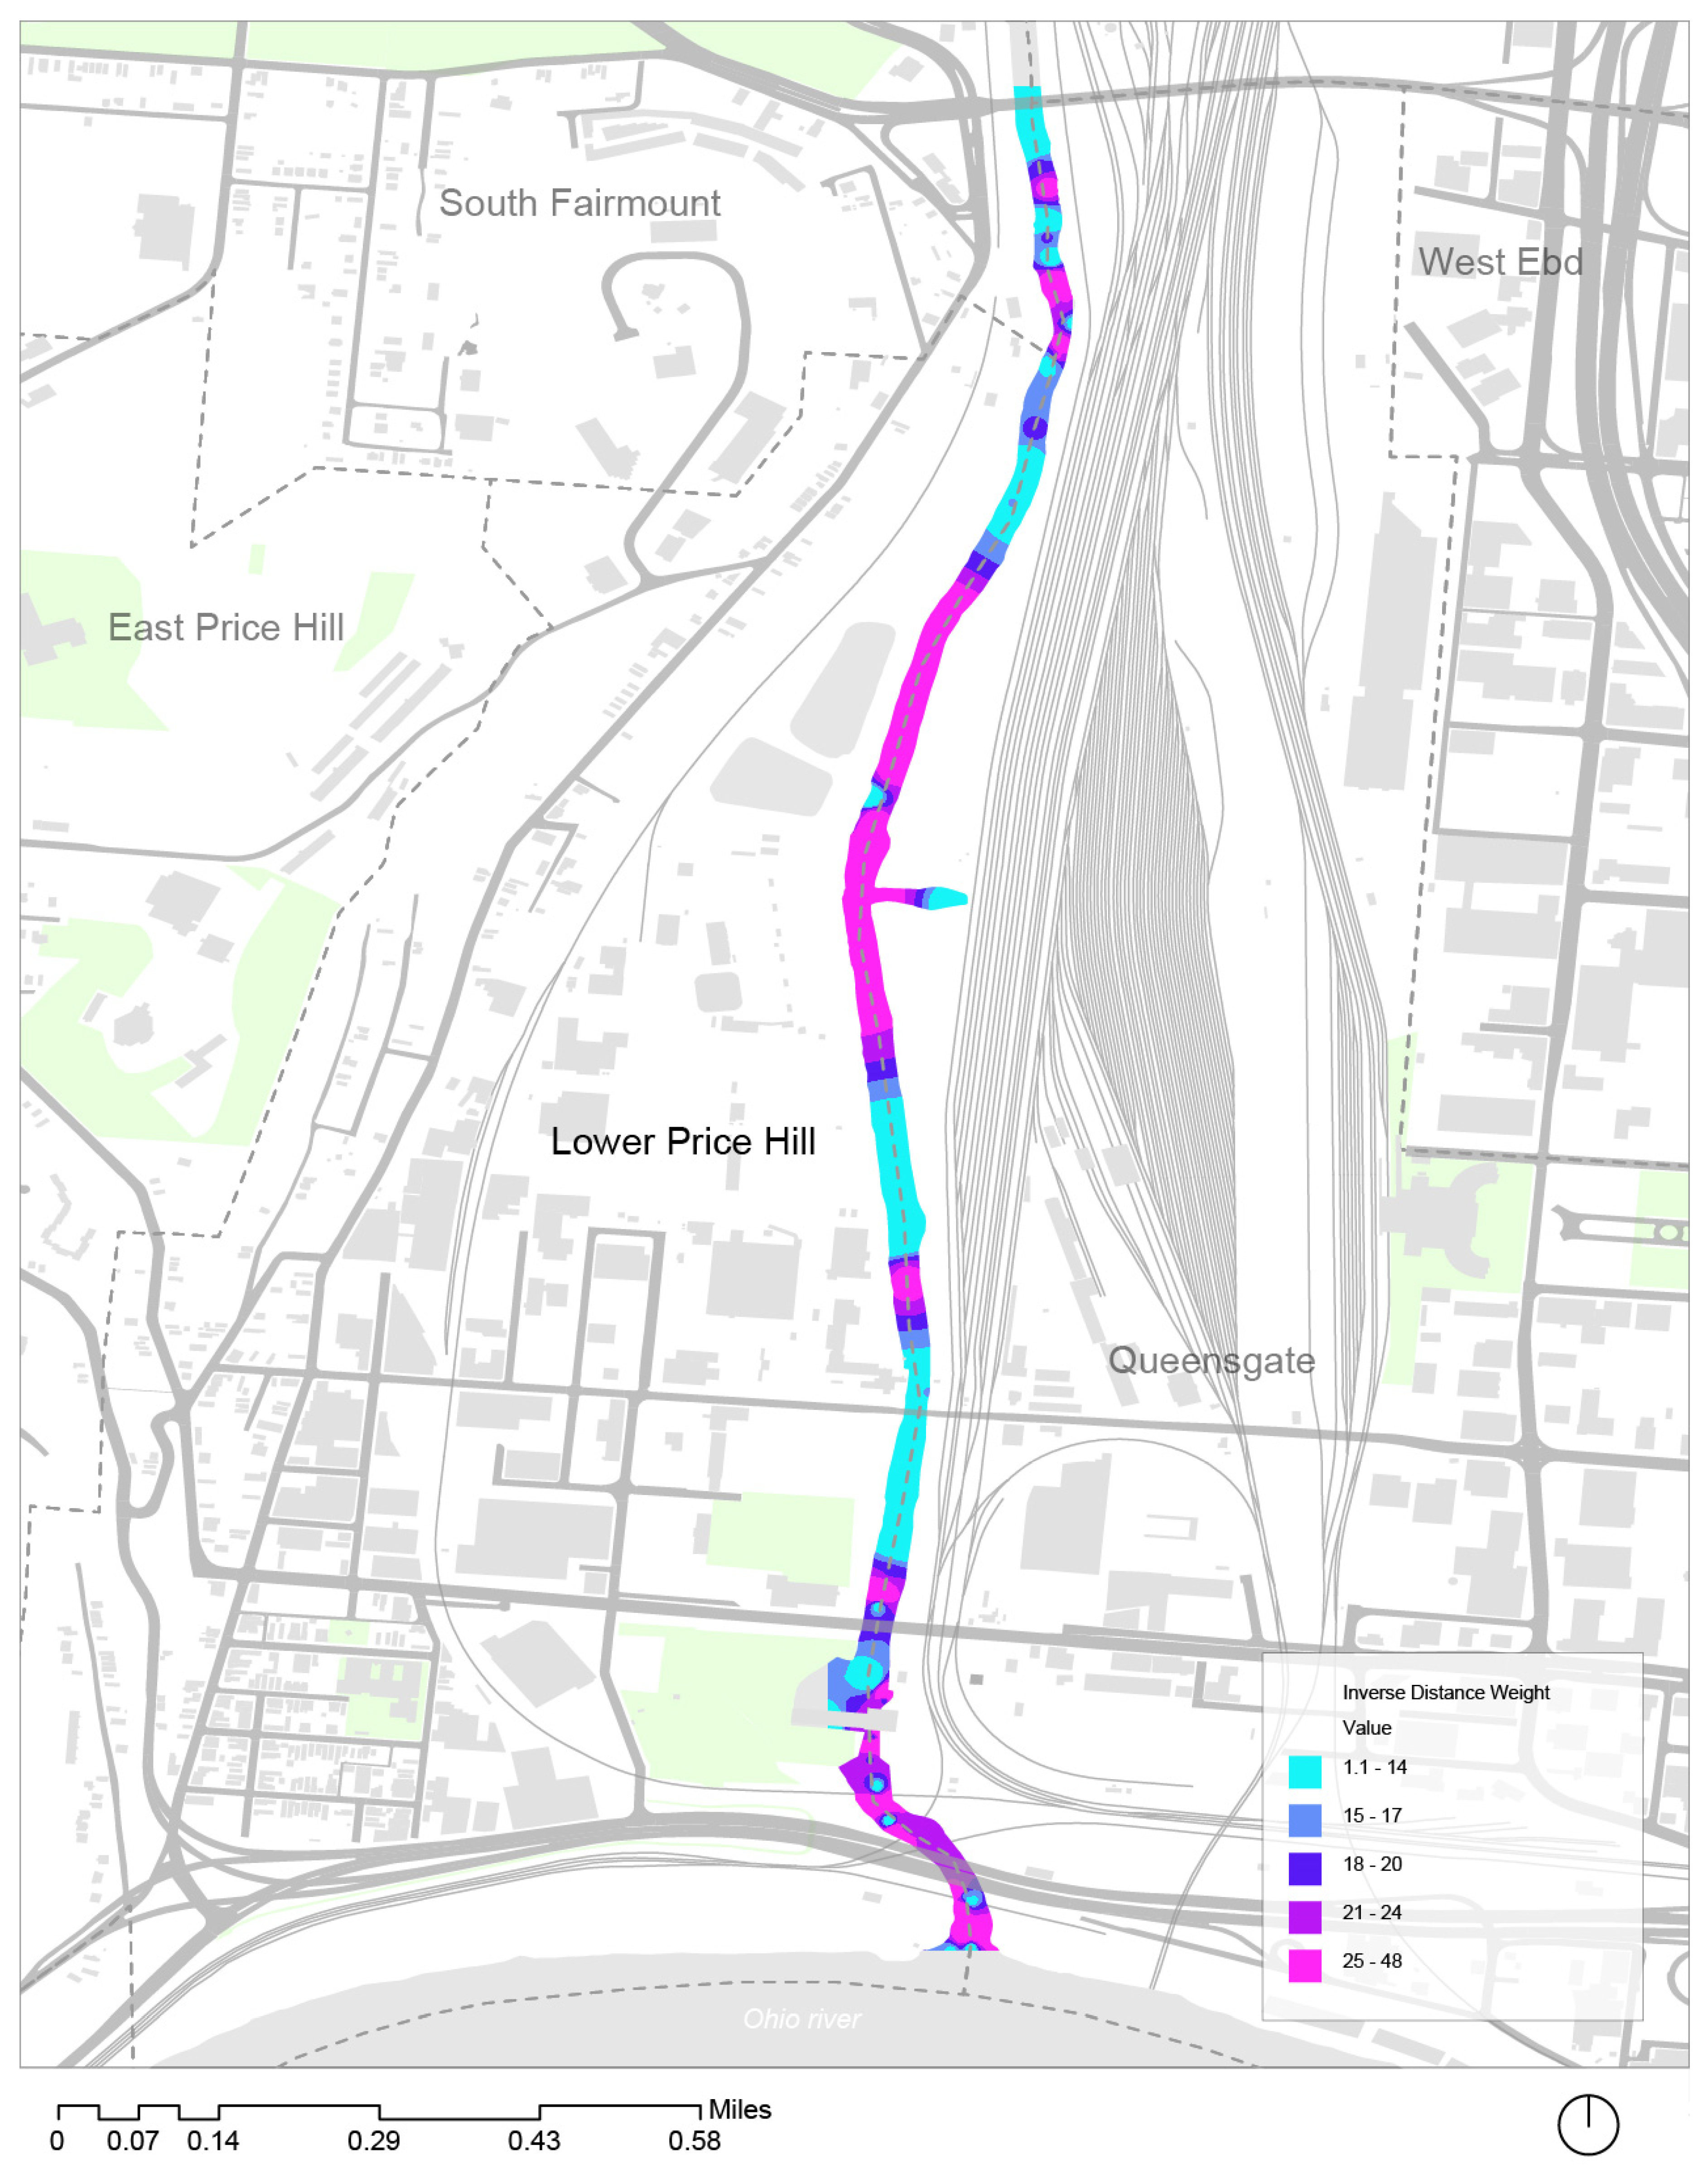
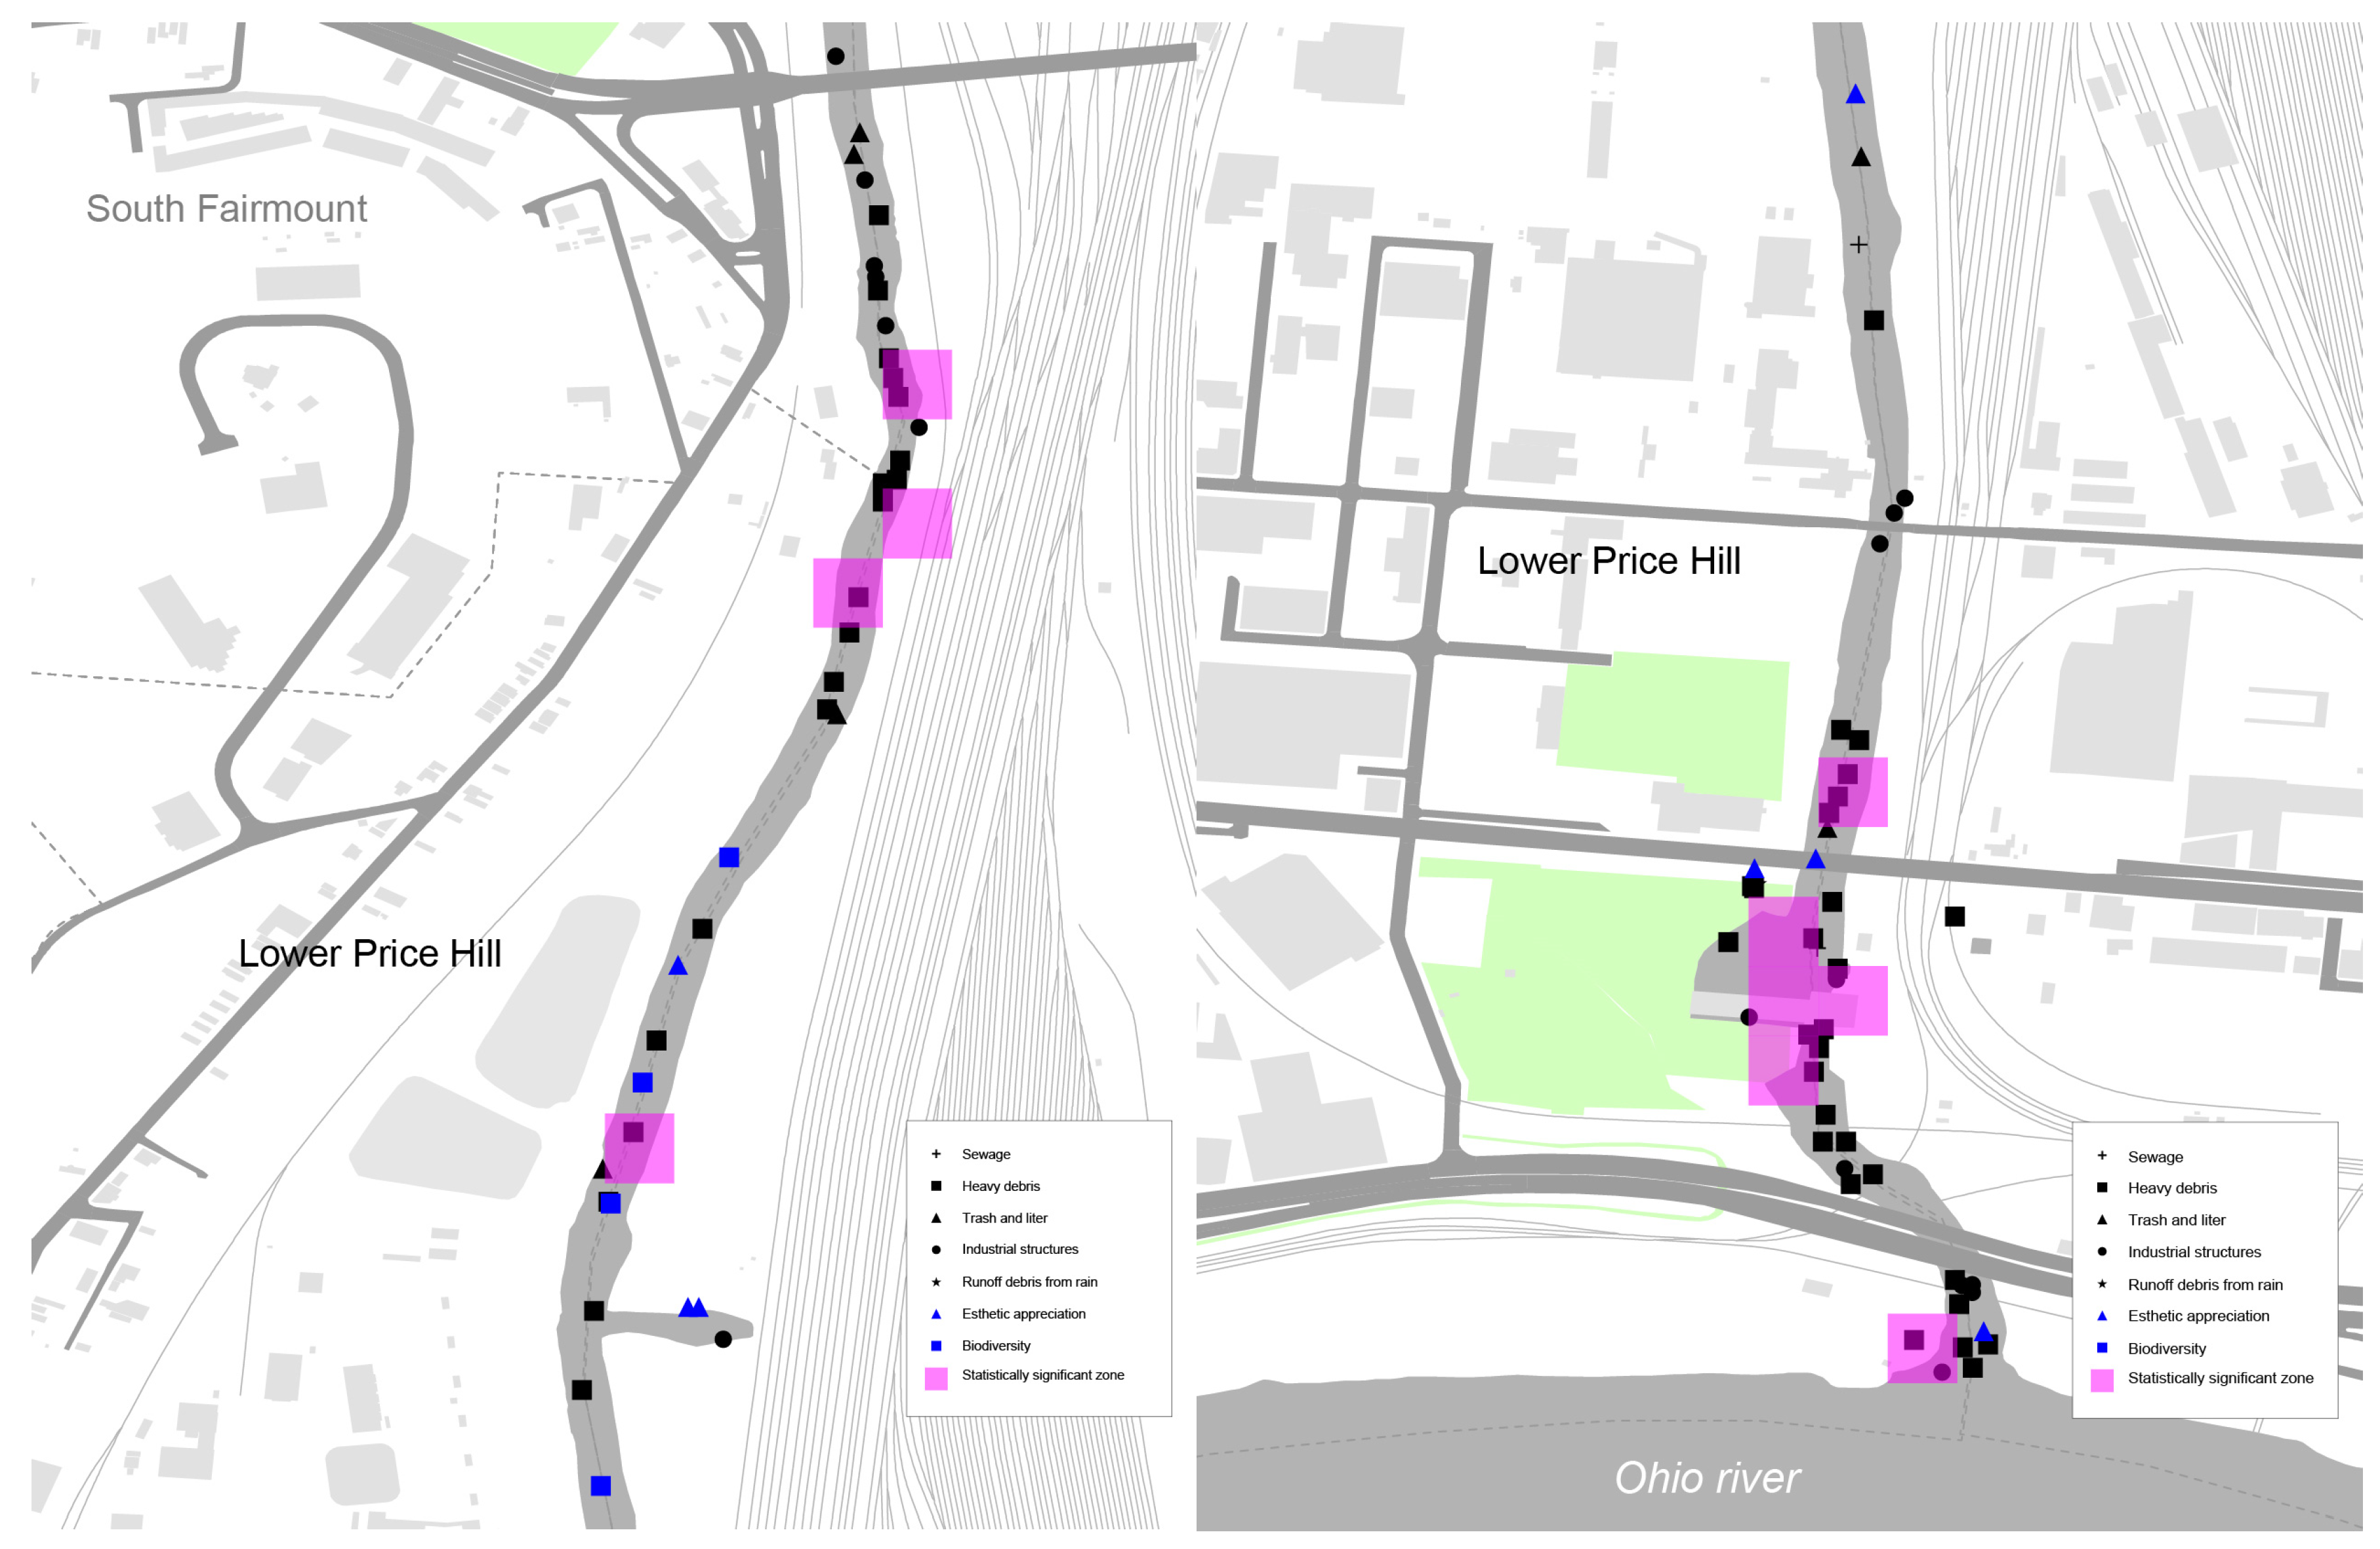
2. Study Area
3. Materials and Methods
3.1. Civic and Academic Partnership
3.2. Participant Recruitment and Inclusion Criteria
3.3. Survey Tool Development
3.4. Data Collection
3.5. Data Analysis
4. Results
5. Discussion
6. Limitations
7. Conclusions
Author Contributions
Funding
Institutional Review Board Statement
Informed Consent Statement
Data Availability Statement
Conflicts of Interest
References
- Müller, A.; Österlund, H.; Marsalek, J.; Viklander, M. The pollution conveyed by urban runoff: A review of sources. Sci. Total Environ. 2020, 709, 136125. [Google Scholar] [CrossRef] [PubMed]
- Estrada-Rivera, A.; Fonseca, A.D.; Mora, S.T.; Suastegui, W.A.G.; Bravo, E.C.; Vega, R.C.; Perales, J.L.M.; Handal-Silva, A. The Impact of Urbanization on Water Quality: Case Study on the Alto Atoyac Basin in Puebla, Mexico. Sustainability 2022, 14, 667. [Google Scholar] [CrossRef]
- Bae, S.; Choi, J.; Kim, G.; Song, S.; Ha, M.; Kwon, H. Evaluation of the Exposure to Environmental Pollutants Emanating from National Industrial Complexes. Environ. Health Toxicol. 2018, 33, e2018007. [Google Scholar] [CrossRef] [PubMed]
- Sing, T.F.; Wang, W.; Zhan, C. Tracking industry pollution sources and health risks in China. Sci. Rep. 2023, 13, 22232. [Google Scholar] [CrossRef] [PubMed]
- Brandt, H.; de Groot, P. Aqueous leaching of polycyclic aromatic hydrocarbons from bitumen and asphalt. Water Res. 2001, 35, 4200–4207. [Google Scholar] [CrossRef]
- Legret, M.; Odie, L.; Demare, D.; Jullien, A. Leaching of heavy metals and polycyclic aromatic hydrocarbons from reclaimed asphalt pavement. Water Res. 2005, 39, 3675–3685. [Google Scholar] [CrossRef]
- Gromaire, M.; Garnaud, S.; Saad, M.; Chebbo, G. Contribution of different sources to the pollution of wet weather flows in combined sewers. Water Res. 2001, 35, 521–533. [Google Scholar] [CrossRef]
- Yang, Y.-Y.; Toor, G.S. Stormwater runoff driven phosphorus transport in an urban residential catchment: Implications for protecting water quality in urban watersheds. Sci. Rep. 2018, 8, 11681. [Google Scholar] [CrossRef]
- Gasperi, J.; Garnaud, S.; Rocher, V.; Moilleron, R. Priority pollutants in wastewater and combined sewer overflow. Sci. Total Environ. 2008, 407, 263–272. [Google Scholar] [CrossRef]
- Casadio, A.; Maglionico, M.; Bolognesi, A.; Artina, S. Toxicity and pollutant impact analysis in an urban river due to combined sewer overflows loads. Water Sci. Technol. 2010, 61, 207–215. [Google Scholar] [CrossRef]
- Millennium Ecosystem Assessment. Ecosystems and Human Well-Being: Wetlands and Water Synthesis; World Resources Institute: Washington, DC, USA, 2005. [Google Scholar]
- Grizzetti, B.; Liquete, C.; Pistocchi, A.; Vigiak, O.; Zulian, G.; Bouraoui, F.; De Roo, A.; Cardoso, A.C. Relationship between ecological condition and ecosystem services in European rivers, lakes and coastal waters. Sci. Total Environ. 2019, 671, 452–465. [Google Scholar] [CrossRef] [PubMed]
- Capdevila, A.S.L.; Kokimova, A.; Ray, S.S.; Avellán, T.; Kim, J.; Kirschke, S. Success factors for citizen science projects in water quality monitoring. Sci. Total Environ. 2020, 728, 137843. [Google Scholar] [CrossRef] [PubMed]
- Ramírez, S.B.; van Meerveld, I.; Seibert, J. Citizen science approaches for water quality measurements. Sci. Total Environ. 2023, 897, 165436. [Google Scholar] [CrossRef] [PubMed]
- Harmel, R.D.; Preisendanz, H.E.; King, K.W.; Busch, D.; Birgand, F.; Sahoo, D. A Review of Data Quality and Cost Considerations for Water Quality Monitoring at the Field Scale and in Small Watersheds. Water 2023, 15, 3110. [Google Scholar] [CrossRef]
- Pradhananga, A.K.; Davenport, M.A. Community attachment, beliefs and residents’ civic engagement in stormwater management. Landsc. Urban Plan. 2017, 168, 1–8. [Google Scholar] [CrossRef]
- Ardoin, N.M.; Bowers, A.W.; Gaillard, E. Environmental education outcomes for conservation: A systematic review. Biol. Conserv. 2020, 241, 108224. [Google Scholar] [CrossRef]
- Johnson, N.; Ravnborg, H.M.; Westermann, O.; Probst, K. User participation in watershed management and research. Water Policy 2002, 3, 507–520. [Google Scholar] [CrossRef]
- Bey, G. Report on the NOAA Office of Education Environmental Literacy Program Community Resilience Education Theory of Change; Oceanic and Atmospheric Administration: Washington, DC, USA, 2020. [CrossRef]
- Cele, S.; van der Burgt, D. Participation, consultation, confusion: Professionals’ understandings of children’s participation in physical planning. Child. Geogr. 2015, 13, 14–29. [Google Scholar] [CrossRef]
- Vojno, N.; ter Horst, R.; Hussein, H.; Nolden, T.; Badawy, A.; Goubert, A.; Sharipova, B.; Pedrero, F.; Peters, S.; Damkjaer, S. Beyond barriers: The fluid roles young people adopt in water conflict and cooperation. Water Int. 2022, 47, 480–505. [Google Scholar] [CrossRef]
- Anderson, K.M.; Morgan, K.Y.; McCormick, M.L.; Robbins, N.N.; Curry-Johnson, S.E.; Christens, B.D. Participatory Mapping of Holistic Youth Well-Being: A Mixed Methods Study. Sustainability 2024, 16, 1559. [Google Scholar] [CrossRef]
- King, A.C.; Odunitan-Wayas, F.A.; Chaudhury, M.; Rubio, M.A.; Baiocchi, M.; Kolbe-Alexander, T.; Montes, F.; Banchoff, A.; Sarmiento, O.L.; Bälter, K.; et al. Community-Based Approaches to Reducing Health Inequities and Fostering Environmental Justice through Global Youth-Engaged Citizen Science. Int. J. Environ. Res. Public Health 2021, 18, 892. [Google Scholar] [CrossRef] [PubMed]
- Head, B.W. Why not ask them? Mapping and promoting youth participation. Child. Youth Serv. Rev. 2011, 33, 541–547. [Google Scholar] [CrossRef]
- Kober, A.S. Urban River Revival: Celebrating Ohio’s Mill Creek. American Rivers. 7 September 2017. Available online: https://www.americanrivers.org/2017/09/urban-river-revival-celebrating-ohios-mill-creek/ (accessed on 10 May 2024).
- Cincinnati Climate Equity Indicators. Available online: https://www.cincinnati-oh.gov/oes/equity1/climate-equity-indicators/ (accessed on 10 May 2024).
- Jelks, N.O.; Hawthorne, T.L.; Dai, D.; Fuller, C.H.; Stauber, C. Mapping the Hidden Hazards: Community-Led Spatial Data Collection of Street-Level Environmental Stressors in a Degraded, Urban Watershed. Int. J. Environ. Res. Public Health 2018, 15, 825. [Google Scholar] [CrossRef] [PubMed]
- Jelks, N.O.; Smith-Perry, D.J.; Fuller, C.H.; Stauber, C. Participatory research in Northwest Atlanta’s Proctor Creek Watershed: Using photovoice to explore environmental health risks at the water’s edge. Health Place 2020, 66, 102444. [Google Scholar] [CrossRef] [PubMed]
- McGoff, E.; Dunn, F.; Cachazo, L.M.; Williams, P.; Biggs, J.; Nicolet, P.; Ewald, N.C. Finding clean water habitats in urban landscapes: Professional researcher vs. citizen science approaches. Sci. Total Environ. 2017, 581–582, 105–116. [Google Scholar] [CrossRef]
- Hegarty, S.; Hayes, A.; Regan, F.; Bishop, I.; Clinton, R. Using citizen science to understand river water quality while filling data gaps to meet United Nations Sustainable Development Goal 6 objectives. Sci. Total Environ. 2021, 783, 146953. [Google Scholar] [CrossRef]
- Canoes & Conservation Projects. Green Mic Podcast. July 2023. Available online: https://open.spotify.com/show/4huhCxk5JX8D3tQYjRJnjt (accessed on 8 October 2024).


| Variable | Percent Response | Mean (Ranking Results) | Std. Dev |
|---|---|---|---|
| Perception of Ecosystem Services Esthetic (appreciation of attractive natural features) | 0.07% (7) | 2.7 | 0.49 |
| Plants and wildlife (plant and wildlife diversity) | 0.05% (5) | 2.6 | 0.55 |
| Urban Water Quality Challenges Heavy debris (tires, heavy items that someone most likely had to put directly into the creek) | 47% (47) | 1.68 | 0.84 |
| Industrial building, structures, abandoned structures | 19% (19) | 2.2 | 0.71 |
| Runoff debris from rain | 1% (2) | 2 | |
| Sewage and floatable solids | 2% (2) | 2 | 1.41 |
| Non-point-source pollution (bottles, cans, potato chip bags, etc.) | 6% (6) | 2 | 0.63 |
Disclaimer/Publisher’s Note: The statements, opinions and data contained in all publications are solely those of the individual author(s) and contributor(s) and not of MDPI and/or the editor(s). MDPI and/or the editor(s) disclaim responsibility for any injury to people or property resulting from any ideas, methods, instructions or products referred to in the content. |
© 2024 by the authors. Licensee MDPI, Basel, Switzerland. This article is an open access article distributed under the terms and conditions of the Creative Commons Attribution (CC BY) license (https://creativecommons.org/licenses/by/4.0/).
Share and Cite
Cho, S.; Hollstein, L.; Aguilar, L.; Dwyer, J.; Auffrey, C. Youth Engagement in Water Quality Monitoring: Uncovering Ecosystem Benefits and Challenges. Architecture 2024, 4, 1008-1019. https://doi.org/10.3390/architecture4040053
Cho S, Hollstein L, Aguilar L, Dwyer J, Auffrey C. Youth Engagement in Water Quality Monitoring: Uncovering Ecosystem Benefits and Challenges. Architecture. 2024; 4(4):1008-1019. https://doi.org/10.3390/architecture4040053
Chicago/Turabian StyleCho, Sangyong, Leah Hollstein, Luis Aguilar, Johnny Dwyer, and Christopher Auffrey. 2024. "Youth Engagement in Water Quality Monitoring: Uncovering Ecosystem Benefits and Challenges" Architecture 4, no. 4: 1008-1019. https://doi.org/10.3390/architecture4040053
APA StyleCho, S., Hollstein, L., Aguilar, L., Dwyer, J., & Auffrey, C. (2024). Youth Engagement in Water Quality Monitoring: Uncovering Ecosystem Benefits and Challenges. Architecture, 4(4), 1008-1019. https://doi.org/10.3390/architecture4040053